Embed Size (px)
Citation preview

INTERIM REPORT FIRST QUARTER 2016 Solna, April 25, 2016
1
REPORT ON THE FIRST QUARTER 2016
FIRST QUARTER
Net sales for the first quarter totaled SEK 2,999 million (2,875), an increase of 4%, of which 5% was organic growth.
Operating profit (EBIT) before items affecting comparability amounted to SEK 400 million (366), representing a margin of 13.3% (12.7%). Excluding the Medical division, which was divested in March 2015, the margin in Q1 2015 was 12%.
Operating cash flow totaled SEK -102 million (37).
The net result for the first quarter was SEK 295 million (161).
Earnings per share: SEK 1.00
FINANCIAL OVERVIEW (SUMMARY CONSOLIDATED FINANCIAL INFORMATION)
NET SALES (SEK MILLION)
OPERATING PROFIT (EBIT) BEFORE I.A.C. (SEK MILLION)
Q1 Q1 LTM FY
SEK million 2016 2015 2016 2015
Net sales 2,999 2,875 11,610 11,486
EBITDA 473 495 1,705 1,727
% of net sales 15.8% 17.2% 14.7% 15.0%
EBITDA before items affecting comparability 473 438 1,738 1,703
% of net sales 15.8% 15.3% 15.0% 14.8%
Operating profit (EBIT) 400 423 1,413 1,436
% of net sales 13.3% 14.7% 12.2% 12.5%
Operating profit (EBIT) before items affecting comparability 400 366 1,446 1,412
% of net sales 13.3% 12.7% 12.5% 12.3%
Net result 295 161 1,166 1,032
Earnings per share, SEK 1.00 – – 3.49
Operating cash flow⁽¹⁾ -102 37 1,251 1,390
Core working capital 2,675 2,467 2,675 2,104
Capital expenditure in fixed assets -53 -56 -237 -240
RoOC 33% 36% 33% 36%
⁽¹⁾Net cash flow from operations after investments in fixed assets and excluding income tax paid.
0
2,000
4,000
6,000
8,000
10,000
12,000
14,000
0
500
1,000
1,500
2,000
2,500
3,000
3,500
2014Q1
2014Q2
2014Q3
2014Q4
2015Q1
2015Q2
2015Q3
2015Q4
2016Q1
RTQ
Quarterly net sales Rolling 12-month net sales
0
200
400
600
800
1,000
1,200
1,400
1,600
0
100
200
300
400
500
600
2014Q1
2014Q2
2014Q3
2014Q4
2015Q1
2015Q2
2015Q3
2015Q4
2016Q1
RTQ
Quarterly EBIT Rolling 12-month EBIT

INTERIM REPORT FIRST QUARTER 2016 Solna, April 25, 2016
2
CEO’s Comments
IMPROVED MARGINS IN AMERICAS AND EMEA
In the first quarter we delivered organic sales growth of 5% and an improved underlying EBIT margin, from 12.0% to 13.3% (excluding Medical).
EMEA continues to lead the way with an overall strong performance in sales and margins. In Europe, we are experiencing full order books with our main customers and are also continuing to see good results from the cost program launched in 2015. RV, Marine and CPV all exhibited growth in both OEM and aftermarket.
Americas displayed decent growth mainly related to the RV business. The impact of synergies resulting from the integration of Atwood also contributed to the strengthened margins from 10.3% to 13.0%. Sales development was stable in Marine and down in CPVOEM, mainly as a result of a weakened truck market.
In APAC, we had a relatively strong development in sales and gross margins, while EBIT margins were negatively affected by increased SG&A, which is being addressed. The aftermarket business continues to be a key sales driver, with strong development primarily in Australia.
Our focus on cost efficiency remains an important profitability driver, and the margin improvement that we saw in seven of our eight businesses is a result of this. Going forward, we will continue to work with our strategic priorities for long-term growth and make improvements within both operations and brand management. A part of this is also to assess our portfolio. We are looking at acquisitions, divestments and other structural activities.
Globally the RV markets continue to show strong momentum, especially in Americas and Europe. We can conclude that the outlook for the RV market remains positive while the truck market, in particular the US, is under pressure.
In light of our current performance and conditions in our markets, we remain confident for the rest of 2016.
Roger Johansson President and CEO

INTERIM REPORT FIRST QUARTER 2016 Solna, April 25, 2016
3
FINANCIAL SUMMARY – FIRST QUARTER
Net sales in the three months ending March 31, 2016, totaled SEK 2,999 million, representing an increase of 4% compared with SEK 2,875 million in the same period last year. This is made up of 5% organic growth, -2% divestments and 1% currency translation.
Operating profit (EBIT) before i.a.c., totaling SEK 400 million in Q1 2016, displayed a 9% increase compared with SEK 366 million in Q1 2015. EBIT margin improved from 12.7% to 13.3% in Q1 2016. Q1 2015 contained SEK 28 million of EBIT from the Medical division which was divested in March 2015.
Items affecting comparability totaled SEK 0 million (57). In 2015 items affecting comparability consisted of the divestment of the Medical division and the SG&A efficiency program in EMEA.
Financial items amounted to a net expense of SEK 34 million (207), including SEK 30 million of interest on external bank loans (181) and SEK 2 million for amortization of capitalized long-term financing expenses (19). Other expense items amounted to SEK 2 million (7)
Taxes totaled SEK -71 million (-55), including current tax of SEK -55 million (-32) and deferred tax of SEK -16 million (-23). The total tax charge amounted to 19% of profit before tax (25%).
Net profit for the period totaled SEK 295 million
(161).
Earnings per share amounted to SEK 1.00.
Operating cash flow of SEK -102 million (37). The lower operating cash flow is mainly due to the phasing of trade payables.
Financial position The average interest on debt is at approximately 2.5% (6.5%). Leverage in Q1 2016 was 2.4 compared with 6.6 in Q1 2015. At year-end 2015, leverage was 2.4.
Events during the quarter. On March 1, 2016, Chialing Hsueh joined Dometic Group as President of the APAC region, replacing Tat Li, who is retiring.
Events after the quarter. On April 21, 2016, a class action complaint was filed in the United States District Court for the Northern District of California. Dometic’s opinion is that the allegations are without merits and intend to vigorously defend against them.
Q1 Q1 LTM FY
SEK million 2016 2015 Rep. Adj.⁽¹⁾ 2016 2015
Americas 1,440 1,350 7% 3% 5,627 5,538
EMEA 1,222 1,134 8% 8% 4,568 4,479
Asia Pacific 337 322 5% 7% 1,415 1,400
Medical division⁽²⁾ 0 69 - - 0 69
Total net sales 2,999 2,875 4% 3% 11,610 11,486
Americas 187 139 35% 29% 699 650
EMEA 143 127 12% 13% 415 400
Asia Pacific 70 72 -3% -4% 332 334
Medical division 0 28 - - 0 28
Total operating profit (EBIT)⁽³⁾ 400 366 9% 8% 1,446 1,412
Americas 13.0% 10.3% 12.4% 11.7%
EMEA 11.7% 11.2% 9.1% 8.9%
Asia Pacific 20.7% 22.5% 23.5% 23.9%
Medical division - 40.6% - 40.6%
Total operating profit % 13.3% 12.7% 12.5% 12.3%⁽¹⁾Represents change in comparable currency. ⁽²⁾Medical division was divested in Q1-2015. ⁽³⁾Before i.a.c.
Change (%)

INTERIM REPORT FIRST QUARTER 2016 Solna, April 25, 2016
4
AMERICAS
QUARTERLY NET SALES AND OPERATING PROFIT (EBIT)
Americas, which accounted for 48% of sales in Q1 2016, reported net sales of SEK 1,440 million. This represents a sales increase of 7%, of which 3% was organic and 4% related to currency translation.
Operating profit (EBIT) before i.a.c. of SEK 187 million was 35% higher than last year. EBIT margin improved from 10.3% to 13.0%.
Americas markets In the US, the volume of RV shipments from OEM manufacturers to dealers is continuing to grow. The past three months displayed 9% growth in volumes, and a year-to-date February volume of 67,445 units represents 11% growth compared to the same period last year.
The pleasure boat market is exhibiting mixed growth, with 40-60 ft cruisers up by 19%, while 31-40 ft cruisers are down and semi-custom yachts up to 100 ft are flat for the first two months of 2016 compared to last year.
Business highlights In Americas, Q1 sales to OEMs increased by 1% and aftermarket sales grew by 5%, in constant currency.
Sales in the RVOEM business increased due to market growth, but were to some extent offset by price pressure on certain product categories.
In the Marine OEM business, reported sales saw a decline in the quarter. However, excluding sales from Americas to customers in Asia Pacific that were transferred to the APAC region in the second half of 2015, the underlying development is flat year-over-year.
CPVOEM business sales declined in the quarter, mainly due to the slowdown in the Class 8 truck market.
Aftermarket sales increased mainly due to strong sales in the RV aftermarket, based on underlying market growth combined with new products.
NET SALES (SEK MILLION)
SALES SPLIT AM/OEM
Q1 Q1 LTM FY
SEK million 2016 2015 Rep. Adj.⁽¹⁾ 2016 2015
Net sales 1,440 1,350 7% 3% 5,627 5,538
Operating profit (EBIT)⁽²⁾ 187 139 35% 29% 699 650
⁽¹⁾Represents change in comparable currency. ⁽²⁾Before i.a.c
Change (%)
0
1,000
2,000
3,000
4,000
5,000
6,000
0
200
400
600
800
1,000
1,200
1,400
1,600
2014Q1
2014Q2
2014Q3
2014Q4
2015Q1
2015Q2
2015Q3
2015Q4
2016Q1
RTQ
Quarterly net sales
Rolling 12-month net sales
OEM77%
(77%)
AM23%
(23%)
INTERIM REPORT FIRST QUARTER 2016 Solna, April 25, 2016
5
EMEA
QUARTERLY NET SALES AND OPERATING PROFIT (EBIT)
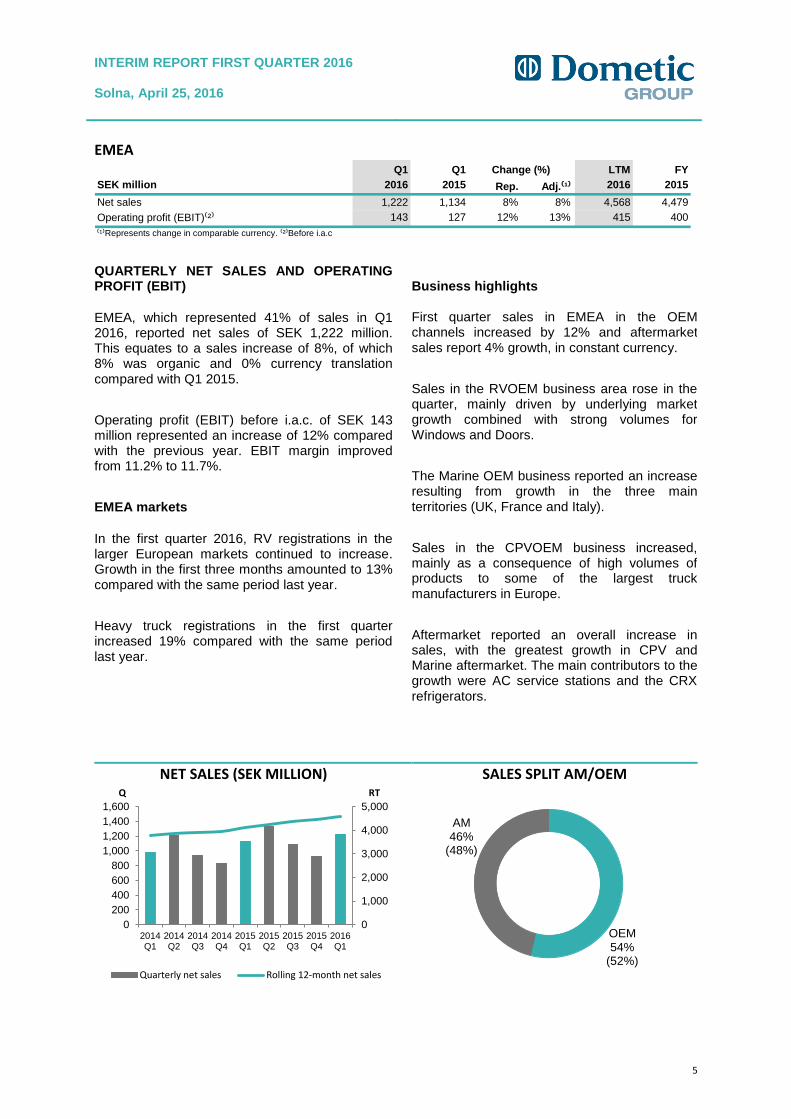
EMEA, which represented 41% of sales in Q1 2016, reported net sales of SEK 1,222 million. This equates to a sales increase of 8%, of which 8% was organic and 0% currency translation compared with Q1 2015.
Operating profit (EBIT) before i.a.c. of SEK 143 million represented an increase of 12% compared with the previous year. EBIT margin improved from 11.2% to 11.7%.
EMEA markets
In the first quarter 2016, RV registrations in the larger European markets continued to increase. Growth in the first three months amounted to 13% compared with the same period last year.
Heavy truck registrations in the first quarter increased 19% compared with the same period last year.
Business highlights First quarter sales in EMEA in the OEM channels increased by 12% and aftermarket sales report 4% growth, in constant currency.
Sales in the RVOEM business area rose in the quarter, mainly driven by underlying market growth combined with strong volumes for Windows and Doors.
The Marine OEM business reported an increase resulting from growth in the three main territories (UK, France and Italy).
Sales in the CPVOEM business increased, mainly as a consequence of high volumes of products to some of the largest truck manufacturers in Europe.
Aftermarket reported an overall increase in sales, with the greatest growth in CPV and Marine aftermarket. The main contributors to the growth were AC service stations and the CRX refrigerators.
NET SALES (SEK MILLION)
SALES SPLIT AM/OEM
Q1 Q1 LTM FY
SEK million 2016 2015 Rep. Adj.⁽¹⁾ 2016 2015
Net sales 1,222 1,134 8% 8% 4,568 4,479
Operating profit (EBIT)⁽²⁾ 143 127 12% 13% 415 400
⁽¹⁾Represents change in comparable currency. ⁽²⁾Before i.a.c
Change (%)
0
1,000
2,000
3,000
4,000
5,000
0
200
400
600
800
1,000
1,200
1,400
1,600
2014Q1
2014Q2
2014Q3
2014Q4
2015Q1
2015Q2
2015Q3
2015Q4
2016Q1
RTQ
Quarterly net sales Rolling 12-month net sales
OEM54%
(52%)
AM46%
(48%)
INTERIM REPORT FIRST QUARTER 2016 Solna, April 25, 2016
6
APAC - Asia Pacific
QUARTERLY NET SALES AND OPERATING PROFIT (EBIT)
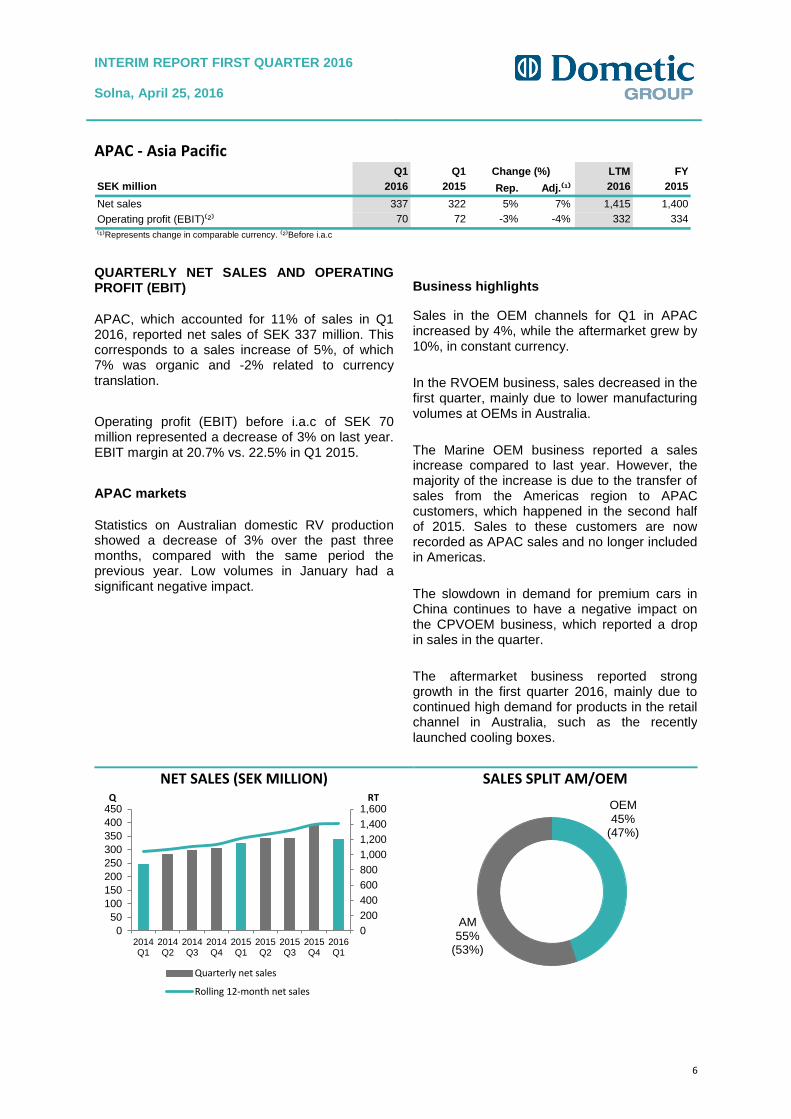
APAC, which accounted for 11% of sales in Q1 2016, reported net sales of SEK 337 million. This corresponds to a sales increase of 5%, of which 7% was organic and -2% related to currency translation.
Operating profit (EBIT) before i.a.c of SEK 70 million represented a decrease of 3% on last year. EBIT margin at 20.7% vs. 22.5% in Q1 2015.
APAC markets
Statistics on Australian domestic RV production showed a decrease of 3% over the past three months, compared with the same period the previous year. Low volumes in January had a significant negative impact.
Business highlights
Sales in the OEM channels for Q1 in APAC increased by 4%, while the aftermarket grew by 10%, in constant currency.
In the RVOEM business, sales decreased in the first quarter, mainly due to lower manufacturing volumes at OEMs in Australia.
The Marine OEM business reported a sales increase compared to last year. However, the majority of the increase is due to the transfer of sales from the Americas region to APAC customers, which happened in the second half of 2015. Sales to these customers are now recorded as APAC sales and no longer included in Americas.
The slowdown in demand for premium cars in China continues to have a negative impact on the CPVOEM business, which reported a drop in sales in the quarter.
The aftermarket business reported strong growth in the first quarter 2016, mainly due to continued high demand for products in the retail channel in Australia, such as the recently launched cooling boxes.
NET SALES (SEK MILLION)
SALES SPLIT AM/OEM
Q1 Q1 LTM FY
SEK million 2016 2015 Rep. Adj.⁽¹⁾ 2016 2015
Net sales 337 322 5% 7% 1,415 1,400
Operating profit (EBIT)⁽²⁾ 70 72 -3% -4% 332 334
⁽¹⁾Represents change in comparable currency. ⁽²⁾Before i.a.c
Change (%)
0
200
400
600
800
1,000
1,200
1,400
1,600
0
50
100
150
200
250
300
350
400
450
2014Q1
2014Q2
2014Q3
2014Q4
2015Q1
2015Q2
2015Q3
2015Q4
2016Q1
RTQ
Quarterly net sales
Rolling 12-month net sales
OEM45%
(47%)
AM55%
(53%)

INTERIM REPORT FIRST QUARTER 2016 Solna, April 25, 2016
7
PARENT COMPANY DOMETIC GROUP AB
The Parent Company Dometic Group AB comprises the functions of the Group’s head office, such as Group-wide management and administration. The Parent Company invoices its costs to Group companies.
For the first quarter 2016, the Parent Company Dometic Group AB had an operating profit of SEK 0 million (-1), including administrative expenses of SEK -27 million (-15) and other operating income of SEK 27 (14), of which the full amount relates to income from Group companies.
Income after financial items was SEK 23 million (4), including interest income from Group companies of SEK 3 million (70) and interest expenses to Group companies of SEK 0 million (-2). Net profit for the period amounted to SEK 22 million (3).
The income statement and balance sheet for the Parent Company are presented on page 12.
Solna, April 25, 2016
Roger Johansson
President and CEO
REPORT OF REVIEW OF INTERIM FINANCIAL INFORMATION
Introduction
We have reviewed the condensed interim financial information (interim report) of Dometic Group AB (publ.) as of March 31, 2016 and the three-month period then ended. The board of directors and the CEO are responsible for the preparation and presentation of the interim financial information in accordance with IAS 34 and the Swedish Annual Accounts Act. Our responsibility is to express a conclusion on this interim report based on our review.
Scope of Review
We conducted our review in accordance with the International Standard on Review Engagements ISRE 2410, Review of Interim Report Performed by the Independent Auditor of the Entity. A review consists of making inquiries, primarily of persons responsible for financial and accounting matters, and applying analytical and other review procedures. A review is substantially less in scope than an audit conducted in accordance with International Standards on Auditing, ISA, and other generally accepted auditing standards in Sweden. The procedures performed in a review do not enable us to obtain assurance that we would become aware of all significant matters that might be identified in an audit. Accordingly, we do not express an audit opinion.
Conclusion
Based on our review, nothing has come to our attention that causes us to believe that the interim report is not prepared, in all material respects, in accordance with IAS 34 and the Swedish Annual Accounts Act, regarding the Group, and with the Swedish Annual Accounts Act, regarding the Parent Company.
Stockholm, April 25, 2016
PricewaterhouseCoopers AB
Magnus Brändström
Authorized Public Accountant

INTERIM REPORT FIRST QUARTER 2016 Solna, April 25, 2016
8
QUARTERLY FINANCIAL STATEMENTS CONSOLIDATED INCOME STATEMENT
CONSOLIDATED STATEMENT OF COMPREHENSIVE INCOME
Q1 Q1 FY
SEK million 2016 2015 2015
Net sales 2,999 2,875 11,486
Cost of goods sold -2,088 -2,049 -8,127
Gross Profit 911 826 3,359
Sales expenses -371 -346 -1,433
Administrative expenses -138 -119 -510
Other operating income and expenses 15 22 64
Items affecting comparability 0 57 24
Amortization of customer relationship -17 -17 -68
Operating profit 400 423 1,436
Financial income 1 0 2
Financial expenses -35 -207 -1,104
Loss from financial items -34 -207 -1,102
Profit (loss) before income tax 366 216 334
Taxes -71 -55 698
Profit (loss) for the period 295 161 1,032
Profit (loss) for the period attributable to owners of the parent 295 161 1,032
Earnings per share before and after dilution effects, SEK - Owners of the
parent
1.00 – 3.49
Number of shares, million 295.8 – 295.8
Q1 Q1 FY
SEK million 2016 2015 2015
Profit (loss) for the period 295 161 1,032
Other comprehensive income
Items that will not be reclassified subsequently to profit or loss:
Remeasurements of defined benefit pension plans, net of tax -3 2 19
-3 2 19
Items that may be reclassified subsequently to profit or loss:
Cash flow hedges, net of tax -19 6 -18
Gains/losses from hedges of net investments in foreign operations, net
of tax -23 -161 -66
Exchange rate differences on translation of foreign operations -49 521 -9
-91 366 -93
Other comprehensive income for the period -94 368 -74
Total comprehensive income for the period 201 529 958
Total comprehensive income for the period attributable to owners of the
parent 201 529 958

INTERIM REPORT FIRST QUARTER 2016 Solna, April 25, 2016
9
QUARTERLY FINANCIAL STATEMENTS CONSOLIDATED BALANCE SHEET
SEK million Mar 31, 2016 Mar 31, 2015 Dec 31, 2015
Assets
Non-current assets
Intangible assets 12,877 13,512 12,965
Tangible assets 1,543 1,618 1,567
Deferred tax assets 1,085 164 1,092
Derivatives 15 87 34
Other non-current assets 46 46 46
Total non-current assets 15,566 15,427 15,704
Current assets
Inventories 2,337 2,240 2,199
Trade receivables 1,382 1,372 906
Receivables related parties – 22 –
Current tax assets 13 11 27
Other current assets 226 222 179
Prepaid expenses and accrued income 147 120 111
Cash and cash equivalents 413 1,025 833
Total current assets 4,518 5,012 4,255
TOTAL ASSETS 20,084 20,439 19,959
EQUITY 12,081 6,988 11,883
LIABILITIES
Non-current liabilities
Liabilities to credit institutions 4,222 9,790 4,353
Deferred tax liabilities 547 554 554
Provisions for pensions 480 510 476
Other provisions 108 142 74
Total non-current liabilities 5,357 10,996 5,457
Current liabilities
Liabilities to credit institutions 370 29 462
Trade payables 1,044 1,144 1,000
Current tax liabilities 217 195 207
Advance payments from customers 20 15 14
Derivatives 48 32 39
Other provisions 204 199 243
Other current liabilities 211 167 174
Accrued expenses and prepaid income 532 674 480
Total current liabilities 2,646 2,455 2,619
TOTAL EQUITY AND LIABILITIES 20,084 20,439 19,959

INTERIM REPORT FIRST QUARTER 2016 Solna, April 25, 2016
10
QUARTERLY FINANCIAL STATEMENTS CONSOLIDATED STATEMENT OF CHANGES IN EQUITY
SEK million Share capital
Other
reserves
Retained
earnings Total equity
Opening balance Jan 1, 2015 1 1,022 5,436 6,459
Profit (loss) for the period 161 161
Other comprehensive income
Remeasurements of defined benefit pension plans, net of tax 2 2
Cash flow hedges, net of tax 6 6
Gains/losses from hedges of net investments in foreign
operations, net of tax -161
-161
Exchange rate differences on translation of foreign operations 521 521
Total comprehensive income 368 161 529
Transactions with owners
Shareholders contribution – –
Total transactions with owners – –
Closing balance Mar 31, 2015 1 1,390 5,597 6,988
SEK million Share capital
Other
reserves
Retained
earnings Total equity
Opening balance Jan 1, 2016 1 1,004 10,878 11,883
Profit (loss) for the period 295 295
Other comprehensive income
Remeasurements of defined benefit pension plans, net of tax -3 -3
Cash flow hedges, net of tax -19 -19
Gains/losses from hedges of net investments in foreign
operations, net of tax -23 -23
Exchange rate differences on translation of foreign operations -49 -49
Total comprehensive income -91 292 201
Transactions with owners
Costs related to the shareholders contribution, net of tax -3 -3
Total transactions with owners -3 -3
Closing balance Mar 31, 2016 1 913 11,167 12,081
Attributable to owners of the parent
Attributable to owners of the parent
Linjal tabell helsida, 100% upplösning

INTERIM REPORT FIRST QUARTER 2016 Solna, April 25, 2016
11
QUARTERLY FINANCIAL STATEMENTS CONSOLIDATED CASH FLOW
Q1 Q1 FY
SEK million 2016 2015 2015
Cash flow from operations
Operating profit (EBIT) 400 423 1,436
Adjustment for other non-cash items
Depreciation and amortization 73 72 291
Adjustment for result from sale of subsidiaries – -87 -83
Adjustments for other non-cash items 11 -21 17
Changes in working capital
Changes in inventories -162 -165 -203
Changes in trade receivables -489 -466 -47
Changes in trade payables 127 338 180
Changes in other working capital -9 -1 39
Income tax paid -25 -4 -89
Net cash flow from operations -74 89 1,541
Cash flow from investments
Acquisition of operations – -8 -13
Investments in fixed assets -53 -56 -240
Proceeds from sale of fixed assets 1 1 1
Proceeds from sale of subsidiaries – 671 657
Other investing activities 0 1 0
Net cash flow from investments -52 609 405
Cash flow from financing
Shareholders contribution/Paid costs related to the shareholders
contribution -74 – 4,500
Borrowings from credit institutions – 11 4,827
Repayment of loans to credit institutions -193 -48 -10,110
Paid interest -2 -232 -847
Received interest 0 1 14
Other financing activities -20 -20 -92
Net cash flow from financing -289 -288 -1,708
Cash flow for the period -415 410 238
Cash and cash equivalents at beginning of period 833 592 592
Exchange differences on cash and cash equivalents -5 23 3
Cash and cash equivalents at end of period 413 1,025 833
Linjal tabell helsida, 100% upplösning

INTERIM REPORT FIRST QUARTER 2016 Solna, April 25, 2016
12
QUARTERLY FINANCIAL STATEMENTS PARENT COMPANY INCOME STATEMENT
PARENT COMPANY BALANCE SHEET
Q1 Q1 FY
SEK million 2016 2015 2015
Administrative expenses -27 -15 -54
Other operating income 27 14 48
Operating profit 0 -1 -6
Interest income subsidiaries 3 70 257
Interest expenses subsidiaries 0 -2 -7
Other financial income and expenses 20 -64 -365
Profit (loss) from financial items 23 4 -115
Group contributions – – 293
Profit (loss) before income tax 23 3 172
Taxes -1 – -36
Profit (loss) for the period 22 3 136
Linjal tabell helsida, 100% upplösning
SEK million Mar 31, 2016 Mar 31, 2015 Dec 31, 2015
ASSETS
Shares in subsidaries 13,563 6,983 13,563
Other non-current assets 10 2,920 9
Current assets 2,624 380 2,875
TOTAL ASSETS 16,197 10,284 16,447
EQUITY 11,601 6,984 11,583
LIABILITIES
Provisions 9 12 9
Non-current liabilities 4,222 3,065 4,353
Current liabilities 366 223 502
TOTAL EQUITY AND LIABILITIES 16,197 10,284 16,447
INTERIM REPORT FIRST QUARTER 2016 Solna, April 25, 2016
13
CONDENSED NOTES ASSOCIATED WITH QUARTERLY FINANCIAL STATEMENTS
NOTE 1 - ACCOUNTING PRINCIPLES
Dometic Group AB (publ) applies International Financial Reporting Standards (IFRS), as adopted by the EU. This consolidated Interim Financial Report has been prepared in accordance with IAS 34 ‘Interim Financial Reporting’. The Swedish Annual Accounts Act and RFR 2 Accounting for Legal Entities, issued by the Swedish Financial Reporting Board, have been applied for the Parent Company.
There are no changes to Dometic Group’s accounting and valuation principles compared with the accounting and valuation principles described in Notes 2 and 4 of the 2015 Annual Report.
For a detailed description of the accounting and valuation policies applied by the Group, see Notes 1, 2 and 4 of the 2015 Annual Report. The Annual Report is available at www.dometicgroup.com, under Investors.
Note 2 – RISKS AND UNCERTAINTIES
Dometic Group is a global company selling its products in almost 100 countries, and as such is exposed to a number of commercial and financial risks. Accordingly, risk management is an important process for Dometic Group in its efforts to achieve established targets.
Dometic Group is subject to transaction risks at the time of purchasing and selling, as well as when conducting financial transactions. Transaction exposure is primarily related to the currencies EUR, USD and AUD. As the majority of the Group’s profit is generated outside Sweden, the Group is also exposed to translational risks in all the major currencies.
Efficient risk management is a continual process conducted within the framework of business control, and is part of the ongoing review of operations and forward-looking assessment of operations.
In the preparation of financial reports, the Board of Directors and Group management are required to make estimates and judgments. These estimates and judgments impact the income statement and balance sheet, as well as the disclosures. The actual outcome may differ from these estimates and judgments under different circumstances and conditions.
Dometic Group’s future risk exposure is assumed not to deviate from the inherent exposure associated with Dometic Group’s ongoing business operations. For a more in-depth analysis of risks, please refer to Dometic Group’s 2015 Annual Report.
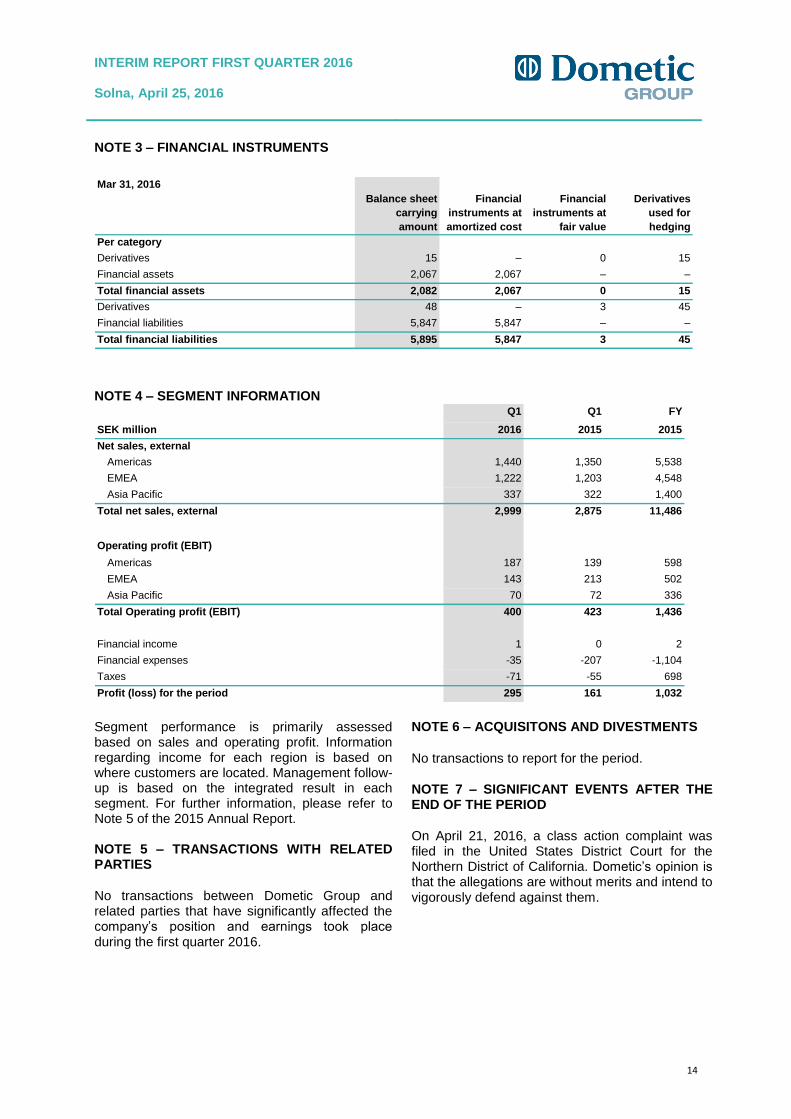
NOTE 3 – FINANCIAL INSTRUMENTS
Dometic Group uses interest rate swaps to hedge senior facility term loans to move from a floating interest rate to a fixed interest rate. The Group also uses currency forward agreements to hedge part of its cash flow exposure. Valuation principles and principles for hedge accounting, as described in Note 3 of the 2015 Annual Report have been applied throughout the reporting period.
The fair values of Dometic Group’s derivate assets and liabilities were SEK 15 million (Q1 2015: SEK 87 million) and SEK 48 million, (Q1 2015: SEK 32 million).
The value of derivatives is based on published prices in an active market. No transfers between levels of the fair value hierarchy have occurred during the period.
For financial assets and liabilities other than derivatives, fair value is assumed to be equal to the carrying amount.
INTERIM REPORT FIRST QUARTER 2016 Solna, April 25, 2016
14
NOTE 3 – FINANCIAL INSTRUMENTS
NOTE 4 – SEGMENT INFORMATION
Segment performance is primarily assessed based on sales and operating profit. Information regarding income for each region is based on where customers are located. Management follow-up is based on the integrated result in each segment. For further information, please refer to Note 5 of the 2015 Annual Report. NOTE 5 – TRANSACTIONS WITH RELATED PARTIES
No transactions between Dometic Group and related parties that have significantly affected the company’s position and earnings took place during the first quarter 2016.
NOTE 6 – ACQUISITONS AND DIVESTMENTS
No transactions to report for the period.
NOTE 7 – SIGNIFICANT EVENTS AFTER THE END OF THE PERIOD
On April 21, 2016, a class action complaint was filed in the United States District Court for the Northern District of California. Dometic’s opinion is that the allegations are without merits and intend to vigorously defend against them.
Mar 31, 2016
Balance sheet
carrying
amount
Financial
instruments at
amortized cost
Financial
instruments at
fair value
Derivatives
used for
hedging
Per category
Derivatives 15 – 0 15
Financial assets 2,067 2,067 – –
Total financial assets 2,082 2,067 0 15
Derivatives 48 – 3 45
Financial liabilities 5,847 5,847 – –
Total financial liabilities 5,895 5,847 3 45
Q1 Q1 FY
SEK million 2016 2015 2015
Net sales, external
Americas 1,440 1,350 5,538
EMEA 1,222 1,203 4,548
Asia Pacific 337 322 1,400
Total net sales, external 2,999 2,875 11,486
Operating profit (EBIT)
Americas 187 139 598
EMEA 143 213 502
Asia Pacific 70 72 336
Total Operating profit (EBIT) 400 423 1,436
Financial income 1 0 2
Financial expenses -35 -207 -1,104
Taxes -71 -55 698
Profit (loss) for the period 295 161 1,032
Linjal tabell helsida, 100% upplösning

INTERIM REPORT FIRST QUARTER 2016 Solna, April 25, 2016
15
DEFINITIONS
Operating profit (EBIT) Operating profit; earnings before financial items and taxes.
Operating profit (EBIT) margin Operating profit divided by net sales.
EBITDA Earnings before Interest, Taxes, Depreciation and Amortization.
EBITDA Margin EBITDA divided by net sales.
EPS – Earnings per share Net profit for the period divided by average number of shares. NOTE! Average number of shares equals actual number of shares as the company was listed on November 25, 2015.
Capital expenditure Expenses related to the purchase of tangible and intangible assets.
Core working capital Consists of inventories and trade receivables less trade payables.
Working capital Core working capital plus other current assets less other current liabilities and provisions relating to operations.
Operating capital Interest-bearing debt plus equity less cash and cash equivalents, excluding goodwill and trademarks.
Operating cash flow EBITDA +/- change in working capital excluding paid tax, after capital expenditure.
Organic growth Sales growth excluding acquisitions/divestments and currency translation effects. Quarters calculated at comparable currency, applying latest period average rate.
RoOC – Return on Operating Capital Operating profit (EBIT) divided by operating capital. Based on the operating profit (EBIT) for the four previous quarters, divided by the average operating capital for the previous four quarters, excluding goodwill and trademarks for the previous quarters.
I.A.C. – Items Affecting Comparability Represents income and expenses related to non-recurring events, occurring on an irregular basis and affecting comparability between the periods.
OCI Other comprehensive income.
RV Recreational Vehicles.
CPV Commercial and Passenger Vehicles.
OEM Original Equipment Manufacturers.
AM Aftermarket.
Q1 2016 January to March 2016 for Income Statement.
Q1 2015 January to March 2015 for Income Statement.
FY 2015 Financial Year ended December 31, 2015.

INTERIM REPORT FIRST QUARTER 2016 Solna, April 25, 2016
16
PRESENTATION OF THE INTERIM REPORT
Analysts and media are invited to participate in a telephone conference on April 25, 2016, at 10.00 (CET), during which President and CEO, Roger Johansson and CFO, Per-Arne Blomquist, will present the report and answer questions. To participate in the webcast/telephone conference, please dial in five minutes prior to the start of the conference call:
Sweden: + 46 8 566 426 92 UK: + 44 203 008 98 07 US: + 1 855 831 59 46
Webcast URL and presentation are available at www.dometicgroup.com FOR FURTHER INFORMATION, PLEASE CONTACT
Investor Relations Erika Ståhl Phone: +46 8 501 025 24
FINANCIAL CALENDAR
April 25, 2016 – Annual General Meeting
July 15, 2016 – Interim report, Q2 2016
October 31, 2016 – Interim report Q3 2016
ANNUAL GENERAL MEETING
The 2015 AGM will be held in Stockholm, Sweden, on April 25, 2016, at 13.00.
For further details regarding the AGM, please refer to www.dometicgroup.com
CONTACT DETAILS
Dometic Group AB (publ) Hemvärnsgatan 15 SE-171 54 Solna, Sweden Phone: +46 8 501 025 00 www.dometicgroup.com
Corporate registration number 556829-4390
ABOUT DOMETIC GROUP
Dometic is a global market leader in branded solutions for mobile living in the areas of Climate, Hygiene & Sanitation and Food & Beverage. Dometic operates in the Americas, EMEA and Asia Pacific, providing products for use in recreational vehicles, trucks and premium cars, pleasure and workboats, and for a variety of other uses. Dometic offer products and solutions that enrich people’s experiences away from home, whether in a motorhome, caravan, boat or a truck. Our motivation is to create smart and reliable products with outstanding design. We operate 22 manufacturing/assembly sites in nine countries, sell our products in approximately 100 countries and manufacture approximately 85% of products sold in-house. We have a global distribution and dealer network in place to serve the aftermarket. Dometic employs approximately 6,500 people worldwide, had net sales of SEK 11.5 billion in 2015 and is headquartered in Solna, Sweden.
DOMETIC GROUP discloses the information provided herein pursuant to the Securities Act and/or the Financial Instruments Trading Act. The information was submitted for publication at 8.00 CET on April 25, 2016.
This document is a translation of the Swedish version of the interim report. In the event of any discrepancy, the Swedish
wording shall prevail.