Embed Size (px)
Citation preview

Interim Report 1–9/2020
Interim Report 1---9/2020
1 (23)
Marimekko Corporation, Interim Report, 4 November 2020 at 8.00 a.m. Marimekko increased its net sales and improved its results in the third quarter in challenging circumstances thanks to wholesale sales and adjustment measures
The third quarter in brief
• The coronavirus pandemic continues to heavily impact the fashion industry and specialty retail sector all over the world. Despite the challenging situation, Marimekko’s net sales rose by 10 percent to EUR 38.0 million (Q3/2019: 34.5).
• Net sales were boosted especially by a favorable trend in wholesale sales in Finland and EMEA. The increase in Finnish wholesale sales was partly due to nonrecurring promotional deliveries. Marimekko’s retail sales declined moderately considering the circumstances, as online sales continued to perform well and retail sales in Finland remained on a par with the comparison period. Also, retail sales include about a million euros in sales which were left unrecognized as revenue in the second quarter due to logistic challenges posed by the pandemic situation.
• Operating profit grew to EUR 10.5 million (7.8), and comparable operating profit was also EUR 10.5 million (7.8).
• Earnings were boosted by a noticeable decrease in fixed costs due to adjusted operations as well as by increased net sales. Fixed costs were also reduced by subsidies granted in various countries to mitigate the negative business impacts of the coronavirus pandemic. A decline in relative sales margin, which was largely due to higher logistics costs resulting from an increase in online sales, had a weakening impact on results.
January-September in brief
• Due to the impacts of the coronavirus pandemic, net sales fell by 5 percent to EUR 86.2 million (1–9/2019: 90.7). Net sales were weakened especially by a decline in retail sales in Finland and North America as well as a decrease in wholesale sales in the Asia-Pacific region. Some of the decline in net sales was offset by booming online sales as well as a strong trend in Finnish wholesale sales, which was partly due to nonrecurring promotional deliveries.
• Operating profit rose to EUR 14.4 million (14.1), and comparable operating profit was also EUR 14.4 million (14.1). Earnings were boosted by a noticeable decrease in fixed costs as a result of Marimekko’s prompt adjustment measures. A decline in relative sales margin, which was mainly due to higher logistics costs resulting from an increase in online sales, as well as reduced net sales had a weakening impact on results.
Financial guidance for 2020 (as revised on 18 September 2020) The Marimekko Group's net sales for 2020 are expected to be lower than in the previous year and comparable operating profit is estimated to be approximately at the same level as or lower than the year before. In its half-year financial report on 13 August 2020, the company stated that the coronavirus pandemic will have a significant negative impact on Marimekko’s net sales and profitability in 2020, but as the situation was changing rapidly, it was not possible to give any precise estimate of the impacts of the pandemic on business. Risks and uncertainties related to the coronavirus pandemic are described in the Major risks and factors of uncertainty section of this interim report.

Interim Report 1---9/2020
2 (23)
KEY FIGURES
(EUR million)
7–9/
2020
7–9/
2019
Change,
%
1–9/
2020
1–9/
2019
Change,
%
1–12/ 2019
Net sales 38.0 34.5 10 86.2 90.7 -5 125.4 International sales 15.0 14.8 2 38.3 41.5 -8 54.3 % of net sales 40 43 44 46 43 EBITDA 13.6 11.0 24 23.8 23.5 1 29.7 Comparable EBITDA 13.6 11.0 24 23.8 23.5 1 29.7 Operating profit 10.5 7.8 34 14.4 14.1 2 17.1 Comparable operating profit 10.5 7.8 34 14.4 14.1 2 17.1 Operating profit margin, % 27.7 22.7 16.7 15.5 13.6 Comparable operating profit margin, % 27.7 22.7 16.7 15.5 13.6 Result for the period 8.0 6.4 25 10.3 10.9 -5 13.0 Earnings per share, EUR 0.98 0.79 25 1.27 1.34 -6 1.61 Comparable earnings per share, EUR 0.98 0.79 25 1.27 1.34 -6 1.61 Cash flow from operating activities 12.6 10.9 15 12.2 21.2 -42 29.0 Return on investment (ROI), % 20.7 17.3 17.9 Equity ratio, % 44.6 39.8 40.2 Net debt / EBITDA (rolling 12 months) * 0.15 - 0.35 Gross investments ** 0.4 0.4 -8 1.2 1.3 -6 2.6 Personnel at the end of the period 428 437 -2 450 outside Finland 89 100 -11 98 Brand sales1 81.5 64.4 27 209.1 176.8 18 250.8 outside Finland 50.7 39.5 28 145.8 111.4 31 156.6 proportion of international sales, % 62 61 70 63 62 Number of stores 151 147 151
The change percentages in the table were calculated on exact figures before the amounts were rounded to millions of euros. The figure for comparable earnings per share takes account of similar items as comparable operating profit; tax effect included. * Due to the adoption of IFRS 16, the ratio of net debt to EBITDA at year end was reported for the first time at the end of the financial year 2019. The key figure is calculated based on comparable rolling 12-month EBITDA. ** The figures for gross investments do not include the impact of IFRS 16.
1 Brand sales are given as an alternative non-IFRS key figure. Brand sales, consisting of estimated sales of Marimekko products at consumer prices, are calculated by adding together the company’s own retail net sales and the estimated retail value of Marimekko products sold by other retailers. The estimate, based on Marimekko’s realized wholesale sales and licensing income, is unofficial and does not include VAT. The key figure is not audited.

Interim Report 1---9/2020
3 (23)
TIINA ALAHUHTA-KASKO President and CEO
“Wholesale sales and prompt adjustment measures helped Marimekko increase its net sales and improve its results in a challenging operating environment. Continued strong online sales supported retail sales as the pandemic kept affecting customer numbers of brick-and-mortar stores. “The coronavirus pandemic continues to heavily impact the fashion industry and specialty retail sector across the world. In managing this exceptional crisis, in addition to an ability to react quickly and an internationally attractive and relevant brand, Marimekko’s strengths have been a comprehensive range of lifestyle products and a diverse business and distribution channel model. With the pandemic, consumers have become increasingly interested in home decoration, which has resulted in robust growth in sales of our home products. The relaxed feel of our ready-to-wear collection – now more evident than before – also appeals to consumers in these unusual circumstances. While the pandemic has understandably reduced footfall in retail stores, we have managed, to a large extent, to offset the decline in retail sales with online sales. We have also achieved strong growth in our wholesale sales. “In the July-September period of 2020, our net sales grew by 10 percent despite the challenging situation and amounted to EUR 38.0 million (34.5). Net sales were boosted especially by a favorable trend in wholesale sales in Finland and EMEA. Our retail sales declined moderately considering the circumstances, as online sales continued to grow well. Net sales in Finland increased by 17 percent: wholesale sales grew significantly, partly due to nonrecurring promotions, and retail sales remained on a par with the comparison period. Our international sales rose by 2 percent thanks to successful wholesale sales. Prompt adjustment measures and net sales growth improved our comparable operating profit, which increased by 34 percent to EUR 10.5 million (7.8). The result was supported by subsidies granted in various countries to mitigate the negative business impacts of the coronavirus pandemic. “In the January-September period of 2020, our net sales fell by 5 percent due to the impacts of the coronavirus pandemic and amounted to EUR 86.2 million (90.7). The majority of the Marimekko stores around the world were temporarily closed in the first or second quarter because of the pandemic. Net sales were weakened especially by a decline in retail sales in Finland and North America as well as a decrease in wholesale sales in the Asia-Pacific region. Some of the decline in net sales was offset by booming online sales as well as a strong trend in Finnish wholesale sales, which was partly due to nonrecurring promotional deliveries. Thanks to a reduction in fixed costs, our comparable operating profit rose to EUR 14.4 million (14.1). “The coronavirus pandemic has expedited the transformation of consumers’ purchasing behavior and intensified structural changes in our sector, such as digitalization. It has accelerated the shift to digital sales channels among customers — including new customer groups — and this will influence Marimekko’s distribution channel choices in the future. The pandemic has also increased surplus inventories in the industry, and the recession created by the pandemic has made consumers more price sensitive. These changes in the operating environment pose challenges to the profitability of the fashion industry, which also puts Marimekko’s operations under increasing pressure. “During the year, we have successfully navigated the crisis and adjusted our operations to the exceptional circumstances through significant, and partly temporary, savings in fixed costs. At the
Interim Report 1---9/2020
4 (23)
same time, we must look after our long-term competitiveness and financial position. To strengthen these aspects and to respond even better to the requirements of the new operating environment, we unfortunately had to conduct consultative negotiations with our personnel in order to reorganize and streamline our operations in Finland and carry out corresponding processes in our organizations in Scandinavia, North America and Australia. Our new, even more customer-centric organization based on omnichannel thinking will improve our operating capabilities in this transforming market. “The pandemic situation continues to be of concern in many of our markets, with new waves of infections being reported. This increases uncertainty in the final quarter of the year, which includes not only the holiday sales season but also other significant sales campaigns for Marimekko. We have systematically invested in the development of our digital business, and successful online sales are especially important in 2020. The line between e-commerce and physical stores is constantly blurring, and in the post-pandemic reality, stores need to fulfill their new role even more strongly in the eyes of consumers as meaningful meeting places and experiential platforms for what a brand has to offer. Our flagship store, which expanded to Helsinki’s Pohjoisesplanadi this fall, is an excellent example. We will continue our determined efforts to develop a seamless omnichannel customer experience, and we will launch our revamped online store in early 2021. “With disruption come also new opportunities and I firmly believe that our new organization and our long-term growth strategy are strongly positioned to capture the future growth opportunities for the sustainable, timeless and unique Marimekko lifestyle that the current megatrends support.”

Interim Report 1---9/2020
5 (23)
OPERATING ENVIRONMENT The following outlook information is based on materials published by Confederation of Finnish Industries EK and Statistics Finland. The global economy is expected to shrink at a rate of about four percent in 2020 due to the coronavirus pandemic. Although recovery is underway, the pace varies in different parts of the world and the impacts of the second wave of the pandemic on economic trends are difficult to forecast. Economic conditions in Finland have continued to be very weak during the fall. The recovery of industry and commerce from the corona shock in the spring has come to a halt at the same time as the coronavirus pandemic has accelerated again as the fall has progressed. The situation varies greatly from sector to sector. Retail trade confidence was down in October, and although sales have slightly grown after the summer, sales expectations have clearly weakened. Consumer confidence has also weakened after the summer, and consumers’ expectations about the trend in the Finnish economy declined further in October. Views of current personal finances improved slightly, but expectations about the future financial situation continued to be subdued. (Confederation of Finnish Industries EK: Business Tendency Survey, October 2020; Confidence Indicators, October 2020. Statistics Finland: Consumer Confidence 2020, October). Net sales of Finnish retail trade in September grew by 3.2 percent on the previous year. Growth in sales of daily consumer goods, in particular, continued to be good. The cumulative working-day-adjusted turnover of retail trade in the January-September period of 2020 rose by 3.9 percent and the volume of sales was up by 3.7 percent. (Statistics Finland: Turnover of Trade, retail trade flash estimate, September 2020). NET SALES Net sales in the third quarter In the July-September period of 2020, the Group’s net sales grew by 10 percent relative to the same period last year and were EUR 38,011 thousand (34,451). Net sales were boosted especially by a favorable trend in wholesale sales in Finland and EMEA. Net sales in Finland rose by 17 percent; international sales were up by 2 percent. Nearly all of Marimekko’s own stores were open in the third quarter, but footfall in the stores was noticeably lower than in the comparison period due to the pandemic. However, the company’s online sales continued to increase substantially, which to a large extent offset the impacts of reduced footfall, and all in all, retail sales only decreased by 5 percent. Retail sales for the third quarter include about a million euros in sales which were left unrecognized as revenue in the second quarter due to logistic challenges posed by the pandemic situation. All retail sales for the July-September period have been booked for the third quarter. Marimekko’s wholesale sales continued to perform well and grew by 37 percent in the third quarter. Both retail and wholesale sales of home products increased noticeably. Net sales in Finland were EUR 22,972 thousand (19,661). Despite a significant decline in customer numbers, retail sales performed well during the summer and were on a par with the comparison period in the third quarter, due especially to very strong growth in online sales. Comparable retail sales2 decreased by 9 percent. Wholesale sales in Finland rose by 66 percent. The good trend in wholesale sales was supported, among other things, by nonrecurring promotional deliveries, the total value of which was substantially higher than last year. In the company’s second-biggest market, the Asia-Pacific region, net sales fell by 9 percent to EUR 6,623 thousand (7,247). Lower licensing income than in the comparison period as well as reduced retail sales contributed to the decline in net sales. Wholesale sales in the region grew by 7
2 Includes both bricks-and-mortar and online sales.

Interim Report 1---9/2020
6 (23)
percent, but in Japan, the most important country to Marimekko in this market area, wholesale sales were down by 1 percent. Some of the company’s own stores in Australia were temporarily closed due to the pandemic for almost the entire third quarter, and although Marimekko’s online sales performed well, retail sales in the Asia-Pacific region decreased by 36 percent. Net sales in the January-September period Due to the impacts of the coronavirus pandemic, the Group’s net sales in the January-September period of 2020 declined by 5 percent to EUR 86,210 thousand (90,704). Net sales were weakened especially by a decline in retail sales in Finland and North America as well as a decrease in wholesale sales in the Asia-Pacific region. Retail sales in total fell by 15 percent because of the temporary closure of stores and a significant decline in customer numbers, although online sales performed very well and supported retail sales. Wholesale sales grew by 7 percent. Net sales in Finland decreased by 3 percent and international sales by 8 percent. Net sales in Finland were EUR 47,924 thousand (49,229). Retail sales fell by 14 percent and comparable retail sales3 by 10 percent due to the temporary closure of stores and a significant decline in customer numbers. However, robust growth in online sales supported retail sales. Wholesale sales grew by 31 percent despite the exceptional situation. The total value of nonrecurring promotional deliveries, which, among other things, contributed to the good trend in wholesale sales, was substantially higher than last year. In the Asia-Pacific region, net sales amounted to EUR 16,834 thousand (19,148). Wholesale sales in the market area decreased by 14 percent due to the impacts of the coronavirus pandemic. An exceptional delivery pattern in the comparison period also had an impact on wholesale sales in the region: a part of wholesale deliveries for the final quarter of 2018 took place in the first quarter of 2019. Wholesale sales to Japan fell by 16 percent. Retail sales declined by 22 percent as some, or at a certain point all, of Marimekko’s own stores in Australia were temporarily closed in the second and third quarters.
NET SALES BY MARKET AREA
(EUR 1,000)
7–9/
2020
7–9/
2019
Change,
%
1–9/
2020
1–9/
2019
Change,
%
1–12/ 2019
Finland 22,972 19,661 17 47,924 49,229 -3 71,163 International sales 15,039 14,790 2 38,286 41,475 -8 54,256 Scandinavia 2,779 2,468 13 6,715 6,687 0 9,297 EMEA 4,013 2,781 44 9,980 9,425 6 11,992 North America 1,624 2,294 -29 4,756 6,214 -23 8,257 Asia-Pacific 6,623 7,247 -9 16,834 19,148 -12 24,712 Total 38,011 34,451 10 86,210 90,704 -5 125,419
All figures in the table have been individually rounded to thousands of euros, so there may be rounding differences in the totals. A more comprehensive table with breakdown into retail sales, wholesale sales and licensing income by market area can be found in the table section of this interim report. FINANCIAL RESULT In the July-September period of 2020, the Group’s operating profit amounted to EUR 10,514 thousand (7,823). There were no items affecting comparability in the period under review, which was also the case in the previous year, and comparable operating profit was also EUR 10,514 thousand (7,823). Earnings were boosted by a noticeable decrease in fixed costs due to adjusted operations as well as by increased net sales. Fixed costs were also reduced by subsidies granted in various
3 Includes both bricks-and-mortar and online sales.

Interim Report 1---9/2020
7 (23)
countries to mitigate the negative business impacts of the coronavirus pandemic. A decline in relative sales margin had a weakening impact on results. When the coronavirus started to spread early in the year, Marimekko swiftly initiated cost-saving measures. Employee benefit expenses fell in the third quarter as a result of temporary layoffs in the retail store chain due to the coronavirus pandemic, although a rise in Marimekko’s share price increased the estimated effects of the long-term, share-based incentive scheme for management. Fixed costs were also reduced by the various subsidies, totaling about a million euros, granted to Marimekko in several different markets to mitigate the negative business impacts of the coronavirus pandemic. Substantial savings were also achieved, for example, through reducing marketing investments and the temporary rent reductions granted to the company. The relative sales margin was negatively affected in particular by higher logistics costs resulting from a significant increase in online sales. Lower licensing income than in the comparison period, sales channel choice, and bigger discounts also had an impact on the relative sales margin. On the other hand, good margins per product, achieved through product portfolio optimization, supported the relative sales margin. In the January-September period of 2020, the Group’s operating profit was EUR 14,382 thousand (14,104) and comparable operating profit was also EUR 14,382 thousand (14,104). Earnings were boosted by a noticeable decrease in fixed costs as a result of Marimekko’s ambitious saving program. A decline in relative sales margin as well as reduced net sales had a weakening impact on results. Fixed costs decreased noticeably, as savings were achieved, for example, in employee benefit expenses, store rents and marketing. The various subsidies granted in several different markets to mitigate the negative business impacts of the coronavirus pandemic also reduced fixed costs. The decline in relative sales margin was attributable, in particular, to increased logistics costs due to substantial growth in online sales as well as to bigger discounts. On the other hand, good margins per product, achieved through product portfolio optimization, supported the relative sales margin. In the January-September period, marketing expenses were EUR 3,279 thousand (4,685), or 4 percent of the Group’s net sales (5). The Group’s depreciation amounted to EUR 9,392 thousand (9,374), representing 11 percent of net sales (10). In the January-September period, operating profit margin was 16.7 percent (15.5) and comparable operating profit margin was also 16.7 percent (15.5). In the third quarter of the year, operating profit margin was 27.7 percent (22.7) and comparable operating profit margin 27.7 percent (22.7). Net financial expenses in the January-September period were EUR 1,396 thousand (651) or 2 percent of net sales (1). Financial items include exchange rate differences amounting to EUR -647 thousand (118), of which EUR -370 thousand (200) were unrealized. The impact of IFRS 16 on interest expenses was EUR -578 thousand (-668). Result for the January-September period before taxes was EUR 12,986 thousand (13,453). Net result for the period was EUR 10,303 thousand (10,887) and earnings per share were EUR 1.27 (1.34). BALANCE SHEET The consolidated balance sheet total as at 30 September 2020 was EUR 110,682 thousand (92,264). Equity attributable to the equity holders of the parent company was EUR 49,360 thousand (36,712), or EUR 6.09 per share (4.53). Non-current assets at the end of September 2020 stood at EUR 38,095 thousand (40,444). Lease liabilities amounted to EUR 32,525 thousand (35,792). Financial liabilities rose to EUR 6,580 thousand (0), as the company, in May, drew down a new short-term credit facility worth EUR 6 million and expiring on 31 December 2020. In addition, the Group had unused committed credit lines of EUR 17,300 thousand (13,000).

Interim Report 1---9/2020
8 (23)
At the end of the period, net working capital was EUR 17,184 thousand (11,141). Inventories decreased from the end of June and were EUR 26,212 thousand (23,906). Inventories rose suddenly as demand fell in the second quarter, when the company’s own retail stores were temporarily closed due to the coronavirus pandemic. Marimekko’s extensive chain of outlet stores and related promotions provide good opportunities for reducing inventories. CASH FLOW AND FINANCING In the July-September period of 2020, cash flow from operating activities was EUR 12,615 thousand (10,946), or EUR 1.60 per share (1.35). Cash flow before cash flow from financing activities was EUR 12,025 thousand (10,744). In the January-September period, cash flow from operating activities was EUR 12,177 thousand (21,163), or EUR 1.50 per share (2.61). Increases in current non-interest-bearing trade receivables and inventories as well as higher tax payments than in the comparison period had an impact on cash flow from operating activities. Cash flow before cash flow from financing activities was EUR 10,138 thousand (19,786). The Group’s cash and cash equivalents at the end of the period amounted to EUR 34,565 thousand (20,919). The increase in cash and cash equivalents was partly due to the decision to refrain from paying dividends in the period under review because of the exceptional situation; the dividends paid in the comparison period totaled EUR 15,003 thousand. The amount of interest-bearing credit facilities drawn down was EUR 6,580 thousand (0). In addition, the Group had unused committed credit lines of EUR 17,300 thousand (13,000). The company has also secured a short-term revolving credit facility worth EUR 10 million as well as a long-term revolving credit facility of EUR 5 million, which includes a covenant. Marimekko secured additional financing in the spring in a situation of a very weak view of the duration and impacts of the pandemic. The Group’s equity ratio at the end of the period was 44.6 percent (39.8). Gearing was 9.2 percent (40.5). The ratio of net debt to 12-month rolling EBITDA was 0.15, i.e. well below the maximum of 2 which is the company’s long-term goal. INVESTMENTS The Group’s gross investments in the January-September period of 2020 were EUR 1,240 thousand (1,314), or 1 percent of net sales (1). Most of the investments were devoted to IT systems. STORE NETWORK Good store locations that cater for its target audience are essential for Marimekko. The operations and efficiency of the store network are continuously assessed and developed. During the third quarter of 2020, one Marimekko store was opened in Hong Kong and one shop-in-shop in Estonia. One store was closed in Shanghai. At the end of the review period, there were 151 Marimekko stores and shop-in-shops and online store reached customers in 32 countries. The stores’ net sales in each market are primarily generated from sales to local customers, although sales to tourists make up a significant portion of the sales of certain central stores especially during holiday seasons. In addition to its own online store, the company also has distribution through other online channels. In 2020, the coronavirus pandemic has impacted the operations of Marimekko stores in all markets. The majority of Marimekko’s own stores were closed due to the coronavirus for most of the second quarter. With elevated health and safety measures in place, complying with local restrictions and recommendations and offering new services to reduce close contacts, Marimekko reopened most of its own stores in stages in May and June, and nearly all company-owned stores were open in the third quarter, partly with limited hours. Some of the stores in Australia were closed temporarily due to

Interim Report 1---9/2020
9 (23)
regulations at the beginning of July and were reopened after the end of the review period at the end of October. The partner-owned Marimekko stores in Asia were open in the third quarter, partly with limited hours. Marimekko has been investing in the development of its digital business for several years already and was therefore able to quickly move its promotions online in the spring after temporarily closing its own retail stores due to the coronavirus pandemic. The online store was an important retail channel for Marimekko in the third quarter as well after the reopening of the company’s own stores, and its sales continued to increase significantly. Digital service solutions are constantly increasing the integration of e-commerce and in-store retailing. For this reason, Marimekko continues to report its own e-commerce net sales as part of retail sales and sales through other online channels as part of wholesale sales. Marimekko focuses major efforts on creating a seamless customer experience between different channels and develops its IT systems to strengthen its digital business. Accelerated by the pandemic, the importance of online sales in the company’s business will grow even more, and the shift to digital sales channels among customers will influence Marimekko’s distribution channel choices in the future.
STORES AND SHOP-IN-SHOPS
30.9.2020
30.9.2019
31.12.2019
Finland 65 64 66 Scandinavia 10 10 10 EMEA 2 1 2 North America 6 6 6 Asia-Pacific 68 66 67 Total 151 147 151
A more comprehensive table with breakdown into the company’s own retail stores, retailer-owned Marimekko stores and shop-in-shops can be found in the table section of this interim report. PERSONNEL In the January-September period of 2020, the number of employees, expressed as full-time equivalents, averaged 437 (439). At the end of the period, the Group had 428 (437) employees, of whom 89 (100) worked outside Finland. The number of employees working outside Finland was broken down as follows: Scandinavia 25 (37), EMEA 3 (4), North America 31 (33) and the Asia-Pacific region 30 (26). The personnel at company-owned stores, expressed as full-time equivalents, totaled 222 (241) at the end of the period. With the coronavirus pandemic escalating in different markets, Marimekko decided in March to temporarily close all of its own retail stores in Finland, Scandinavia, Germany, the United States and Australia. As a result of consultative negotiations conducted in Finland and corresponding processes in different countries, almost the entire retail organization was laid off temporarily. Employees in Finland and other countries have been invited back to work in stages as the company’s own stores have been reopened with elevated health and safety measures in place and complying with local restrictions and recommendations, but some of the layoffs still continue. After the end of the review period, on 8 October 2020, Marimekko announced that its consultative negotiations in Finland and the corresponding processes in its organizations in Scandinavia, North America and Australia, initiated in August, had been completed. The aim of the negotiations and the corresponding processes was to reorganize and streamline the company’s operations to better respond to the structural changes in the fashion and specialty retail sector and the dramatic transformation of consumers’ purchasing behavior, accelerated by the coronavirus pandemic. The
Interim Report 1---9/2020
10 (23)
new organization based on the consultation and the corresponding processes will further strengthen Marimekko’s customer-centricity and omnichannel approach in an increasingly digital market. In Finland, the reorganization and streamlining of operations led to the termination of 20 employment contracts and 31 people were offered a new or a significantly modified job. The reorganization also affected Marimekko’s organizations in Scandinavia, North America and Australia and led locally to the restructuring of some jobs. The company estimates to achieve annual savings of around EUR 1.3 million in total through the reorganization and streamlining of cost structure. Most of the profit impact of the cost savings will be visible as of the fourth quarter of 2020, when the company will also book a restructuring provision of approximately EUR 0.7 million related to these personnel reductions. SHARES AND SHAREHOLDERS Share capital and number of shares At the end of the period under review, the company’s fully paid-up share capital, as recorded in the Trade Register, amounted to EUR 8,040,000 and the number of shares totaled 8,129,834. Shareholdings According to the book-entry register, Marimekko had 17,876 shareholders at the end of the period (10,682). Of the shares, 12.8 percent were owned by nominee-registered or non-Finnish holders (11.2). Marimekko Corporation held 20,000 of its own shares as at 30 September 2020. These shares accounted for 0.25 percent of the total number of the company’s shares. Marimekko shares held by the company carry no voting rights and no entitlement to dividends. Monthly updated information on the largest shareholders can be found on the company’s website at company.marimekko.com under Investors/Share information/Shareholders. Share trading and the company’s market capitalization In the January-September period of 2020, a total of 2,893,848 Marimekko shares (1,206,377) were traded on Nasdaq Helsinki, representing 35.6 percent of the shares outstanding (14.8). The total value of the share turnover was EUR 88,593,577 (32,655,896). The lowest price of the share was EUR 21.30 (20.80), the highest was EUR 42.50 (31.50) and the average price was EUR 30.62 (27.11). At the end of September, the closing price of the share was EUR 37.15 (28.10). The company’s market capitalization on 30 September 2020 was EUR 301,280,333, excluding the Marimekko shares held by the company (227,886,335). Flagging announcements Moomin Characters Oy Ltd’s share of Marimekko Corporation’s shares and voting rights fell below the threshold of 5 percent on 17 August 2020 as its holding decreased to 378,740 shares which equaled 4.66 percent of the total number of shares in Marimekko Corporation. Later in August, Moomin Characters Oy Ltd sold its remaining holding in Marimekko. Authorizations The Annual General Meeting held on 8 April 2020 authorized the Board of Directors to decide on the payment of a maximum dividend of EUR 0.90 per share in one or several instalments at a later stage. The authorization is valid until the next AGM. The company will publish the possible decision on dividend payment separately and, at the same time, confirm the pertinent record and payment dates.
Interim Report 1---9/2020
11 (23)
The AGM also authorized the Board of Directors to decide on the acquisition of a maximum of 100,000 of the company’s own shares, in one or more instalments, to be used as a part of the company’s incentive compensation program, to be transferred for other purposes or to be cancelled. The quantity represents approximately 1.2 percent of the total number of the company’s shares at the time of the proposal. The shares would be acquired with funds from the company’s non-restricted equity, which means that the acquisition would reduce funds available for distribution. The shares would be acquired otherwise than in proportion to the shareholdings of the shareholders through public trading on Nasdaq Helsinki Ltd at the market price prevailing at the time of acquisition and in accordance with the rules and regulations of Nasdaq Helsinki Ltd. The authorization was not used in the review period. The authorization is valid until 8 October 2021. Furthermore, the AGM authorized the Board of Directors to decide on the issuance of new shares and the transfer of the company’s own shares in one or more instalments. The total number of shares to be issued or transferred pursuant to the authorization may not exceed 120,000 new or treasury shares, which represents approximately 1.5 percent of the total number of the company’s shares at the time of the proposal. Pursuant to the authorization, the Board may decide on a directed share issue in deviation from the shareholders’ pre-emptive right for a weighty financial reason. The share issue may be subject to a charge or free. The subscription price of the new shares and the amount paid for the company’s own shares would be recorded in the company’s reserve for invested non-restricted equity. The Board of Directors is authorized to decide on all of the other terms and conditions of the share issue. The authorization was not used in the review period. The authorization is valid until 8 October 2021. At the end of the review period, the Board of Directors had no valid authorizations to issue convertible bonds or bonds with warrants. EVENTS AFTER THE END OF THE REVIEW PERIOD Changes in management After the end of the review period, on 8 October 2020, Dan Trapp was appointed Marimekko’s Chief Sales Officer (CSO) and a member of the Management Group. He started in the position on 2 November 2020. Morten Israelsen, Marimekko’s Chief Sales Officer (CSO) and member of the Management Group, left his position on 16 October 2020. Further, Sanna-Kaisa Niikko was appointed Marimekko’s Chief Marketing Officer (CMO) and a member of the Management Group as of 8 October 2020. MAJOR RISKS AND FACTORS OF UNCERTAINTY Factors of uncertainty over the global economic trend affect the retail trade and consumer confidence in all of the company’s market areas. The coronavirus that spread rapidly all over the world during the first quarter of 2020 created the worst crisis experienced by the global fashion industry and specialty retail sector in decades. It has taken uncertainty over the global economy to a completely new level. The coronavirus pandemic and other exceptional circumstances, especially if prolonged, can have significant impacts on Marimekko’s sales, profitability, cash flow and the operational reliability of the company’s value chain. They can also have long-term impacts on consumers’ preferences, purchasing behavior and buying power. Changes in these especially in Finland and Japan, which are the company’s biggest single countries for business, pose considerable strategic risks to the company. The economic recession and a rise in unemployment can affect the company’s sales outlook and increase consumers’ price sensitivity. Other strategic risks include risks related to changes in the company’s design, product assortment and product distribution and pricing. Digitization in retail trade has gathered pace in the past few years and will further accelerate as a result of the coronavirus pandemic, which can have an impact on the company’s distribution channel solutions and choices, sales and profitability as well as create new revenue generation models. The importance of omnichannel business in the retail trade is emphasized. International e-commerce increases the options available to consumers and the significance of big e-commerce operators. The coronavirus pandemic has also intensified the
Interim Report 1---9/2020
12 (23)
financial difficulties of many traditional wholesale customers in the fashion sector, such as department stores and multi-brand retailers, which may have an impact Marimekko’s business and distribution channel choices. Maintaining competitiveness in a rapidly changing operating environment being revolutionized by digitization demands agility, efficiency, flexibility and the constant re-evaluation of operations. The company’s ability to design, develop and commercialize new products that meet consumers’ expectations while ensuring effective, quickly reacting and sustainable production, sourcing and logistics also has an impact on the company’s sales and profitability. The company’s growth in the longer term is based primarily on omnichannel retail: on increasing e-commerce, on partner-led retail in Asia, as well as on enhancing the sales per square meter of existing stores in the company’s main market areas. The Asia-Pacific region is Marimekko’s second-biggest market, and it plays an important role in the company’s growth and internationalization. Major partnership choices, partnering contracts and other collaboration agreements involve considerable risks. With the company’s internationalization and the growing interest in its brand, risks related to grey exports have increased, which may have an impact on the company’s sales and profitability. Store lease agreements in Finland and abroad also contain risks. Intellectual property rights play a vital role in the company’s success, and the company’s ability to manage and protect these rights may have an impact on the value and reputation of the company. Agreements with freelance designers and fees paid to designers based on these agreements are also an essential part of the management of intellectual property rights. As the company internationalizes, the risks of infringements of its intellectual property rights may increase, particularly in Asia. Prominent among the company's operational risks are those related to internationalization, digitization, sustainability as well as supply and logistics chain reliability. As Marimekko is a small company, risks related to key personnel can also be significant. The coronavirus pandemic increases operational risks related especially to taking care of the health and safety of customers and employees, production, supply and logistics chain reliability and efficiency, inventory and product flow management as well as cybersecurity and information system reliability as the importance of e-commerce is further emphasized. Early commitment to product orders from subcontractors, which is typical of the industry, weakens the company’s possibilities to respond to rapid changes in demand especially in exceptional situations. In normal circumstances, too, there are risks associated with information system reliability, dependability and compatibility. With digitization, various risks related to cybersecurity and personal data protection have also increased. DoS attacks, malfunctions in data communications or, for example, in the company's own online store, may disrupt business or result in lost sales. Data leakage can lead to claims for damages and reputation risks. Operational risks related to Marimekko’s supply chain are associated especially with procurement and logistics processes and their flexibility and efficiency as well as price fluctuations for raw materials and procurements. As product distribution is expanded and operations are diversified, risks associated with inventory management also grow. The company primarily uses subcontractors to manufacture its products. Of the sustainability elements of manufacturing, especially social aspects related to the supply chain (including human rights, working conditions and remuneration) and environmental aspects (for example production methods and chemicals used) as well as transparent communications on these subjects are of growing significance to customers. These sustainability elements apply to Marimekko’s own production and sourcing as well as licensed products. Compliance with sustainable business methods is important in maintaining customers’ confidence; any failures or errors in this area will involve reputation risks. Any delays or disturbances in supply, or fluctuations in the quality of products, may have a harmful impact on business. Business and reputation risks are prevented by taking care of product safety and through continuous quality control. Climate change is expected to bring an increase in various extreme phenomena such as floods, typhoons and hurricanes. Marimekko has stores in areas in which such extreme phenomena may occur, and if they damage stores or cause momentary changes in consumers’ purchasing behavior, it
Interim Report 1---9/2020
13 (23)
may result in lost sales as well as expenses. Extreme phenomena may also affect the availability of products if they cause damage to the company’s suppliers’ factories. Furthermore, climate change or extreme weather may cause droughts, soil depletion or other changes in growth conditions, which could impact the availability and price of Marimekko’s most used raw material, cotton. Among the company’s financial risks, those related to the structure of sales, price trends for factors of production, changes in cost structure, changes in exchange rates (particularly the US dollar, Swedish krona and Australian dollar), taxation, and customers’ liquidity may have an impact on the company’s financial status. The coronavirus pandemic has significantly increased risks related to customers’ liquidity. MARKET OUTLOOK AND GROWTH TARGETS FOR 2020 The coronavirus that spread rapidly all over the world during the first quarter of 2020 created the worst crisis experienced by the global fashion industry and specialty retail sector in decades. It has taken uncertainty over the global economy to a completely new level and has an impact on consumers’ purchasing behavior. The exceptional circumstances can have an impact on Marimekko’s sales, profitability and cash flow. Furthermore, the global crisis may affect the operational reliability of the company’s value chain. The duration of the pandemic, new infection waves and the way the crisis is handled by different countries influence the depth of the economic recession in different markets. Finland, Marimekko’s important domestic market, traditionally represents about half of the company’s net sales. The outlook for the domestic market and the company’s consolidated net sales and earnings are influenced by the trend in customer numbers in retail stores during the rest of the year and whether online sales continue to perform well. Several of Marimekko’s significant sales campaigns take place in the final quarter of the year. Domestic wholesale sales in 2020 are boosted by nonrecurring promotional deliveries, the total value of which is substantially higher than last year. A vast majority of the deliveries take place in the second half of the year. The Asia-Pacific region is Marimekko’s second-largest market and it plays a significant part in the company’s internationalization. Japan is clearly the most important country in this region to Marimekko. The other countries’ combined share of the company’s net sales is still relatively small, as operations in these countries are at an earlier stage than in Japan. Japan already has a very comprehensive network of Marimekko stores. All Marimekko stores in Asia are partner-owned. Possible new infection waves and the speed of recovery from the pandemic in different countries can affect especially the company’s sales outlook for the coming year in the Asia-Pacific region. Despite the pandemic, the company continues to see increasing demand for its products in the region in the longer term. In 2019, Marimekko became aware of cases of grey exports and has taken due action. The control of the cases has a clear weakening impact on the company’s sales and earnings in 2020. Licensing income in 2020 is forecast to be higher than in the previous year thanks to better-than-expected estimated development.
The importance of e-commerce in the company’s business has continued to grow in 2020, and online sales are expected to perform well in the final quarter of the year as well. The full-year outlook for retail sales essentially depends on the return of customer flows to stores during the rest of the year in each market as well as possible new infection waves which may require temporary closures of Marimekko’s own retail stores. Full-year wholesale sales will be supported by nonrecurring promotional deliveries in Finland. The company’s aim is still to open approximately 10 new Marimekko stores and shop-in-shops in 2020. The main thrust in new openings is on retailer-owned Marimekko stores. At the outset of the coronavirus crisis, Marimekko quickly made contingency plans in its supply chains to ensure continuous production and logistics, and the plans are continually updated. The exceptional circumstances have so far only had a minor impact on the supply chain. Instead, continued strong growth in demand for products in the online store and wholesale delivery problems

Interim Report 1---9/2020
14 (23)
caused by the pandemic posed challenges to Marimekko’s logistics in the early part of the year. Net sales and earnings for the rest of the year essentially depend on maintaining the operational reliability of distribution centers and logistics in the pandemic situation. As a result of growth in online sales, the company expects full-year logistics costs to increase noticeably on 2019. To secure profitability and cash flow, Marimekko drew up an ambitious fixed-cost saving program and promptly started to implement it in the early part of the year. Fixed costs are expected to continue to decrease during the remainder of the year compared with 2019. Marketing expenses are estimated to be substantially lower than in the previous year (2019: EUR 7.4 million). The company expects its total investments to be lower than in the previous year (2019: EUR 2.6 million). The estimated effects of the long-term bonus system targeted at the company’s Management Group will depend on the trend in the price of the company’s share during the year. FINANCIAL CALENDAR FOR 2021 Marimekko Corporation’s financial statements bulletin for 2020 will be issued on Thursday, 18 February 2021 at 8.00 a.m. The financial statements for 2020 will be published in week 12 at the latest. The interim reports and the half-year financial report for 2021 will be issued as follows: January-March on Thursday 20 May 2021 at 8.00 a.m., January-June on Thursday 19 August 2021 at 8.00 a.m., and January-September on Wednesday 3 November 2021 at 8.00 a.m. The Annual General Meeting is scheduled to be held on Wednesday 14 April 2021 at 2.00 p.m. Helsinki, 3 November 2020 Marimekko Corporation Board of Directors
Interim Report 1---9/2020
15 (23)
The quarterly results for 2020 are unaudited. The 2019 figures are based on the audited figures of the financial statements for 2019. There may be differences in totals due to rounding to the nearest thousand euros. ACCOUNTIG PRINCIPLES This interim report was prepared in compliance with IAS 34. Marimekko has applied the same accounting principles in this report as were applied in its 2019 financial statements. APPENDICES Consolidated income statement and comprehensive consolidated income statement Consolidated balance sheet Consolidated cash flow statement Consolidated statement of changes in shareholders’ equity Intangible and tangible assets Key figures Net sales by market area Stores and shop-in-shops Net sales by product line Quarterly trend in net sales and earnings Formulas for key figures

Interim Report 1---9/2020
16 (23)
CONSOLIDATED INCOME STATEMENT
(EUR 1,000)
7–9/2020
7–9/2019
1–9/2020
1–9/2019
1–12/2019
NET SALES 38,011 34,451 86,210 90,704 125,419 Other operating income 4 171 278 544 616 Change in inventories of finished goods and work in progress -2,298 1,460 3,384 1,482 444 Raw materials and consumables -12,337 -12,973 -36,647 -32,789 -45,391 Employee benefit expenses -6,158 -6,515 -17,395 -20,157 -27,780 Depreciation and impairments -3,103 -3,153 -9,392 -9,374 -12,543 Other operating expenses -3,605 -5,619 -12,055 -16,305 -23,647
OPERATING PROFIT 10,514 7,823 14,382 14,104 17,117
Financial income 11 420 503 497 462 Financial expenses -565 -414 -1,899 -1,148 -1,429
-554 6 -1,396 -651 -966
RESULT BEFORE TAXES 9,960 7,829 12,986 13,453 16,151
Income taxes -1,992 -1,453 -2,684 -2,566 -3,133
NET RESULT FOR THE PERIOD 7,967 6,376 10,303 10,887 13,018
Distribution of net result to equity holders of the parent company 7,967
6,376 10,303 10,887
13,018
Basic and diluted earnings per share calculated on the result attributable to equity holders of the parent company, EUR 0.98 0.79 1.27 1.34
1.61
COMPREHENSIVE CONSOLIDATED INCOME STATEMENT
(EUR 1,000)
7–9/2020
7–9/2019
1–9/2020
1–9/2019
1–12/2019
Net result for the period 7,967 6,376 10,303 10,887 13,018 Items that could be reclassified to profit or loss at a future point in time
Change in translation difference 114 -105 133 -99 -17
COMPREHENSIVE RESULT FOR THE PERIOD
8,081
6,271
10,436
10,788
13,001
Distribution of net result to equity holders of the parent company 8,081 6,271 10,436 10,788
13,001

Interim Report 1---9/2020
17 (23)
CONSOLIDATED BALANCE SHEET
(EUR 1,000)
30.9.2020
30.9.2019
31.12.2019
ASSETS
NON-CURRENT ASSETS Intangible assets 915 929 593 Tangible assets 36,338 38,941 40,431 Other financial assets 16 16 16 Deferred tax assets 826 559 515
38,095 40,444 41,555
CURRENT ASSETS Inventories 26,212 23,906 22,564 Trade and other receivables 11,810 6,995 6,632 Cash and cash equivalents 34,565 20,919 26,133
72,587 51,820 55,329
ASSETS, TOTAL 110,682 92,264 96,884
(EUR 1,000)
30.9.2020
30.9.2019
31.12.2019
SHAREHOLDERS’ EQUITY AND LIABILITIES
EQUITY ATTRIBUTABLE TO EQUITY HOLDERS OF THE PARENT COMPANY
Share capital 8,040 8,040 8,040 Reserve for invested non-restricted equity 1,228 1,228 1,228 Treasury shares -315 -315 -315 Translation differences 67 -148 -66 Retained earnings 40,340 27,907 30,037 Shareholders’ equity, total 49,360 36,712 38,925
NON-CURRENT LIABILITIES Lease liabilities 22,059 25,643 25,950 Other non-current liabilities 1,378 1,613 1,644
23,437 27,256 27,594
CURRENT LIABILITIES Trade and other payables 19,744 16,193 17,796 Current tax liabilities 1,095 1,954 2,115 Lease liabilities 10,466 10,149 10,203 Financial liabilities 6,580 - 251
37,884 28,295 30,366
Liabilities, total 61,321 55,552 57,960
SHAREHOLDERS’ EQUITY AND LIABILITIES, TOTAL 110,682 92,264 96,884

Interim Report 1---9/2020
18 (23)
CONSOLIDATED CASH FLOW STATEMENT
(EUR 1,000)
1–9/2020
1–9/2019
1–12/2019
CASH FLOW FROM OPERATING ACTIVITIES
Net result for the period 10,303 10,887 13,018 Adjustments Depreciation and impairments 9,392 9,374 12,543 Financial income and expenses 1,396 651 966 Taxes 2,684 2,566 3,133 Cash flow before change in working capital 23,774 23,478 29,661
Change in working capital -6,588 685 2,887 Increase (-) / decrease (+) in current non-interest-bearing trade receivables
-5,390
-524
-117
Increase (-) / decrease (+) in inventories -3,648 -1,792 -450 Increase (+) / decrease (-) in current non-interest-bearing liabilities 2,449 3,000 3,454 Cash flow from operating activities before financial items and taxes 17,186 24,163 32,548
Paid interest and payments on other financial expenses -1,050 -533 -1 408 Interest received and payments on other financial income 72 22 404 Taxes paid -4,031 -2,489 -2,552 CASH FLOW FROM OPERATING ACTIVITIES 12,177 21,163 28,992
CASH FLOW FROM INVESTING ACTIVITIES
Investments in tangible and intangible assets -2,040 -1,378 -1,569
CASH FLOW FROM INVESTING ACTIVITIES -2,040 -1,378 -1,569
CASH FLOW FROM FINANCING ACTIVITIES
Short-term loans drawn 6,329 - 251 Personnel share issue - 726 726 Leasing payments -8,035 -7,764 -10,437 Dividends paid - -15,003 -15,003
CASH FLOW FROM FINANCING ACTIVITIES -1,706 -22,041 -24,463
Change in cash and cash equivalents 8,432 -2,255 2,960
Cash and cash equivalents at the beginning of the period 26,133 23,174 23,174 Cash and cash equivalents at the end of the period 34,565 20,919 26,133
In addition, Marimekko has unused committed credit lines of EUR 17,300 thousand (13,000). The company has also secured a short-term revolving credit facility worth EUR 10 million as well as a long-term revolving credit facility of EUR 5 million, which includes a covenant.

Interim Report 1---9/2020
19 (23)
CONSOLIDATED STATEMENT OF CHANGES IN SHAREHOLDERS’ EQUITY
(EUR 1,000)
Equity attributable to equity holders of the parent company
Share capital
Reserve
for invested
non-restricted
equity
Treasury shares
Translation differences
Retained earnings
Share- holders’ equity,
total
Shareholders’ equity 1 Jan. 2019
8,040
502
-315
-49
31,827
40,005
Comprehensive result Net result for the period 10,887 10,887 Translation differences -99 -99 Total comprehensive result for the period
-99
10,887
10,788
Transactions with owners Dividends paid -15,003 -15,003 Personnel share issue 726 726 Share-based transactions, personnel share issue
195
195
Shareholders’ equity 30 Sept. 2019
8,040
1,228
-315
-148
27,907
36,712
Shareholders’ equity 1 Jan. 2020
8,040
1,228
-315
-66
30,037
38,925
Comprehensive result Net result for the period 10,303 10,303 Translation differences 133 133 Total comprehensive result for the period
133 10,303 10,436
Shareholders’ equity 30 Sept. 2020
8,040
1,228
-315 67 40,340 49,360

Interim Report 1---9/2020
20 (23)
INTANGIBLE AND TANGIBLE ASSETS
(EUR 1,000)
Intangible
assets
Tangible
assets
Right-of-use
assets
Other
Total Acquisition cost, 1 Jan. 2019 9,622 - 27,830 27,830 Adoption of IFRS 16, 1 Jan. 2019 - 41,778 - 41,778 Translation differences 236 246 -433 -187 Classification adjustment 725 - -725 -725 Increases 385 1,569 929 2,498 Decreases - - -1,332 -1,322 Transfers between categories 146 - -146 -146 Acquisition cost, 30 Sept. 2019 11,114 43,593 26,122 69,715 Accumulated depreciation, 1 Jan. 2019
9,280
-
23,392
23,392
Translation differences 79 39 -274 -235 Accumulated depreciation of decreases
-
-
-931
-931
Depreciation during the period 826 8,072 476 8,548 Accumulated depreciation, 30 Sept. 2019
10,185
8,111
22,663
30,774
Book value, 30 Sept. 2019 929 35,482 3,459 38,941 Book value, 1 Jan. 2019 342 - 4,438 4,438 Book value, 30 Sept. 2019 929 35,482 3,459 38,941 Acquisition cost, 1 Jan. 2020 10,453 46,598 28,209 74,808 Translation differences -252 -450 -390 -840 Increases 156 4,673 1,083 5,756 Transfers between categories 484 - -484 -484 Acquisition cost, 30 Sept. 2020 10,841 50,820 28,418 79,239 Accumulated depreciation, 1 Jan. 2020
9,860
10,833
23,544
34,377
Translation differences -227 -188 -397 -585 Depreciation during the period 293 8,211 898 9,109 Accumulated depreciation, 30 Sept. 2020
9,926
18,856
24,045
42,901
Book value, 30 Sept. 2020 915 31,965 4,373 36,338
Book value, 1 Jan. 2020 593 35,766 4,665 40,431 Book value, 30 Sept. 2020 915 31,965 4,373 36,338

Interim Report 1---9/2020
21 (23)
KEY FIGURES
1–9/2020
1–9/2019
Change,
%
1–12/2019
Earnings per share, EUR 1.27 1.34 -6 1.61 Equity per share, EUR 6.09 4.53 34 4.80 Return on equity (ROE), % 28.9 31.1 33.0 Return on investment (ROI), % 20.7 17.3 17.9 Equity ratio, % 44.6 39.8 40.2 Gearing, % 9.2 40.5 27.0 Gross investments, EUR 1,000 1,240 1,314 -6 2,594 Gross investments, % of net sales 1 1 2 Contingent liabilities, EUR 1,000 700 572 22 617 Average personnel 437 439 0 442 Personnel at the end of the period 428 437 -2 450 Number of shares outstanding at the end of the period 8,109,834 8,109,834 8,109,834 Average number of shares outstanding 8,109,834 8,097,015 8,100,246
The figures for gross investments do not include the impact of IFRS 16.
NET SALES BY MARKET AREA
(EUR 1,000)
7–9/
2020
7–9/
2019
Change,
%
1–9/
2020
1–9/
2019
Change,
%
1–12/ 2019
Finland 22,972 19,661 17 47,924 49,229 -3 71,163 Retail sales 14,597 14,618 0 31,281 36,423 -14 51,918 Wholesale sales 8,329 5,008 66 16,546 12,643 31 19,012 Licensing income 46 35 33 97 163 -40 233
Scandinavia 2,779 2,468 13 6,715 6,687 0 9,297 Retail sales 1,348 1,509 -11 3,156 3,967 -20 5,434 Wholesale sales 1,431 960 49 3,559 2,720 31 3,862 Licensing income - - - - -
EMEA 4,013 2,781 44 9,980 9,425 6 11,992 Retail sales 490 347 41 1,583 1,096 44 1,568 Wholesale sales 3,409 2,344 45 8,093 8,044 1 9,980 Licensing income 113 90 26 305 285 7 443
North America 1,624 2,294 -29 4,756 6,214 -23 8,257 Retail sales 1,077 1,650 -35 2,863 4,109 -30 5,798 Wholesale sales 468 582 -20 1,751 1,674 5 1,987 Licensing income 79 62 28 142 431 -67 472
Asia-Pacific 6,623 7,247 -9 16,834 19,148 -12 24,712 Retail sales 661 1,039 -36 2,383 3,062 -22 4,378 Wholesale sales 5,362 5,007 7 12,852 14,887 -14 18,733 Licensing income 600 1,200 -50 1,600 1,200 33 1,600
International sales, total 15,039
14,790 2 38,286
41,475 -8
54,256
Retail sales 3,576 4,545 -21 9,984 12,234 -18 17,178 Wholesale sales 10,671 8,893 20 26,254 27,325 -4 34,562 Licensing income 792 1,352 -41 2,047 1,916 7 2,516
Total 38,011 34,451 10 86,210 90,704 -5 125,419 Retail sales 18,173 19,163 -5 41,265 48,657 -15 69,096 Wholesale sales 19,000 13,901 37 42,801 39,968 7 53,574 Licensing income 839 1,387 -40 2,144 2,079 3 2,748
Interim Report 1---9/2020
22 (23)
STORES AND SHOP-IN-SHOPS
30.9.2020
30.9.2019
31.12.2019
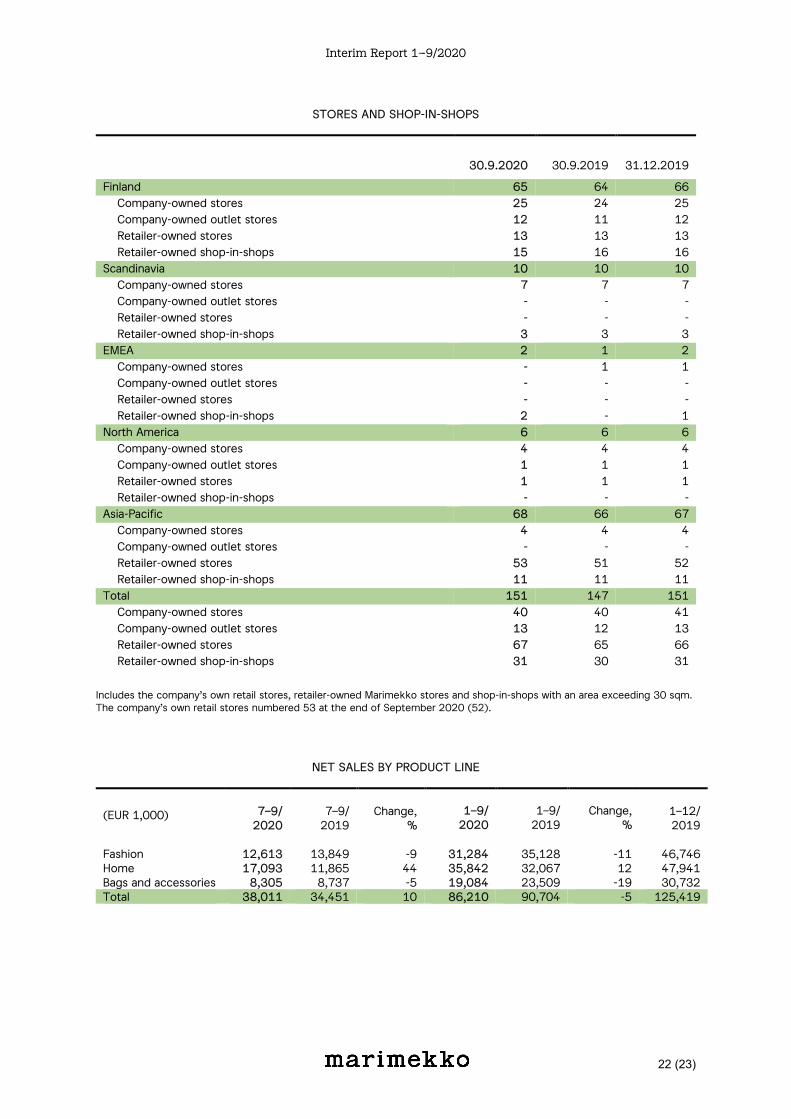
Finland 65 64 66 Company-owned stores 25 24 25 Company-owned outlet stores 12 11 12 Retailer-owned stores 13 13 13 Retailer-owned shop-in-shops 15 16 16 Scandinavia 10 10 10 Company-owned stores 7 7 7 Company-owned outlet stores - - - Retailer-owned stores - - - Retailer-owned shop-in-shops 3 3 3 EMEA 2 1 2 Company-owned stores - 1 1 Company-owned outlet stores - - - Retailer-owned stores - - - Retailer-owned shop-in-shops 2 - 1 North America 6 6 6 Company-owned stores 4 4 4 Company-owned outlet stores 1 1 1 Retailer-owned stores 1 1 1 Retailer-owned shop-in-shops - - - Asia-Pacific 68 66 67 Company-owned stores 4 4 4 Company-owned outlet stores - - - Retailer-owned stores 53 51 52 Retailer-owned shop-in-shops 11 11 11 Total 151 147 151 Company-owned stores 40 40 41 Company-owned outlet stores 13 12 13 Retailer-owned stores 67 65 66 Retailer-owned shop-in-shops 31 30 31
Includes the company’s own retail stores, retailer-owned Marimekko stores and shop-in-shops with an area exceeding 30 sqm. The company’s own retail stores numbered 53 at the end of September 2020 (52).
NET SALES BY PRODUCT LINE
(EUR 1,000)
7–9/
2020
7–9/
2019
Change,
%
1–9/
2020
1–9/
2019
Change,
%
1–12/ 2019
Fashion 12,613 13,849 -9 31,284 35,128 -11 46,746 Home 17,093 11,865 44 35,842 32,067 12 47,941 Bags and accessories 8,305 8,737 -5 19,084 23,509 -19 30,732 Total 38,011 34,451 10 86,210 90,704 -5 125,419

Interim Report 1---9/2020
23 (23)
QUARTERLY TREND IN NET SALES AND EARNINGS
(EUR 1,000)
7–9/2020
4–6/2020
1–3/2020
10–12/2019
Net sales 38,011 23,327 24,872 34,716 Operating profit 10,514 2,661 1,208 3,013 Earnings per share, EUR 0.98 0.27 0.02 0.26
(EUR 1,000)
7–9/2019
4–6/2019
1–3/2019
10–12/2018
Net sales 34,451 29,137 27,116 29,740 Operating profit 7,823 3,691 2,591 1,237 Earnings per share, EUR 0.79 0.32 0.24 0.11
FORMULAS FOR KEY FIGURES Comparable EBITDA, EUR: Operating result - depreciation - impairments - items affecting comparability Comparable operating result, EUR: Operating result - items affecting comparability in operating result Comparable operating result margin, % Operating result - items affecting comparability in operating result x 100 / Net sales Earnings per share (EPS), EUR: (Profit before taxes - income taxes) / Adjusted number of shares (average for the financial year) Equity per share, EUR: Shareholders’ equity / Number of shares, 30 September Return on equity (ROE), %: Rolling 12 months (Profit before taxes - income taxes) x 100 / Shareholders’ equity (average for the financial year) Return on investment (ROI), %: Rolling 12 months (Profit before taxes + interest and other financial expenses) x 100 / Balance sheet total - non-interest-bearing liabilities (average for the financial year) Equity ratio, %: Shareholders’ equity x 100 / (Balance sheet total - advances received) Gearing, %: Interest-bearing net debt x 100 / Shareholders’ equity Net working capital, EUR: Inventories + trade and other receivables + current tax assets - tax liabilities - current provisions - trade and other payables Net debt / EBITDA: Interest-bearing net debt / Comparable rolling 12-month EBITDA