Embed Size (px)
Citation preview

1
INTERIM FINANCIAL REPORT
30 June 2017
This document is a full free translation of the original French text. In case of discrepancies, the French
version shall prevail.
2017 Interim Financial Report 2
C O N T E N T S
SELECTED FINANCIAL INFORMATION ................................................................................................ 3
QUARTERLY REVENUE GROWTH .................................................................................................................... 3
KEY FIGURES FOR THE PERIOD ..................................................................................................................... 3
INTERIM MANAGEMENT REPORT ........................................................................................................ 3
INTERIM HIGHLIGHTS ............................................................................................................................... 3
REVENUE BY GEOGRAPHICAL AREA ................................................................................................................. 4
RESULTS BY GEOGRAPHICAL AREA ................................................................................................................. 5
ANALYSIS OF CONDENSED INTERIM CONSOLIDATED FINANCIAL STATEMENTS ................................................................. 5
RELATED PARTIES ................................................................................................................................... 7
PRINCIPAL RISKS AND UNCERTAINTIES FOR THE SECOND HALF OF 2017 ..................................................................... 7
OUTLOOK FOR THE SECOND HALF OF 2017 ...................................................................................................... 7
CONDENSED CONSOLIDATED INTERIM FINANCIAL STATEMENTS TO 30 JUNE 2017 .......................... 8
CONSOLIDATED STATEMENT OF FINANCIAL POSITION ............................................................................................ 8
CONSOLIDATED INCOME STATEMENT .............................................................................................................. 9
CONSOLIDATED STATEMENT OF TOTAL COMPREHENSIVE INCOME ............................................................................. 10
CONSOLIDATED STATEMENT OF CASH FLOWS ................................................................................................... 10
CONSOLIDATED STATEMENT OF CHANGES IN EQUITY .......................................................................................... 12
NOTES TO THE CONDENSED INTERIM CONSOLIDATED FINANCIAL STATEMENTS FOR THE SIX MONTHS TO 30 JUNE 2017 .............. 14
STATUTORY AUDITORS’ REPORT ...................................................................................................... 37
STATEMENT BY THE PERSON RESPONSIBLE FOR THE INTERIM FINANCIAL REPORT ........................ 38

2017 Interim Financial Report 3
SELECTED FINANCIAL INFORMATION
QUARTERLY REVENUE GROWTH
In millions of euros, quarterly figures unaudited
Q1 2017 restated(2)
Q1 2016 restated(2)
Var. Q2
2017
Q2 2016 restated(2)
Var. H1
2017 H1 2016
restated(2) Var.
Revenue 131.2 115.1 14.0% 125.3 123.0 1.9% 256.5 238.1 7.7%
KEY FIGURES FOR THE PERIOD
In millions of euros(1) 30.06.2017 30.06.2016 restated(2)
30.06.2016 presented(3)
Variation growth(4)
Organic growth(5)
Revenue 256.5 238.1 275.4 +7.7% +7.7%
Operating margin 25.4 22.0 22.7 +15.8%
In % of the revenue 9.9% 9.2% 8.2% +0.7 pts
Operating income 21.7 15.8 16.5 +37.4%
In % of the revenue 8.5% 6.6% 6.0% +1.8 pts
Net income - Group share 11.9 7.6 7.6 +57.1%
Diluted earnings per share(6) €1.50 €0.98 €0.98 +53.8%
Net cash at closing(7) 49.0 39.5 39.5 +€9.6m
(1)The financial statements as presented were approved by the Supervisory Board on 4 September 2017.
(2)Restatement of Between: in accordance with IFRS 5 on assets held for sale, the operations of Between have been reclassified on a single line of the income statement under “Profit (loss) from discontinued operations, net of tax”. As a consequence, these operations are not included in the revenue and the operating
income.
(3)In the 2016 interim financial report.
(4)Based on H1 2016 restated.
(5)At comparable perimeter and exchange rates, based on H1 2016 restated.
(6)Based on the weighted average number of shares for the year.
(7)Cash position net of all financial debts.
INTERIM MANAGEMENT REPORT
INTERIM HIGHLIGHTS
The first half of 2017 once again saw significant business and earnings growth. Restated for Between,
revenue in the first half of 2017 totalled €256.5 million, versus €238.1 million in the first half of 2016, up
7.7% at constant scope and exchange rates. Operating margin rose 70 basis points to €25.4 million, or
9.9% of revenue, compared with €22.0 million and 9.2% of revenue in the first half of 2016.
The Group announced two major changes in scope, enabling it to push forward in the direction envisaged in
the Scale! strategic plan.
On 21 July 2017, Devoteam signed a memorandum of understanding to transfer 40% of the capital to the
minority shareholders of Between, its Dutch brokerage subsidiary. The Group will retain a 35% stake in the
company. The transaction is due to be finalised in September 2017. In accordance with IFRS 5, net income
and expenses from this business have been restated in the Group’s consolidated income statement and are
now recognised under “Profit (loss) from discontinued operations, net of tax". Previous periods have been
restated to keep the method unchanged from one period to another.
On 6 August 2017, the Group also signed an agreement which will lead to the acquisition of a majority
stake of 80% in D2SI, a Public Cloud specialist and one of the leading French providers of Cloud solutions of
Amazon Web Services. D2SI supports its customers in the fields of automation, modernisation and
development of application portfolio, and the deployment of Big Data solutions. Furthermore, D2SI benefits
from a significant market visibility and credibility, as the organizer of the TIAD (The Incredible Automation
Day), the leading event on IT automation in France. The company employs circa 100 people and generated
2017 Interim Financial Report 4
revenues of €13 million in 2016. This acquisition will be consolidated as of 1 October 2017. It is fully in line
with the ambitions and dynamic set out in the Scale! strategic plan. It will strengthen Devoteam’s
positioning with its Agile IT Platform, as well as its ability to support robust growth in the Public Cloud
alongside the three market leaders (AWS, Google and Microsoft).
These two transactions are in addition to the acquisition of 80% of TMNS announced on 16 May. This will
bolster the Group’s position in the Benelux region, one of four key regions for the Scale! strategy. TMNS
specialises in consulting and the integration of Enterprise Architect, API management and Devops solutions,
which are necessary for the transformation and urbanisation of core IT to facilitate the digitalisation of
operations. The ability to build a link between the existing offering – mainly on-premise IT – and third-party
Cloud applications is key to enabling large organisations to leverage their assets and past investments,
while benefiting from powerful new growth accelerators. TMNS has approximately 200 employees and
generated revenue of around €18 million in 2016. Its profitability is in line with the Group’s. This acquisition
will be consolidated from 1 July 2017.
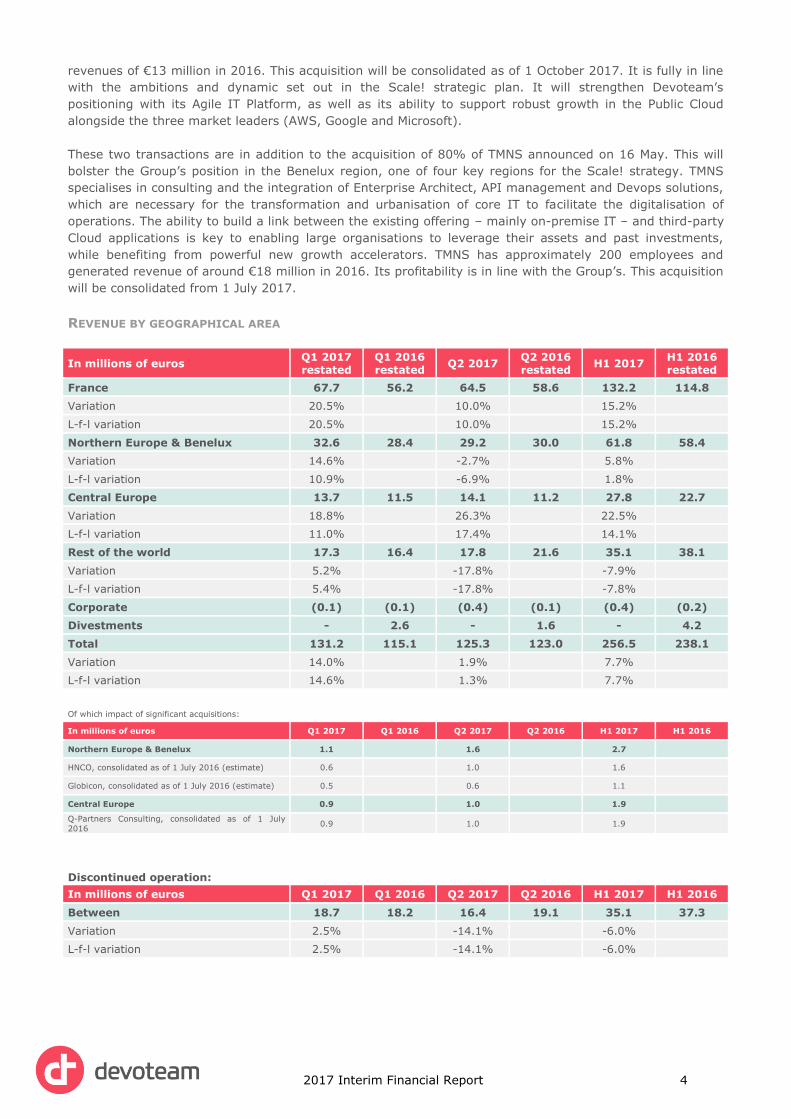
REVENUE BY GEOGRAPHICAL AREA
In millions of euros Q1 2017 restated
Q1 2016 restated
Q2 2017 Q2 2016 restated
H1 2017 H1 2016 restated
France 67.7 56.2 64.5 58.6 132.2 114.8
Variation 20.5% 10.0% 15.2%
L-f-l variation 20.5% 10.0% 15.2%
Northern Europe & Benelux 32.6 28.4 29.2 30.0 61.8 58.4
Variation 14.6% -2.7% 5.8%
L-f-l variation 10.9% -6.9% 1.8%
Central Europe 13.7 11.5 14.1 11.2 27.8 22.7
Variation 18.8% 26.3% 22.5%
L-f-l variation 11.0% 17.4% 14.1%
Rest of the world 17.3 16.4 17.8 21.6 35.1 38.1
Variation 5.2% -17.8% -7.9%
L-f-l variation 5.4% -17.8% -7.8%
Corporate (0.1) (0.1) (0.4) (0.1) (0.4) (0.2)
Divestments - 2.6 - 1.6 - 4.2
Total 131.2 115.1 125.3 123.0 256.5 238.1
Variation 14.0% 1.9% 7.7%
L-f-l variation 14.6% 1.3% 7.7%
Of which impact of significant acquisitions:
In millions of euros Q1 2017 Q1 2016 Q2 2017 Q2 2016 H1 2017 H1 2016
Northern Europe & Benelux 1.1 1.6 2.7
HNCO, consolidated as of 1 July 2016 (estimate) 0.6 1.0 1.6
Globicon, consolidated as of 1 July 2016 (estimate) 0.5 0.6 1.1
Central Europe 0.9 1.0 1.9
Q-Partners Consulting, consolidated as of 1 July
2016 0.9 1.0 1.9
Discontinued operation:
In millions of euros Q1 2017 Q1 2016 Q2 2017 Q2 2016 H1 2017 H1 2016
Between 18.7 18.2 16.4 19.1 35.1 37.3
Variation 2.5% -14.1% -6.0%
L-f-l variation 2.5% -14.1% -6.0%

2017 Interim Financial Report 5
RESULTS BY GEOGRAPHICAL AREA
In millions of euros H1 2017 H1 2016 restated
France
Contribution to revenue 132.2 114.8
Operating margin 17.0 14.8
As % of revenue 12.9% 12.9%
Northern Europe & Benelux
Contribution to revenue 61.8 58.4
Operating margin 4.6 4.3
As % of revenue 7.4% 7.4%
Central Europe
Contribution to revenue 27.8 22.7
Operating margin 2.4 1.7
As % of revenue 8.5% 7.5%
Rest of the world
Contribution to revenue 35.1 38.1
Operating margin 2.1 2.3
As % of revenue 5.9% 6.1%
Corporate
Contribution to revenue (0.4) (0.2)
Operating margin (0.6) (1.1)
Divestments
Contribution to revenue - 4.2
Operating margin - (0.1)
As % of revenue - -1.9%
Total
Contribution to revenue 256.5 238.1
Operating margin 25.4 22.0
As % of revenue 9.9% 9.2%
Discontinued operation:
In millions of euros H1 2017 H1 2016
Between
Contribution to revenue 35.1 37.3
Operating margin 0.7 0.7
As % of revenue 2.1% 1.8%
ANALYSIS OF THE CONDENSED INTERIM CONSOLIDATED FINANCIAL STATEMENTS
Analysis of the consolidated income statement
Consolidated revenue amounted to €256.5 million, up 7.7% from the prior period at constant scope and
exchange rates.
Operating margin, defined as current operating result before the impact of share-based payments and the
amortisation of intangible assets from acquisitions, stood at €25.4 million. As a percentage of revenue,
operating margin is 9.9%, an improvement of nearly 70 basis points in the first half of 2017. The margin
rate benefited from improved margins on contracts and from the relutive effect of the divestment in
Between.
Operating result came to €21.7 million in the first half of 2017, compared with €15.8 million in the same
period of 2016. It includes non-recurring expenses in the amount of €2.6 million, share-based
compensation expenses for €1.0 million and amortisation of intangible assets of acquired companies for
€0.1 million. Non-recurring expenses comprised €1.6 million in restructuring costs, mainly in Spain,
Germany and France, and €1.0 million in impairment losses on the Devoteam Netherlands CGU.
The net financial loss of -€0.9 million is a slight improvement on -€1.1 million in June 2016, mainly due to
currency gains recorded on the Turkish lira.
2017 Interim Financial Report 6
Income tax expense came to €7.8 million, an increase of €1.9 million compared with the first half of
2016, reflecting the improvement in the Group’s results. It represented 37.3% of the profit before tax,
against 40.7% in the first half of 2016. The tax expense included the effect of additional local taxes (mainly
CVAE in France) for €1.5 million (versus €1.2 million at 30 June 2016).
Net income totalled €13.6 million, compared with €9.2 million a year earlier, of which €1.7 million was
returned to the minority shareholders of subsidiaries. Diluted earnings per share amounted to €1.50 (versus
€0.98 at 30 June 2016).
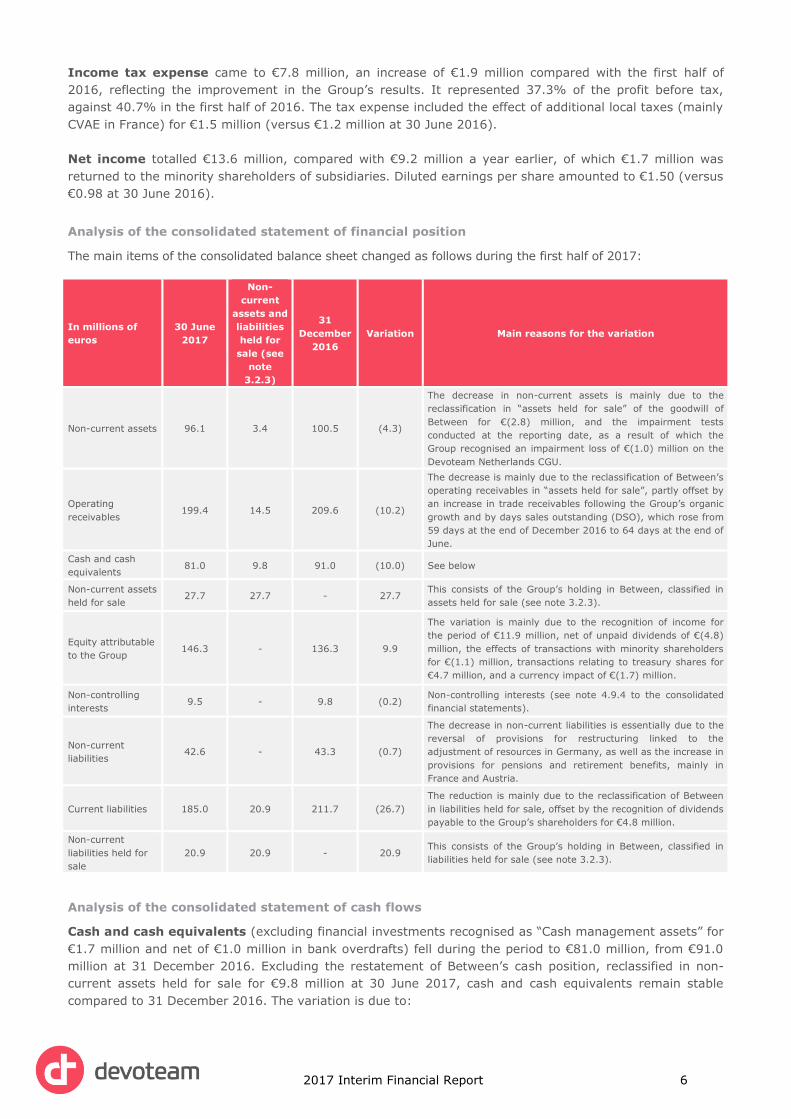
Analysis of the consolidated statement of financial position
The main items of the consolidated balance sheet changed as follows during the first half of 2017:
In millions of
euros
30 June
2017
Non-
current
assets and
liabilities
held for
sale (see
note
3.2.3)
31
December
2016
Variation Main reasons for the variation
Non-current assets 96.1 3.4 100.5 (4.3)
The decrease in non-current assets is mainly due to the
reclassification in “assets held for sale” of the goodwill of
Between for €(2.8) million, and the impairment tests
conducted at the reporting date, as a result of which the
Group recognised an impairment loss of €(1.0) million on the
Devoteam Netherlands CGU.
Operating
receivables 199.4 14.5 209.6 (10.2)
The decrease is mainly due to the reclassification of Between’s
operating receivables in “assets held for sale”, partly offset by
an increase in trade receivables following the Group’s organic
growth and by days sales outstanding (DSO), which rose from
59 days at the end of December 2016 to 64 days at the end of
June.
Cash and cash
equivalents 81.0 9.8 91.0 (10.0) See below
Non-current assets
held for sale 27.7 27.7 - 27.7
This consists of the Group’s holding in Between, classified in
assets held for sale (see note 3.2.3).
Equity attributable
to the Group 146.3 - 136.3 9.9
The variation is mainly due to the recognition of income for
the period of €11.9 million, net of unpaid dividends of €(4.8)
million, the effects of transactions with minority shareholders
for €(1.1) million, transactions relating to treasury shares for
€4.7 million, and a currency impact of €(1.7) million.
Non-controlling
interests 9.5 - 9.8 (0.2)
Non-controlling interests (see note 4.9.4 to the consolidated
financial statements).
Non-current
liabilities 42.6 - 43.3 (0.7)
The decrease in non-current liabilities is essentially due to the
reversal of provisions for restructuring linked to the
adjustment of resources in Germany, as well as the increase in
provisions for pensions and retirement benefits, mainly in
France and Austria.
Current liabilities 185.0 20.9 211.7 (26.7)
The reduction is mainly due to the reclassification of Between
in liabilities held for sale, offset by the recognition of dividends
payable to the Group’s shareholders for €4.8 million.
Non-current
liabilities held for
sale
20.9 20.9 - 20.9 This consists of the Group’s holding in Between, classified in
liabilities held for sale (see note 3.2.3).
Analysis of the consolidated statement of cash flows
Cash and cash equivalents (excluding financial investments recognised as “Cash management assets” for
€1.7 million and net of €1.0 million in bank overdrafts) fell during the period to €81.0 million, from €91.0
million at 31 December 2016. Excluding the restatement of Between’s cash position, reclassified in non-
current assets held for sale for €9.8 million at 30 June 2017, cash and cash equivalents remain stable
compared to 31 December 2016. The variation is due to:
2017 Interim Financial Report 7
Negative cash flow from operating activities of €3.3 million, compared with +€5.8 million in the
first half of 2016. This is primarily explained by the higher seasonal increase in working capital
requirement, which was €(20.9) million, up from €(13.3) million at the end of June 2016, and by
the increase in taxes paid in the first half, at €(4.5) million, partly offset by an improvement in cash
flow compared with the first half of 2016, in the amount of €2.9 million.
Negative cash flow from investing activities of €2.7 million during the period, including €0.5
million linked to the acquisition of financial assets, €1.8 million spent on capital assets (mainly
improvements to business premises and IT equipment for the Group’s operational needs) and €0.5
million corresponding to the contingent consideration due on the acquisition of subsidiaries.
Positive cash flow from financing activities of €6.7 million, versus €(1.7) million in the first half
of 2016. This mainly includes the positive effect of transactions on treasury shares during the period
for €5.6 million, the increase in factored receivables for €4.0 million, and the impact of transactions
with minority shareholders for a net amount of €(1.8) million.
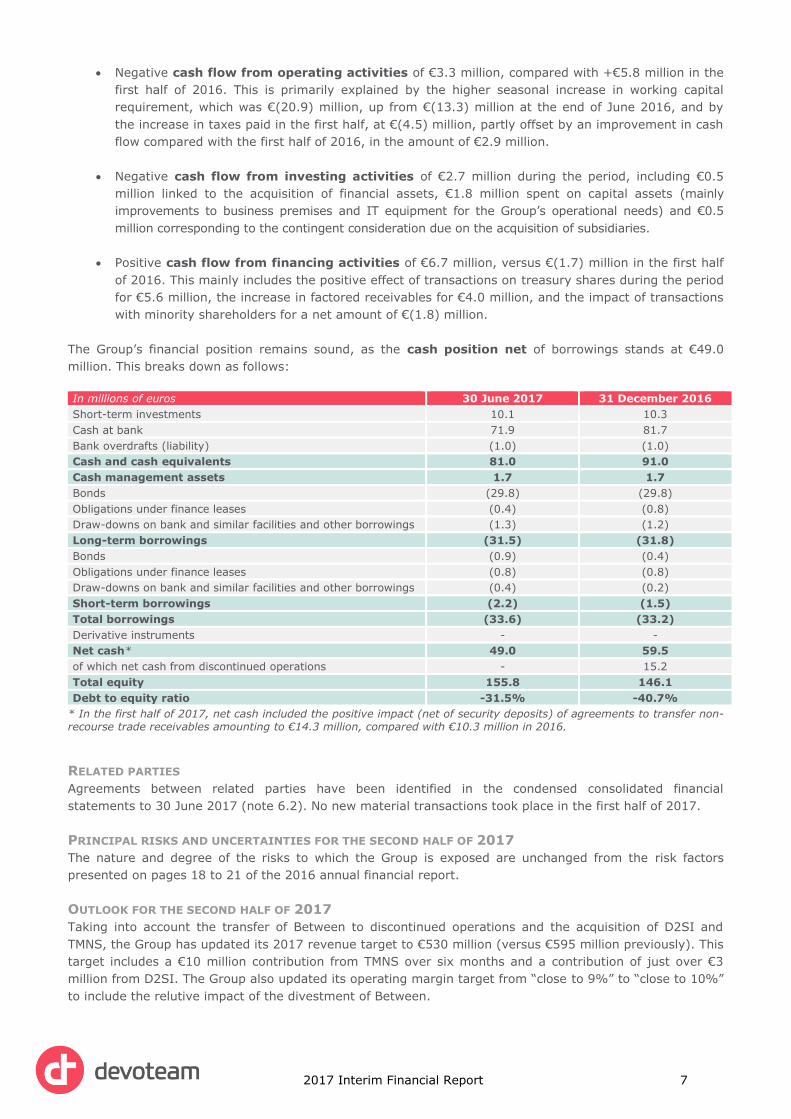
The Group’s financial position remains sound, as the cash position net of borrowings stands at €49.0
million. This breaks down as follows:
In millions of euros 30 June 2017 31 December 2016
Short-term investments 10.1 10.3
Cash at bank 71.9 81.7
Bank overdrafts (liability) (1.0) (1.0)
Cash and cash equivalents 81.0 91.0
Cash management assets 1.7 1.7
Bonds (29.8) (29.8)
Obligations under finance leases (0.4) (0.8)
Draw-downs on bank and similar facilities and other borrowings (1.3) (1.2)
Long-term borrowings (31.5) (31.8)
Bonds (0.9) (0.4)
Obligations under finance leases (0.8) (0.8)
Draw-downs on bank and similar facilities and other borrowings (0.4) (0.2)
Short-term borrowings (2.2) (1.5)
Total borrowings (33.6) (33.2)
Derivative instruments - -
Net cash* 49.0 59.5
of which net cash from discontinued operations - 15.2
Total equity 155.8 146.1
Debt to equity ratio -31.5% -40.7%
* In the first half of 2017, net cash included the positive impact (net of security deposits) of agreements to transfer non-recourse trade receivables amounting to €14.3 million, compared with €10.3 million in 2016.
RELATED PARTIES
Agreements between related parties have been identified in the condensed consolidated financial
statements to 30 June 2017 (note 6.2). No new material transactions took place in the first half of 2017.
PRINCIPAL RISKS AND UNCERTAINTIES FOR THE SECOND HALF OF 2017
The nature and degree of the risks to which the Group is exposed are unchanged from the risk factors
presented on pages 18 to 21 of the 2016 annual financial report.
OUTLOOK FOR THE SECOND HALF OF 2017
Taking into account the transfer of Between to discontinued operations and the acquisition of D2SI and
TMNS, the Group has updated its 2017 revenue target to €530 million (versus €595 million previously). This
target includes a €10 million contribution from TMNS over six months and a contribution of just over €3
million from D2SI. The Group also updated its operating margin target from “close to 9%” to “close to 10%”
to include the relutive impact of the divestment of Between.

2017 Interim Financial Report 8
CONDENSED CONSOLIDATED INTERIM FINANCIAL STATEMENTS TO 30 JUNE 2017
CONSOLIDATED STATEMENT OF FINANCIAL POSITION
ASSETS (in thousands of euros) Note 30 June 2017 31 December 2016
Goodwill 4.3 77,233 81,154
Other intangible assets 4.1 1,881 1,557
Tangible assets 4.2 5,532 5,471
Non-current financial assets 4.4 3,215 2,935
Investments in associates 4.5 997 900
Investments property 4.6 1,599 1,827
Deferred tax assets - 5,532 6,353
Other non-current assets 4.12 154 272
TOTAL NON-CURRENT ASSETS 96,144 100,469
Trade receivables 4.7 151,789 163,599
Other receivables 4.7 30,468 29,788
Tax receivables 4.7 13,639 11,794
Other current financial assets 4.8.1 1,821 2,762
Cash management assets 4.8.2 1,670 1,670
Cash and cash equivalents 4.8.2 82,024 92,033
TOTAL CURRENT ASSETS 281,411 301,647
Non-current assets held for sale 3.2.3 27,725 -
TOTAL ASSETS 405,280 402,117
EQUITY& LIABILITIES (in thousands of euros) Note 30 June 2017 31 December 2016
Share capital 4.9.1 1,262 1,262
Share premium 1,845 1,845
Consolidated reserves 136,127 125,223
Treasury shares (3,212) (11,839)
Translation reserves (1,655) 42
Profit for the year 11,918 19,807
TOTAL EQUITY ATTRIB. TO EQUITY HOLDERS OF PARENT
COMPANY 146,285 136,341
Non-controlling interests 4.9.4 9,545 9,778
TOTAL EQUITY 155,829 146,119
Loans and borrowings 4.10 31,477 31,765
Provisions 4.11 5,639 6,056
Deferred tax liabilities - 585 750
Other liabilities 4.12 4,854 4,712
TOTAL NON-CURRENT LIABILITIES 42,556 43,283
Loans, borrowings and bank overdraft 4.10 3,177 2,473
Provisions 4.11 3,069 3,059
Trade payables 4.7 31,558 64,646
Tax and social security liabilities 4.7 80,772 80,044
Income tax payable 4.7 3,159 3,573
Other liabilities 4.7 64,222 58,920
TOTAL CURRENT LIABILITIES 185,957 212,715
Non-current liabilities held for sale 3.2.3 20,938 -
TOTAL LIABILITIES 249,450 255,998
TOTAL EQUITY & LIABILITIES 405,280 402,117
2017 Interim Financial Report 9
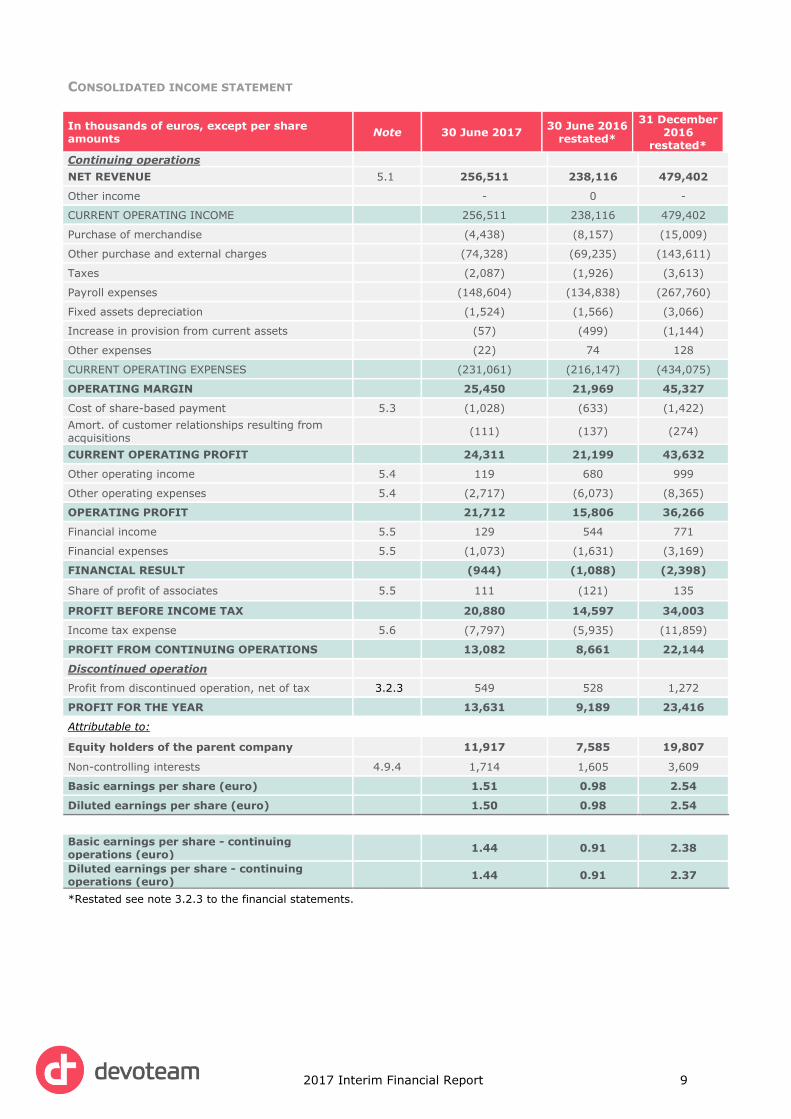
CONSOLIDATED INCOME STATEMENT
In thousands of euros, except per share amounts
Note 30 June 2017 30 June 2016
restated*
31 December 2016
restated*
Continuing operations
NET REVENUE 5.1 256,511 238,116 479,402
Other income - 0 -
CURRENT OPERATING INCOME 256,511 238,116 479,402
Purchase of merchandise (4,438) (8,157) (15,009)
Other purchase and external charges (74,328) (69,235) (143,611)
Taxes (2,087) (1,926) (3,613)
Payroll expenses (148,604) (134,838) (267,760)
Fixed assets depreciation (1,524) (1,566) (3,066)
Increase in provision from current assets (57) (499) (1,144)
Other expenses (22) 74 128
CURRENT OPERATING EXPENSES (231,061) (216,147) (434,075)
OPERATING MARGIN 25,450 21,969 45,327
Cost of share-based payment 5.3 (1,028) (633) (1,422)
Amort. of customer relationships resulting from acquisitions
(111) (137) (274)
CURRENT OPERATING PROFIT 24,311 21,199 43,632
Other operating income 5.4 119 680 999
Other operating expenses 5.4 (2,717) (6,073) (8,365)
OPERATING PROFIT 21,712 15,806 36,266
Financial income 5.5 129 544 771
Financial expenses 5.5 (1,073) (1,631) (3,169)
FINANCIAL RESULT (944) (1,088) (2,398)
Share of profit of associates 5.5 111 (121) 135
PROFIT BEFORE INCOME TAX 20,880 14,597 34,003
Income tax expense 5.6 (7,797) (5,935) (11,859)
PROFIT FROM CONTINUING OPERATIONS 13,082 8,661 22,144
Discontinued operation
Profit from discontinued operation, net of tax 3.2.3 549 528 1,272
PROFIT FOR THE YEAR 13,631 9,189 23,416
Attributable to:
Equity holders of the parent company 11,917 7,585 19,807
Non-controlling interests 4.9.4 1,714 1,605 3,609
Basic earnings per share (euro) 1.51 0.98 2.54
Diluted earnings per share (euro) 1.50 0.98 2.54
Basic earnings per share - continuing operations (euro)
1.44 0.91 2.38
Diluted earnings per share - continuing operations (euro)
1.44 0.91 2.37
*Restated see note 3.2.3 to the financial statements.
Note

2017 Interim Financial Report 10
CONSOLIDATED STATEMENT OF TOTAL COMPREHENSIVE INCOME
In thousands of euros 30 June 2017 30 June 2016
restated* 31 December
2016 restated*
Net income 13,631 9,189 23,416
Defined benefit plan actuarial gains (losses) (0) - (559)
Deferred taxes on defined benefit plan actuarial gains (losses) 0 0 150
Items that will never be reclassified to profit or loss (0) 0 (409)
Foreign currency translation differences (1,849) (164) 496
Items that are or may be reclassified subsequently to profit or loss
(1,849) (164) 496
Other comprehensive income (loss) for the year, net of income tax
(1,849) (164) 87
Total comprehensive income for the year 11,782 9,026 23,503
Attributable to:
Equity holders of the parent company 10,242 7,457 19,824
Non-controlling interests 1,540 1,569 3,679
*Restated see note 3.2.3 to the financial statements.

2017 Interim Financial Report 11
CONSOLIDATED STATEMENT OF CASH FLOWS
In thousands of euros 30 June 2017 30 June 2016 31 December
2016
Profit for the year 13,631 9,189 23,416
Adjustments for :
Share of profit of associates (111) 125 (132)
Income tax expense 7,979 6,094 12,289
Amortisation and provision 2,310 4,224 6,193
Other transactions without impact on cash and cash equivalents 696 484 1,031
Income from asset disposals (3) 1,816 819
Net interests income 851 523 1,373
Change in net working capital (20,917) (13,334) 9,219
Income tax paid (7,783) (3,279) (7,217)
Net cash from operating activities* (3,347) 5,843 46,991
Purchase of fixed assets (1,760) (1,449) (3,691)
Purchase of financial assets (540) (1,064) (966)
Proceed from sale of fixed assets 7 9 41
Dividends received 14 - 85
Proceed from sale of financial assets 130 506 1,930
Proceed of subsidiaries, net of cash divested - 0 892
Acquisition of subsidiaries, net of cash acquired (542) (346) (6,958)
Net cash from investing activities* (2,691) (2,345) (8,668)
Proceeds from issue of share capital 2 1,551 1,701
Repayments of borrowings (467) (571) (990)
Proceeds from borrowings 101 109 617
Change in factored receivables (net of security deposit) 4,002 403 (8,136)
Interests paid (316) (317) (1,634)
Acquisition of non-controlling interests (4,400) (3,634) (7,352)
Reduction in ownership interests while retaining control 2,569 78 189
Dividends paid (340) (171) (4,531)
Transactions on own shares and equity instruments 5,551 838 1,295
Net cash from financing activities* 6,703 (1,715) (18,841)
Net change in cash and cash equivalents 665 1,782 19,483
Net cash and cash equivalents at year start 91,013 71,039 71,039
Effect of non-current assets held for sale (9,783) (2,137) -
Effect of exchange rate fluctuation on cash held (876) (105) 491
Net cash and cash equivalents at the end of the period 81,018 70,580 91,013
Reconciliation with cash and cash equivalents in the balance sheet
Cash and cash equivalents in the balance sheet 82,024 72,052 92,033
Bank overdrafts (1,006) (1,473) (1,020)
Cash and cash equivalents in the consolidated statement of cash flows
81,018 70,580 91,013
* The contribution of non-current assets held for sale (Between) is presented in note 3.2.3 to the financial statements.

2017 Interim Financial Report 12
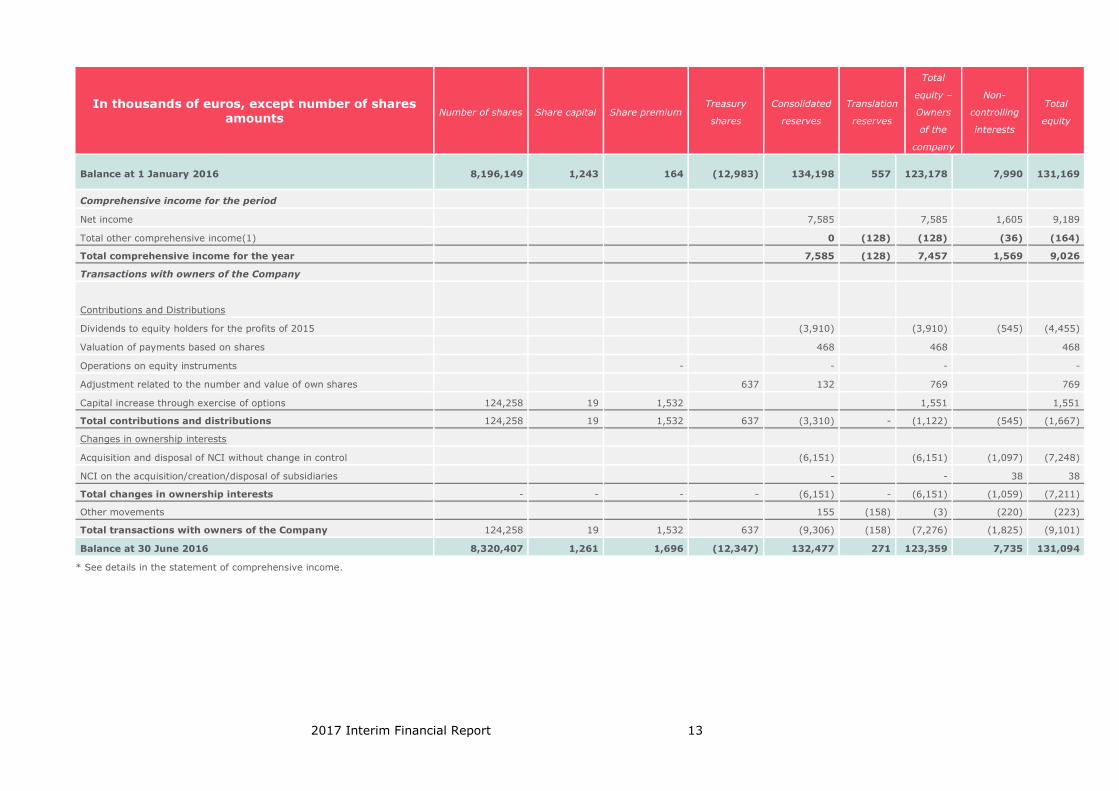
CONSOLIDATED STATEMENT OF CHANGES IN EQUITY
In thousands of euros, except number of shares amounts
Number of shares Share capital Share premium Treasury
shares
Consolidated
reserves
Translation
reserves
Total
equity -
Owners
of the
company
Non-
controlling
interests
Total
equity
Balance at 1 January 2017 8,327,907 1,262 1,845 (11,839) 145,030 42 136,341 9,778 146,119
Comprehensive income for the period
Net income 11,917 11,917 1,714 13,631
Total other comprehensive income(1) 22 (1,697) (1,675) (174) (1,849)
Total comprehensive income for the year 11,939 (1,697) 10,242 1,540 11,782
Transactions with owners of the Company
Contributions and Distributions
Dividends to equity holders for the profits of 2016 (4,786) (4,786) (659) (5,445)
Valuation of payments based on shares 680 680 680
Operations on equity instruments - - -
Adjustment related to the number and value of own shares 968 2,991 3,960 3,960
Capital increase through exercise of options - - - - -
Total contributions and distributions - - - 968 (1,115) - (146) (659) (806)
Changes in ownership interests
Acquisition and disposal of NCI without change in control (1,071) (1,071) (1,046) (2,117)
NCI on the acquisition/creation/disposal of subsidiaries - - (3) (3)
Total changes in ownership interests - - - - (1,071) - (1,071) (1,049) (2,120)
Other movements(2) 7,658 (6,740) - 919 (65) 854
Total transactions with owners of the Company - - - 8,627 (8,925) - (298) (1,773) (2,071)
Balance at 30 June 2017 8,327,907 1,262 1,845 (3,212) 148,045 (1,655) 146,285 9,544 155,830
(1) See details in the statement of comprehensive income.
(2) Other movements primarily related to reclassification in own shares from previous periods from consolidated reserves to treasury
shares.
2017 Interim Financial Report 13
In thousands of euros, except number of shares amounts
Number of shares Share capital Share premium Treasury
shares
Consolidated
reserves
Translation
reserves
Total
equity –
Owners
of the
company
Non-
controlling
interests
Total
equity
Balance at 1 January 2016 8,196,149 1,243 164 (12,983) 134,198 557 123,178 7,990 131,169
Comprehensive income for the period
Net income 7,585 7,585 1,605 9,189
Total other comprehensive income(1) 0 (128) (128) (36) (164)
Total comprehensive income for the year 7,585 (128) 7,457 1,569 9,026
Transactions with owners of the Company
Contributions and Distributions
Dividends to equity holders for the profits of 2015 (3,910) (3,910) (545) (4,455)
Valuation of payments based on shares 468 468 468
Operations on equity instruments - - - -
Adjustment related to the number and value of own shares 637 132 769 769
Capital increase through exercise of options 124,258 19 1,532 1,551 1,551
Total contributions and distributions 124,258 19 1,532 637 (3,310) - (1,122) (545) (1,667)
Changes in ownership interests
Acquisition and disposal of NCI without change in control (6,151) (6,151) (1,097) (7,248)
NCI on the acquisition/creation/disposal of subsidiaries - - 38 38
Total changes in ownership interests - - - - (6,151) - (6,151) (1,059) (7,211)
Other movements 155 (158) (3) (220) (223)
Total transactions with owners of the Company 124,258 19 1,532 637 (9,306) (158) (7,276) (1,825) (9,101)
Balance at 30 June 2016 8,320,407 1,261 1,696 (12,347) 132,477 271 123,359 7,735 131,094
* See details in the statement of comprehensive income.
2017 Interim Financial Report 14
NOTES TO THE CONDENSED CONSOLIDATED INTERIM FINANCIAL STATEMENTS FOR THE SIX MONTHS TO 30
JUNE 2017
(Amounts in thousands of euros, unless otherwise stated)
____________________
Note 1 – Nature of the business and significant events
Devoteam S.A. (the "Company"), created in 1995, is a limited liability company (société anonyme) governed by
French law.
Devoteam, a European consulting and engineering group, is a major player in business consulting in the
fields of innovative technologies and management. With 20 years of experience in innovative and disruptive
technologies, the Group supports its clients through the digital transformation of their organisational
structure and their businesses. The company’s condensed interim consolidated financial statements for the
six months to 30 June 2017 include the company and its subsidiaries (“the Group”), as well as the Group’s
share of the results of associates and jointly controlled companies.
During the six months to 30 June, the Group announced several major changes in scope enabling it to push
forward in the direction envisaged in its Scale! strategic plan unveiled on 19 January. These changes in
scope are detailed in the interim management report and in notes 3.2 and 7 below.
One of the changes in scope is the forthcoming partial disposal and loss of control of Between, previously
identified as a separate operating segment under IFRS 8. The Group therefore applied the principles of IFRS
5 on assets held for sale and discontinued operations to its condensed interim financial statements, which
required prior periods to be restated in the interim consolidated income statement (see note 3.2.3 for more
details).
The condensed consolidated interim financial statements to 30 June 2017 and the notes were prepared by
the Management Board and approved at its meeting of 4 September 2017.
Note 2 – Consolidation principles and methods
2.1 Statement of compliance
The condensed interim consolidated financial statements were prepared in accordance with IAS 34 “Interim
Financial Reporting”. They do not include all the information required for the annual financial statements and
should be read in conjunction with the 2016 financial report.
The IFRS applied to the interim financial statements to 30 June 2017 are those published in the Official Journal
of the European Union before 30 June 2017 and available on the website of the European Commission
(https://ec.europa.eu/info/business-economy-euro/company-reporting-and-auditing/company-
reporting/financial-reporting_fr). They are consistent with the IFRS published by the IASB.
The main new standards, amendments, improvements and interpretations effective as of 1 January 2017 have
no material impact on the consolidated financial statements to 30 June 2017. Furthermore, the Group chose
not to apply any standards, amendments or interpretations early.
Regarding the implementation of IFRS 15 on revenue recognition, the Group is continuing its analysis of the
potential impacts that the new standard will have on its consolidated financial statements. In the course of its
activities, the Group pays particular attention to the implications of the standard concerning the distinction
between agent and principal in certain transactions.
2017 Interim Financial Report 15
2.2 Basis of measurement and presentation currency
Unless otherwise stated, the financial statements are presented in thousands of euros (the company’s
functional currency), rounded to the nearest thousand. They are based on historical cost, except for the
following:
derivative financial instruments measured at fair value;
financial instruments at fair value through profit or loss;
available-for-sale financial assets measured at fair value;
investment property measured at fair value;
liabilities arising from share-based payments settled using treasury shares measured at fair value;
net liabilities (assets) in respect of defined-benefit plans.
2.3 Use of estimates and judgements
The preparation of financial statements under IFRS requires the use of judgements, estimates and assumptions
to determine the value of assets and liabilities and income and expenses for the period. These measurements
are based on the experience gained by the Group and other factors considered reasonable under the prevailing
circumstances. Actual amounts may differ from these estimates.
The estimates and assumptions are reviewed on an ongoing basis. The impact of changes in accounting
estimates is recognised during the period of the change, if the change affects that period only, or during the
period of the change and future periods, if the change affects both.
The significant judgements made by Management to apply the Group’s accounting policies in preparing the
condensed interim consolidated financial statements and the principal sources of uncertainty in the estimates
did not differ significantly from those affecting the consolidated financial statements for the year ended 31
December 2016.
2.4 Significant accounting policies
Basis of preparation of the interim consolidated financial statements
The accounting policies applied by the Group in the condensed consolidated interim financial statements are
identical to those used and described in the consolidated financial statements for the year ended 31 December
2016. These accounting policies have been applied consistently by all Group entities.

2017 Interim Financial Report 16
Note 3 – Scope of consolidation
3.1 Scope of consolidation
The consolidated financial statements to 30 June 2017 include the financial statements of Devoteam S.A. and the financial statements of companies controlled directly or indirectly by the Group, as well as companies over which the Group has significant influence. The main companies included in the scope of consolidation of the Devoteam Group are set out below. Entities without activity are not included below.
Companies (SIREN)
% share of capital
held(1)
Consolidation
method
Companies (SIREN)
% share of capital
held(1)
Consolidation
method
2017 2016 2017 2016 2017 2016 2017 2016
FRANCE SPAIN
Devoteam S.A. Parent
company
Parent
company
Parent
company
Parent
company
Devoteam Fringes
S.A.U. 100.00% 100.00% FC FC
Devoteam Consulting 80.20%(2) 100.00% FC FC Keivox 35.01% 35.01% EM EM
Devoteam Outsourcing 100.00% 100.00% FC FC DPI 60.00% 60.00% FC FC
Exaprobe ECS 35.00% 35.00% EM EM Drago Solution S.A.U. 60.00% 60.00% FC FC
S’team Management 92.00%(3) 78.00% FC FC Softoro Development
Center S.A.U. 60.00% 60.00% FC FC
Inflexsys 20.00% 20.00% EM EM Devoteam Cloud Services
80.30% 80.30% FC FC
Axance 54.07% 54.07% FC FC My-G work for Espana 100.00% 72.00% FC FC
RVR Parad 95.00% 95.00% FC FC IRELAND
Shift by Steam 65.50%(4) 60.00% FC FC Voxpilot Limited 100.00% 100.00% FC FC
Siticom 65.00% 65.00% FC FC ITALY
Devoteam G Cloud 100.00% 100.00% FC FC Devoteam Italy SRL 20.00% 20.00% FC FC
Be Team 70.00% 70.00% FC FC MOROCCO
Progis 24.89% 24.89% EM EM Devoteam SARL 100.00% 100.00% FC FC
Bengs 25.00% 25.00% EM EM Devoteam Services
SARL 100.00% 100.00% FC FC
Axance People 45.96% 45.96% FC FC Devoteam Consulting
Maroc 56.25% 56.25% FC FC
Devoteam Cloud Services 90.00% 90.00% FC FC Mexico
Devoteam Digital Factory 69.50%(5) 72.50% FC FC Devoteam Mexico 99.00% 99.00% FC FC
My-G 100.00%(6) 72.00% FC FC Devomex Cloud
Services 98.00%(11) 0.00% FC NC
Marflie 80.00%(7) 45.00% FC FC Panama
Technologies & Opérations 72.47% 72.47% FC FC Drago Solutions Corp.
Panama 60.00% 60.00% FC FC
Devoteam Customer
Effectiveness 58.97%(8) 77.53% FC FC POLAND
Fi-makers 72.00%(9) 80.00% FC FC Devoteam S.A.
(formerly Wola Info SA) 61.59% 61.59% FC FC
Myfowo.com 96.63%(10) 0.00% FC NC CZECH REPUBLIC
ALGERIA Devoteam s.r.o 80.00% 80.00% FC FC
Devoteam Consulting Algeria 80.00% 80.00% FC FC UNITED KINGDOM
GERMANY Devoteam UK Limited 100.00% 100.00% FC FC
Devoteam GmbH 100.00% 100.00% FC FC RUSSIA
Fontanet GmbH 100.00% 100.00% FC FC Media-Tel LLC 25.00% 25.00% EM EM
Q-Partners Consulting &
Management 70.00% 70.00% FC FC SCANDINAVIA
AUSTRIA Devoteam A/S 100.00% 100.00% FC FC
Devoteam Consulting GmbH 100.00% 100.00% FC FC HNCO International 0%(12) 100.00% NC FC
BENELUX HNCO Denmark 0%(12) 100.00% NC FC
Devoteam N/V 99.71% 99.71% FC FC Forretningssystemer
ApS 0%(12) 100.00% NC FC
DFSJ 45.00% 45.00% EM EM Globicon 100.00% 100.00% FC FC
Devoteam S.A.
(Luxembourg) 100.00% 100.00% FC FC Fornebu Consulting AS 100.00% 100.00% FC FC
Devoteam Consulting
Holding 100.00% 100.00% FC FC SWEDEN
Devoteam Communication 100.00% 100.00% FC FC HNCO AB 30.00% 30.00% EM EM
Devoteam Nederland BV 100.00% 100.00% FC FC TUNISIA
Between Holding BV 75.00% 75.00% FC FC Devoteam Tunisia 75.00% 75.00% FC FC
UNITED ARAB EMIRATES TURKEY
Devoteam Middle East FZ LLC
76.00% 76.00% FC FC
Devoteam Information
Technology and Consultancy A.S.
(formerly Secura)
100.00% 100.00% FC FC
FC: full consolidation.
EM: equity method.
NC: not consolidated.

2017 Interim Financial Report 17
(1) Represents the percentage of capital held directly or indirectly by Devoteam S.A.
(2) Disposal of 19.80% of the capital of Devoteam Consulting. The Group’s equity interest is now 80.20%.
(3) Acquisition of an additional 14% of S’team Management via the Marflie holding company.
(4) Acquisition of an additional 5.50% of the capital of Shift by Steam. The Group’s equity interest is now 65.50%.
(5) Disposal of 3% of the capital of Devoteam Digital Factory. The Group’s equity interest is now 69.50%.
(6) Acquisition of an additional 28% of the capital of My-G, via a reduction in the share capital by offsetting losses followed by a capital
increase without pre-emption rights. The Group’s equity interest is now 100%.
(7) Acquisition of an additional 35% of the capital of Marflie. The Group’s equity interest is now 80%.
(8) Reduction of the holding in Devoteam Customer Effectiveness to 58.97% following the sale of Devoteam Consulting shares.
(9) Disposal of 8% of the capital of Fi-makers. The Group’s equity interest is now 72%.
(10) Acquisition of 96.63% of the company Myfowo.com.
(11) Acquisition of 98.00% of the company Devomex Cloud Services.
(12) HNCO International, HNCO Denmark and Forretningssystemer ApS absorbed by Devoteam A/S.
3.2 Changes during the period
3.2.1 Acquisitions
On 21 March 2017, under the terms of a conciliation procedure before Nanterre Commercial Court, the Group
acquired 97% of the shares of Myfowo.com, a software company that develops innovative solutions for the
service sector. MyFowo.com generated revenue of €3.1 million in its last financial year ended 31 December
2016. It had 27 employees before the concomitant sale of part of its after-sales service business to an IT
company.
This acquisition has been fully consolidated since 1 April 2017.
Net assets of the acquired companies
In thousands of euros Myfowo.com
Fixed assets 826
Trade and other receivables 1,146
Cash and cash equivalents 83
Current and non-current provisions -
Trade and other payables (2,145)
Net assets and liabilities (90)
Goodwill Goodwill arising from the acquisition was calculated as follows:
In thousands of euros Myfowo.com
Consideration transferred as part of the takeover 42
Of which contingent consideration -
Non-controlling interest measured as a share of the net identifiable assets recorded (3)
Fair value of the interest previously acquired -
Less fair value of net identifiable assets 90
Goodwill 129
Acquisition accounting and evaluation period
Following the initial purchase price allocation for Myfowo.com, the Group recognised assets of €813 thousand
relating to the backlog and €215 thousand relating to tax losses.
The purchase price allocation for companies that were consolidated for the first time in the second half of 2016
(HerbertNathan & Co, Globicon and Q-Partners GmbH) will be finalised in the second half of 2017. The Group
does not expect there to be any significant changes.

2017 Interim Financial Report 18
The impact of the first-time consolidation carried out in the first half of 2017 and in 2016 (acquisitions and
controlling interests) on the Group’s financial statements is presented below:
In thousands of euros Transactions in 2017 Transactions in 2016*
Revenue 44 n/a
Current operating profit (17) n/a
Net income (19) n/a
Total assets 2,098 n/a
Changes in WCR 28 n/a
(*) HerbertNathan & Co, Globicon and Q-Partners GmbH.
The impact of acquisitions made in 2016 cannot be reliably reported since the most significant entities merged
on 1 January 2017 with other Group entities (see note 3.1).
3.2.2 Disposals
There were no disposals during the first half of 2017.
3.2.3 Assets held for sale
During the period, the Group received confirmed expressions of interest from minority shareholders for its
subsidiary Between, which is based in the Netherlands and specialises in the sourcing of IT professionals.
Between has around 30 employees and generated revenue of €76 million for its last financial year. A
memorandum of understanding was signed on 21 July 2017 to transfer an additional 40% of the capital to
minority shareholders (who already hold 25% of the capital), with the Group retaining a 35% stake. The
transaction is due to be completed by September 2017. The Group will no longer control or fully consolidate the
subsidiary.
Since Between represents a separate operating segment in the segment information disclosed by the Group
under IFRS 8, the net income and expenses from this business are presented in the consolidated income
statement under “Profit (loss) from discontinued operations, net of tax”, in accordance with IFRS 5 “Non-
current Assets Held for Sale and Discontinued Operations”. Prior periods presented have been restated to
provide comparable information.
Breakdown of Between’s net income under “Profit (loss) from discontinued operations, net of tax” in the
consolidated income statement:
In thousands of euros, except earnings per share 30 June
2017
30 June
2016
31 December
2016
GROUP CONTRIBUTION(*) 35,058 37,299 76,311
OPERATING MARGIN 730 689 1,717
CURRENT OPERATING PROFIT 730 689 1,717
Other operating income - - -
Other operating expenses - (1) (1)
OPERATING PROFIT 730 688 1,716
Financial income 1 2 4
Financial expenses - - (15)
FINANCIAL RESULT 1 2 (11)
Share of profit of associates - (3) (3)
PROFIT BEFORE INCOME TAX 731 687 1,702
Income tax expense (182) (159) (430)
PROFIT (LOSS) FROM DISCONTINUED OPERATIONS, NET OF TAX 549 528 1,272
Basic earnings per share (euro) 0.07 0.07 0.16
Diluted earnings per share (euro) 0.07 0.07 0.16
(*) The group contribution is defined as the total revenue (internal and external) of an operating segment less the cost of
internal subcontracting. Sales generated by the Group with Between have not been eliminated.

2017 Interim Financial Report 19
At 30 June 2017, the Group presented this activity as assets held for sale in the consolidated statement of
financial position. The assets and liabilities, remeasured at fair value, break down as follows:
ASSETS In thousands of euros
Between Holding
Goodwill 2,765
Other intangible assets 302
Tangible assets 325
Deferred tax assets 33
Trade receivables 14,436
Current tax receivables 81
Cash and cash equivalents 9,783
Non-current assets held for sale 27,725
LIABILITIES In thousands of euros
Between Holding
Trade payables 20,326
Tax and social security liabilities 603
Other liabilities 8
Non-current liabilities held for sale 20,938
No impairment loss was recognised from the fair value measurement of this asset.
Cash flows from Between are presented as follows:
In thousands of euros 30 June 2017 30 June 2016 31 December
2016
Cash flow from operating activities (4,557) (2,697) 6,602
Cash flow from investing activities (230) (166) (369)
Cash flow from financing activities (637) (360) (360)
Cash flows from operating activities mainly correspond to the change in working capital requirement, which is
extremely volatile given the specific nature of the business.
Note 4 – Information on the consolidated statement of financial position
4.1 Intangible assets
In the first half, the Group recognised an intangible asset for €813 thousand relating to the MyFowo.com
backlog.
4.2 Tangible assets
During the first half of 2017, the Group spent €1,488 thousand on tangible assets (versus €1,116 thousand in
the first half of 2016). These mainly consist of improvements to business premises and IT equipment for the
Group’s operational needs.
2017 Interim Financial Report 20
4.3 Goodwill
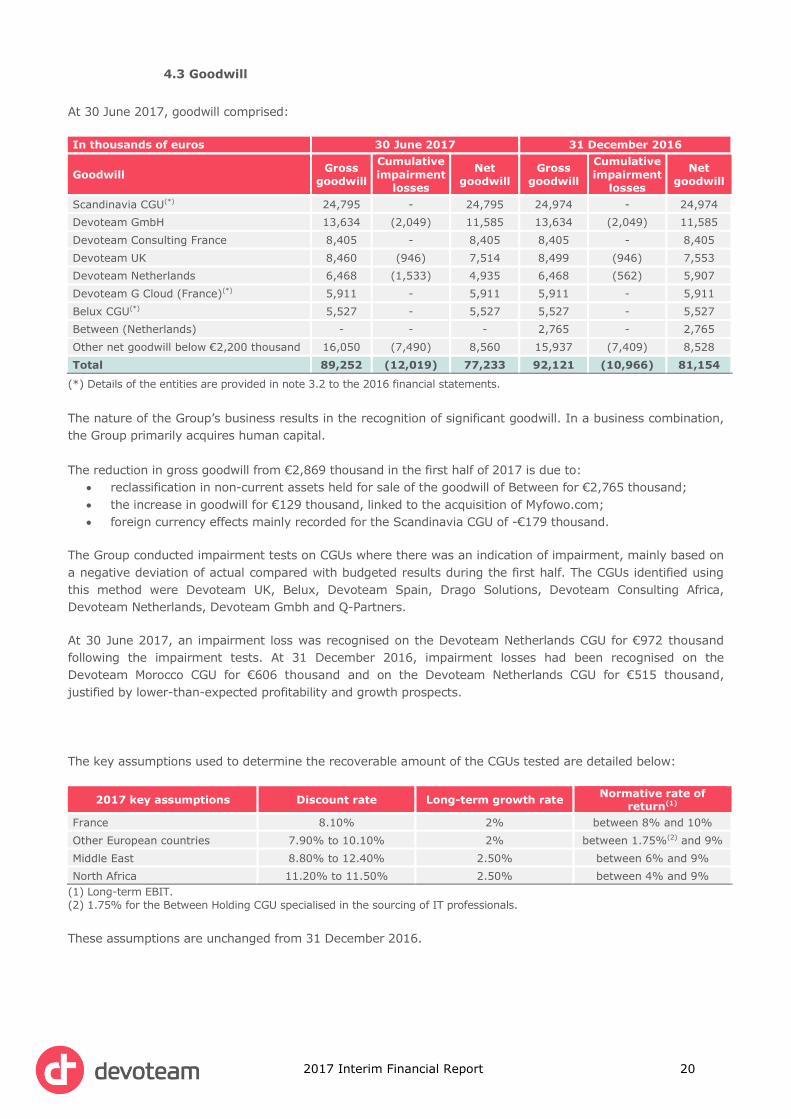
At 30 June 2017, goodwill comprised:
In thousands of euros 30 June 2017 31 December 2016
Goodwill Gross
goodwill
Cumulative
impairment
losses
Net
goodwill
Gross
goodwill
Cumulative
impairment
losses
Net
goodwill
Scandinavia CGU(*) 24,795 - 24,795 24,974 - 24,974
Devoteam GmbH 13,634 (2,049) 11,585 13,634 (2,049) 11,585
Devoteam Consulting France 8,405 - 8,405 8,405 - 8,405
Devoteam UK 8,460 (946) 7,514 8,499 (946) 7,553
Devoteam Netherlands 6,468 (1,533) 4,935 6,468 (562) 5,907
Devoteam G Cloud (France)(*) 5,911 - 5,911 5,911 - 5,911
Belux CGU(*) 5,527 - 5,527 5,527 - 5,527
Between (Netherlands) - - - 2,765 - 2,765
Other net goodwill below €2,200 thousand 16,050 (7,490) 8,560 15,937 (7,409) 8,528
Total 89,252 (12,019) 77,233 92,121 (10,966) 81,154
(*) Details of the entities are provided in note 3.2 to the 2016 financial statements.
The nature of the Group’s business results in the recognition of significant goodwill. In a business combination,
the Group primarily acquires human capital.
The reduction in gross goodwill from €2,869 thousand in the first half of 2017 is due to:
reclassification in non-current assets held for sale of the goodwill of Between for €2,765 thousand;
the increase in goodwill for €129 thousand, linked to the acquisition of Myfowo.com;
foreign currency effects mainly recorded for the Scandinavia CGU of -€179 thousand.
The Group conducted impairment tests on CGUs where there was an indication of impairment, mainly based on
a negative deviation of actual compared with budgeted results during the first half. The CGUs identified using
this method were Devoteam UK, Belux, Devoteam Spain, Drago Solutions, Devoteam Consulting Africa,
Devoteam Netherlands, Devoteam Gmbh and Q-Partners.
At 30 June 2017, an impairment loss was recognised on the Devoteam Netherlands CGU for €972 thousand
following the impairment tests. At 31 December 2016, impairment losses had been recognised on the
Devoteam Morocco CGU for €606 thousand and on the Devoteam Netherlands CGU for €515 thousand,
justified by lower-than-expected profitability and growth prospects.
The key assumptions used to determine the recoverable amount of the CGUs tested are detailed below:
2017 key assumptions Discount rate Long-term growth rate Normative rate of
return(1)
France 8.10% 2% between 8% and 10%
Other European countries 7.90% to 10.10% 2% between 1.75%(2) and 9%
Middle East 8.80% to 12.40% 2.50% between 6% and 9%
North Africa 11.20% to 11.50% 2.50% between 4% and 9%
(1) Long-term EBIT.
(2) 1.75% for the Between Holding CGU specialised in the sourcing of IT professionals.
These assumptions are unchanged from 31 December 2016.
2017 Interim Financial Report 21
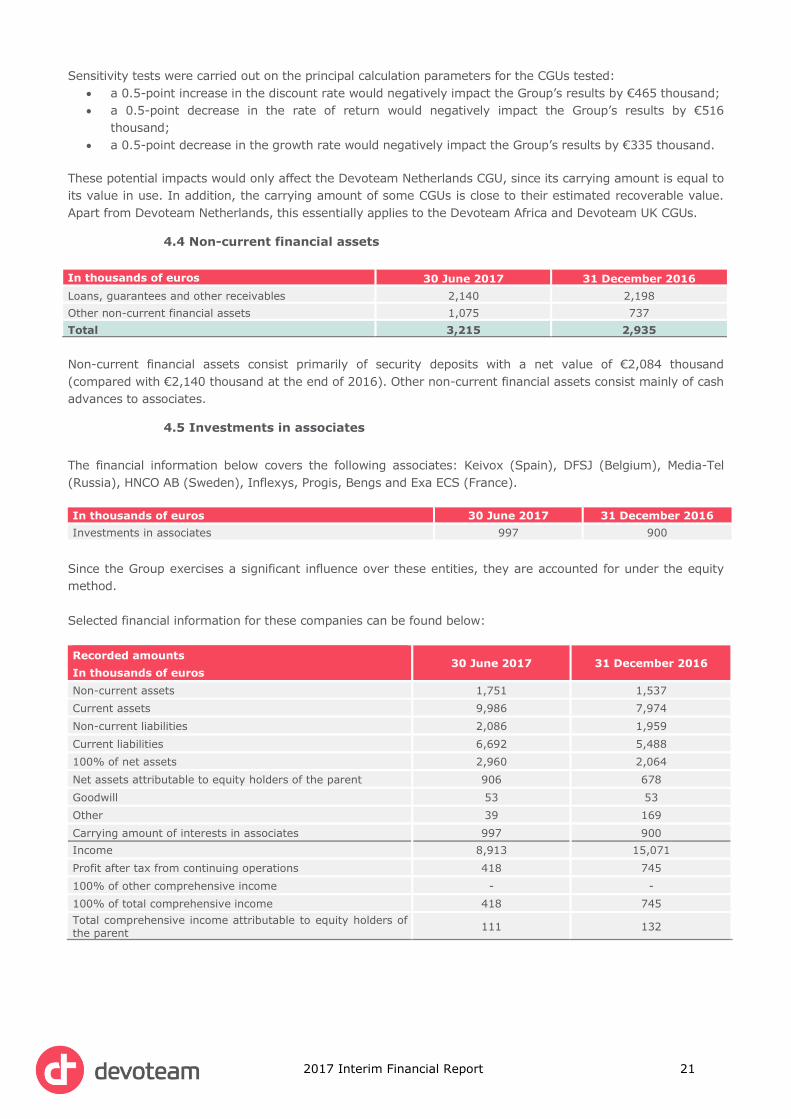
Sensitivity tests were carried out on the principal calculation parameters for the CGUs tested:
a 0.5-point increase in the discount rate would negatively impact the Group’s results by €465 thousand;
a 0.5-point decrease in the rate of return would negatively impact the Group’s results by €516
thousand;
a 0.5-point decrease in the growth rate would negatively impact the Group’s results by €335 thousand.
These potential impacts would only affect the Devoteam Netherlands CGU, since its carrying amount is equal to
its value in use. In addition, the carrying amount of some CGUs is close to their estimated recoverable value.
Apart from Devoteam Netherlands, this essentially applies to the Devoteam Africa and Devoteam UK CGUs.
4.4 Non-current financial assets
In thousands of euros 30 June 2017 31 December 2016
Loans, guarantees and other receivables 2,140 2,198
Other non-current financial assets 1,075 737
Total 3,215 2,935
Non-current financial assets consist primarily of security deposits with a net value of €2,084 thousand
(compared with €2,140 thousand at the end of 2016). Other non-current financial assets consist mainly of cash
advances to associates.
4.5 Investments in associates
The financial information below covers the following associates: Keivox (Spain), DFSJ (Belgium), Media-Tel
(Russia), HNCO AB (Sweden), Inflexys, Progis, Bengs and Exa ECS (France).
In thousands of euros 30 June 2017 31 December 2016
Investments in associates 997 900
Since the Group exercises a significant influence over these entities, they are accounted for under the equity
method.
Selected financial information for these companies can be found below:
Recorded amounts
In thousands of euros 30 June 2017 31 December 2016
Non-current assets 1,751 1,537
Current assets 9,986 7,974
Non-current liabilities 2,086 1,959
Current liabilities 6,692 5,488
100% of net assets 2,960 2,064
Net assets attributable to equity holders of the parent 906 678
Goodwill 53 53
Other 39 169
Carrying amount of interests in associates 997 900
Income 8,913 15,071
Profit after tax from continuing operations 418 745
100% of other comprehensive income - -
100% of total comprehensive income 418 745
Total comprehensive income attributable to equity holders of the parent
111 132

2017 Interim Financial Report 22
4.6 Investment property
Assets
In thousands of euros 30 June 2017 31 December 2016
Investment property measured at amortised cost 1,599 1,827
Investment property measured at fair value - -
Total 1,599 1,827
It is depreciated on a straight-line basis over a period of 15 years.
The table below summarises the carrying amounts of the complex:
In thousands of euros 30 June 2017 31 December 2016
Gross value 5,955 5,955
Accumulated depreciation (4,357) (4,128)
Net carrying amount 1,599 1,827
4.7 Other current assets and liabilities
Assets
In thousands of euros 30 June 2017 31 December 2016
Trade receivables 151,789 163,599
Tax and social security receivables 8,200 7,890
Current tax receivables 13,639 11,794
Other receivables 1,746 1,462
Prepaid expenses 20,522 20,436
Total 195,896 205,182
Trade receivables:
The decrease in trade receivables during the first half of 2017 for €11,810 thousand is mainly due to the
reclassification of Between in “Non-current assets held for sale” (see note 3.2.3).
At 30 June 2017, the Group’s settlement period (DSO) rose to 64 days, compared with 58 days (restated for
Between) at 31 December 2016. Conversely, DSO has deteriorated slightly compared with the 60 days
(restated for Between) at 30 June 2016.
There were no material changes in other current assets.
Liabilities (excluding current provisions, loans and
short-term borrowings – in thousands of euros) 30 June 2017 31 December 2016
Trade payables 31,557 64,636
Tax and social security liabilities 80,772 80,044
Income tax payable 3,159 3,573
Debt on acquisition of fixed assets 2 10
Other current liabilities 17,172 10,046
Deferred income 47,050 48,874
Total 179,711 207,183
Trade payables:
The decrease in trade payables during the first half of 2017 for €33,079 thousand is mainly due to the
reclassification of Between in “Non-current liabilities held for sale” (see note 3.2.3).
Other current liabilities:
Other current liabilities increased by €7,126 thousand, breaking down as follows:
advance payments from customers and credit notes to customers in the amount of €8,006 thousand
(compared with €5,798 thousand in 2016), mainly on the French entities (€5,092 thousand) and
Denmark (€2,761 thousand);
2017 Interim Financial Report 23
current liabilities in respect of earn-outs and put options on non-controlling interests for a total of
€2,537 thousand (unchanged from 31 December 2016) relating to acquisitions;
dividends payable to Group shareholders for €4,785 thousand. The dividend was paid on 3 July
2017;
a residual liability of €274 thousand on a European project at Devoteam GmbH Germany (identical
to 31 December 2016);
the current portion of contingent considerations in the amount of €763 thousand (versus €1,263
thousand at 31 December 2016).
Other current liabilities presented no significant variations.
4.8 Other current financial assets and net cash
4.8.1 Other current financial assets
This item mainly includes a security deposit as part of the assignment of trade receivables in the amount of
€1,562 thousand (compared with €2,624 thousand at the end of 2016) and short-term loans and guarantees in the amount of €170 thousand (€121 thousand at the end of 2016).
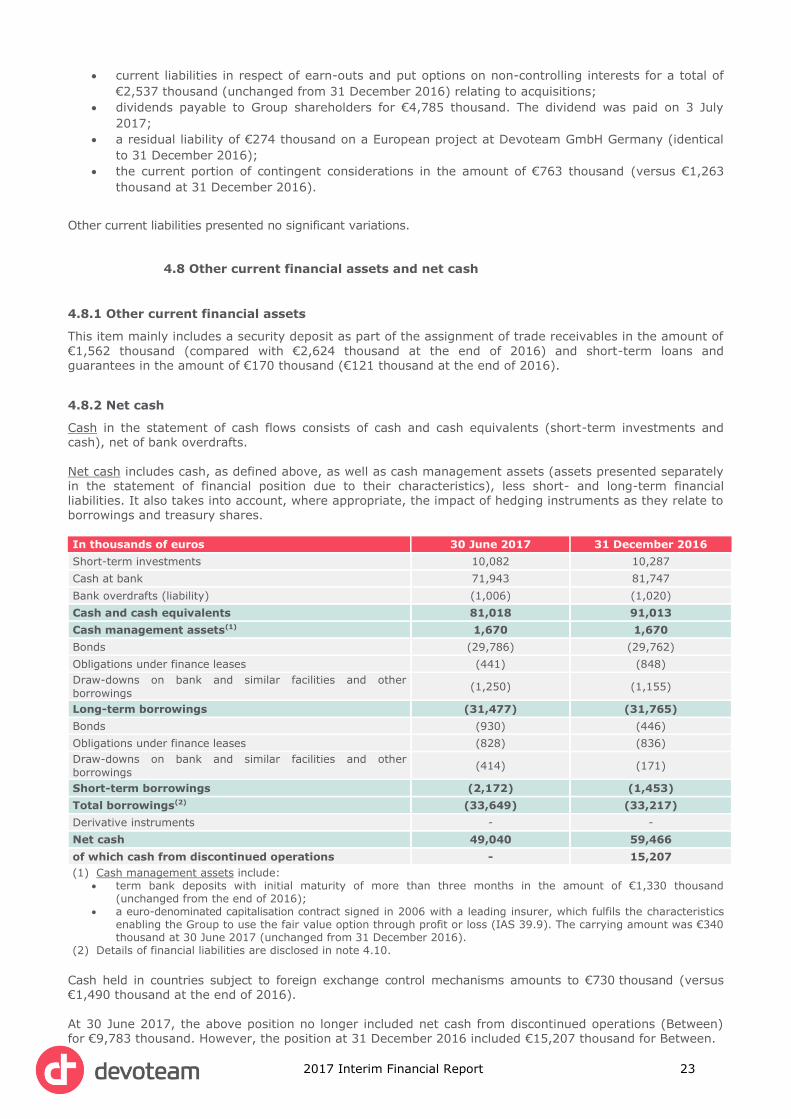
4.8.2 Net cash
Cash in the statement of cash flows consists of cash and cash equivalents (short-term investments and cash), net of bank overdrafts.
Net cash includes cash, as defined above, as well as cash management assets (assets presented separately in the statement of financial position due to their characteristics), less short- and long-term financial liabilities. It also takes into account, where appropriate, the impact of hedging instruments as they relate to borrowings and treasury shares. In thousands of euros 30 June 2017 31 December 2016
Short-term investments 10,082 10,287
Cash at bank 71,943 81,747
Bank overdrafts (liability) (1,006) (1,020)
Cash and cash equivalents 81,018 91,013
Cash management assets(1) 1,670 1,670
Bonds (29,786) (29,762)
Obligations under finance leases (441) (848)
Draw-downs on bank and similar facilities and other
borrowings (1,250) (1,155)
Long-term borrowings (31,477) (31,765)
Bonds (930) (446)
Obligations under finance leases (828) (836)
Draw-downs on bank and similar facilities and other
borrowings (414) (171)
Short-term borrowings (2,172) (1,453)
Total borrowings(2) (33,649) (33,217)
Derivative instruments - -
Net cash 49,040 59,466
of which cash from discontinued operations - 15,207
(1) Cash management assets include: term bank deposits with initial maturity of more than three months in the amount of €1,330 thousand
(unchanged from the end of 2016); a euro-denominated capitalisation contract signed in 2006 with a leading insurer, which fulfils the characteristics
enabling the Group to use the fair value option through profit or loss (IAS 39.9). The carrying amount was €340 thousand at 30 June 2017 (unchanged from 31 December 2016).
(2) Details of financial liabilities are disclosed in note 4.10.
Cash held in countries subject to foreign exchange control mechanisms amounts to €730 thousand (versus €1,490 thousand at the end of 2016).
At 30 June 2017, the above position no longer included net cash from discontinued operations (Between)
for €9,783 thousand. However, the position at 31 December 2016 included €15,207 thousand for Between.
2017 Interim Financial Report 24
The main changes in the Group’s cash are described below.
Cash flow from operating activities
Operating cash flows
Reflecting the improvement in results, cash flow increased 12.9% from €22,455 thousand at 30 June 2016 to
€25,353 thousand at 30 June 2017.
Change in net working capital
The change in net working capital amounted to €(20,917) thousand at 30 June 2017, compared with €(13,334)
thousand at the end of June 2016, mainly due to a seasonal effect. DSO remained under control at 64 days at
the end of June 2017 (versus 60 days at the end of June 2016, restated for Between).
Income tax paid
Income tax paid rose over the period to €7,783 thousand, against €3,279 thousand at 30 June 2016. This
reflects the improvement in the Group’s results, particularly for its French operations, in the amount of €2,068
thousand.
Cash flow from investing activities
Cash flow from investing activities for the period represented a negative amount of €2,691 thousand. This
mainly concerned acquisitions of financial assets for €540 thousand and capital assets for €1,760 thousand,
mostly consisting of improvements to business premises and IT equipment for the Group’s operational needs.
Cash flow from financing activities
Cash flow from financing activities was positive at €6,703 thousand. The main changes relate to:
net cash inflows corresponding to the proceeds from the sale of treasury shares or exercise of stock
options by employees for €5,551 thousand, the increase in amounts outstanding with the factor at
the end of the period for €4,002 thousand, and the reduction in ownership interests while retaining
control of Group subsidiaries for €2,569 thousand (see note 3);
cash outflows of €4,440 thousand corresponding to the buyout of non-controlling interests in the
Group.
4.9 Equity
4.9.1. Share capital
At 30 June 2017, the share capital of Devoteam S.A. amounted to €1,262,340, divided into 8,327,907 ordinary
shares.
4.9.2. Dividends
A dividend of €0.60 per share for 2016 was proposed at the General meeting on 16 June 2017. The dividend
was paid on 3 July 2017.
4.9.3. Treasury shares
Taking into account the 18,000 stock options exercised by employees and the 80,000 shares sold by Devoteam
S.A., the Group holds 352,259 treasury shares, or 4.23% of the share capital at 30 June 2017, compared with
450,259 shares, or 5.41% of the share capital, at 31 December 2016.
4.9.4. Non-controlling interests
At 30 June 2017, the main non-controlling interests relate to minority interests held in Devoteam Middle East,
S’Team Management, Devoteam Consulting, Axance, Devoteam Italy and Between Holding BV.
2017 Interim Financial Report 25
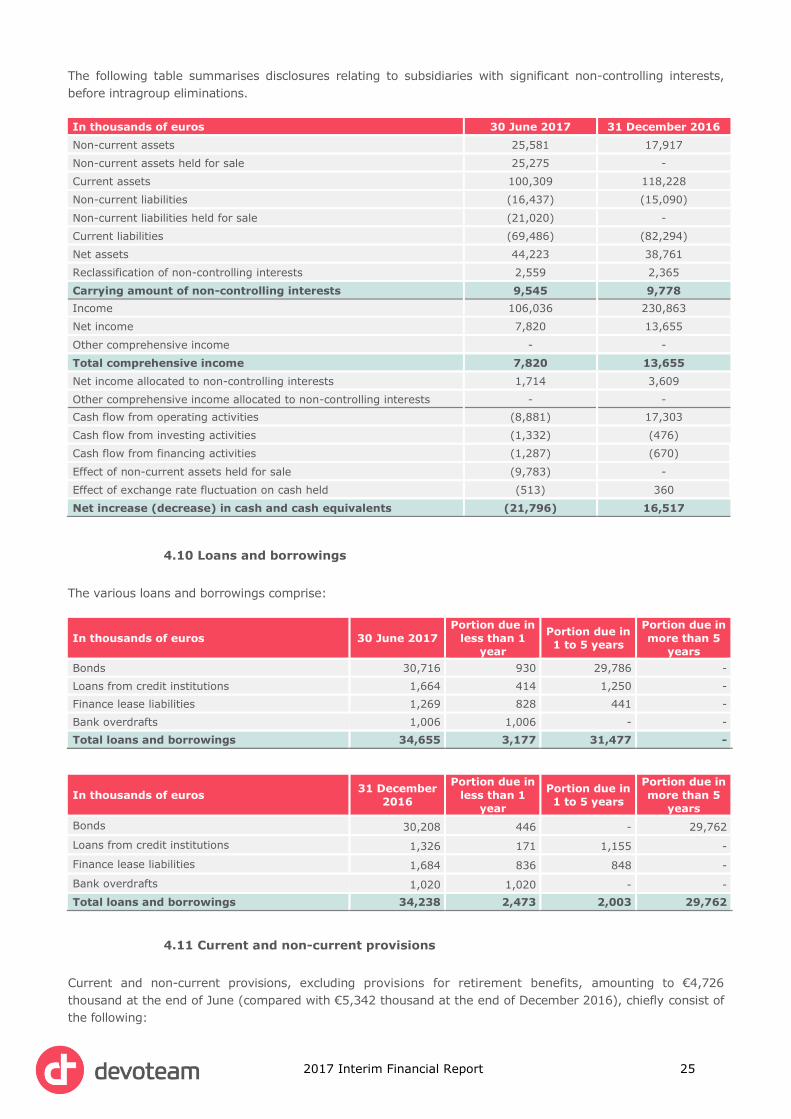
The following table summarises disclosures relating to subsidiaries with significant non-controlling interests,
before intragroup eliminations.
In thousands of euros 30 June 2017 31 December 2016
Non-current assets 25,581 17,917
Non-current assets held for sale 25,275 -
Current assets 100,309 118,228
Non-current liabilities (16,437) (15,090)
Non-current liabilities held for sale (21,020) -
Current liabilities (69,486) (82,294)
Net assets 44,223 38,761
Reclassification of non-controlling interests 2,559 2,365
Carrying amount of non-controlling interests 9,545 9,778
Income 106,036 230,863
Net income 7,820 13,655
Other comprehensive income - -
Total comprehensive income 7,820 13,655
Net income allocated to non-controlling interests 1,714 3,609
Other comprehensive income allocated to non-controlling interests - -
Cash flow from operating activities (8,881) 17,303
Cash flow from investing activities (1,332) (476)
Cash flow from financing activities (1,287) (670)
Effect of non-current assets held for sale (9,783) -
Effect of exchange rate fluctuation on cash held (513) 360
Net increase (decrease) in cash and cash equivalents (21,796) 16,517
4.10 Loans and borrowings
The various loans and borrowings comprise:
In thousands of euros 30 June 2017
Portion due in
less than 1
year
Portion due in
1 to 5 years
Portion due in
more than 5
years
Bonds 30,716 930 29,786 -
Loans from credit institutions 1,664 414 1,250 -
Finance lease liabilities 1,269 828 441 -
Bank overdrafts 1,006 1,006 - -
Total loans and borrowings 34,655 3,177 31,477 -
In thousands of euros 31 December
2016
Portion due in
less than 1
year
Portion due in
1 to 5 years
Portion due in
more than 5
years
Bonds 30,208 446 - 29,762
Loans from credit institutions 1,326 171 1,155 -
Finance lease liabilities 1,684 836 848 -
Bank overdrafts 1,020 1,020 - -
Total loans and borrowings 34,238 2,473 2,003 29,762
4.11 Current and non-current provisions
Current and non-current provisions, excluding provisions for retirement benefits, amounting to €4,726
thousand at the end of June (compared with €5,342 thousand at the end of December 2016), chiefly consist of
the following:

2017 Interim Financial Report 26
provisions for restructuring in the amount of €2,144 thousand (€2,231 thousand at 31 December
2016), which mainly correspond to the restructuring carried out in Germany in the first half of 2017 for €1,738 thousand.
The decrease recorded over the period was due to: o the reversal of provisions for restructuring in Germany for €679 thousand and in Poland for
€89 thousand, o the increase in provisions for restructuring in Germany (€453 thousand), Belgium (€120
thousand) and Morocco (€93 thousand),
provisions for employee disputes in the amount of €1,307 thousand (versus €1,426 thousand at 31
December 2016), mainly recognised in France for €1,303 thousand;
provisions for liabilities and charges in the amount of €1,276 thousand (against €1,685 thousand at
31 December 2016), mainly covering France (€717 thousand) and Germany (€362 thousand). They
cover various risks, such as provisions for customer warranties and commercial disputes.
Provisions for retirement benefits totalled €3,981 thousand (versus €3,773 thousand at 31 December
2016). These mainly concern the French entities. The key assumptions for the calculation of provisions for
retirement benefits are identical to those adopted at 31 December 2016. The Group’s service cost for the
period totalled €230 thousand and the financial cost amounted to €37 thousand.
4.12 Other non-current assets and liabilities
Assets
In thousands of euros 30 June 2017 31 December 2016
Other 154 272
Total 154 272
Other non-current assets consist primarily of non-current prepaid expenses recognised by Devoteam Belgium in the amount of €137 thousand. Liabilities
In thousands of euros 30 June 2017 31 December 2016
Other non-current liabilities 4,854 4,712
Deferred income - -
Total 4,854 4,712
Other non-current liabilities mainly break down as follows: earn-out liabilities in the amount of €3,455 thousand, of which €1,839 thousand for HNCO group
and €1,010 thousand for Devoteam G Cloud; non-current liabilities related to mandatory severance pay in the event of departures of employees
in Italy in the amount of €638 thousand; non-current liabilities related to the deferred portion of the Globicon acquisition price in the amount
of €436 thousand.
Note 5 – Information on the income statement
5.1 Comparative information
Pursuant to AMF Instruction No. 2007-05 dated 2 October 2007, pro-forma financial statements must be
prepared if the scope of consolidation varies by more than 25% during the period. As the impact was less than
25%, the Group has no obligation to prepare pro-forma financial statements. The impact of changes in scope
for the period is summarised in note 3.
However, in accordance with IFRS 5, the Group has restated the comparative periods of activity of Between,
the effects of which are presented in note 3.2.3.
5.2 Operating segments
Under IFRS 8, operating segments must be based on internal reporting regularly reviewed by the chief
operating decision maker. The chief operating decision makers, who are responsible for allocating resources
and assessing the performance of the various operating segments, are the co-CEOs, who are responsible for
taking strategic decisions within the Executive Committee.

2017 Interim Financial Report 27
These “geographical splits” were established in accordance with various criteria to ensure consistency:
revenue in the region: each region is the sum of countries that generate a certain volume of
revenue;
a natural central point for the region (e.g. a “large” country plus a number of “smaller” countries) or
an appropriate split between entities (a number of “small” countries);
geographical, linguistic and cultural proximity between countries of the same region;
synergy between offers: capturing growth opportunities by developing synergy between offers (e.g.
by extending an offer from one country to another country within the same region).
The regions thus created are as follows:
“France”, which includes the French entities, as well as service centres in Morocco and Spain; “Northern Europe & Benelux”, which consolidates entities in the United Kingdom, the
Scandinavian countries excluding discontinued operations, Luxembourg, Belgium and the Netherlands excluding Between;
“Central Europe”, which consists of Germany, Austria, Poland and the Czech Republic; “Rest of the world”, which consists of the Middle East, Algeria, Spain (excluding service centres),
Italy, Morocco (excluding service centres), Mexico, Tunisia, Turkey and Panama; the “Corporate & other” sector covers head office activities that cannot be directly allocated to
operational regions, and residual elements of discontinued operations (mainly outsourcing); the “Divestments” sector, which in 2017 includes activities held for sale (Between). In 2016, this
sector included the activities of Grimstad in Norway, deconsolidated on 1 May 2016, and Devoteam Genesis, deconsolidated on 1 July 2016;
in 2016, the “Between” region only included the activities of the Dutch entity Between.
2017 Interim Financial Report 28
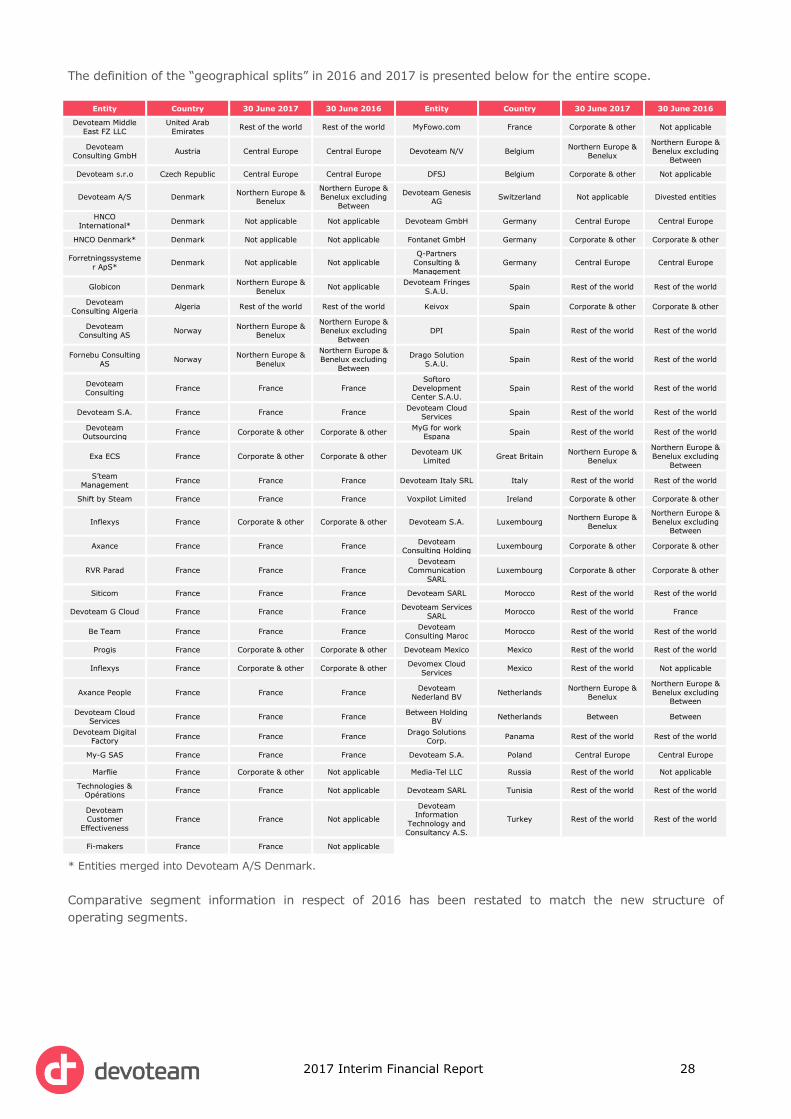
The definition of the “geographical splits” in 2016 and 2017 is presented below for the entire scope.
Entity Country 30 June 2017 30 June 2016 Entity Country 30 June 2017 30 June 2016
Devoteam Middle
East FZ LLC
United Arab
Emirates Rest of the world Rest of the world MyFowo.com France Corporate & other Not applicable
Devoteam
Consulting GmbH Austria Central Europe Central Europe Devoteam N/V Belgium
Northern Europe &
Benelux
Northern Europe &
Benelux excluding Between
Devoteam s.r.o Czech Republic Central Europe Central Europe DFSJ Belgium Corporate & other Not applicable
Devoteam A/S Denmark Northern Europe &
Benelux
Northern Europe & Benelux excluding
Between
Devoteam Genesis AG
Switzerland Not applicable Divested entities
HNCO
International* Denmark Not applicable Not applicable Devoteam GmbH Germany Central Europe Central Europe
HNCO Denmark* Denmark Not applicable Not applicable Fontanet GmbH Germany Corporate & other Corporate & other
Forretningssysteme
r ApS* Denmark Not applicable Not applicable
Q-Partners
Consulting &
Management
Germany Central Europe Central Europe
Globicon Denmark Northern Europe &
Benelux Not applicable
Devoteam Fringes
S.A.U. Spain Rest of the world Rest of the world
Devoteam
Consulting Algeria Algeria Rest of the world Rest of the world Keivox Spain Corporate & other Corporate & other
Devoteam Consulting AS
Norway Northern Europe &
Benelux
Northern Europe & Benelux excluding
Between
DPI Spain Rest of the world Rest of the world
Fornebu Consulting
AS Norway
Northern Europe &
Benelux
Northern Europe &
Benelux excluding
Between
Drago Solution
S.A.U. Spain Rest of the world Rest of the world
Devoteam
Consulting France France France
Softoro
Development Center S.A.U.
Spain Rest of the world Rest of the world
Devoteam S.A. France France France Devoteam Cloud
Services Spain Rest of the world Rest of the world
Devoteam Outsourcing
France Corporate & other Corporate & other MyG for work
Espana Spain Rest of the world Rest of the world
Exa ECS France Corporate & other Corporate & other Devoteam UK
Limited Great Britain
Northern Europe &
Benelux
Northern Europe &
Benelux excluding
Between
S’team
Management France France France Devoteam Italy SRL Italy Rest of the world Rest of the world
Shift by Steam France France France Voxpilot Limited Ireland Corporate & other Corporate & other
Inflexys France Corporate & other Corporate & other Devoteam S.A. Luxembourg Northern Europe &
Benelux
Northern Europe &
Benelux excluding Between
Axance France France France Devoteam
Consulting Holding Luxembourg Corporate & other Corporate & other
RVR Parad France France France Devoteam
Communication
SARL
Luxembourg Corporate & other Corporate & other
Siticom France France France Devoteam SARL Morocco Rest of the world Rest of the world
Devoteam G Cloud France France France Devoteam Services
SARL Morocco Rest of the world France
Be Team France France France Devoteam
Consulting Maroc Morocco Rest of the world Rest of the world
Progis France Corporate & other Corporate & other Devoteam Mexico Mexico Rest of the world Rest of the world
Inflexys France Corporate & other Corporate & other Devomex Cloud
Services Mexico Rest of the world Not applicable
Axance People France France France Devoteam
Nederland BV Netherlands
Northern Europe &
Benelux
Northern Europe &
Benelux excluding Between
Devoteam Cloud Services
France France France Between Holding
BV Netherlands Between Between
Devoteam Digital Factory
France France France Drago Solutions
Corp. Panama Rest of the world Rest of the world
My-G SAS France France France Devoteam S.A. Poland Central Europe Central Europe
Marflie France Corporate & other Not applicable Media-Tel LLC Russia Rest of the world Not applicable
Technologies & Opérations
France France Not applicable Devoteam SARL Tunisia Rest of the world Rest of the world
Devoteam
Customer
Effectiveness
France France Not applicable
Devoteam Information
Technology and
Consultancy A.S.
Turkey Rest of the world Rest of the world
Fi-makers France France Not applicable
* Entities merged into Devoteam A/S Denmark.
Comparative segment information in respect of 2016 has been restated to match the new structure of
operating segments.

2017 Interim Financial Report 29
The key performance indicators set out below are used by the Group in its internal reporting and are identical
to those applied at the 2016 reporting date (see note 3.19 to the 2016 financial statements):
first, operating margin is defined as current operating result before the impact of share-based
compensation and the amortisation of business relationships acquired in business combinations;
second, the group contribution is defined as the total revenue (internal and external) of an operating
segment less the cost of internal subcontracting acquired from other Group entities. This indicator
reflects the segment’s contribution to consolidated revenue from its own resources. The sum of group
contributions of the operating segments is the Group’s consolidated revenue.

2017 Interim Financial Report 30
The results and assets of the various operating segments are presented below:
In thousands of euros
France Northern Europe &
Benelux Central Europe Rest of the world Corporate & other Divested entities Total Group
30 June
2017
30 June
2016
restated(2)
30 June
2017
30 June
2016
restated(2)
30 June
2017
30 June
2016
restated(2)
30
June
2017
30 June
2016
restated(2)
30 June
2017
30 June
2016
restated(2)
30 June
2017
30 June
2016
restated(2)
30 June
2017
30 June
2016
restated(2)
Group contribution(1) 132,246 114,838 61,800 58,436 27,823 22,711 35,071 38,064 (428) (155) 0 4,222 256,511 238,116
Depreciation and
amortisation of tangible
and intangible assets
(615) (629) (280) (242) (194) (208) (196) (204) (239) (238) 0 (45) (1,524) (1,566)
Operating margin(1) 17,048 14,781 4,551 4,324 2,371 1,708 2,061 2,318 (581) (1,082) 0 (81) 25,450 21,969
Operating income 15,306 14,216 4,311 4,063 2,114 (537) 1,459 2,210 (1,478) (4,064) 0 (83) 21,712 15,806
(1) See definition in note 3.19 to the 2016 financial report.
(2) These are the geographical splits following the 2017 reallocations.
Net financial income/(loss) (944) (1,088)
Income from associates 111 (121)
Income tax expense (7,797) (5,935)
Net income from continuing operations 13,082 8,661
Profit (loss) from discontinued operation, net of tax 549 528
Net income 13,631 9,189
Impairment losses on goodwill and other assets (see note 4.3) are allocated to the “Corporate” operating segment.
In thousands of euros
France Northern Europe &
Benelux Central Europe Rest of the world Corporate & other Divested entities
Total consolidated
assets
30
June 2017
31
December
2016 restated
30 June
2017
31
December
2016 restated
30 June
2017
31
December
2016 restated
30 June
2017
31
December
2016 restated
30 June
2017
31
December
2016 restated
30 June
2017
31
December
2016 restated
30 June
2017
31
December
2016 restated
Segment assets* 159,822 140,839 90,316 91,983 37,840 37,697 55,027 62,922 34,551 32,094 27,725 36,581 405,280 402,117
* Assets shared by two segments are broken down in proportion to the "group contribution" generated during the period.

2017 Interim Financial Report 31
The results and assets of the various operating segments are presented below in comparison with restated information for 2016.
In thousands of euros
France Northern Europe &
Benelux Central Europe Between Rest of the world Corporate & other Divested entities Total Group
30 June 2016
restated
30 June 2016
presented(1)
30 June 2016
restated
30 June 2016
presented(1)
30 June 2016
restated
30 June 2016
presented(1)
30 June 2016
restated
30 June 2016
presented(1)
30 June 2016
restated
30 June 2016
presented(1)
30 June 2016
restated
30 June 2016
presented(1)
30 June 2016
restated
30 June 2016
presented(1)
30 June 2016
restated
30 June 2016
presented(1)
Group contribution(2) 114,838 115,249 58,436 58,436 22,711 22,711 0 0 38,064 37,653 (159) (159) 4,222 4,222 238,112 238,112
Depreciation and
amortisation of tangible
and intangible assets
(629) (632) (242) (242) (208) (208) 0 0 (204) (201) (238) (238) (45) (45) (1,566) (1,626)
Operating margin(2) 14,781 14,804 4,324 4,324 1,708 1,708 0 0 2,318 2,295 (1,082) (1,082) (81) (81) 21,969 22,658
Operating income 14,216 14,239 4,063 4,063 (537) (536) 0 0 2,210 2,187 (4,064) (4,064) (83) (83) 15,806 16,495
(1) Data restated for Between (see note 3.2.3).
(2) See definition in note 3.19 of the 2016 financial report.
Net financial income/(loss) (1,088) (1,088)
Income from associates (121) (121)
Income tax expense (5,935) (5,935)
Net income from continuing operations 8,661 8,661
Profit (loss) from discontinued operation, net of tax 528 528
Net income 9,189 9,189
In thousands of euros
France Northern Europe &
Benelux Central Europe Between Rest of the world Corporate & other Divested entities
Total consolidated assets
31 Decembe
r 2016 restated
31 December
2016 presented
31 December
2016 restated
31 December
2016 presented
31 December
2016 restated
31 December
2016 presented
31 December
2016 restated
31 December
2016 presented
31 December
2016 restated
31 December
2016 presented
31 December
2016 restated
31 December
2016 presented
31 December
2016 restated
31 December
2016 presented
31 December
2016 restated
31 December
2016 presented
Segment assets* 140,83
9 141,530 91,983 91,983 37,697 37,692 0 36,081 62,922 62,231 32,094 32,099 36,581 500 402,117 402,117
* Assets shared by two segments are broken down in proportion to the group contribution generated during the period.

2017 Interim Financial Report 32
5.3 Share-based payment
The impact of stock option plans and the free share plan, classified in operating margin and current operating
profit at 30 June 2017, totalled €(11) thousand (versus €(28) thousand at 30 June 2016) and €(997) thousand
(versus €(534) thousand at 30 June 2016) respectively.
The terms and conditions of existing option plans are described in the 2016 financial statements.
5.4 Other operating income and expenses
The main components of other operating income and expenses are as follows:
In thousands of euros
Other operating expenses 30 June
2017
30 June
2016
restated(1)
Other operating
income
30 June
2017
30 June
2016
restated(1)
Restructuring expenses (1,443) (3,479)
Income from the reversal
of unused provisions for
restructuring
- 534
Net value of fixed assets sold - - Net value of fixed assets
sold 1 15
Net loss on disposals of
subsidiaries - (1,333)
Net gain on disposal of
subsidiaries - -
Impairment of goodwill(2) (972) - - -
Impairment of other assets(3)
(1,228) Gains on acquisitions - -
Vesting period of securities - (30)
-
Miscellaneous (303) (4) Miscellaneous 118 131
Total (2,717) (6,073) Total 119 680
(1) See note 3.2.3, assets held for sale.
(2) Corresponds to impairment of goodwill for Devoteam Netherlands.
(3) Corresponds to impairment losses for Switzerland (IFRS 5).
At 30 June 2017, income and expenses linked to restructuring mainly related to the adjustment of resources
and the costs of downsizing. These costs primarily concern the Spanish entities (€463 thousand), the German
entity (€357 thousand) and the French entities (€330 thousand).
Impairment of goodwill relates to impairment losses on the Devoteam Netherlands CGU in the amount of €972
thousand (see note 4.3).
5.5 Financial income and expenses
At 30 June 2017, the main components of financial income were as follows:
In thousands of euros
Financial expenses 30 June
2017
30 June 2016
restated* Financial income
30 June 2017
30 June 2016
restated*
Negative exchange rate differences
- (679) Positive exchange rate differences 68 -
Interest on bonds measured at the effective interest rate
(508) (508) Interest on bonds measured at the effective interest rate
- -
Interest on finance leases measured at the effective interest rate
(8) (16) - -
Discounting of long-term financial liabilities
(89) (73) - -
Provisions on financial assets (80) - Provisions on financial assets - 173
Other financial expenses (389) (355) Other financial income 61 371
Total (1,073) (1,631) Total 129 544
(*) See note 3.2.3, assets held for sale.
Net financial income for the period was up by €144 thousand from 30 June 2016, mainly due to:
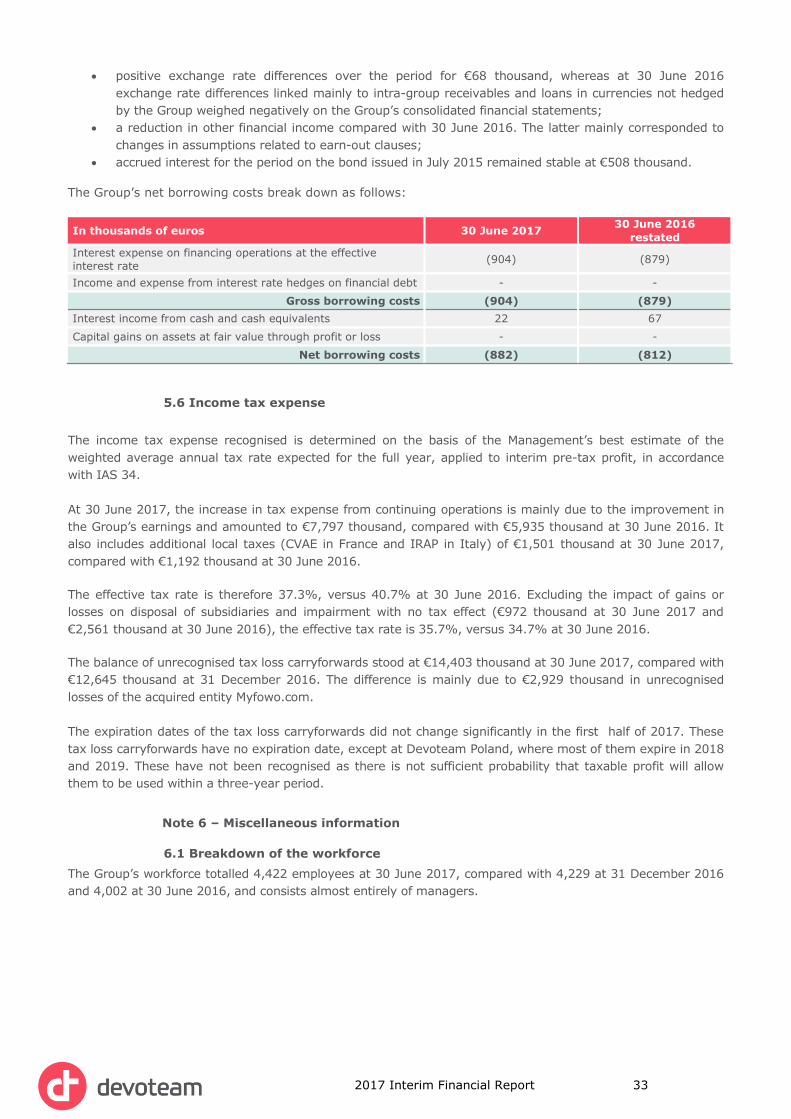
2017 Interim Financial Report 33
positive exchange rate differences over the period for €68 thousand, whereas at 30 June 2016
exchange rate differences linked mainly to intra-group receivables and loans in currencies not hedged
by the Group weighed negatively on the Group’s consolidated financial statements;
a reduction in other financial income compared with 30 June 2016. The latter mainly corresponded to
changes in assumptions related to earn-out clauses;
accrued interest for the period on the bond issued in July 2015 remained stable at €508 thousand.
The Group’s net borrowing costs break down as follows:
In thousands of euros 30 June 2017 30 June 2016
restated
Interest expense on financing operations at the effective
interest rate (904) (879)
Income and expense from interest rate hedges on financial debt - -
Gross borrowing costs (904) (879)
Interest income from cash and cash equivalents 22 67
Capital gains on assets at fair value through profit or loss - -
Net borrowing costs (882) (812)
5.6 Income tax expense
The income tax expense recognised is determined on the basis of the Management’s best estimate of the
weighted average annual tax rate expected for the full year, applied to interim pre-tax profit, in accordance
with IAS 34.
At 30 June 2017, the increase in tax expense from continuing operations is mainly due to the improvement in
the Group’s earnings and amounted to €7,797 thousand, compared with €5,935 thousand at 30 June 2016. It
also includes additional local taxes (CVAE in France and IRAP in Italy) of €1,501 thousand at 30 June 2017,
compared with €1,192 thousand at 30 June 2016.
The effective tax rate is therefore 37.3%, versus 40.7% at 30 June 2016. Excluding the impact of gains or
losses on disposal of subsidiaries and impairment with no tax effect (€972 thousand at 30 June 2017 and
€2,561 thousand at 30 June 2016), the effective tax rate is 35.7%, versus 34.7% at 30 June 2016.
The balance of unrecognised tax loss carryforwards stood at €14,403 thousand at 30 June 2017, compared with
€12,645 thousand at 31 December 2016. The difference is mainly due to €2,929 thousand in unrecognised
losses of the acquired entity Myfowo.com.
The expiration dates of the tax loss carryforwards did not change significantly in the first half of 2017. These
tax loss carryforwards have no expiration date, except at Devoteam Poland, where most of them expire in 2018
and 2019. These have not been recognised as there is not sufficient probability that taxable profit will allow
them to be used within a three-year period.
Note 6 – Miscellaneous information
6.1 Breakdown of the workforce
The Group’s workforce totalled 4,422 employees at 30 June 2017, compared with 4,229 at 31 December 2016
and 4,002 at 30 June 2016, and consists almost entirely of managers.
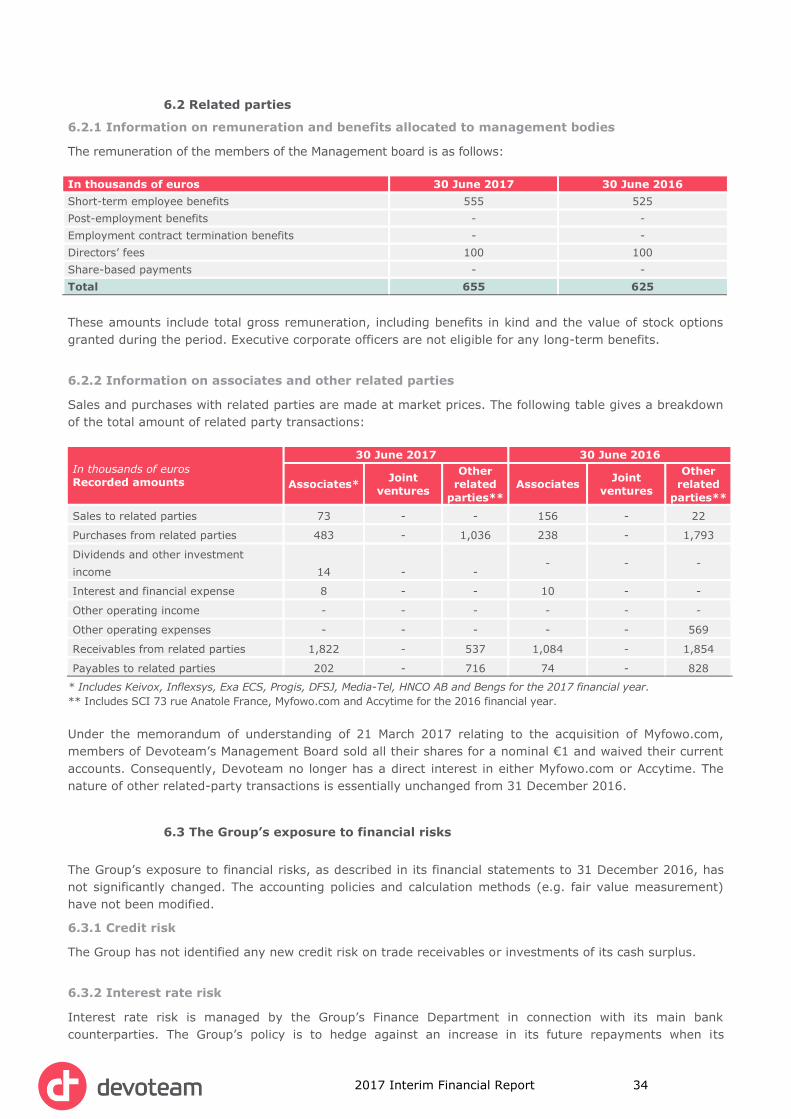
2017 Interim Financial Report 34
6.2 Related parties
6.2.1 Information on remuneration and benefits allocated to management bodies
The remuneration of the members of the Management board is as follows:
In thousands of euros 30 June 2017 30 June 2016
Short-term employee benefits 555 525
Post-employment benefits - -
Employment contract termination benefits - -
Directors’ fees 100 100
Share-based payments - -
Total 655 625
These amounts include total gross remuneration, including benefits in kind and the value of stock options
granted during the period. Executive corporate officers are not eligible for any long-term benefits.
6.2.2 Information on associates and other related parties
Sales and purchases with related parties are made at market prices. The following table gives a breakdown
of the total amount of related party transactions:
In thousands of euros
Recorded amounts
30 June 2017 30 June 2016
Associates* Joint
ventures
Other
related
parties**
Associates Joint
ventures
Other
related
parties**
Sales to related parties 73 - - 156 - 22
Purchases from related parties 483 - 1,036 238 - 1,793
Dividends and other investment
income 14 - - - - -
Interest and financial expense 8 - - 10 - -
Other operating income - - - - - -
Other operating expenses - - - - - 569
Receivables from related parties 1,822 - 537 1,084 - 1,854
Payables to related parties 202 - 716 74 - 828
* Includes Keivox, Inflexsys, Exa ECS, Progis, DFSJ, Media-Tel, HNCO AB and Bengs for the 2017 financial year.
** Includes SCI 73 rue Anatole France, Myfowo.com and Accytime for the 2016 financial year.
Under the memorandum of understanding of 21 March 2017 relating to the acquisition of Myfowo.com,
members of Devoteam’s Management Board sold all their shares for a nominal €1 and waived their current
accounts. Consequently, Devoteam no longer has a direct interest in either Myfowo.com or Accytime. The
nature of other related-party transactions is essentially unchanged from 31 December 2016.
6.3 The Group’s exposure to financial risks
The Group’s exposure to financial risks, as described in its financial statements to 31 December 2016, has
not significantly changed. The accounting policies and calculation methods (e.g. fair value measurement)
have not been modified.
6.3.1 Credit risk
The Group has not identified any new credit risk on trade receivables or investments of its cash surplus.
6.3.2 Interest rate risk
Interest rate risk is managed by the Group’s Finance Department in connection with its main bank
counterparties. The Group’s policy is to hedge against an increase in its future repayments when its

2017 Interim Financial Report 35
exposure is significant. To this end, it uses financial derivative instruments contracted with leading banks.
At 30 June 2017, since most of the Group’s financial debt was fixed rate, no hedging instruments were in
place.
6.3.3 Liquidity risk
Liquidity risk is the risk of the Group failing to meet its financial obligations. The Group’s approach to
managing this risk is to ensure that it at all times has sufficient funds to meet its liabilities as they fall due.
The Finance Department has established a prospective cash flow monitoring system (monthly and annual)
for each Group operating entity, which gives it sufficient visibility to manage its liquidity risk.
The Group has conducted a specific review of its liquidity risk, and considers itself able to meet its future
payments. At 30 June 2017, cash and cash equivalents including cash management assets and net of bank
overdrafts of €82.7 million exceeded the €33.6 million in financial liabilities.
In 2015, the Group had renewed a number of revolving credit facilities (RCF) with leading banks, amounting
to €30 million over a three-year period.
Draws on such facilities are subject to covenants and compliance with classic annual financial ratios for
loans of this type. At the end of the period, the Group had not drawn down any sums on these credit
facilities.
Lastly, the factoring agreement established in 2013 was still in effect at the closing date. The maximum
amount allowed is €33 million, of which €16 million had been used at 30 June 2017.
6.4 Off-balance sheet commitments
There has been no material change in either the nature or amount of other off-balance sheet commitments
presented in note 9.3 of the 2016 financial statements.
6.4.1 Other commitments
In January 2013, the Group was accused by an industry player of unfair competition, with the claim amount
standing at €9.55 million. More than one year later, the opposing party produced a private report by an
independent expert and significantly increased its initial demands. In addition to the fact that the Group has
not committed any act of unfair competition, the intrinsic approach taken by the external expert is tainted
by gross errors – as demonstrated by the report of another external expert commissioned by the Group. In
December 2016, the Paris Commercial Court, while finding that it was possible to qualify certain of the
Group’s acts as representing unfair competition, was unable to determine the existence of a tort, and
ordered a report by a court-appointed expert. The Group appealed against this decision. The assessment by
the court-appointed expert was still ongoing at 30 June 2017.
In this context, the Group has not changed its initial position, and still considers the claim to be without
merit. As such, it has not recorded a provision.
2017 Interim Financial Report 36
Note 7 – Subsequent events
On 7 July 2017, the Group finalised the acquisition of 80% of Technology Management and Network
Services BV (TMNS), a Dutch consulting and integration company (integration, devops, data analytics,
managed services). TMNS has approximately 200 employees and generated around €18 million in
consolidated revenue in its last financial year. This acquisition will be consolidated from 1 July 2017.
On 21 July 2017, a memorandum of understanding was signed with the minority shareholders of Between, who
already held 25% of the capital and voting rights, providing for the transfer of an additional 40% of the
company’s capital. The transaction is due to be finalised in September 2017 and will result in loss of control of
the subsidiary. The Group will retain 35% of the capital and voting rights. This subsidiary was classified in
assets held for sale in the financial statements to 30 June 2017 (see note 3.2.3).
On 6 August 2017, the Group signed a memorandum for the acquisition of 80% of D2SI, a French Cloud
service and integration company (mainly Amazon Web Services). D2SI has approximately 100 employees and
generated €13 million in consolidated revenue in its last financial year. This acquisition is expected to be
consolidated from 1 October.

2017 Interim Financial Report 37
STATUTORY AUDITORS’ REPORT
This is a free translation into English of the statutory auditors’ report issued in French and is provided solely
for the convenience of English-speaking users. This report should be read in conjunction with, and construed in accordance with, French law and professional auditing standards applicable in France.
Dear Shareholders,
In compliance with the assignment entrusted to us by your General meeting and in accordance with Article
L. 451-1-2 III of the French Monetary and Financial Code, we hereby report to you on:
- our limited review of the accompanying condensed interim consolidated financial statements of Devoteam
S.A. for the period 1 January 2017 to 30 June 2017;
- the verification of information disclosed in the interim management report.
The interim consolidated financial statements were prepared by the Management Board. Our responsibility is to
express an opinion on those financial statements on the basis of our limited review.
I - Opinion on the financial statements
We conducted our limited review in accordance with professional standards applicable in France. A limited
review essentially consists of making inquiries of members of the management responsible for financial and
accounting matters and applying analytical procedures. A review is substantially less extensive than an audit
conducted in accordance with professional standards applicable in France. Consequently, unlike a full audit, a
review only provides moderate assurance that the financial statements, taken as a whole, are free from
material misstatement.
On the basis of our limited review, we identified no material misstatement likely to call into question, according
to IFRS as adopted in the European Union, the accuracy and fairness of the condensed interim consolidated
financial statements, and the true and fair view they present of the assets and financial position at 30 June
2017 and the results for the period then ended of the organisation consisting of the persons and entities
included in the consolidation.
II – Specific verification
We also verified the information disclosed in the interim management report accompanying the condensed
interim consolidated financial statements subject to our limited review. We have no comments to make as
to its fairness and consistency with the condensed interim consolidated financial statements.
Paris La Défense, 22 September 2017 Neuilly-sur-Seine, 22 September 2017
KPMG Audit IS Grant Thornton
Membre français de Grant Thornton
International
Jean-Pierre Valensi Vincent Papazian
Partner Partner

2017 Interim Financial Report 38
STATEMENT BY THE PERSON RESPONSIBLE FOR THE INTERIM FINANCIAL REPORT
I hereby declare that, to the best of my knowledge, the condensed consolidated financial statements for the
past six-month period have been prepared under generally accepted accounting principles and give a true
and fair view of the assets, liabilities, financial position and results of the company and of all the companies
in the consolidated group, and that the accompanying interim management report includes a fair review of
the material events that occurred in the first six months of the financial year and their impact on the
accounts, a description of the main related party transactions and a discussion of the principal risks and
uncertainties for the remaining six months of the year. The Statutory Auditors’ report on the condensed
interim consolidated financial statements presented in this document can be found on page 37.
Stanislas de Bentzmann
Co-CEO