Embed Size (px)
Citation preview

INTERDEPENDENT REGULATION OF METABOLISM AND INFLAMMATION
IN HUMAN MONOCYTES
BY
PATRICK MILLET
A Dissertation Submitted to the Graduate Faculty of
WAKE FOREST UNIVERSITY SCHOOL OF ARTS AND SCIENCES
in Partial Fulfillment of the Requirements
for the Degree of
DOCTOR OF PHILOSOPHY
Molecular Genetics and Genomics
December 2015
Winston-Salem, North Carolina
Approved By:
Charles E. McCall, M.D., Advisor
Linda McPhail, Ph.D., Chair
Martha Alexander-Miller, Ph.D.
Anthony Molina, Ph.D.
Barbara Yoza, Ph.D.

TABLE OF CONTENTS
LIST OF ABBREVIATIONS iii
LIST OF ILLUSTRATIONS vi
ABSTRACT vii
CHAPTER 1: Introduction 1
CHAPTER 2: “GAPDH Binding to TNF-α mRNA Contributes to Post-
Transcriptional Repression in Monocytes: A Novel Mechanism of
Communication between Inflammation and Metabolism” submitted to
J Immunol 40
CHAPTER 3: RelB Directly Regulates SIRT3 Expression During
Endotoxin Tolerance 75
CHAPTER 4: Discussion 98
CURRICULUM VITAE 110

iii
LIST OF ABBREVITATIONS
1,3-BPG
1,3-bisphosphoglycerate
2-DG 2-deoxy-D-glucose
ARE AU-rich element
ATP Adenosine triphosphate
COX-2
Cyclooxygenase-2
DMEM
Dulbecco's modified eagle medium
DNA Deoxyribonucleic acid
ECAR Extracellular acidification rate
ELISA Enzyme-linked immunosorbent assay
ET-1
Endothelin-1
ETC
Electron transport chain
FBS
Fetal bovine serum
G3P Glyceraldehyde-3-phosphate
GAPDH G-CSF GM-CSF HIF-1α HuR ICAM-1 ICU
Glyceraldehyde-3-phosphate dehydrogenase Granulocyte colony stimulating factor Granulocyte-macrophage colony stimulating factor Hypoxia induced factor 1α Human antigen R Intercellular adhesion molecule 1 Intensive care unit
IFN-γ
Interferon γ
IkBα
Nuclear factor of κ light polypeptide gene enhancer in B-cells inhibitor α

iv
IKKβ
Inhibitor of κ light polypeptide gene enhancer in B-cells, kinase β
IL-1β
Interleukine 1β
IL-6
Interleukine 6
IP Immunoprecipitation
LPS Lipopolysaccharide
M1 Classically activated macrophages (proinflammatory)
M2 Alternatively activated macrophages (anti-inflammatory)
MAMP
Microorganism associated molecular patterns
MAPK
Mitogen-activated protein kinase
miR
MicroRNA
mRNA
Messenger ribonucleic acid
NAD+ Nicotinamide adenine dinucleotide
NADPH NF-kB
Nicotinamide adenine dinucleotide phosphate Nuclear factor kappa-light-chain-enhancer of activated B cells
OCR
Oxygen consumption rate
PBMC
Peripheral blood mononuclear cell
PGC-1α
Peroxisome proliferator-activated receptor γ, coactivator 1α
PMN Polymorphonuclear cells (neutrophils)
RBC RBP RelB
Red blood cell RNA binding protein v-rel avian reticuloendotheliosis viral oncogene homolog B
RLU ROS
Relative luciferase units Reactive oxygen species

v
RNA Ribonucleic acid
RNA-IP Ribonucleic acid immunoprecipitation
RPMI SIRS
Roswell Park Memorial Institute (cell culture media) Severe inflammatory response syndrome
SEM Standard error of the mean
TCA
Tricarboxylic acid cycle
TLR
Toll-like receptor
TNF Tumor necrosis factor
TREG Regulatory T cells
UTR Untranslated region
vi
LIST OF ILLUSTRATIONS
CHAPTER 1: Introduction
Figure 1-Schematic of early and late sepsis characteristics 5
CHAPTER 2: “GAPDH Binding to TNF-α mRNA Contributes to Post-
Transcriptional Repression in Monocytes: A Novel Mechanism of Communication
between Inflammation and Metabolism”
Figure 1-Tolerance and Galactose both affect TNF expression 65
Figure 2-Tolerance and Galactose both affect metabolism 66
Figure 3-GAPDH binds to TNF mRNA in galactose-fed cells 67
Figure 4-GAPDH binds to TNF mRNA in endotoxin tolerant
cells 68
Figure 5-Glycolysis can be artifically controlled in tolerant cells 69
Figure 6-GAPDH binding to TNF mRNA is sensitive to changes
in glycolysis 70
Figure 7-Changes in GAPDH binding TNF mRNA correlate
with changes in TNF protein levels in tolerant cells 71
Figure 8-Transcripts with the 3’UTR of TNF mRNA are
repressed in a metabolism-sensitive manner 72
Figure 9-GAPDH binds to TNF mRNA in primary cells 73
Figure 10-Experimental model of post-transcriptional
repression of TNF by GAPDH 74
CHAPTER 3: RelB Directly Regulates SIRT3 Expression During Endotoxin
Tolerance
Figure 1-RelB affects mitochondrial response to LPS 93
Figure 2-RelB affects SIRT3 expression following LPS stimulation 94
Figure 3-RelB does not affect known regulators of SIRT3 95
Figure 4-RelB is found on the SIRT3 promoter 96
Figure 5-SIRT3 promoter shows impaired transcription in absence of RelB 97

vii
ABSTRACT
Sepsis is serious medical condition which kills millions of people
worldwide each year. In the United States, severe sepsis has a mortality rate of
20-30%, with an annual cost of over $25 billion. Modern advances in supportive
care have brought the mortality rate down to its current level, however there is
currently no molecular-based treatment available for sepsis. Many treatments
have been tested in clinical trials, but none have proven reliably beneficial. These
treatments, however, seldom accounted for the fact sepsis has distinct stages
with distinct immunometabolic profiles. Early sepsis is marked by inflammation
and glycolysis, while late sepsis is marked by immune suppression and fatty acid
oxidation. As an increasing body of data suggests, these metabolic and immune
states may be interdependent.
In this dissertation work, I examine mechanisms by which immunity and
metabolism communicate in monocytes during sepsis and endotoxin tolerance.
For one portion of this work, I investigate a novel mechanism of monocyte
regulation of TNF expression. Using RNA immunoprecipitation, I demonstrate
that the glycolytic enzyme GAPDH binds to TNF mRNA. This binding is
enhanced or disrupted by inhibiting or promoting glycolysis, respectively. I further
demonstrate that this binding represents a form of post-transcriptional
repression, and that it is based on the TNF mRNA 3’UTR. I find this mechanism
participates in repression of TNF cytokine production in tolerant cells, and in
primary human PBMCs.

viii
The work presented here also includes my investigation into the
mechanisms upregulating mitochondrial oxidative metabolism during late sepsis.
Using Seahorse XF respirometry, I show that NF-kB member RelB is essential
for the increase in respiration that occurs in monocytes during endotoxin
tolerance. RelB does so by upregulating expression of SIRT3, although it does
not do so by increasing expression of known SIRT3 upregulatory factors.
Instead, I demonstrate through chromatin immunoprecipitation that RelB binds to
the SIRT3 promoter to directly upregulate its expression.
Together, the projects presented in this dissertation demonstrate the close
relationship between inflammation and metabolism in the innate immune system.
These findings have potentially significant implications for future efforts to design
treatments for sepsis and other inflammatory conditions.

1
CHAPTER 1
INTRODUCTION
SEPSIS AND INFLAMMATION
Clinical Impact:
Sepsis is one of the leading causes of death worldwide. Recent estimates
suggest up to 19 million incidents of severe sepsis occur globally each year (1).
In the United States, sepsis is a growing medical concern. One study determined
that during the year 2007, over 700,000 Americans were hospitalized with severe
sepsis, over 200,000 of whom died (2). This study also found a steady increase
in the incidence of sepsis, with a growth rate of 17.8% per year. In the developed
world, septic patients make up approximately 10% of all ICU admissions (3).
Even with proper treatment, severe sepsis has a mortality rate of 20-30%. With
inadequate care, the mortality rate can exceed 70% (4).
Sepsis is defined as a systemic inflammatory response to an infection (5).
Sepsis develops when a localized inflammatory response to infection becomes
systemic, causing widespread dysregulation of the immune system. Clinical
manifestations of sepsis can vary significantly between individuals (6). Symptoms
most often include fever or hypothermia, leukocytosis or leukopenia, tachycardia
and tachypnea. Coagulation abnormalities, altered mental state, and
hyperglycemia are often present as well (7).
Sepsis progresses to severe sepsis when the inflammatory dysregulation
causes acute organ dysfunction or multiple organ dysfunction syndrome (MODS)

2
(8). Respiratory and cardiovascular systems are the most commonly affected by
organ failure, although the central nervous and renal systems often experience
dysfunction as well (9). Patients who progress to septic shock display acute
circulatory failure and arterial hypotension, despite fluid resuscitation (6).
The most common cause of severe sepsis infection is pneumonia,
although bacterial or fungal infections anywhere in the body can also cause
sepsis (9). The presence of a documented infection distinguishes sepsis from
other forms of severe inflammatory response syndrome (SIRS) (8). SIRS can
result from infection, as well as pancreatitis, trauma, ischemia, hemorrhagic
shock, or serious burns. Since sepsis is a form of SIRS, the two conditions show
the same clinical manifestations (10). Distinguishing between sepsis and aseptic
SIRS requires blood culturing, which significantly delays a precise diagnosis.
In the 1980’s, sepsis mortality rates often exceeded 60% (4). Today,
intensive medical interventions significantly reduce sepsis mortality. Modern
medical interventions are split into two bundles of core care, outlined in the
international guidelines of the Surviving Sepsis Campaign (9, 11). Initially, sepsis
care is directed towards elimination of infection and prevention of further
infection. This is generally accomplished through early antibiotic use and source
control. Patients are treated with broad-spectrum antibiotics and anti-microbials
within an hour of recognition of severe sepsis or septic shock. In practice, this
means anti-microbial drugs are usually given prior to obtaining blood culture
results. As a consequence of this, SIRS patients often receive unnecessary
antibiotics. Despite this, immediate use of anti-microbial drugs remains

3
necessary. Multiple studies demonstrate that delaying such treatment
significantly increases the risk of death in sepsis, even if that delay is only a
matter of hours (12-14).
After the initial set of interventions, sepsis treatment is directed towards
providing supportive therapy for hemodynamic and organ dysfunction (7). This
, ventilators, IV fluids, and hemodialysis. The can include use of vasopressors
modern intensive care approach has significantly improved patient survival rates
over the last few decades (9). This decline in mortality, however, largely results
from improved supportive care, rather than treatment of the underlying causes of
sepsis. Currently, there are no known molecular-based treatments for sepsis
itself.
Over the years, clinical trials were conducted on dozens of
pharmaceuticals to assess their potential benefit for septic patients. Most of
these substances blocked inflammatory mediators, including prostaglandins,
platelet activating factor, bradykinin, and TNF (15-18). Researchers hoped that
by limiting inflammation, the sepsis-mediated organ damage could be prevented.
In pre-clinical animal trials, administration of anti-inflammatory treatments
improved survival if given before or shortly after the induction of sepsis or
injection with LPS (19-21). This discovery, however, proved of limited value in
designing treatments for septic patients. In clinical trials, administration of anti-
inflamatory substances generally failed to reduce patient mortality (17, 18, 22-
24). One such treatment agent, a TNF neutralizing antibody fragment, actually
increased the rate of mortality in a dose-dependent manner (24). During these

4
trials, anti-TNF antibody treatments proved beneficial for chronic local
inflammation from rheumatoid arthritis (23), however they provided no significant
benefit for sepsis. While the exact reason why these drug trials failed is unknown,
it likely stems from how sepsis progresses over time.
Stages of Sepsis—An Overview:
For many years, the prevailing view of the medical community has been
that sepsis is solely a matter of uncontrolled over-inflammation (8). This
assumption remained largely intact, even after a series of anti-inflammatory
treatments failed clinical trials. In 1996, Roger Bone questioned this assumption
by highlighting mounting evidence that the body responded to the severe
inflammatory response with a compensatory anti-inflammatory response (25). He
argued that treatments for sepsis would only work if that treatment accounted for
the differences between early and late sepsis.
In many respects, early sepsis is entirely different from late sepsis. We
now know the early stage of sepsis is marked by activation of the NF-kB p65
pathway, the production of pro-inflammatory cytokines such as TNF and IL-1β,
and widespread activation of inflammation (26-28). Some refer to this rapid and
systemic production of cytokines as the “cytokine storm” (28, 29). Patient deaths
during early sepsis typically stem from inflammation.
The pro-inflammatory early stage of sepsis lasts for several hours, after
which it progresses to the late stage. During the late stage of sepsis, the pro-
inflammatory response is deactivated and pro-inflammatory gene expression is
repressed (30-32). This repression is primarily mediated by NF-kB member RelB.

5
RelB prevents p65 activity through multiple mechanisms. Briefly, RelB occupies
NF-kB binding sites on gene promoters to preclude p65-mediated transcription, it
sequesters p65 away from DNA, and it promotes the formation of silent
heterochromatin (reviewed in (33)). Once RelB completes these actions, immune
cells become unresponsive to further inflammatory stimuli, resulting in overall
immune suppression. This state of immune suppression increases risk of
secondary infection and overall patient mortality (32, 34-36).
As immune cells undergo this shift in inflammatory state, their metabolism
changes as well. The initial inflammatory response triggers robust upregulation in
Early Sepsis:
• “Cytokine Storm” • Proinflammatory • Glycolytic
Metabolism • NF-kB p65
predominated • Patient deaths from
inflammation
Late Sepsis:
• “Endotoxin Tolerance” • Inflammatory genes unresponsive • Oxidative Metabolism • NF-kB RelB predominated • Patient deaths from infections In
fla
mm
atio
n
Imm
un
osu
pre
ssio
n
Baseline
immune
0 hours 8-12 hours 1-3 weeks
Figure 1-Schematic of early and late sepsis characteristics

6
glycolysis in effector cells (37, 38). Glycolysis remains elevated until the shift to
immunosuppression. The shift to immunosuppression is marked by a decrease in
glycolysis and an increase in fatty acid oxidation (38-40). These changes in
cellular immunometabolic state are summarized in Figure 1.
Endotoxin Tolerance
These sequential stages of early and late sepsis mirror those observed
during endotoxin tolerance. Endotoxin tolerance was first characterized in 1947
(41). Animals injected with bacterial adjuvants initially responded with fever and
inflammation, however subsequent injections failed to produce the same
response. During tolerance, pro-inflammatory cytokines like TNF are not
expressed to the same degree. Serum TNF reaches a high level in rats injected
with a dose of endotoxin, however, TNF levels are diminished when the same
(42). The loss of rats are injected again days later TNF protects tolerant rats from
higher endotoxin doses which kill naïve animals. Cytokine expression is similarly
inhibited in septic patients. Monocytes isolated from septic patients show
diminished production of TNF, IL-1β, and IL-6 in response to endotoxin (43-45).
This diminished cytokine response correlates with poorer clinical outcome.
When studying sepsis in vitro, our lab (46-48) and others (49-51)
commonly employ the THP-1 cell line as an experimental model. This human
promonocytic cell line originated from a patient with acute monocytic leukemia
(52). THP-1 cells generally resemble and behave like native pro-monocytes (50-
53). Several publications by our laboratory group compare endotoxin tolerant
THP-1 cells and septic PBMC samples (54-56). These reports find endotoxin

7
. These tolerant THP-1 cells behave consistently with septic patient PBMCs
similarities include cytokine production, tolerance, RelB expression and activity,
glucose and fatty acid oxidation, and expression of metabolic genes.
Ongoing Issues—Sepsis:
Almost two decades after Bone made his case to the scientific and
medical community (25), there is still limited acknowledgement that sepsis has
distinct stages. By the time a septic individual receives the proper medical
attention, they have often progressed towards the late stage of the disease (35,
36). It therefore should come as no surprise that attempts to treat these
individuals with anti-inflammatory agents show little benefit (22-24). These
failures, however, did not deter efforts to treat sepsis by limiting inflammation.
Over 40 separate agents aimed at blocking inflammation in sepsis have been
tested in over 100 clinical trials (57-59). Even the most successful trials among
these never reduced the absolute chance of mortality by more than a few
percentage points. Clinical trials of anti-inflammatory agents continued in the
United States until 2011, when recombinant activated protein C was shown to
provide no benefit to septic patients (60). In Japan, clinical trials of an anti-TNF
polyclonal antibody treatment are still ongoing (61).
After so many anti-inflammatory agents failed to improve patient survival,
one might hypothesize that an immunostimulatory agent would provide greater
benefit. The presence of late sepsis immunosuppression would support such an
idea. Based on this rationale, granulocyte colony stimulating factor (G-CSF) and
granulocyte-macrophage colony stimulating factor (GM-CSF) have been
8
investigated as potential immunostimulatory agents for septic patients. Preclinical
trials in animal models of sepsis demonstrate that administration of G-CSF
improves survival (62, 63). Initial clinical trials showed GCSF was well tolerated
by patients and that it restored immune responsiveness (64). Subsequent studies
concluded the treatment did not improve survival when generally administered to
septic patients (65-67). More recent studies, however, suggest that G-CSF or
GM-CSF treatment is beneficial when targeted to septic patients with reduced
immunity, as measured by decreased expression of HLA-DR (68-70). While this
approach still requires broader clinical testing, it underscores the idea that
developing effective treatments will require a more nuanced understanding of the
disease.
Other immunostimulatory agents have been investigated as well. Clinical
pilot studies indicate interferon-γ (IFN-γ) treatment can improve monocyte
function of septic patients (71-73). Pre-clinical ex-vivo analysis of septic patient
samples indicates IL-7 can restore lymphocyte function (74). Inhibitors or
neutralizing antibodies for IL-10, programmed death 1 (PD-1), and macrophage
inhibitory factor (MIF) also show potential as immunostimulatory agents in pre-
clinical trials (59, 75-77).
Sepsis is a highly heterogeneous condition, making diagnosis difficult (10,
78). Unlike many other diseases, there is no specific biomarker for sepsis.
Clinicians instead rely on diagnostic guidelines, although there is debate over the
accuracy and utility of these criteria (6, 11). Clinical manifestations differ based
on the individual infected, the infecting organism, and the time at which the

9
patient is observed. It seems unlikely that any uniform approach will effectively
treat such a variable disease. In order to help develop treatments for sepsis and
severe systemic inflammation, we must better characterize its progression and
regulatory mechanisms.
EARLY SEPSIS—INFLAMMATION AND GLYCOLYSIS
Initiation of Inflammation:
Inflammation is activated by a variety of cytokines and foreign molecules.
These molecules include certain microorganism associated molecular patterns
(MAMPs) like endotoxin or flagellin, specific foreign protein fragments displayed
on the surface of antigen presenting cells, and cytokines like TNF (26). These
molecules are recognized by Toll-like receptors (TLRs), T-cell receptors, cytokine
receptors, and other receptor complexes. The receptor signaling pathways are
varied and complex, however, they all activate the canonical NF-kB pathway.
The NF-kB transcription factors are considered the master regulators of
inflammation. In unstimulated cells, p65-p50 NF-kB heterodimers are
sequestered in the cytoplasm by IkBα (79-82). The inflammatory signaling
cascades activate IKKβ, which then phosphorylates IkBα. Phosphorylated IkBα is
quickly degraded, releasing the p65-p50 heterodimers. Once free, p65-p50
translocates into the nucleus and activates transcription of hundreds of genes,
particularly pro-inflammatory genes like TNF (83-85).
Glycolysis is also upregulated during inflammation. Expression of HIF-1α
is upregulated in activated leukocytes (85, 86). The HIF-1α protein is then

10
stabilized by the reactive oxygen species (ROS) generated during early
inflammation. During hypoxia, p65 helps upregulate expression of HIF-1α (87).
Once present, HIF-1α upregulates numerous genes necessary for glycolysis
(88).
TNF, Expression and Regulation:
TNF is one of the primary mediators of inflammation during sepsis and the
It is produced by numerous cell types, acute inflammatory response (89).
including monocytes, macrophages, dendritic cells, T cells, adipocytes, hepatic
cells, and more (90). Many of the problematic immune responses which occur
during sepsis are triggered by TNF. TNF causes vasodilation, loosens the tight
junctions of the vascular endothelium, and promotes the expression of ICAM-1
on vascular endothelial cells in order to recruit neutrophils to the site of
inflammation (91). TNF also promotes the release of complement and triggers
coagulation, which is dysregulated during sepsis. Because of these potentially
toxic effects, TNF expression is tightly controlled.
Transcription of TNF is upregulated within minutes of an immune stimulus
(92). In healthy donor blood samples, TNF mRNA levels peak 2-4 hours after in
vitro addition of LPS (93). When p65-p50 heterodimers are released from , IkBα
p65 is phosphorylated at serine-276 by protein kinase A (94). The p65-p50
heterodimers then translocate into the nucleus and bind the TNF promoter (92).
Transcription is activated only after multiple cofactors are recruited to the TNF
promoter by phosphorylated p65 (95). These factors include the CBP/p300
coactivator, as well as Sp1, Egr-1, Ets/Elk, ATF-1, and c-jun (96).

11
TNF expression is further controlled at the post-transcriptional level. The
3’ untranslated region (3’UTR) of TNF mRNA contains an AU-rich element (ARE)
which typically marks the TNF transcript for rapid degradation (97). There are
several RNA-binding proteins (RBP) which recognize the TNF ARE and affect
the TNF transcript (98). One such RBP is TTP, which negatively regulates TNF
mRNA stability (99). In macrophages from TTP knockout mice, TNF mRNA had a
longer half-life, leading to increased TNF cytokine expression. AUF1 similarly
destabilizes TNF mRNA and prevents overexpression of the cytokine (100). The
RBPs TIA-1/TIAR and FXR1 also bind the TNF ARE (98). These factors do not
affect the stability of TNF mRNA, however, they do prevent translation of the
transcript. In contrast, human antigen R (HuR) binding to the TNF ARE stabilizes
the mRNA, thus increasing TNF protein (101). HuR competes for the same
binding spot as miR-181, a microRNA which destabilizes TNF mRNA (102).
Other TNF negative regulatory microRNAs include miR221, miR-579, miR-125b,
and miR-146a (47, 103). Given the complexity of this system, there are a number
of unanswered questions regarding what ultimately determines expression of
TNF.
Glycolysis and Inflammation:
The relationship between inflammation and metabolism seen in sepsis
appears in other contexts as well. Pro-inflammatory M1 macrophages and TH17
cells display elevated rates of glycolysis (38, 104-107). Conversely, anti-
inflammatory M2 macrophages, TREG cells, and quiescent memory lymphocytes
show a distinct preference for β-oxidation over glycolysis (106-109).

12
Numerous studies demonstrate how inflammation requires glucose and
glycolysis. Glucose catabolism by the pentose phosphate shunt is necessary for
the generation of NADPH, a metabolite essential for the respiratory burst in
phagocytes (110). In mice with myeloid specific knockouts for HIF-1α, leukocytes
display low glycolysis, along with decreased adhesion, mobility, and bacterial
clearance (111). Similar effects on leukocytes occur in mice with myeloid-specific
knockouts of APBA3, a factor which promotes HIF-1α stability (112). When
glycolysis is restricted due to glucose deprivation or the glycolysis inhibitor 2-
deoxyglucose, pro-inflammatory cytokine production is reduced in dendritic cells
and macrophages (37, 113). This reduction is not caused by loss of ATP.
Macrophages treated with the mitochondrial inhibitor rotenone maintain their
production of TNF cytokine, despite significant loss of intracellular ATP levels
(113).
Despite clear evidence that inflammation depends on glycolysis, it is
unclear why this is the case. It is equally unclear what mechanism causes this
dependence. The relationship is at least partially mediated by the sirtuins, as I
will discuss in detail further below. Many of these phenomena, however, likely
occur independent of sirtuin-mediated regulation. Emerging evidence suggests
the interactions of RNA, enzymes, and metabolites play a considerable role in
communication between metabolism and other cellular processes (114).
GAPDH:
Glycolysis is made up of ten reactions, each catalyzed by a specific
enzyme (115). Glycolysis is controlled by three rate-limiting enzymes:

13
hexokinase, phosphofructokinase, and pyruvate kinase. These enzymes catalyze
the first, third, and tenth steps of glycolysis, respectively. In the sixth step of the
glycolysis pathway, GAPDH converts glyceraldehyde-3-phosphate (G3P) into
1,3-bisphosphoglycerate (1,3-BPG), while also converting NAD+ into NADH. This
reaction occurs in a protein domain known as the Rossmann fold (116).
GAPDH is involved in a number of processes outside of its role in
glycolysis. These processes include DNA repair, cytoskeletal and membrane
dynamics, and cell death (117). Many of these alternate functions result from free
radicals reacting with Cys-152, a residue in the active site of GAPDH. Reactive
oxygen species can cause reversible S-thiolation of GAPDH. This modification
inactivates GAPDH enzymatic activity, leading to increased metabolic flux in the
pentose phosphate pathway (118). S-nitrosylation of Cys-152 by nitric oxide
allows GAPDH to associate with E3 ubiquitin ligase Siah1 (119). GAPDH-Siah1
complexes localize to the nucleus, triggering degradation of nuclear proteins and
facilitating apoptosis. During high oxidative stress, GAPDH can aggregate and
oligomerize into amyloid-like fibrils which can promote cell death (120).
GAPDH is also capable of binding RNA. The Rossmann fold region has a
specific affinity for AU-rich elements (116). GAPDH binding to an ARE decreases
with increased concentrations of NAD+, NADH, or G3P (116, 121). Recent
evidence indicates GAPDH uses this mechanism to regulate expression of
endothelin-1 (ET-1), cyclooxygenase-2 (COX-2), and interferon-γ (121-123). The
RNA-binding function of GAPDH appears to be negatively regulated by S-
thiolation or S-nitrosylation of Cys-152. GAPDH binding to the ET-1 mRNA
14
3’UTR reverses with increased concentration of GSSG or GSNO, the latter of
which mimics the actions of nitric oxide. GAPDH loses this sensitivity for either
compound and continues to bind the ET-1 mRNA 3’UTR if Cys-152 is mutated
into a serine residue (121).
Ongoing Issues—Glycolysis and Inflammation
Inflammation is a tightly controlled process. Mediators like TNF have
layers of regulation intended to keep its expression in check. Sepsis represents a
prime example of why such control is needed. Many studies demonstrate that
inflammation does not occur without glycolysis. When glycolysis is limited, so is
inflammation (37, 111-113). Precisely why this is the case, however, is unclear.
This dependence on glycolysis is not solely about the ATP it generates. Blocking
mitochondrial ATP production does not inhibit inflammation the way blocking
glycolysis does (113). Some suggest the shift in metabolism reflects a change in
oxygen availability. This explanation, however, also seems doubtful. As
discussed in detail below, oxygen is often freely available in peripheral tissue
during sepsis (124).
The Warburg effect is another possible explanation for inflammation’s
dependence on glycolysis. Glycolysis generates several intermediate metabolites
which are precursors for nucleotide, amino acid, and lipid biosynthesis (125).
Rapidly proliferating cells often upregulate glycolysis to fuel their increasing
biomass. This phenomenon was first observed in cancer, where it was dubbed
the Warburg effect (126). While some use the Warburg effect to explain aerobic
glycolysis in proliferating lymphocytes, the parallel is questionable. T-cells grown

15
in media containing galactose instead of glucose show a reduced rate of
glycolysis (123). When stimulated, these T-cells do not produce IFNγ, however
their proliferation response is unimpaired. It therefore seems unlikely that
inflammation requires glycolysis for the metabolic precursors.
It remains unclear why glycolysis is so essential to the inflammatory
process. How glycolysis controls inflammation is equally unclear. In Chapter 2 of
this thesis, I explore one mechanism which allows glycolysis to affect expression
of the inflammatory cytokine TNF. I find that GAPDH binds the 3’UTR of the TNF
mRNA, repressing translation in a glycolysis-sensitive manner. By characterizing
the mechanisms allowing glycolysis to regulate inflammation, we may open new
avenues for immune modulation.
LATE SEPSIS—IMMUNE REPRESSION AND MITOCHONDRIA
Mitochondrial Dysfunction in Sepsis
During early sepsis, patients undergo a period of mitochondrial
dysfunction. Septic patients often show hyperlactatemia, indicating elevated
glycolysis (11). This increase in anerobic metabolism is not due to lack of
oxygen. Lactate levels are not reduced by higher venous oxygen concentration,
or by the administration of supplemental red blood cells (127-129). Muscle
biopsies of patients show elevated oxygen tension, compared to non-septic
controls (124). Thus even with oxygen present, mitochondrial respiration cannot
proceed. In fact, activity of complex I of the electron transport chain is diminished
in septic patients (130). This period of mitochondrial dysfunction is associated

16
with decreased cellular ATP content (130-132). During this time, mitochondria
also show increased production of reactive oxygen species (ROS) (133, 134).
Mitochondrial sources of ROS are essential for MAP kinase signaling during
inflammation (135-137). These ROS inactivate MAPK phosphatases, prolonging
activation of JNK. Blocking sources of mitochondrial ROS decreases JNK
activation and inflammatory cytokine production, however, blocking ROS from
NADPH oxidase does not have this effect.
This period of mitochondrial dysfunction persists through the early stage of
sepsis. As the disease progresses, mitochondrial metabolism and biogenesis is
activated (138, 139). Cellular ATP content is restored during this time. This
change in mitochondrial metabolism occurs during the switch from early sepsis to
late sepsis.
The Transition from Inflammation to Immunosuppression:
Although the transition from early to late sepsis is not fully characterized, it
clearly requires coordinated signaling from metabolic and immune pathways. The
sirtuin proteins are among the primary mediations of this transition, particularly
SIRT1. The sirtuins are NAD+-dependent deacetylases which help regulate
cellular metabolism by acting on a number of intracellular targets (140).
During the early stage of sepsis, HIF-1α upregulates a number of genes to
support glycolysis (88). HIF-1α also upregulates Nampt, a key enzyme in NAD+
biosynthesis (141). Nampt is activated by TLR4 signaling, resulting in an
increased NAD+/NADH ratio (40, 142). This, in turn, activates SIRT1. SIRT1
inhibits p65-mediated transcription by removing an acetyl group from p65 lysine
17
residue 310 (143). Additionally, SIRT1 helps remove p65 from NF-kB responsive
sites, and helps load RelB onto those sites instead (142).
Like p65, RelB is also a member of the NF-kB family of transcription
factors. Also like p65, RelB contains a Rel homology region which allows it to
bind NF-kB consensus DNA sequences (79, 144, 145). The functions of RelB,
however, are entirely unlike those of p65. During the late stage of sepsis and
acute inflammation, RelB represses transcription of many pro-inflammatory
genes which respond to p65 activation (33, 146).
During classical NF-kB signaling, p65 activates transcription of RelB (147).
RelB accumulates in the nucleus more slowly than p65. Once present, it prevents
p65-induced transcription in three different ways. First, RelB forms a heterodimer
with p65 (148). These heterodimers are found during endotoxin tolerance and
have low affinity for DNA binding (54). Second, RelB binds to NF-kB consensus
sites, displacing p65 in the process (149). This displacement occurs on
promoters for proinflammatory genes including TNF, IL-1β and IL-12 (92, 149,
150). Finally, RelB facilitates an epigenetic switch from active euchromatin to
silent facultative heterochromatin (151). RelB generates silent heterochromatin
through direct association with the H3 lysine methyltransferase G9a (48). RelB is
also involved in immune development, the xenobiotic response, the circadian
rhythm, and other pathways, which I discuss in my 2013 review article “RelB: an
outlier in leukocyte biology” (152).
The sirtuins direct the immunometabolic transition through mechanisms
beyond NF-kB. SIRT1 activates PGC1α, a key promoter of mitochondrial

18
biogenesis and fatty acid oxidation (153). Additionally, SIRT1 activates SIRT6.
SIRT6 acts as a corepressor of HIF-1α, preventing HIF-1α from promoting
glycolysis (154, 155). The increased NAD+/NADH ratio also activates SIRT3.
SIRT3 is primarily found in the mitochondria (156). SIRT3 activates numerous
mitochondrial proteins, including ones involved in the TCA cycle, the Electron
Transport Chain, fatty acid import, and the control of reactive oxygen species
(156-159).
Mitochondria and Inflammation:
Just as elevated inflammation is associated with glycolysis, repressed
inflammation is associated with mitochondrial metabolism. Anti-inflammatory
immune cell populations such as M2 macrophages, TREG cells, and memory
lymphocytes show elevated mitochondrial respiration, mass, and spare
respiratory capacity (106-109, 160). When PGC-1β is constitutively
overexpressed in macrophages, their fatty acid oxidation is upregulated (161).
These macrophages preferentially polarize into the M2 state. This restricts their
ability to produce inflammatory cytokines in response to LPS. This restriction is
reversed, however, when the macrophages are treated with etomoxir, an inhibitor
of mitochondrial fatty acid import. Etomoxir prevents macrophages from
differentiating into the M2 phenotype and eliminates the anti-inflammatory effects
of IL-4 (161).
In hepatic tissue, etomoxir increases pro-apoptotic caspase activity and
pro-inflammatory IL-8 expression (162). Mice with a liver-specific SIRT1 knockout
show greater hepatic inflammation in response to high-fat diet (163). On the

19
other hand, mice with moderate overexpression of SIRT1 have reduced levels of
TNF and IL-6, and less activation of classic NF-kB (164). Reducing SIRT1
expression in adipose tissue causes recruitment of macrophages, while SIRT1
overexpression prevents macrophages from accumulating there (165).
Ongoing Issues—Tolerance and Mitochondria
Mitochondrial biogenesis and respiration is a crucial component of
restoring homeostasis after severe acute inflammation. Earlier activation of
biogenesis and higher cellular ATP content are associated with survival during
sepsis (138, 139). Additionally, non-survivors generally have less mitochondrial
Complex I activity than survivors of sepsis (130). These data would suggest the
late sepsis phenotype should benefit septic individuals. The reality, however, is
more complicated.
During late sepsis, endotoxin tolerance and immune suppression
contribute to patient mortality (35, 36). Patients who fail to produce TNF or IL-6
cytokines in response to ex-vivo LPS stimulation of whole blood show greater
mortality than those patients who do respond to such stimulation (43, 45). Thus,
while the shift to mitochondrial metabolism that occurs during late sepsis is
potentially beneficial, the immunological shift is potentially harmful. By studying
the mechanisms by which these processes regulate each other, we may find new
approaches to treating sepsis during the later stages.
In a recent paper I co-authored, our lab explored the relationship between
RelB and the sirtuins during endotoxin tolerance and sepsis (56). There, we
demonstrate SIRT1, RelB, and SIRT3 act in sequence to promote mitochondrial
20
biogenesis and metabolism. We found mitochondrial biogenesis was impaired in
SIRT1 and RelB, but not SIRT3 knockdowns. Mitochondrial oxygen consumption
was reduced by all three knockdowns. Oxygen consumption was restored in
SIRT1 knockdown cells when RelB was knocked in, however, SIRT1 knock-in did
not have the same effect for a RelB knockdown. Together, this data shows that
SIRT1 and RelB are upstream regulators of SIRT3 and of mitochondrial
biogenesis, but that SIRT3 upregulates mitochondrial metabolism.
Although this paper demonstrates RelB is necessary for SIRT3 expression
and activity, it does not indicate how RelB does so. In Chapter 3 of this thesis, I
examine how RelB regulates SIRT3. I show that RelB does not control known
regulators of SIRT3 transcription, but instead binds directly to the SIRT3
promoter. These findings illustrate how the endotoxin tolerant immunological and
metabolic phenotypes are closely interdependent.
DISCUSSION
There are many unknowns regarding sepsis and severe acute
inflammation. It is clear that glycolysis directly impacts the pro-inflammatory
response, however, it is unclear how it does so. There are also gaps in our
understanding of the transition from early sepsis to late sepsis. We know the
transition hinges on RelB and SIRT3, however, we do not know the mechanism
responsible for this. Most importantly, we still do not know how to affect either
phase of sepsis in a way that improves patient outcome.
21
This dissertation explores some of these research concerns. In Chapter 2,
I demonstrate that the interaction between GAPDH protein and TNF mRNA
represents a novel form of communication between glycolysis and inflammation
in the innate immune system. In Chapter 3, I explore the mechanism by which
RelB regulates SIRT3 during endotoxin tolerance. There, I show that RelB binds
the SIRT3 promoter, where it is a direct regulator of SIRT3 gene expression. In
Chapter 4, I summarize these findings and discuss their contributions to the
broader field of sepsis research.

22
REFERENCES
1. Adhikari, N. K., R. A. Fowler, S. Bhagwanjee, and G. D. Rubenfeld. 2010. Critical care and the global burden of critical illness in adults. Lancet 376: 1339-1346.
2. Lagu, T., M. B. Rothberg, M. S. Shieh, P. S. Pekow, J. S. Steingrub, and P. K. Lindenauer. 2012. Hospitalizations, costs, and outcomes of severe sepsis in the United States 2003 to 2007. Crit Care Med 40: 754-761.
3. Angus, D. C., W. T. Linde-Zwirble, J. Lidicker, G. Clermont, J. Carcillo, and M. R. Pinsky. 2001. Epidemiology of severe sepsis in the United States: analysis of incidence, outcome, and associated costs of care. Crit Care Med 29: 1303-1310.
4. Friedman, G., E. Silva, and J. L. Vincent. 1998. Has the mortality of septic shock changed with time. Crit Care Med 26: 2078-2086.
5. Bone, R. C., R. A. Balk, F. B. Cerra, R. P. Dellinger, A. M. Fein, W. A. Knaus, R. M. Schein, and W. J. Sibbald. 1992. Definitions for sepsis and organ failure and guidelines for the use of innovative therapies in sepsis. The ACCP/SCCM Consensus Conference Committee. American College of Chest Physicians/Society of Critical Care Medicine. Chest 101: 1644-1655.
6. Levy, M. M., M. P. Fink, J. C. Marshall, E. Abraham, D. Angus, D. Cook, J. Cohen, S. M. Opal, J. L. Vincent, and G. Ramsay. 2003. 2001 SCCM/ESICM/ACCP/ATS/SIS International Sepsis Definitions Conference. Crit Care Med 31: 1250-1256.
7. Dellinger, R. P., M. M. Levy, A. Rhodes, D. Annane, H. Gerlach, S. M. Opal, J. E. Sevransky, C. L. Sprung, I. S. Douglas, R. Jaeschke, T. M. Osborn, M. E. Nunnally, S. R. Townsend, K. Reinhart, R. M. Kleinpell, D. C. Angus, C. S. Deutschman, F. R. Machado, G. D. Rubenfeld, S. A. Webb, R. J. Beale, J.-L. Vincent, R. Moreno, and G. Surviving Sepsis Campaign. 2013. Surviving Sepsis Campaign: International Guidelines for Management of Severe Sepsis and Septic Shock: 2012. Critical Care Medicine 41: 580-637.
8. Bone, R. C., W. J. Sibbald, and C. L. Sprung. 1992. The ACCP-SCCM consensus conference on sepsis and organ failure. Chest 101: 1481-1483.

23
9. Angus, D. C., and T. van der Poll. 2013. Severe sepsis and septic shock. N Engl J Med 369: 840-851.
10. Hall, T. C., D. K. Bilku, D. Al-Leswas, C. Horst, and A. R. Dennison. 2011. Biomarkers for the differentiation of sepsis and SIRS: the need for the standardisation of diagnostic studies. Ir J Med Sci 180: 793-798.
11. Dellinger, R. P., M. M. Levy, A. Rhodes, D. Annane, H. Gerlach, S. M. Opal, J. E. Sevransky, C. L. Sprung, I. S. Douglas, R. Jaeschke, T. M. Osborn, M. E. Nunnally, S. R. Townsend, K. Reinhart, R. M. Kleinpell, D. C. Angus, C. S. Deutschman, F. R. Machado, G. D. Rubenfeld, S. A. Webb, R. J. Beale, J. L. Vincent, and R. Moreno. 2013. Surviving sepsis campaign: international guidelines for management of severe sepsis and septic shock: 2012. Crit Care Med 41: 580-637.
12. Morrell, M., V. J. Fraser, and M. H. Kollef. 2005. Delaying the empiric treatment of candida bloodstream infection until positive blood culture results are obtained: a potential risk factor for hospital mortality. Antimicrob Agents Chemother 49: 3640-3645.
13. Kumar, A., D. Roberts, K. E. Wood, B. Light, J. E. Parrillo, S. Sharma, R. Suppes, D. Feinstein, S. Zanotti, L. Taiberg, D. Gurka, and M. Cheang. 2006. Duration of hypotension before initiation of effective antimicrobial therapy is the critical determinant of survival in human septic shock. Crit Care Med 34: 1589-1596.
14. Barie, P. S., L. J. Hydo, J. Shou, D. H. Larone, and S. R. Eachempati. 2005. Influence of antibiotic therapy on mortality of critical surgical illness caused or complicated by infection. Surg Infect (Larchmt) 6: 41-54.
15. Dhainaut, J. F., A. Tenaillon, Y. Le Tulzo, B. Schlemmer, J. P. Solet, M. Wolff, L. Holzapfel, F. Zeni, D. Dreyfuss, J. P. Mira, and et al. 1994. Platelet-activating factor receptor antagonist BN 52021 in the treatment of severe sepsis: a randomized, double-blind, placebo-controlled, multicenter clinical trial. BN 52021 Sepsis Study Group. Crit Care Med 22: 1720-1728.
16. Bernard, G. R., H. D. Reines, P. V. Halushka, S. B. Higgins, C. A. Metz, B. B. Swindell, P. E. Wright, F. L. Watts, and J. J. Vrbanac. 1991. Prostacyclin and thromboxane A2 formation is increased in human sepsis syndrome. Effects of cyclooxygenase inhibition. Am Rev Respir Dis 144: 1095-1101.
17. Remick, D. G. 2003. Cytokine therapeutics for the treatment of sepsis: why has nothing worked? Curr Pharm Des 9: 75-82.

24
18. Fein, A. M., G. R. Bernard, G. J. Criner, E. C. Fletcher, J. T. Good, Jr., W. A. Knaus, H. Levy, G. M. Matuschak, H. M. Shanies, R. W. Taylor, and T. C. Rodell. 1997. Treatment of severe systemic inflammatory response syndrome and sepsis with a novel bradykinin antagonist, deltibant (CP-0127). Results of a randomized, double-blind, placebo-controlled trial. CP-0127 SIRS and Sepsis Study Group. Jama 277: 482-487.
19. Fletcher, J. R., and P. W. Ramwell. 1977. Modification, by aspirin and indomethacin, of the haemodynamic and prostaglandin releasing effects of E. coli endotoxin in the dog. Br J Pharmacol 61: 175-181.
20. Etienne, A., F. Hecquet, C. Soulard, B. Spinnewyn, F. Clostre, and P. Braquet. 1986. In vivo inhibition of plasma protein leakage and Salmonella enteritidis-induced mortality in the rat by a specific paf-acether antagonist: BN 52021. Agents Actions 17: 368-370.
21. Beutler, B., I. W. Milsark, and A. C. Cerami. 1985. Passive immunization against cachectin/tumor necrosis factor protects mice from lethal effect of endotoxin. Science 229: 869-871.
22. Bernard, G. R., A. P. Wheeler, J. A. Russell, R. Schein, W. R. Summer, K. P. Steinberg, W. J. Fulkerson, P. E. Wright, B. W. Christman, W. D. Dupont, S. B. Higgins, and B. B. Swindell. 1997. The effects of ibuprofen on the physiology and survival of patients with sepsis. The Ibuprofen in Sepsis Study Group. N Engl J Med 336: 912-918.
23. Dinarello, C. A. 2001. Anti-cytokine therapies in response to systemic infection. J Investig Dermatol Symp Proc 6: 244-250.
24. Fisher, C. J., Jr., J. M. Agosti, S. M. Opal, S. F. Lowry, R. A. Balk, J. C. Sadoff, E. Abraham, R. M. Schein, and E. Benjamin. 1996. Treatment of septic shock with the tumor necrosis factor receptor:Fc fusion protein. The Soluble TNF Receptor Sepsis Study Group. N Engl J Med 334: 1697-1702.
25. Bone, R. C. 1996. Sir Isaac Newton, sepsis, SIRS, and CARS. Crit Care Med 24: 1125-1128.
26. Vallabhapurapu, S., and M. Karin. 2009. Regulation and function of NF-kappaB transcription factors in the immune system. Annu Rev Immunol 27: 693-733.
27. Wheeler, A. P., and G. R. Bernard. 1999. Treating patients with severe sepsis. N Engl J Med 340: 207-214.

25
28. Rittirsch, D., M. A. Flierl, and P. A. Ward. 2008. Harmful molecular mechanisms in sepsis. Nat Rev Immunol 8: 776-787.
29. Wang, H., and S. Ma. 2008. The cytokine storm and factors determining the sequence and severity of organ dysfunction in multiple organ dysfunction syndrome. Am J Emerg Med 26: 711-715.
30. Yoza, B. K., J. Y. Hu, S. L. Cousart, and C. E. McCall. 2000. Endotoxin inducible transcription is repressed in endotoxin tolerant cells. Shock 13: 236-243.
31. Granowitz, E. V., R. Porat, J. W. Mier, S. F. Orencole, G. Kaplanski, E. A. Lynch, K. Ye, E. Vannier, S. M. Wolff, and C. A. Dinarello. 1993. Intravenous endotoxin suppresses the cytokine response of peripheral blood mononuclear cells of healthy humans. J Immunol 151: 1637-1645.
32. Biswas, S. K., and E. Lopez-Collazo. 2009. Endotoxin tolerance: new mechanisms, molecules and clinical significance. Trends Immunol 30: 475-487.
33. McCall, C. E., and B. K. Yoza. 2007. Gene silencing in severe systemic inflammation. Am J Respir Crit Care Med 175: 763-767.
34. Monneret, G., F. Venet, A. Pachot, and A. Lepape. 2008. Monitoring immune dysfunctions in the septic patient: a new skin for the old ceremony. Mol Med 14: 64-78.
35. Boomer, J. S., K. To, K. C. Chang, O. Takasu, D. F. Osborne, A. H. Walton, T. L. Bricker, S. D. Jarman, 2nd, D. Kreisel, A. S. Krupnick, A. Srivastava, P. E. Swanson, J. M. Green, and R. S. Hotchkiss. 2011. Immunosuppression in patients who die of sepsis and multiple organ failure. Jama 306: 2594-2605.
36. Otto, G. P., M. Sossdorf, R. A. Claus, J. Rödel, K. Menge, K. Reinhart, M. Bauer, and N. C. Riedemann. 2011. The late phase of sepsis is characterized by an increased microbiological burden and death rate. In Crit Care. R183.
37. Krawczyk, C. M., T. Holowka, J. Sun, J. Blagih, E. Amiel, R. J. DeBerardinis, J. R. Cross, E. Jung, C. B. Thompson, R. G. Jones, and E. J. Pearce. 2010. Toll-like receptor-induced changes in glycolytic metabolism regulate dendritic cell activation. Blood 115: 4742-4749.

26
38. O'Neill, L. A., and D. G. Hardie. 2013. Metabolism of inflammation limited by AMPK and pseudo-starvation. Nature 493: 346-355.
39. Liu, T. F., C. M. Brown, M. El Gazzar, L. McPhail, P. Millet, A. Rao, V. T. Vachharajani, B. K. Yoza, and C. E. McCall. 2012. Fueling the flame: bioenergy couples metabolism and inflammation. J Leukoc Biol 92: 499-507.
40. Liu, T. F., V. T. Vachharajani, B. K. Yoza, and C. E. McCall. 2012. NAD+-dependent sirtuin 1 and 6 proteins coordinate a switch from glucose to fatty acid oxidation during the acute inflammatory response. J Biol Chem 287: 25758-25769.
41. Beeson, P. B. 1947. TOLERANCE TO BACTERIAL PYROGENS : I. FACTORS INFLUENCING ITS DEVELOPMENT. J Exp Med 86: 29-38.
42. Sanchez-Cantu, L., H. N. Rode, and N. V. Christou. 1989. Endotoxin tolerance is associated with reduced secretion of tumor necrosis factor. Arch Surg 124: 1432-1435; discussion 1435-1436.
43. Heagy, W., C. Hansen, K. Nieman, M. Cohen, C. Richardson, J. L. Rodriguez, and M. A. West. 2000. Impaired ex vivo lipopolysaccharide-stimulated whole blood tumor necrosis factor production may identify "septic" intensive care unit patients. Shock 14: 271-276.
44. Munoz, C., J. Carlet, C. Fitting, B. Misset, J. P. Bleriot, and J. M. Cavaillon. 1991. DYSREGULATION OF INVITRO CYTOKINE PRODUCTION BY MONOCYTES DURING SEPSIS. Journal of Clinical Investigation 88: 1747-1754.
45. Heagy, W., K. Nieman, C. Hansen, M. Cohen, D. Danielson, and M. A. West. 2003. Lower levels of whole blood LPS-stimulated cytokine release are associated with poorer clinical outcomes in surgical ICU patients. Surgical infections 4: 171-180.
46. LaRue, K. E., and C. E. McCall. 1994. A labile transcriptional repressor modulates endotoxin tolerance. J Exp Med 180: 2269-2275.
47. El Gazzar, M., A. Church, T. Liu, and C. E. McCall. 2011. MicroRNA-146a regulates both transcription silencing and translation disruption of TNF-alpha during TLR4-induced gene reprogramming. J Leukoc Biol 90: 509-519.

27
48. Chen, X., M. El Gazzar, B. K. Yoza, and C. E. McCall. 2009. The NF-kappaB factor RelB and histone H3 lysine methyltransferase G9a directly interact to generate epigenetic silencing in endotoxin tolerance. J Biol Chem 284: 27857-27865.
49. Leffler, M., T. Hrach, M. Stuerzl, R. E. Horch, D. N. Herndon, and M. G. Jeschke. 2007. Insulin attenuates apoptosis and exerts anti-inflammatory effects in endotoxemic human macrophages. J Surg Res 143: 398-406.
50. Brueckmann, M., U. Hoffmann, L. De Rossi, H. M. Weiler, V. Liebe, S. Lang, J. J. Kaden, M. Borggrefe, K. K. Haase, and G. Huhle. 2004. Activated protein C inhibits the release of macrophage inflammatory protein-1-alpha from THP-1 cells and from human monocytes. Cytokine 26: 106-113.
51. Cochran, F. R., and M. B. Finch-Arietta. 1989. Regulation of interleukin-1 beta and tumor necrosis factor secretion by the human monocytic leukemia cell line, THP-1. Agents Actions 27: 271-273.
52. Tsuchiya, S., M. Yamabe, Y. Yamaguchi, Y. Kobayashi, T. Konno, and K. Tada. 1980. Establishment and characterization of a human acute monocytic leukemia cell line (THP-1). Int J Cancer 26: 171-176.
53. Auwerx, J. 1991. The human leukemia cell line, THP-1: a multifacetted model for the study of monocyte-macrophage differentiation. Experientia 47: 22-31.
54. Yoza, B. K., J. Y. Hu, S. L. Cousart, L. M. Forrest, and C. E. McCall. 2006. Induction of RelB participates in endotoxin tolerance. J Immunol 177: 4080-4085.
55. Chen, X., B. K. Yoza, M. El Gazzar, J. Y. Hu, S. L. Cousart, and C. E. McCall. 2009. RelB sustains IkappaBalpha expression during endotoxin tolerance. Clin Vaccine Immunol 16: 104-110.
56. Liu, T. F., V. Vachharajani, P. Millet, M. S. Bharadwaj, A. J. Molina, and C. E. McCall. 2015. Sequential actions of SIRT1-RELB-SIRT3 coordinate nuclear-mitochondrial communication during immunometabolic adaptation to acute inflammation and sepsis. J Biol Chem 290: 396-408.
57. Marshall, J. C. 2003. Such stuff as dreams are made on: mediator-directed therapy in sepsis. Nat Rev Drug Discov 2: 391-405.

28
58. Eichacker, P. Q., C. Parent, A. Kalil, C. Esposito, X. Cui, S. M. Banks, E. P. Gerstenberger, Y. Fitz, R. L. Danner, and C. Natanson. 2002. Risk and the efficacy of antiinflammatory agents: retrospective and confirmatory studies of sepsis. Am J Respir Crit Care Med 166: 1197-1205.
59. Wiersinga, W. J. 2011. Current insights in sepsis: from pathogenesis to new treatment targets. Curr Opin Crit Care 17: 480-486.
60. Ranieri, V. M., B. T. Thompson, P. S. Barie, J. F. Dhainaut, I. S. Douglas, S. Finfer, B. Gardlund, J. C. Marshall, A. Rhodes, A. Artigas, D. Payen, J. Tenhunen, H. R. Al-Khalidi, V. Thompson, J. Janes, W. L. Macias, B. Vangerow, and M. D. Williams. 2012. Drotrecogin alfa (activated) in adults with septic shock. N Engl J Med 366: 2055-2064.
61. Aikawa, N., T. Takahashi, S. Fujimi, T. Yokoyama, K. Yoshihara, T. Ikeda, D. Sadamitsu, M. Momozawa, and T. Maruyama. 2013. A Phase II study of polyclonal anti-TNF-alpha (AZD9773) in Japanese patients with severe sepsis and/or septic shock. J Infect Chemother 19: 931-940.
62. O'Reilly, M., G. M. Silver, D. G. Greenhalgh, R. L. Gamelli, J. H. Davis, and J. C. Hebert. 1992. Treatment of intra-abdominal infection with granulocyte colony-stimulating factor. J Trauma 33: 679-682.
63. Haberstroh, J., H. Breuer, I. Lucke, K. Massarrat, R. Fruh, U. Mand, P. Hagedorn, L. Brunnberg, and B. U. von Specht. 1995. Effect of recombinant human granulocyte colony-stimulating factor on hemodynamic and cytokine response in a porcine model of Pseudomonas sepsis. Shock 4: 216-224.
64. Nelson, S., S. M. Belknap, R. W. Carlson, D. Dale, B. DeBoisblanc, S. Farkas, N. Fotheringham, H. Ho, T. Marrie, H. Movahhed, R. Root, and J. Wilson. 1998. A randomized controlled trial of filgrastim as an adjunct to antibiotics for treatment of hospitalized patients with community-acquired pneumonia. CAP Study Group. J Infect Dis 178: 1075-1080.
65. Nelson, S., A. M. Heyder, J. Stone, M. G. Bergeron, S. Daugherty, G. Peterson, N. Fotheringham, W. Welch, S. Milwee, and R. Root. 2000. A randomized controlled trial of filgrastim for the treatment of hospitalized patients with multilobar pneumonia. J Infect Dis 182: 970-973.
66. Carr, R., N. Modi, and C. Dore. 2003. G-CSF and GM-CSF for treating or preventing neonatal infections. Cochrane Database Syst Rev: Cd003066.

29
67. Root, R. K., R. F. Lodato, W. Patrick, J. F. Cade, N. Fotheringham, S. Milwee, J. L. Vincent, A. Torres, J. Rello, and S. Nelson. 2003. Multicenter, double-blind, placebo-controlled study of the use of filgrastim in patients hospitalized with pneumonia and severe sepsis. Crit Care Med 31: 367-373.
68. Meisel, C., J. C. Schefold, R. Pschowski, T. Baumann, K. Hetzger, J. Gregor, S. Weber-Carstens, D. Hasper, D. Keh, H. Zuckermann, P. Reinke, and H. D. Volk. 2009. Granulocyte-macrophage colony-stimulating factor to reverse sepsis-associated immunosuppression: a double-blind, randomized, placebo-controlled multicenter trial. Am J Respir Crit Care Med 180: 640-648.
69. Hall, M. W., N. L. Knatz, C. Vetterly, S. Tomarello, M. D. Wewers, H. D. Volk, and J. A. Carcillo. 2011. Immunoparalysis and nosocomial infection in children with multiple organ dysfunction syndrome. Intensive Care Med 37: 525-532.
70. Hotchkiss, R. S., and E. R. Sherwood. 2015. Immunology. Getting sepsis therapy right. Science 347: 1201-1202.
71. Docke, W. D., F. Randow, U. Syrbe, D. Krausch, K. Asadullah, P. Reinke, H. D. Volk, and W. Kox. 1997. Monocyte deactivation in septic patients: restoration by IFN-gamma treatment. Nat Med 3: 678-681.
72. Kox, W. J., R. C. Bone, D. Krausch, W. D. Docke, S. N. Kox, H. Wauer, K. Egerer, S. Querner, K. Asadullah, R. von Baehr, and H. D. Volk. 1997. Interferon gamma-1b in the treatment of compensatory anti-inflammatory response syndrome. A new approach: proof of principle. Arch Intern Med 157: 389-393.
73. Delsing, C. E., M. S. Gresnigt, J. Leentjens, F. Preijers, F. A. Frager, M. Kox, G. Monneret, F. Venet, C. P. Bleeker-Rovers, F. L. van de Veerdonk, P. Pickkers, A. Pachot, B. J. Kullberg, and M. G. Netea. 2014. Interferon-gamma as adjunctive immunotherapy for invasive fungal infections: a case series. In BMC Infect Dis. 166.
74. Venet, F., A. P. Foray, A. Villars-Mechin, C. Malcus, F. Poitevin-Later, A. Lepape, and G. Monneret. 2012. IL-7 restores lymphocyte functions in septic patients. J Immunol 189: 5073-5081.
75. Opal, S. M. 2010. New perspectives on immunomodulatory therapy for bacteraemia and sepsis. Int J Antimicrob Agents 36 Suppl 2: S70-73.
30
76. Calandra, T., B. Echtenacher, D. L. Roy, J. Pugin, C. N. Metz, L. Hultner, D. Heumann, D. Mannel, R. Bucala, and M. P. Glauser. 2000. Protection from septic shock by neutralization of macrophage migration inhibitory factor. Nat Med 6: 164-170.
77. Huang, X., F. Venet, Y. L. Wang, A. Lepape, Z. Yuan, Y. Chen, R. Swan, H. Kherouf, G. Monneret, C. S. Chung, and A. Ayala. 2009. PD-1 expression by macrophages plays a pathologic role in altering microbial clearance and the innate inflammatory response to sepsis. Proc Natl Acad Sci U S A 106: 6303-6308.
78. Angus, D. C., and R. S. Wax. 2001. Epidemiology of sepsis: an update. Crit Care Med 29: S109-116.
79. Baldwin, A. S. 1996. The NF-kappa B and I kappa B proteins: New discoveries and insights. Annual Review of Immunology 14: 649-683.
80. Perkins, N. D. 2000. The Rel/NF-kappa B family: friend and foe. Trends in Biochemical Sciences 25: 434-440.
81. Basak, S., H. Kim, J. D. Kearns, V. Tergaonkar, E. O'Dea, S. L. Werner, C. A. Benedict, C. F. Ware, G. Ghosh, I. M. Verma, and A. Hoffmann. 2007. A fourth I kappa B protein within the NF-kappa B signaling module. Cell 128: 369-381.
82. Perkins, N. D. 2007. Integrating cell-signalling pathways with NF-kappa B and IKK function. Nature Reviews Molecular Cell Biology 8: 49-62.
83. Beg, A. A., and D. Baltimore. 1996. An essential role for NF-kappa B in preventing TNF-alpha-induced cell death. Science 274: 782-784.
84. Hoffmann, A., and D. Baltimore. 2006. Circuitry of nuclear factor kappa B signaling. Immunological Reviews 210: 171-186.
85. Burke, B., N. Tang, K. P. Corke, D. Tazzyman, K. Ameri, M. Wells, and C. E. Lewis. 2002. Expression of HIF-1alpha by human macrophages: implications for the use of macrophages in hypoxia-regulated cancer gene therapy. J Pathol 196: 204-212.
86. Walmsley, S. R., K. A. Cadwallader, and E. R. Chilvers. 2005. The role of HIF-1 alpha in myeloid cell inflammation. Trends in Immunology 26: 434-439.

31
87. Belaiba, R. S., S. Bonello, C. Zahringer, S. Schmidt, J. Hess, T. Kietzmann, and A. Gorlach. 2007. Hypoxia up-regulates hypoxia-inducible factor-1alpha transcription by involving phosphatidylinositol 3-kinase and nuclear factor kappaB in pulmonary artery smooth muscle cells. Mol Biol Cell 18: 4691-4697.
88. Benita, Y., H. Kikuchi, A. D. Smith, M. Q. Zhang, D. C. Chung, and R. J. Xavier. 2009. An integrative genomics approach identifies Hypoxia Inducible Factor-1 (HIF-1)-target genes that form the core response to hypoxia. Nucleic Acids Res 37: 4587-4602.
89. Dofferhoff, A. S. M., V. J. J. Bom, H. G. Devrieshospers, J. Vaningen, J. Vandermeer, B. P. C. Hazenberg, P. O. M. Mulder, and J. Weits. 1992. PATTERNS OF CYTOKINES, PLASMA ENDOTOXIN, PLASMINOGEN-ACTIVATOR INHIBITOR, AND ACUTE-PHASE PROTEINS DURING THE TREATMENT OF SEVERE SEPSIS IN HUMANS. Critical Care Medicine 20: 185-192.
90. Dick, A. D., J. V. Forrester, J. Liversidge, and A. P. Cope. 2004. The role of tumour necrosis factor (TNF-alpha) in experimental autoimmune uveoretinitis (EAU). Prog Retin Eye Res 23: 617-637.
91. Bradley, J. R. 2008. TNF-mediated inflammatory disease. J Pathol 214: 149-160.
92. El Gazzar, M., B. K. Yoza, J. Y. Hu, S. L. Cousart, and C. E. McCall. 2007. Epigenetic silencing of tumor necrosis factor alpha during endotoxin tolerance. In J Biol Chem, United States. 26857-26864.
93. DeForge, L. E., and D. G. Remick. 1991. Kinetics of TNF, IL-6, and IL-8 gene expression in LPS-stimulated human whole blood. Biochem Biophys Res Commun 174: 18-24.
94. Zhong, H., R. E. Voll, and S. Ghosh. 1998. Phosphorylation of NF-kappa B p65 by PKA stimulates transcriptional activity by promoting a novel bivalent interaction with the coactivator CBP/p300. Mol Cell 1: 661-671.
95. Sheppard, K. A., D. W. Rose, Z. K. Haque, R. Kurokawa, E. McInerney, S. Westin, D. Thanos, M. G. Rosenfeld, C. K. Glass, and T. Collins. 1999. Transcriptional activation by NF-kappaB requires multiple coactivators. Mol Cell Biol 19: 6367-6378.
96. Tsai, E. Y., J. V. Falvo, A. V. Tsytsykova, A. K. Barczak, A. M. Reimold, L. H. Glimcher, M. J. Fenton, D. C. Gordon, I. F. Dunn, and A. E. Goldfeld.

32
2000. A lipopolysaccharide-specific enhancer complex involving Ets, Elk-1, Sp1, and CREB binding protein and p300 is recruited to the tumor necrosis factor alpha promoter in vivo. Mol Cell Biol 20: 6084-6094.
97. Moelants, E. A., A. Mortier, J. Van Damme, and P. Proost. 2013. Regulation of TNF-alpha with a focus on rheumatoid arthritis. Immunol Cell Biol 91: 393-401.
98. Khera, T. K., A. D. Dick, and L. B. Nicholson. 2010. Mechanisms of TNFalpha regulation in uveitis: focus on RNA-binding proteins. Prog Retin Eye Res 29: 610-621.
99. Carballo, E., W. S. Lai, and P. J. Blackshear. 1998. Feedback inhibition of macrophage tumor necrosis factor-alpha production by tristetraprolin. Science 281: 1001-1005.
100. Lu, J. Y., N. Sadri, and R. J. Schneider. 2006. Endotoxic shock in AUF1 knockout mice mediated by failure to degrade proinflammatory cytokine mRNAs. Genes Dev 20: 3174-3184.
101. Dean, J. L., R. Wait, K. R. Mahtani, G. Sully, A. R. Clark, and J. Saklatvala. 2001. The 3' untranslated region of tumor necrosis factor alpha mRNA is a target of the mRNA-stabilizing factor HuR. Mol Cell Biol 21: 721-730.
102. Dan, C., B. Jinjun, H. Zi-Chun, M. Lin, C. Wei, Z. Xu, Z. Ri, C. Shun, S. Wen-Zhu, J. Qing-Cai, and Y. Wu. 2015. Modulation of TNF-α mRNA stability by human antigen R and miR181s in sepsis-induced immunoparalysis. EMBO Mol Med 7: 140-157.
103. El Gazzar, M., and C. E. McCall. 2010. MicroRNAs distinguish translational from transcriptional silencing during endotoxin tolerance. J Biol Chem 285: 20940-20951.
104. Maciver, N. J., S. R. Jacobs, H. L. Wieman, J. A. Wofford, J. L. Coloff, and J. C. Rathmell. 2008. Glucose metabolism in lymphocytes is a regulated process with significant effects on immune cell function and survival. J Leukoc Biol 84: 949-957.
105. O'Neill, L. A. J., and D. G. Hardie. 2013. Metabolism of inflammation limited by AMPK and pseudo-starvation. Nature 493: 346-355.

33
106. Pearce, E. L. 2010. Metabolism in T cell activation and differentiation. Curr Opin Immunol 22: 314-320.
107. Haschemi, A., P. Kosma, L. Gille, C. R. Evans, C. F. Burant, P. Starkl, B. Knapp, R. Haas, J. A. Schmid, C. Jandl, S. Amir, G. Lubec, J. Park, H. Esterbauer, M. Bilban, L. Brizuela, J. A. Pospisilik, L. E. Otterbein, and O. Wagner. 2012. The Sedoheptulose Kinase CARKL Directs Macrophage Polarization through Control of Glucose Metabolism. Cell Metabolism 15: 813-826.
108. van der Windt, G. J., B. Everts, C. H. Chang, J. D. Curtis, T. C. Freitas, E. Amiel, E. J. Pearce, and E. L. Pearce. 2012. Mitochondrial respiratory capacity is a critical regulator of CD8+ T cell memory development. Immunity 36: 68-78.
109. Michalek, R. D., V. A. Gerriets, S. R. Jacobs, A. N. Macintyre, N. J. MacIver, E. F. Mason, S. A. Sullivan, A. G. Nichols, and J. C. Rathmell. 2011. Cutting edge: distinct glycolytic and lipid oxidative metabolic programs are essential for effector and regulatory CD4+ T cell subsets. J Immunol 186: 3299-3303.
110. Rossi, F., V. Della Bianca, and P. de Togni. 1985. Mechanisms and functions of the oxygen radicals producing respiration of phagocytes. Comp Immunol Microbiol Infect Dis 8: 187-204.
111. Cramer, T., Y. Yamanishi, B. E. Clausen, I. Forster, R. Pawlinski, N. Mackman, V. H. Haase, R. Jaenisch, M. Corr, V. Nizet, G. S. Firestein, H. P. Gerber, N. Ferrara, and R. S. Johnson. 2003. HIF-1alpha is essential for myeloid cell-mediated inflammation. Cell 112: 645-657.
112. Hara, T., K. Mimura, T. Abe, G. Shioi, M. Seiki, and T. Sakamoto. 2011. Deletion of the Mint3/Apba3 gene in mice abrogates macrophage functions and increases resistance to lipopolysaccharide-induced septic shock. J Biol Chem 286: 32542-32551.
113. Dietl, K., K. Renner, K. Dettmer, B. Timischl, K. Eberhart, C. Dorn, C. Hellerbrand, M. Kastenberger, L. A. Kunz-Schughart, P. J. Oefner, R. Andreesen, E. Gottfried, and M. P. Kreutz. 2010. Lactic acid and acidification inhibit TNF secretion and glycolysis of human monocytes. J Immunol 184: 1200-1209.
114. Hentze, M. W., and T. Preiss. 2010. The REM phase of gene regulation. Trends Biochem Sci 35: 423-426.
34
115. Dashty, M. 2013. A quick look at biochemistry: carbohydrate metabolism. Clin Biochem 46: 1339-1352.
116. Nagy, E., and W. F. Rigby. 1995. Glyceraldehyde-3-phosphate dehydrogenase selectively binds AU-rich RNA in the NAD(+)-binding region (Rossmann fold). J Biol Chem 270: 2755-2763.
117. Tristan, C., N. Shahani, T. W. Sedlak, and A. Sawa. 2011. The diverse functions of GAPDH: views from different subcellular compartments. Cell Signal 23: 317-323.
118. Ralser, M., M. M. Wamelink, A. Kowald, B. Gerisch, G. Heeren, E. A. Struys, E. Klipp, C. Jakobs, M. Breitenbach, H. Lehrach, and S. Krobitsch. 2007. Dynamic rerouting of the carbohydrate flux is key to counteracting oxidative stress. Journal of biology 6: 10-10.
119. Hara, M. R., N. Agrawal, S. F. Kim, M. B. Cascio, M. Fujimuro, Y. Ozeki, M. Takahashi, J. H. Cheah, S. K. Tankou, L. D. Hester, C. D. Ferris, S. D. Hayward, S. H. Snyder, and A. Sawa. 2005. S-nitrosylated GAPDH initiates apoptotic cell death by nuclear translocation following Siah1 binding. Nat Cell Biol 7: 665-674.
120. Nakajima, H., W. Amano, A. Fujita, A. Fukuhara, Y. T. Azuma, F. Hata, T. Inui, and T. Takeuchi. 2007. The active site cysteine of the proapoptotic protein glyceraldehyde-3-phosphate dehydrogenase is essential in oxidative stress-induced aggregation and cell death. J Biol Chem 282: 26562-26574.
121. Rodriguez-Pascual, F., M. Redondo-Horcajo, N. Magan-Marchal, D. Lagares, A. Martinez-Ruiz, H. Kleinert, and S. Lamas. 2008. Glyceraldehyde-3-phosphate dehydrogenase regulates endothelin-1 expression by a novel, redox-sensitive mechanism involving mRNA stability. Mol Cell Biol 28: 7139-7155.
122. Ikeda, Y., R. Yamaji, K. Irie, N. Kioka, and A. Murakami. 2012. Glyceraldehyde-3-phosphate dehydrogenase regulates cyclooxygenase-2 expression by targeting mRNA stability. Arch Biochem Biophys 528: 141-147.
123. Chang, C. H., J. D. Curtis, L. B. Maggi, Jr., B. Faubert, A. V. Villarino, D. O'Sullivan, S. C. Huang, G. J. van der Windt, J. Blagih, J. Qiu, J. D. Weber, E. J. Pearce, R. G. Jones, and E. L. Pearce. 2013. Posttranscriptional control of T cell effector function by aerobic glycolysis. Cell 153: 1239-1251.

35
124. Boekstegers, P., S. Weidenhofer, G. Pilz, and K. Werdan. 1991. Peripheral oxygen availability within skeletal muscle in sepsis and septic shock: comparison to limited infection and cardiogenic shock. Infection 19: 317-323.
125. Lunt, S. Y., and M. G. Vander Heiden. 2011. Aerobic Glycolysis: Meeting the Metabolic Requirements of Cell Proliferation. Annual Review of Cell and Developmental Biology, Vol 27 27: 441-464.
126. Palsson-McDermott, E. M., and L. A. J. O'Neill. 2013. The Warburg effect then and now: From cancer to inflammatory diseases. Bioessays 35: 965-973.
127. Rashkin, M. C., C. Bosken, and R. P. Baughman. 1985. Oxygen delivery in critically ill patients. Relationship to blood lactate and survival. Chest 87: 580-584.
128. Fernandes, C. J., N. Akamine, F. V. De Marco, J. A. De Souza, S. Lagudis, and E. Knobel. 2001. Red blood cell transfusion does not increase oxygen consumption in critically ill septic patients. In Crit Care. 362-367.
129. Hollenberg, S. M., T. S. Ahrens, M. E. Astiz, D. B. Chalfin, J. F. Dasta, S. O. Heard, C. Martin, G. M. Susla, J. L. Vincent, and M. Task Force Amer Coll Critical Care. 1999. Practice parameters for hemodynamic support of sepsis in adult patients in sepsis. Critical Care Medicine 27: 639-660.
130. Brealey, D., M. Brand, I. Hargreaves, S. Heales, J. Land, R. Smolenski, N. A. Davies, C. E. Cooper, and M. Singer. 2002. Association between mitochondrial dysfunction and severity and outcome of septic shock. Lancet 360: 219-223.
131. Tu, W., S. Satoi, Z. Zhang, H. Kitade, T. Okumura, A. H. Kwon, and Y. Kamiyama. 2003. Hepatocellular dysfunction induced by nitric oxide production in hepatocytes isolated from rats with sepsis. Shock 19: 373-377.
132. Hotchkiss, R. S., and I. E. Karl. 1992. Reevaluation of the role of cellular hypoxia and bioenergetic failure in sepsis. Jama 267: 1503-1510.
133. Gong, Y., L. Zou, Y. Feng, D. Li, J. Cai, D. Chen, and W. Chao. 2014. Importance of Toll-like receptor 2 in mitochondrial dysfunction during polymicrobial sepsis. Anesthesiology 121: 1236-1247.

36
134. Taylor, D. E., A. J. Ghio, and C. A. Piantadosi. 1995. Reactive oxygen species produced by liver mitochondria of rats in sepsis. Arch Biochem Biophys 316: 70-76.
135. Bulua, A. C., A. Simon, R. Maddipati, M. Pelletier, H. Park, K. Y. Kim, M. N. Sack, D. L. Kastner, and R. M. Siegel. 2011. Mitochondrial reactive oxygen species promote production of proinflammatory cytokines and are elevated in TNFR1-associated periodic syndrome (TRAPS). J Exp Med 208: 519-533.
136. Kamata, H., S. Honda, S. Maeda, L. Chang, H. Hirata, and M. Karin. 2005. Reactive oxygen species promote TNFalpha-induced death and sustained JNK activation by inhibiting MAP kinase phosphatases. Cell 120: 649-661.
137. West, A. P., I. E. Brodsky, C. Rahner, D. K. Woo, H. Erdjument-Bromage, P. Tempst, M. C. Walsh, Y. Choi, G. S. Shadel, and S. Ghosh. 2011. TLR signaling augments macrophage bactericidal activity through mitochondrial ROS. Nature 472: 476-480.
138. Haden, D. W., H. B. Suliman, M. S. Carraway, K. E. Welty-Wolf, A. S. Ali, H. Shitara, H. Yonekawa, and C. A. Piantadosi. 2007. Mitochondrial biogenesis restores oxidative metabolism during Staphylococcus aureus sepsis. Am J Respir Crit Care Med 176: 768-777.
139. Carre, J. E., J. C. Orban, L. Re, K. Felsmann, W. Iffert, M. Bauer, H. B. Suliman, C. A. Piantadosi, T. M. Mayhew, P. Breen, M. Stotz, and M. Singer. 2010. Survival in critical illness is associated with early activation of mitochondrial biogenesis. Am J Respir Crit Care Med 182: 745-751.
140. Milne, J. C., and J. M. Denu. 2008. The Sirtuin family: therapeutic targets to treat diseases of aging. Curr Opin Chem Biol 12: 11-17.
141. Imai, S. 2009. Nicotinamide phosphoribosyltransferase (Nampt): a link between NAD biology, metabolism, and diseases. Curr Pharm Des 15: 20-28.
142. Liu, T. F., B. K. Yoza, M. El Gazzar, V. T. Vachharajani, and C. E. McCall. 2011. NAD+-dependent SIRT1 deacetylase participates in epigenetic reprogramming during endotoxin tolerance. J Biol Chem 286: 9856-9864.
143. Yeung, F., J. E. Hoberg, C. S. Ramsey, M. D. Keller, D. R. Jones, R. A. Frye, and M. W. Mayo. 2004. Modulation of NF-kappa B-dependent transcription and cell survival by the SIRT1 deacetylase. Embo Journal 23: 2369-2380.

37
144. Moorthy, A. K., D.-B. Huang, V. Y.-F. Wang Don Vu, and G. Ghosh. 2007. X-ray structure of a NF-kappa B p50/ReIB/DNA complex reveals assembly of multiple dimers on tandem kappa B sites. Journal of Molecular Biology 373: 723-734.
145. Ryseck, R. P., P. Bull, M. Takamiya, V. Bours, U. Siebenlist, P. Dobrzanski, and R. Bravo. 1992. RELB, A NEW REL FAMILY TRANSCRIPTION ACTIVATOR THAT CAN INTERACT WITH P50-NF-KAPPA-B. Molecular and Cellular Biology 12: 674-684.
146. Xia, Y., M. E. Pauza, L. Feng, and D. Lo. 1997. RelB regulation of chemokine expression modulates local inflammation. Am J Pathol 151: 375-387.
147. Bren, G. D., N. J. Solan, H. Miyoshi, K. N. Pennington, L. J. Pobst, and C. V. Paya. 2001. Transcription of the RelB gene is regulated by NF-kappa B. Oncogene 20: 7722-7733.
148. Marienfeld, R., M. J. May, I. Berberich, E. Serfling, S. Ghosh, and M. Neumann. 2003. RelB forms transcriptionally inactive complexes with RelA/p65. J Biol Chem 278: 19852-19860.
149. Saccani, S., S. Pantano, and G. Natoli. 2003. Modulation of NF-kappaB activity by exchange of dimers. Mol Cell 11: 1563-1574.
150. Yoza, B. K., and C. E. McCall. 2011. Facultative heterochromatin formation at the IL-1 beta promoter in LPS tolerance and sepsis. Cytokine 53: 145-152.
151. McCall, C. E., M. El Gazzar, T. Liu, V. Vachharajani, and B. Yoza. 2011. Epigenetics, bioenergetics, and microRNA coordinate gene-specific reprogramming during acute systemic inflammation. J Leukoc Biol 90: 439-446.
152. Millet, P., C. McCall, and B. Yoza. 2013. RelB: an outlier in leukocyte biology. J Leukoc Biol 94: 941-951.
153. Nemoto, S., M. M. Fergusson, and T. Finkel. 2005. SIRT1 functionally interacts with the metabolic regulator and transcriptional coactivator PGC-1{alpha}. J Biol Chem 280: 16456-16460.
154. Zhong, L., A. D'Urso, D. Toiber, C. Sebastian, R. E. Henry, D. D. Vadysirisack, A. Guimaraes, B. Marinelli, J. D. Wikstrom, T. Nir, C. B.

38
Clish, B. Vaitheesvaran, O. Iliopoulos, I. Kurland, Y. Dor, R. Weissleder, O. S. Shirihai, L. W. Ellisen, J. M. Espinosa, and R. Mostoslavsky. 2010. The histone deacetylase Sirt6 regulates glucose homeostasis via Hif1alpha. Cell 140: 280-293.
155. Zhong, L., A. D'Urso, D. Toiber, C. Sebastian, R. E. Henry, D. D. Vadysirisack, A. Guimaraes, B. Marinelli, J. D. Wikstrom, T. Nir, C. B. Clish, B. Vaitheesvaran, O. Iliopoulos, I. Kurland, Y. Dor, R. Weissleder, O. S. Shirihai, L. W. Ellisen, J. M. Espinosa, and R. Mostoslavsky. 2010. The Histone Deacetylase Sirt6 Regulates Glucose Homeostasis via Hif1 alpha. Cell 140: 280-293.
156. Giralt, A., and F. Villarroya. 2012. SIRT3, a pivotal actor in mitochondrial functions: metabolism, cell death and aging. Biochem J 444: 1-10.
157. Lombard, D. B., F. W. Alt, H. L. Cheng, J. Bunkenborg, R. S. Streeper, R. Mostoslavsky, J. Kim, G. Yancopoulos, D. Valenzuela, A. Murphy, Y. Yang, Y. Chen, M. D. Hirschey, R. T. Bronson, M. Haigis, L. P. Guarente, R. V. Farese, Jr., S. Weissman, E. Verdin, and B. Schwer. 2007. Mammalian Sir2 homolog SIRT3 regulates global mitochondrial lysine acetylation. Mol Cell Biol 27: 8807-8814.
158. Ahn, B. H., H. S. Kim, S. Song, I. H. Lee, J. Liu, A. Vassilopoulos, C. X. Deng, and T. Finkel. 2008. A role for the mitochondrial deacetylase Sirt3 in regulating energy homeostasis. Proc Natl Acad Sci U S A 105: 14447-14452.
159. Kong, X., R. Wang, Y. Xue, X. Liu, H. Zhang, Y. Chen, F. Fang, and Y. Chang. 2010. Sirtuin 3, a new target of PGC-1alpha, plays an important role in the suppression of ROS and mitochondrial biogenesis. PLoS One 5: e11707.
160. Rodriguez-Prados, J.-C., P. G. Traves, J. Cuenca, D. Rico, J. Aragones, P. Martin-Sanz, M. Cascante, and L. Bosca. 2010. Substrate Fate in Activated Macrophages: A Comparison between Innate, Classic, and Alternative Activation. Journal of Immunology 185: 605-614.
161. Vats, D., L. Mukundan, J. I. Odegaard, L. Zhang, K. L. Smith, C. R. Morel, R. A. Wagner, D. R. Greaves, P. J. Murray, and A. Chawla. 2006. Oxidative metabolism and PGC-1beta attenuate macrophage-mediated inflammation. Cell Metab 4: 13-24.
162. Vickers, A. E., P. Bentley, and R. L. Fisher. 2006. Consequences of mitochondrial injury induced by pharmaceutical fatty acid oxidation

39
inhibitors is characterized in human and rat liver slices. Toxicol In Vitro 20: 1173-1182.
163. Purushotham, A., T. T. Schug, Q. Xu, S. Surapureddi, X. Guo, and X. Li. 2009. Hepatocyte-Specific Deletion of SIRT1 Alters Fatty Acid Metabolism and Results in Hepatic Steatosis and Inflammation. Cell Metabolism 9: 327-338.
164. Pfluger, P. T., D. Herranz, S. Velasco-Miguel, M. Serrano, and M. H. Tschop. 2008. Sirt1 protects against high-fat diet-induced metabolic damage. Proceedings of the National Academy of Sciences of the United States of America 105: 9793-9798.
165. Gillum, M. P., M. E. Kotas, D. M. Erion, R. Kursawe, P. Chatterjee, K. T. Nead, E. S. Muise, J. J. Hsiao, D. W. Frederick, S. Yonemitsu, A. S. Banks, L. Qiang, S. Bhanot, J. M. Olefsky, D. D. Sears, S. Caprio, and G. I. Shulman. 2011. SirT1 Regulates Adipose Tissue Inflammation. Diabetes
60: 3235-3245.

40
Chapter 2
The following manuscript was submitted to J Immunol and is reprinted with
permission. Stylistic variations are due to requirements of the journal.
Title: GAPDH Binding to TNF mRNA Contributes to Post-Transcriptional
Repression in Monocytes: A Novel Mechanism of Communication between
Inflammation and Metabolism
Running title: GAPDH Binding Represses TNF Translation
Authors: Patrick Millet, BS; Vidula Vachharajani, MD; Linda McPhail, PhD;
Barbara Yoza, PhD; and Charles McCall, MD
ABSTRACT
Expression of the inflammatory cytokine TNF is tightly controlled. During
endotoxin tolerance, transcription of TNF mRNA is repressed, although not
entirely eliminated. Production of TNF cytokine, however, is further controlled by
post-transcriptional regulation. In this study, we detail a mechanism of post-
transcriptional repression of TNF mRNA by GAPDH binding to the TNF 3’UTR.
Using RNA immunoprecipitation, we demonstrate that GAPDH-TNF mRNA
binding increases when THP-1 monocytes are in a low glycolysis state, and that
this binding can be reversed by increasing glycolysis. We demonstrate that
GAPDH-TNF mRNA binding results in post-transcriptional repression of TNF and
that the TNF mRNA 3’UTR is sufficient for repression. Finally, after exploring this
model in THP-1 cells, we demonstrate this mechanism affects TNF expression in

41
primary human monocytes and macrophages. We conclude that GAPDH-TNF
mRNA binding regulates expression of TNF based on cellular metabolic state.
We believe this mechanism has potentially significant implications for treatment
of various immunometabolic conditions, including immune paralysis during septic
shock.
INTRODUCTION
The link between glycolysis and inflammation is well established. Many
innate immune cell types specifically require glycolysis in order to perform their
effector functions. When glycolysis is inhibited, leukocytes show decreased
adhesion, mobility, and bacterial clearance (1-4). Monocytes produce less TNF
cytokine when treated with the glycolysis inhibitor 2-deoxyglucose, but not when
treated with the mitochondrial inhibitor rotenone (4). Additionally, macrophages
express greater levels of pro-inflammatory cytokines when forced to rely on
glycolysis, but express much lower levels when fatty acid oxidation is
upregulated (5). This relationship between inflammation and glycolysis appears
in certain disease states, as well. As the endotoxin response proceeds to
tolerance, monocytes downregulate glycolysis and upregulate fatty acid oxidation
(6-8). This shift in metabolism occurs simultaneously with the onset of
immunosuppression.
Recent findings indicate that glycolysis and inflammation communicate in
ways not previously appreciated. One of the key enzymes in glycolysis is
GAPDH, which converts glyceraldehyde-3-phosphate (G3P) into 1,3-

42
bisphosphoglycerate in the sixth step of the glycolysis pathway (9). GAPDH also
has a lesser known capacity as an RNA-binding protein (10). Specifically,
GAPDH binds to AU-rich elements (ARE) found in the 3’UTR of many mRNAs.
AU-rich elements are present in many inflammatory genes, including cytokines
like IFN-γ and TNF (11-13). GAPDH binding to a generic ARE is inhibited by G3P
(14), and NAD+, a necessary cofactor for its enzymatic activity (10). Recently, it
was shown GAPDH-ARE binding is responsible for post-transcriptional regulation
of IFN-γ expression in T-cells (15). This binding is disrupted by the metabolite
G3P, making this mechanism sensitive to cellular metabolism. Some argue that
these types of RNA-enzyme-metabolite interactions broadly affect gene
expression (16), however, these mechanisms remain largely unexplored.
Expression of TNF is tightly regulated in immune cells. During endotoxin
tolerance, much of this regulation occurs at the level of chromatin (17-24).
Tolerant monocytes and other immune cells fail to generate TNF mRNA in
response to an additional stimulus while they are in the immunosuppressed
state. This repression of TNF expression also occurs at the post-transcriptional
level (25-27). Even if transcription of TNF mRNA is restored to tolerant
monocytes, they continue to show deficiencies in TNF cytokine production. This
deficiency results from post-transcriptional repression mediated by microRNA
(25, 26). A number of reports describe other post-transcriptional mechanisms
which regulate TNF expression (28-32), however none of these mechanisms
propose that cellular metabolic state informs the regulation process. In this study,

43
we propose a mechanism where glycolysis directly affects TNF expression
through post-transcriptional regulation.
With our previous work in the background in regards to post-transcriptional
repression of TNF mRNA and immunometabolic shifts in monocytes during the
endotoxin response, we speculated that GAPDH-ARE binding might contribute to
regulation of TNF expression in monocytes. We hypothesized that if glycolysis
was limited, GAPDH would bind the AU-rich element of TNF mRNA, thereby
limiting its translation. To test this, we first cultured our THP-1 cells in media
where glucose was replaced by galactose. Since galactose is metabolized more
slowly than glucose (33), these cells adopted a less glycolytic, more oxidative
metabolism. We not only found GAPDH binding to TNF mRNA in galactose-fed
monocytic cells, but that this binding also occurs in endotoxin tolerant cells
following the natural downregulation of glycolysis monocytes exhibit during
tolerance. Furthermore, we found that GAPDH-TNF mRNA binding is affected by
pharmacological manipulation of glycolysis. Our results indicate this mechanism
allows leukocyte cell metabolism to fine-tune TNF gene expression. These
findings have potential implications for any number of disease states involving
inflammation and metabolism, such as immunoparalysis during septic shock.
MATERIALS AND METHODS
Cell Culturing
THP-1 cells were grown in RPMI 1640 with 10% FBS, L-glutamine, and
penn-strep media. Cells were kept in a 5% CO2 incubator at 37°C and

44
subcultured every 1-3 days to maintain a density of 20-80(10)4 cells/mL (34).
THP-1 cells were maintained in an undifferentiated state. Galactose-fed cells
were taken from standard glucose-fed cultures, spun down, washed with PBS,
and grown in RPMI 1640 (no glucose, 2g/L galactose) for five or more days
before use in any experiments.
THP-1 cells were tolerized with addition of 1ug/mL LPS for 24 hours. For
experiments involving second dose exposure of LPS, cells were spun down and
resuspended in fresh media for 1 hour before proceeding with second doses of
LPS, also at 1ug/mL.
Preparation of human primary monocytes/macrophages
Primary monocytes/macrophage cells were collected from heparinized
venous blood samples donated by healthy adult volunteers according to the IRB
protocol approved by Wake Forest University (35). RBCs, platelets, and PMNs
were removed through Isolymph (Gallard-Schlesinger Industries) centrifugation
of whole blood. Monocytes were then enriched through a 2 hour adherence step,
after which non-adherent cells were removed. Cells were then cultured overnight
in fresh RPMI containing 10% FBS and either glucose or galactose, with or
without 100ng/mL LPS to induce ex-vivo endotoxin tolerance. Brightfield analysis
of morphology showed resulting cultures had >90% monocytes and
macrophages.
Metabolic Assays
Assessment of oxygen consumption rate (OCR) and extracellular
acidification rates (ECAR) were made using the Seahorse XF24 Extracellular

45
Flux Analyzer (Seahorse Bioscience) (36). Plates were coated with Cell-Tak (BD
Biosciences) (37) and dried overnight before addition of 25(10)4 cells/well in
unbuffered DMEM (10% FBS, 2g/L glucose or galactose) and 1 hour incubation
in a CO2-free 37°C incubator. Plates were assayed according to manufacturer’s
instructions.
Lactate assays were performed using L-Lactate Assay Kit (Eton
Bioscience) according to manufacturer’s instructions (38). Cells were kept in
phenol-red free DMEM with 2g/L glucose or galactose during the assay.
ELISA
Quantikine TNF ELISA kit (R&D Systems) was used according to
manufacturer’s instructions for measuring TNF protein concentration (39). Cells
were washed twice with PBS and resuspended to a density of 80(10)4 cell/mL in
appropriate media before incubation with or without LPS. Supernatant of
resulting cultures was collected when indicated and used for assay.
RT-qPCR
RNA was isolated using STAT60 (Tel-Test Inc) when isolation was
required outside the context of RNA Immunoprecipitation (40). RNA quality was
measured on a NanoDrop 1000 (Thermo Scientific) before reverse transcription
using the qScript cDNA Synthesis (Quanta Bioscience) system (41). Quantitative
PCR was done using Taqman reagents and probe/primer mixes (Applied
Biosystems) on the ABI7500 Fast.

46
For RNA stability assay, cells were stimulated with LPS for 1 hour, then
given 5ug/mL actinomycin D for indicated time. Cells were then pelleted and
RNA isolated as described above (23).
RNA Immunoprecipitation
RNA Immunoprecipitation was performed using the Magna RIP kit
(Millipore) according to manufacturer’s instructions (42). Briefly, cultures of
10(10)6 cells were prepared as described above, spun down, washed, and lysed
with -80°C freezing. Lysates were then spun down and supernatants transferred
to tubes with magnetic beads that were previously treated with 5ug of anti-
GAPDH antibody (Sigma) or non-specific IgG. Lysates were rotated with beads
overnight, washed the next day, eluted (alongside input RNA), isolated with
phenol-chloroform-isoamyl alcohol, ethanol precipitated, and resuspended in
RNase free water. Quality of input RNA was assessed and all samples measured
through RT-qPCR as described above.
Western Blotting
THP-1 cells were cultured and treated as indicated in text. Cells were
pelleted and lysed in RIPA buffer. 50ug protein was loaded into each well of a 4-
20% Precise Protein gel (Thermo-Fisher). Blot was run and transferred according
to gel manufacturer’s instructions (43).
Luciferase Reporter
THP-1 cells were plated in white 96-well plates in phenol-red free DMEM
(5% FBS, 2g/L glucose or galactose). Cells were then transfected with FuGENE

47
Transfection reagent and GoClone plasmids (SwitchGear Genomics) encoding
Renilla luciferase with 3’UTR regions indicated in figure legends. Transfections
included Cypridina TK loading control plasmid. Transfection procedure followed
manufacturer’s instructions. Assay of luciferase activity was done 24 hours after
transfection using LightSwitch Dual Assay reagents (Active Motif) and the
MicroLumat Plus LB96V (Berthold Technologies) plate luminometer. Relative
luciferase units were calculated by subtracting background signal and
normalizing Renilla signal to loading plasmid.
Statistics
Statistical analysis and graphical presentations were performed using
Microsoft Excel 2010. Significance was calculated using unpaired Student’s t-
test. All data shown represent results from 3 or more independent observations,
expressed as mean ± SEM.
RESULTS
Tolerance and Galactose both affect metabolism and TNFα expression.
As our lab has previously reported (17, 22), endotoxin tolerance includes
two distinct phenotypic characteristics in THP-1 monocytic cells. One
characteristic of tolerance is an inability to produce TNFα mRNA or protein in
response to LPS restimulation. The other characteristic is a preference for fatty
acid oxidation over glycolysis (8). To test our hypothesis that the latter influences
the former, we compared responsive and tolerant cells to those grown in
48
galactose-based media. Literature suggests that when glucose is replaced by
galactose in cell culture media, cells use more mitochondrial oxidation and less
glycolysis (15, 44, 45). Thus, this model allowed us to separate the metabolic
impact of tolerance from its other effects on gene expression.
We first measured expression of TNF in three different culturing conditions:
responsive (glucose-based media), tolerant (glucose-based media, prior
overnight exposure to 1ug/mL LPS), and galactose-fed (galactose-based,
glucose-free media). At the RNA level, we observed no significant difference
between responsive vs. galactose-fed cultures, with or without addition of LPS
(Fig. 1A). TNF mRNA levels were significantly different in tolerant cultures, in line
with previous reports (17). Despite showing no difference in TNF mRNA,
however, galactose-fed cultures did show a significant reduction in TNF protein
expression, as measured by ELISA (Fig. 1B). Culturing conditions did not appear
to significantly impact stability of TNF transcript (Fig. 1C).
We next compared the differences in glycolysis between cells grown in
responsive, tolerant, or galactose-fed culturing conditions. This was done in two
ways. Lactate concentration following addition of LPS was measured using a
commercial biochemical lactate assay (Fig. 2A). Responsive cells showed the
highest concentration of lactate, followed by tolerant and galactose-fed cells,
respectively. We also measured the extracellular acidification rate (ECAR) of
responsive, tolerant, and galactose-fed cells using the Seahorse XF24 (Fig. 2B).
As a measurement of the rate of proton output by live cells, ECAR serves as an
indicator of lactic acid production and glycolysis (36). Basal ECAR was the

49
highest in responsive cells, followed respectively by tolerant and galactose-fed
cells. Interestingly, responsive cells showed a sharp increase in ECAR after an
injection of LPS into the assay wells, while neither tolerant nor galactose cells
showed any significant change in ECAR in response to LPS. These differences
in lactate (Fig. 2A) and ECAR (Fig. 2B) both indicate that galactose-fed THP-1
cells have a lower rate of glycolysis than their glucose-fed counterparts.
GAPDH binds to TNF mRNA in THP-1 cells with low glycolysis.
Our observation that TNFα protein but not mRNA was reduced in
galactose-fed cells (Fig. 1A-B) suggests a mechanism of post-transcriptional
repression. These data are consistent with our hypothesis that low glycolysis
causes GAPDH to bind the AU-rich element of TNFα mRNA. To determine if this
was the case, we used RNA-immunoprecipitation (RNA-IP) with an anti-GAPDH
antibody to probe for an interaction between GAPDH protein and TNFα mRNA.
Our initial RNA-IP experiments compared responsive, glucose-fed cells with
responsive, galactose-fed cells. As shown in Figures 1 and 2, these cultures
differed in metabolism, but not TNFα mRNA. After stimulation with LPS for 1
hour, significantly more TNF mRNA was pulled down by the GAPDH antibody in
galactose-fed cultures than in glucose-fed cultures (Fig. 3A). This indicates
greater GAPDH protein-TNF mRNA binding occurs in galactose-fed cells.
Additionally, GAPDH showed no off-target binding to its own mRNA (Fig
3B). GAPDH mRNA is constitutively expressed and lacks an ARE, making it an
unlikely target for GAPDH protein to bind. This made GAPDH mRNA a suitable
negative indicator of non-specific RNAs isolated by the RNA-IP. As Figure 3B

50
shows, minimal GAPDH mRNA was pulled down during the RNA-IP. This
indicates there is specificity to the GAPDH protein-TNFα mRNA interaction. To
test whether the increase in GAPDH-TNF mRNA binding reflected an increase in
total GAPDH protein, we measured GAPDH protein levels by Western blotting
(Fig. 3C). We observed no significant change in GAPDH protein concentration in
response to galactose-based media, or in response to stimulation with LPS.
Comparison of glucose-fed and galactose-fed cultures indicated that our
hypothesized mechanism of metabolism-sensitive RNA binding took place in
monocytes, but under idealized and artificial conditions. We next sought to
investigate whether it also took place during endotoxin tolerance. Tolerant THP-1
cells show reduced glycolysis (Fig 2A-B) and serve as a model for septic shock
(46-48).
To determine if this mechanism participated in tolerance we again used
RNA-IP to probe for interactions between GAPDH protein and TNFα mRNA.
Tolerant cultures were stimulated with LPS for 24 hours prior to assay, while
responsive cultures were not exposed to any LPS prior to assay.
Real-time PCR analysis of the RNA pulled down by the GAPDH antibody
shows GAPDH binds to TNFα mRNA in tolerant cells (Fig. 4A). The amount of
TNF mRNA bound by GAPDH was significantly greater in tolerant cells than
responsive cells, despite the repression of TNF mRNA in tolerant cells. As in the
glucose vs. galactose model, no significant off-target binding to GAPDH mRNA is
observed (Fig. 4B). We also observed no significant change in total GAPDH
protein level (Fig. 4C).

51
GAPDH binding to TNF mRNA is sensitive to changes in glycolysis.
After demonstrating GAPDH binding to TNF mRNA in two conditions with
low glycolysis, we sought to further establish that glycolysis regulated the level of
this binding. We also sought to determine whether this binding was reversible. To
test this, we treated tolerant THP-1 cells with different substances which alter
glycolysis. We then used RNA-IP to study corresponding changes in GAPDH-
TNF mRNA binding.
Based on the literature and our past experience, we selected four
substances, each with a distinct mechanism of affecting glycolysis (Fig. 5A). To
block glycolysis, we used 2-deoxyglucose, an inhibitor of hexokinase and
phosphoglucose isomerase (49). To promote glycolysis, we used EX527, a
sirtuin 1 (SIRT1) inhibitor which limits the ability of cells to transition from
glycolysis to fatty acid oxidation (8); human insulin, which increases glucose
uptake and phosphorylation (50, 51); and oligomycin, an ATP synthase inhibitor
which blocks mitochondrial ATP production (52) and causes an acute increase in
glycolysis.
The effects of these four substances on glycolysis were verified by
Seahorse XF analysis (Fig. 5B). Tolerant cell cultures were treated with 2-DG
(5mM, 1 hour before assay), EX527 (5uM, 18 hours before assay), human insulin
(100nM, 18 hours before assay), or oligomycin (10uM, 15 minutes before assay)
as indicated. Cultures were then lysed and analyzed by RNA-IP. Inhibition of
glycolysis using 2-DG resulted in a greater level of TNFα mRNA in the resulting
GAPDH RNA-IP (Fig. 6A). Similarly, promotion of glycolysis with any of the other

52
three treatments decreased the level of TNF mRNA isolated by RNA-IP. This
indicates that lowering glycolysis increases GAPDH-TNF mRNA binding, while
increasing glycolysis reduces that binding. This reciprocal relationship is
predicted by our hypothesis. No significant binding to GAPDH mRNA was
observed (Fig. 6B), again indicating that the GAPDH-TNF mRNA interaction is
specific. Additionally, we saw no significant change in total GAPDH protein in
response to the treatments (Fig. 6C).
We next explored whether these changes in glycolysis produced
measurable changes TNF protein. If GAPDH-TNF mRNA binding truly represents
a mechanism of post-transcriptional repression, we would expect that treatments
which increase glycolysis and decrease GAPDH-TNF binding would increase
TNF protein production. To test this, we measured expression of TNF mRNA and
protein in tolerant THP-1 cells treated with either EX527 or insulin vs. untreated.
We were unable to use 2-DG or oligomycin here due to higher toxicity and the
longer incubation period required for ELISA.
TNF mRNA levels were not increased by addition of insulin or EX527 to
tolerant cultures (Fig. 7A), however, we observed small but statistically significant
increases in TNF protein levels following treatment with either substance (Fig.
7B). Since the increase in cytokine production cannot be explained by an
increase in RNA, it follows that a greater amount of the transcript is translated.
This supports our hypothesis that GAPDH binding represses translation of TNF
mRNA.

53
Transcripts with the 3’UTR of TNF mRNA are repressed in a metabolism-
sensitive manner.
Our data indicate that GAPDH-TNF mRNA binding correlates with a
decrease in TNFα protein expression. To further demonstrate that this decrease
in cytokine production is due to post-transcriptional repression, we utilized a
luciferase reporter system (Fig. 8A). We used plasmids encoding a Renilla
luciferase transcript, with or without the TNF 3’UTR present. Since the plasmids
contained the same constitutive promoter, and since Renilla luciferase is not
affected by ATP, changes in luminescence should be directly attributable to post-
transcriptional regulation. We reasoned that if GAPDH-TNF mRNA binding
results in post-transcriptional repression, altering glycolysis should alter
luciferase signal in a consistent manner.
We observed a significant reduction in luciferase signal in tolerant cells
transfected with the TNF 3’UTR reporter, compared to those with the control
3’UTR (Fig. 8B). This immediately demonstrated the importance of post-
transcriptional repression of TNF, which has been previously shown (25, 26).
When cells transfected with the TNF 3’UTR reporter were treated with
substances that affected both glycolysis and GAPDH-TNF mRNA binding (Fig.
5B, Fig. 6A), luciferase signal was also affected (Fig. 8B). Addition of 2-DG
caused a decrease in luciferase signal, while addition of insulin or oligomycin
resulted in increased signal. These results match the RNA-IP data (Fig. 6A)
which indicated the treatments respectively increased or decreased post-
transcriptional repression of TNF mRNA.

54
GAPDH binds to TNFα mRNA in primary cells.
After characterizing this mechanism of post-transcriptional repression in
THP-1 cells, we tested whether this mechanism was also present in primary
human monocytes. Primary monocytes were isolated from whole blood samples
collected from healthy donors. Donor monocytes were either cultured overnight in
glucose-based media, tolerized ex-vivo, or cultured overnight in galactose-based
media. Examination of cell morphology the following day by Brightfield staining
showed >90% of isolated cells were monocyte/macrophage cell types (data not
shown).
We first measured the effect of our responsive, tolerant, and galactose-fed
culturing conditions on glycolysis. As in our THP-1 model, responsive cultures
showed the highest level of glycolysis before and after the addition of LPS (Fig.
9A). Tolerant and galactose-fed cell cultures both showed reduced concentration
of lactate, indicating a reduced rate of glycolysis.
We next determined whether culturing conditions affected production of
TNF cytokine. ELISA analysis of cell supernatant revealed cells in Tolerant and
Galactose cultures produced less cytokine in response to LPS than their
Responsive counterparts (Fig. 9B). These results are consistent with THP-1
results (Fig. 1B), supporting the hypothesis that a similar mechanism was
responsible. When analyzed by RNA immunoprecipitation, GAPDH binding to
TNF mRNA was confirmed (Fig. 9C). We found significantly greater GAPDH-TNF
mRNA binding in Tolerant and Galactose-cultured cells than in Responsive-

55
cultured cells. This difference is particularly prominent when Responsive and
Galactose cultures are compared.
DISCUSSION
In this study, we show that TNF mRNA is post-transcriptionally repressed
by GAPDH binding to the 3’UTR. As summarized in Figure 8, this mechanism of
repression is sensitive to changes in cellular metabolism, specifically the rate of
glycolysis. When the rate of glycolysis is high, GAPDH binds TNF mRNA at a
relatively low level. If glycolysis is downregulated due to limited availability of
glucose or endotoxin tolerance, GAPDH binds TNF mRNA to a greater degree.
This binding inhibits translation of the transcript, thus limiting TNF cytokine
production.
This study further demonstrates that GAPDH binding to TNF mRNA can
be reversed by increasing glycolysis. Others have shown that GAPDH metabolic
substrates G3P and NAD+ interfere with GAPDH binding to AU-rich elements
(10, 14, 15). As neither G3P nor NAD+ is membrane permeable, however, these
data were observed in ex vivo experiments or in saponin-permeabilized cells. We
believe our approach of reversing binding by increasing glycolysis better
illustrates the central role of metabolism in regulating translation.
We propose this mechanism of post-translational repression through
GAPDH-TNF mRNA binding represents a way of fine-tuning the inflammatory
response. Our data indicate glycolysis affects production of TNF cytokine,

56
although only modestly (Fig. 5). When compared to mechanisms regulating
production of TNF mRNA (53), the effects we observe are relatively small.
Although this mechanism is not a primary determinant of TNF expression, we
argue it makes a unique contribution.
We suggest GAPDH-TNF mRNA binding refines expression of TNF
depending on the metabolic environment. We imagine this mechanism of
regulation is advantageous in a number of biological situations. For example,
endothelial cell responses to TNF signaling allow for immune cell migration to a
site of infection (54). Effector immune cells require glucose for effector functions
like phagocytosis and generating reactive oxygen species for the respiratory
burst (55). Since GAPDH binding limits TNF mRNA translation when glycolysis
decreases, we propose this mechanism essentially helps keep the demand for
glucose from exceeding the microenvironment supply.
In this report, we describe how glycolysis influences TNF protein
expression, through a mechanism not previously observed in monocytes. These
findings may have implications for any number of immunometabolic conditions.
One such condition of great clinical significance is sepsis. Endotoxin tolerant
mechanisms are closely aligned with the immunosuppressed state observed in
septic shock (56). This state increases risk of secondary infection and overall
patient mortality (57, 58). Following the failure of anti-TNF therapies to decrease
patient mortality, there is increasing reason to explore stimulation of the immune
system to improve survival patients with severe sepsis or septic shock (59, 60).
57
Our findings underscore the importance of approaching such efforts
metabolically, as well as immunologically.
ACKNOWLEDGEMENTS
We would like to acknowledge Mr. David Long and Dr. Michael Seeds for
their technical assistance during this project, as well as Dr. Martha Alexander-
Miller and Dr. Anthony Molina for their guidance during this project.

58
REFERENCES
1. Cramer, T., Y. Yamanishi, B. E. Clausen, I. Forster, R. Pawlinski, N. Mackman, V. H. Haase, R. Jaenisch, M. Corr, V. Nizet, G. S. Firestein, H. P. Gerber, N. Ferrara, and R. S. Johnson. 2003. HIF-1alpha is essential for myeloid cell-mediated inflammation. Cell 112: 645-657.
2. Hara, T., K. Mimura, T. Abe, G. Shioi, M. Seiki, and T. Sakamoto. 2011. Deletion of the Mint3/Apba3 gene in mice abrogates macrophage functions and increases resistance to lipopolysaccharide-induced septic shock. J Biol Chem 286: 32542-32551.
3. Krawczyk, C. M., T. Holowka, J. Sun, J. Blagih, E. Amiel, R. J. DeBerardinis, J. R. Cross, E. Jung, C. B. Thompson, R. G. Jones, and E. J. Pearce. 2010. Toll-like receptor-induced changes in glycolytic metabolism regulate dendritic cell activation. Blood 115: 4742-4749.
4. Dietl, K., K. Renner, K. Dettmer, B. Timischl, K. Eberhart, C. Dorn, C. Hellerbrand, M. Kastenberger, L. A. Kunz-Schughart, P. J. Oefner, R. Andreesen, E. Gottfried, and M. P. Kreutz. 2010. Lactic acid and acidification inhibit TNF secretion and glycolysis of human monocytes. J Immunol 184: 1200-1209.
5. Vats, D., L. Mukundan, J. I. Odegaard, L. Zhang, K. L. Smith, C. R. Morel, R. A. Wagner, D. R. Greaves, P. J. Murray, and A. Chawla. 2006. Oxidative metabolism and PGC-1beta attenuate macrophage-mediated inflammation. Cell Metab 4: 13-24.
6. O'Neill, L. A. J., and D. G. Hardie. 2013. Metabolism of inflammation limited by AMPK and pseudo-starvation. Nature 493: 346-355.
7. Liu, T. F., C. M. Brown, M. El Gazzar, L. McPhail, P. Millet, A. Rao, V. T. Vachharajani, B. K. Yoza, and C. E. McCall. 2012. Fueling the flame: bioenergy couples metabolism and inflammation. J Leukoc Biol 92: 499-507.
8. Liu, T. F., V. T. Vachharajani, B. K. Yoza, and C. E. McCall. 2012. NAD+-dependent sirtuin 1 and 6 proteins coordinate a switch from glucose to fatty acid oxidation during the acute inflammatory response. J Biol Chem 287: 25758-25769.
9. Dashty, M. 2013. A quick look at biochemistry: carbohydrate metabolism. Clin Biochem 46: 1339-1352.

59
10. Nagy, E., and W. F. Rigby. 1995. Glyceraldehyde-3-phosphate dehydrogenase selectively binds AU-rich RNA in the NAD(+)-binding region (Rossmann fold). J Biol Chem 270: 2755-2763.
11. Caput, D., B. Beutler, K. Hartog, R. Thayer, S. Brownshimer, and A. Cerami. 1986. IDENTIFICATION OF A COMMON NUCLEOTIDE-SEQUENCE IN THE 3'-UNTRANSLATED REGION OF MESSENGER-RNA MOLECULES SPECIFYING INFLAMMATORY MEDIATORS. Proceedings of the National Academy of Sciences of the United States of America 83: 1670-1674.
12. Chen, C. Y. A., and A. B. Shyu. 1995. AU-rich elements: characterization and importance in mRNA degradation. Trends in Biochemical Sciences 20: 465-470.
13. Guhaniyogi, J., and G. Brewer. 2001. Regulation of mRNA stability in mammalian cells. Gene 265: 11-23.
14. Rodriguez-Pascual, F., M. Redondo-Horcajo, N. Magan-Marchal, D. Lagares, A. Martinez-Ruiz, H. Kleinert, and S. Lamas. 2008. Glyceraldehyde-3-phosphate dehydrogenase regulates endothelin-1 expression by a novel, redox-sensitive mechanism involving mRNA stability. Mol Cell Biol 28: 7139-7155.
15. Chang, C. H., J. D. Curtis, L. B. Maggi, Jr., B. Faubert, A. V. Villarino, D. O'Sullivan, S. C. Huang, G. J. van der Windt, J. Blagih, J. Qiu, J. D. Weber, E. J. Pearce, R. G. Jones, and E. L. Pearce. 2013. Posttranscriptional control of T cell effector function by aerobic glycolysis. Cell 153: 1239-1251.
16. Hentze, M. W., and T. Preiss. 2010. The REM phase of gene regulation. Trends Biochem Sci 35: 423-426.
17. El Gazzar, M., B. K. Yoza, J. Y. Hu, S. L. Cousart, and C. E. McCall. 2007. Epigenetic silencing of tumor necrosis factor alpha during endotoxin tolerance. In J Biol Chem, United States. 26857-26864.
18. Chen, X., M. El Gazzar, B. K. Yoza, and C. E. McCall. 2009. The NF-kappaB factor RelB and histone H3 lysine methyltransferase G9a directly interact to generate epigenetic silencing in endotoxin tolerance. J Biol Chem 284: 27857-27865.

60
19. McCall, C. E., B. Yoza, T. Liu, and M. El Gazzar. 2010. Gene-specific epigenetic regulation in serious infections with systemic inflammation. J Innate Immun 2: 395-405.
20. Hoffmann, A., and D. Baltimore. 2006. Circuitry of nuclear factor kappa B signaling. Immunological Reviews 210: 171-186.
21. Beg, A. A., and D. Baltimore. 1996. An essential role for NF-kappa B in preventing TNF-alpha-induced cell death. Science 274: 782-784.
22. Chen, X., B. K. Yoza, M. El Gazzar, J. Y. Hu, S. L. Cousart, and C. E. McCall. 2009. RelB sustains IkappaBalpha expression during endotoxin tolerance. Clin Vaccine Immunol 16: 104-110.
23. Liu, T. F., B. K. Yoza, M. El Gazzar, V. T. Vachharajani, and C. E. McCall. 2011. NAD+-dependent SIRT1 deacetylase participates in epigenetic reprogramming during endotoxin tolerance. J Biol Chem 286: 9856-9864.
24. Zuckerman, S. H., and G. F. Evans. 1992. ENDOTOXIN TOLERANCE - INVIVO REGULATION OF TUMOR-NECROSIS-FACTOR AND INTERLEUKIN-1 SYNTHESIS IS AT THE TRANSCRIPTIONAL LEVEL. Cellular Immunology 140: 513-519.
25. El Gazzar, M., A. Church, T. Liu, and C. E. McCall. 2011. MicroRNA-146a regulates both transcription silencing and translation disruption of TNF-alpha during TLR4-induced gene reprogramming. J Leukoc Biol 90: 509-519.
26. El Gazzar, M., and C. E. McCall. 2010. MicroRNAs distinguish translational from transcriptional silencing during endotoxin tolerance. J Biol Chem 285: 20940-20951.
27. Zuckerman, S. H., G. F. Evans, and L. Guthrie. 1991. TRANSCRIPTIONAL AND POSTTRANSCRIPTIONAL MECHANISMS INVOLVED IN THE DIFFERENTIAL EXPRESSION OF LPS-INDUCED IL-1 AND TNF MESSENGER-RNA. Immunology 73: 460-465.
28. Lai, W. S., E. Carballo, J. R. Strum, E. A. Kennington, R. S. Phillips, and P. J. Blackshear. 1999. Evidence that tristetraprolin binds to AU-rich elements and promotes the deadenylation and destabilization of tumor necrosis factor alpha mRNA. Molecular and Cellular Biology 19: 4311-4323.

61
29. Dan, C., B. Jinjun, H. Zi-Chun, M. Lin, C. Wei, Z. Xu, Z. Ri, C. Shun, S. Wen-Zhu, J. Qing-Cai, and Y. Wu. 2015. Modulation of TNF-α mRNA stability by human antigen R and miR181s in sepsis-induced immunoparalysis. EMBO Mol Med 7: 140-157.
30. Carballo, E., W. S. Lai, and P. J. Blackshear. 1998. Feedback inhibition of macrophage tumor necrosis factor-alpha production by tristetraprolin. Science 281: 1001-1005.
31. McCall, C. E., M. El Gazzar, T. Liu, V. Vachharajani, and B. Yoza. 2011. Epigenetics, bioenergetics, and microRNA coordinate gene-specific reprogramming during acute systemic inflammation. J Leukoc Biol 90: 439-446.
32. Khera, T. K., A. D. Dick, and L. B. Nicholson. 2010. Mechanisms of TNFalpha regulation in uveitis: focus on RNA-binding proteins. Prog Retin Eye Res 29: 610-621.
33. Le Goffe, C., G. Vallette, A. Jarry, C. Bou-Hanna, and C. L. Laboisse. 1999. The in vitro manipulation of carbohydrate metabolism: a new strategy for deciphering the cellular defence mechanisms against nitric oxide attack. Biochem J 344 Pt 3: 643-648.
34. Yoza, B. K., J. D. Wells, and C. E. McCall. 1998. Interleukin-1beta expression after inhibition of protein phosphatases in endotoxin-tolerant cells. Clin Diagn Lab Immunol 5: 281-287.
35. Liu, T. F., V. Vachharajani, P. Millet, M. S. Bharadwaj, A. J. Molina, and C. E. McCall. 2015. Sequential actions of SIRT1-RELB-SIRT3 coordinate nuclear-mitochondrial communication during immunometabolic adaptation to acute inflammation and sepsis. J Biol Chem 290: 396-408.
36. Ferrick, D. A., A. Neilson, and C. Beeson. 2008. Advances in measuring cellular bioenergetics using extracellular flux. In Drug Discov Today, England. 268-274.
37. Rogers, P. D., R. E. Kramer, S. W. Chapman, and J. D. Cleary. 1999. Amphotericin B-induced interleukin-1 beta expression in human monocytic cells is calcium and calmodulin dependent. Journal of Infectious Diseases 180: 1259-1266.
38. Wolf, A., S. Agnihotri, J. Micallef, J. Mukherjee, N. Sabha, R. Cairns, C. Hawkins, and A. Guha. 2011. Hexokinase 2 is a key mediator of aerobic

62
glycolysis and promotes tumor growth in human glioblastoma multiforme. Journal of Experimental Medicine 208: 313-326.
39. Yates, S. L., L. H. Burgess, J. Kocsis-Angle, J. M. Antal, M. D. Dority, P. B. Embury, A. M. Piotrkowski, and K. R. Brunden. 2000. Amyloid beta and amylin fibrils induce increases in proinflammatory cytokine and chemokine production by THP-1 cells and murine microglia. J Neurochem 74: 1017-1025.
40. Kedzierski, W., and J. C. Porter. 1991. A NOVEL NONENZYMATIC PROCEDURE FOR REMOVING DNA-TEMPLATE FROM RNA-TRANSCRIPTION MIXTURES. Biotechniques 10: 210-214.
41. Moser, M. J., R. A. DiFrancesco, K. Gowda, A. J. Klingele, D. R. Sugar, S. Stocki, D. A. Mead, and T. W. Schoenfeld. 2012. Thermostable DNA Polymerase from a Viral Metagenome Is a Potent RT-PCR Enzyme. Plos One 7.
42. Tenenbaum, S. A., P. J. Lager, C. C. Carson, and J. D. Keene. 2002. Ribonomics: identifying mRNA subsets in mRNP complexes using antibodies to RNA-binding proteins and genomic arrays. Methods 26: 191-198.
43. El Mezayen, R., M. El Gazzar, M. C. Seeds, C. E. McCall, S. C. Dreskin, and M. R. Nicolls. 2007. Endogenous signals released from necrotic cells augment inflammatory responses to bacterial endotoxin. Immunology Letters 111: 36-44.
44. Swerdlow, R. H., L. E, D. Aires, and J. Lu. 2013. Glycolysis-respiration relationships in a neuroblastoma cell line. Biochim Biophys Acta 1830: 2891-2898.
45. Dott, W., P. Mistry, J. Wright, K. Cain, and K. E. Herbert. 2014. Modulation of mitochondrial bioenergetics in a skeletal muscle cell line model of mitochondrial toxicity. In Redox Biol, Netherlands. 224-233.
46. Brueckmann, M., U. Hoffmann, L. De Rossi, H. M. Weiler, V. Liebe, S. Lang, J. J. Kaden, M. Borggrefe, K. K. Haase, and G. Huhle. 2004. Activated protein C inhibits the release of macrophage inflammatory protein-1-alpha from THP-1 cells and from human monocytes. Cytokine 26: 106-113.
47. LaRue, K. E., and C. E. McCall. 1994. A labile transcriptional repressor modulates endotoxin tolerance. J Exp Med 180: 2269-2275.

63
48. Brundage, S. I., N. N. Kirilcuk, J. C. Lam, D. A. Spain, and N. A. Zautke. 2008. Insulin increases the release of proinflammatory mediators. J Trauma 65: 367-372.
49. Zhang, D., J. Li, F. Wang, J. Hu, S. Wang, and Y. Sun. 2014. 2-Deoxy-D-glucose targeting of glucose metabolism in cancer cells as a potential therapy. Cancer Lett 355: 176-183.
50. Dimitriadis, G., P. Mitrou, V. Lambadiari, E. Maratou, and S. A. Raptis. 2011. Insulin effects in muscle and adipose tissue. Diabetes Res Clin Pract 93 Suppl 1: S52-59.
51. Thewissen, M. M., J. van de Gaar, A. T. den Boer, M. J. Munsters, E. E. Blaak, and A. Duijvestijn. 2014. Monocytes, but not T cells, respond to insulin with Akt(S473) phosphorylation independent of the donor glucometabolic state. Diabetes Metab Res Rev 30: 323-332.
52. Lardy, H. A. 1980. Antibiotic inhibitors of mitochondrial energy transfer. In Pharmacol Ther, England. 649-660.
53. McCall, C. E., and B. K. Yoza. 2007. Gene silencing in severe systemic inflammation. Am J Respir Crit Care Med 175: 763-767.
54. Bradley, J. R. 2008. TNF-mediated inflammatory disease. J Pathol 214: 149-160.
55. Mills, E. L., and P. G. Quie. 1980. Congenital disorders of the function of polymorphonuclear neutrophils. Rev Infect Dis 2: 505-517.
56. Biswas, S. K., and E. Lopez-Collazo. 2009. Endotoxin tolerance: new mechanisms, molecules and clinical significance. Trends Immunol 30: 475-487.
57. Monneret, G., F. Venet, A. Pachot, and A. Lepape. 2008. Monitoring immune dysfunctions in the septic patient: a new skin for the old ceremony. Mol Med 14: 64-78.
58. Boomer, J. S., K. To, K. C. Chang, O. Takasu, D. F. Osborne, A. H. Walton, T. L. Bricker, S. D. Jarman, 2nd, D. Kreisel, A. S. Krupnick, A. Srivastava, P. E. Swanson, J. M. Green, and R. S. Hotchkiss. 2011. Immunosuppression in patients who die of sepsis and multiple organ failure. Jama 306: 2594-2605.

64
59. Remick, D. G. 2003. Cytokine therapeutics for the treatment of sepsis: why has nothing worked? Curr Pharm Des 9: 75-82.
60. Pugin, J. 2007. Immunostimulation is a rational therapeutic strategy in sepsis. Novartis Found Symp 280: 21-27; discussion 27-36, 160-164.

65
FIGURES:
Figure 1
Figure 1-Tolerance and Galactose both affect TNF expression:
A) RT-qPCR assay comparing TNF mRNA expression in responsive, tolerant, and galactose-fed cultures, with or without a 1 hour stimulation of 1ug/mL LPS. Bars show average of 5 independent experiments ± standard error of the mean (SEM). **: p<0.01 compared to responsive counterpart, calculated by unpaired t-test.
B) ELISA assay comparing TNF cytokine expression in responsive, tolerant, and galactose-fed cultures, with or without a 4 hour stimulation with 1ug/mL LPS. Bars show mean of n=3 ± SEM. *: p<0.05; **: p<0.01 compared to responsive counterpart.
C) RT-qPCR assay comparing rates of TNF mRNA decay in responsive, tolerant, and galactose-fed cultures following 1 hour stimulation with 1ug/mL LPS and incubation with 5ug/mL actinomycin D for indicated time. Points represent average of 3 independent experiments, shown as percentage of (-)actinomycin D(0h).

66
Figure 2
Figure 2-Tolerance and Galactose both affect metabolism:
A) Lactate assay of responsive, tolerant, and galactose-fed cultures after addition of LPS (n=3 ± SEM).
B) Seahorse XF assay of extracellular acidification rate (ECAR) of responsive, tolerant, and galactose-fed cultures before and after injection of 1ug/mL LPS. Representative graph, n=3.

67
Figure 3
Figure 3-GAPDH binds to TNF mRNA in galactose-fed cells:
A) TNF mRNA expression in glucose-fed or galactose-fed cells, relative to actin, with or without addition of LPS (1ug/mL) for 1 hour. Both the table and the blackened portions of bars (GAPDH-IP) show percentage of TNF mRNA immunoprecipitated by GAPDH antibody, relative to total RNA as determined from input. Bars show mean, n=5 ± SEM. P-values are compared to glucose-fed counterpart, calculated by unpaired t-test. Non-significant values (p>0.05) not shown.
B) GAPDH mRNA expression of same cells previously described. Bars show mean, n=5 ± SEM. Table and blackened portion of bars (GAPDH-IP) show percentage of GAPDH mRNA captured by GAPDH antibody during RNA-IP. No significant change in GAPDH protein binding to its own RNA was observed, as expected.
C) Western blot of GAPDH, actin in glucose- and galactose-fed cells. Blots are representative of 3 independent observations. No significant difference was observed with media or LPS treatment.

68
Figure 4
Figure 4-GAPDH binds to TNF mRNA in endotoxin tolerant cells:
A) TNF mRNA expression in responsive or tolerant cultures, relative to actin, with or without addition of LPS (1ug/mL) for 1 hour. Both the table and the blackened portions of bars (GAPDH-IP) show percentage of TNF mRNA captured by GAPDH antibody during RNA-IP, relative to total RNA as determined from input. Bars show mean, n=4 ± SEM. P-values are compared to Responsive counterpart, calculated by unpaired t-test. Non-significant values (p>0.05) not shown.
B) GAPDH mRNA expression of same cells previously described. Bars show mean, n=4 ± SEM. Table and blackened portion of bars (GAPDH-IP) show percentage of GAPDH mRNA captured by GAPDH antibody during RNA-IP. No significant change in GAPDH protein binding to its own RNA was observed, as expected.
C) Western blot of GAPDH, actin in responsive and tolerant cell cultures. Blots are representative of 3 independent observations. No significant difference in GAPDH density was observed.

69
Figure 5
Figure 5-Glycolysis can be artifically controlled in tolerant cells:
A) Table of drugs used to block or increase glycolysis, with brief description of mechanism.
B) Extracellular acidification rate (ECAR) of Tolerant cell cultures, with or without drug treatments as indicated. Changes in ECAR were consistent with expected effects on glycolysis. Data representative of n=3. **: p<0.01 compared to Tolerant.

70
Figure 6
Figure 6-GAPDH binding to TNF mRNA is sensitive to changes in
glycolysis:
A) TNF mRNA expression in Tolerant cells, relative to actin, with or without
addition of drugs as indicated. Table and shaded portions of bars
(GAPDH-IP) show percentage of TNF mRNA captured by GAPDH
antibody during RNA-IP, relative to total RNA as determined from input.
Bars show mean, n=3 ± SEM. P-values are compared to Tolerant,
calculated by unpaired t-test.
B) GAPDH mRNA expression of same cells previously described. Bars show
mean, n=3 ± SEM. Table and shaded portion of bars (GAPDH-IP) show
percentage of GAPDH mRNA captured by GAPDH antibody during RNA-
IP.
C) Western blot of GAPDH, actin in tolerant cell cultures, with or without indicated treatments. Blots are representative of 3 independent assays. No significant difference in GAPDH density was observed.

71
Figure 7
Figure 7-Changes in GAPDH binding TNF mRNA correlate with changes in TNF protein levels in tolerant cells:
A) RT-qPCR of TNF mRNA, with or without second dose of LPS for 1 hour. No significant differences observed. Bars show mean, n=3 ± SEM.
B) ELISA of TNF cytokine, with or without second dose of LPS for 22 hours. *: p<0.05 compared to respective tolerant cultures without drug treatment, calculated by unpaired t-test.
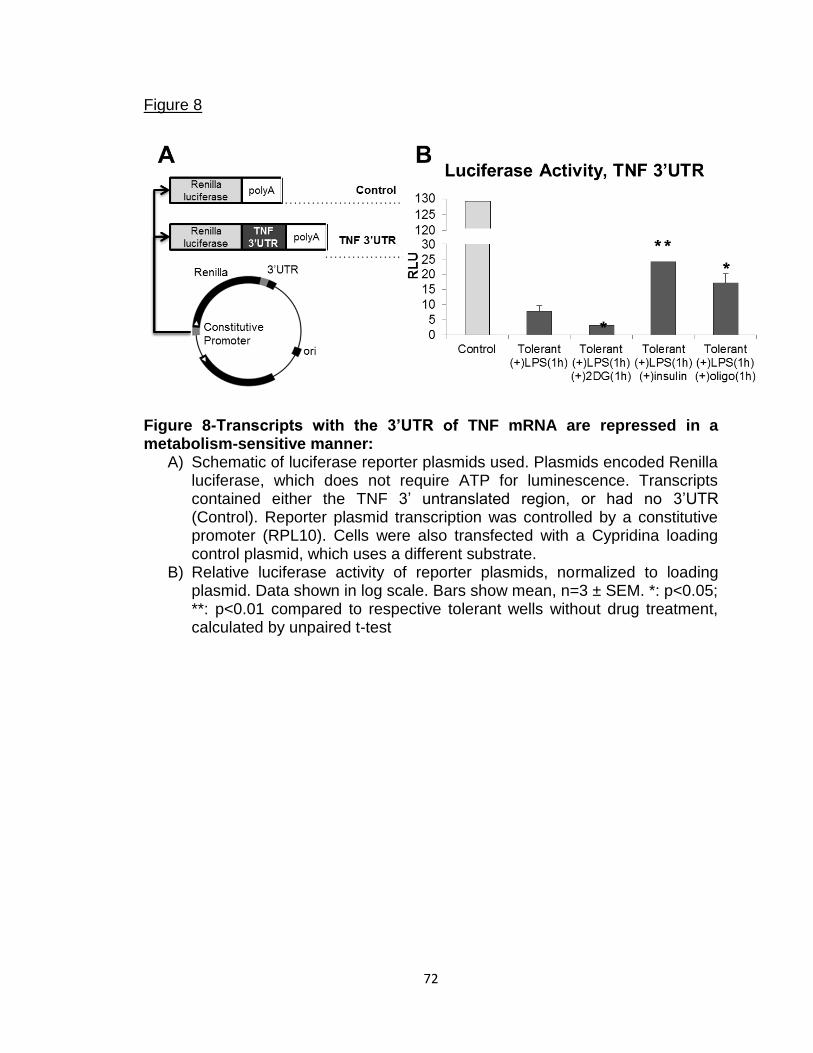
72
Figure 8
Figure 8-Transcripts with the 3’UTR of TNF mRNA are repressed in a metabolism-sensitive manner:
A) Schematic of luciferase reporter plasmids used. Plasmids encoded Renilla luciferase, which does not require ATP for luminescence. Transcripts contained either the TNF 3’ untranslated region, or had no 3’UTR (Control). Reporter plasmid transcription was controlled by a constitutive promoter (RPL10). Cells were also transfected with a Cypridina loading control plasmid, which uses a different substrate.
B) Relative luciferase activity of reporter plasmids, normalized to loading plasmid. Data shown in log scale. Bars show mean, n=3 ± SEM. *: p<0.05; **: p<0.01 compared to respective tolerant wells without drug treatment, calculated by unpaired t-test
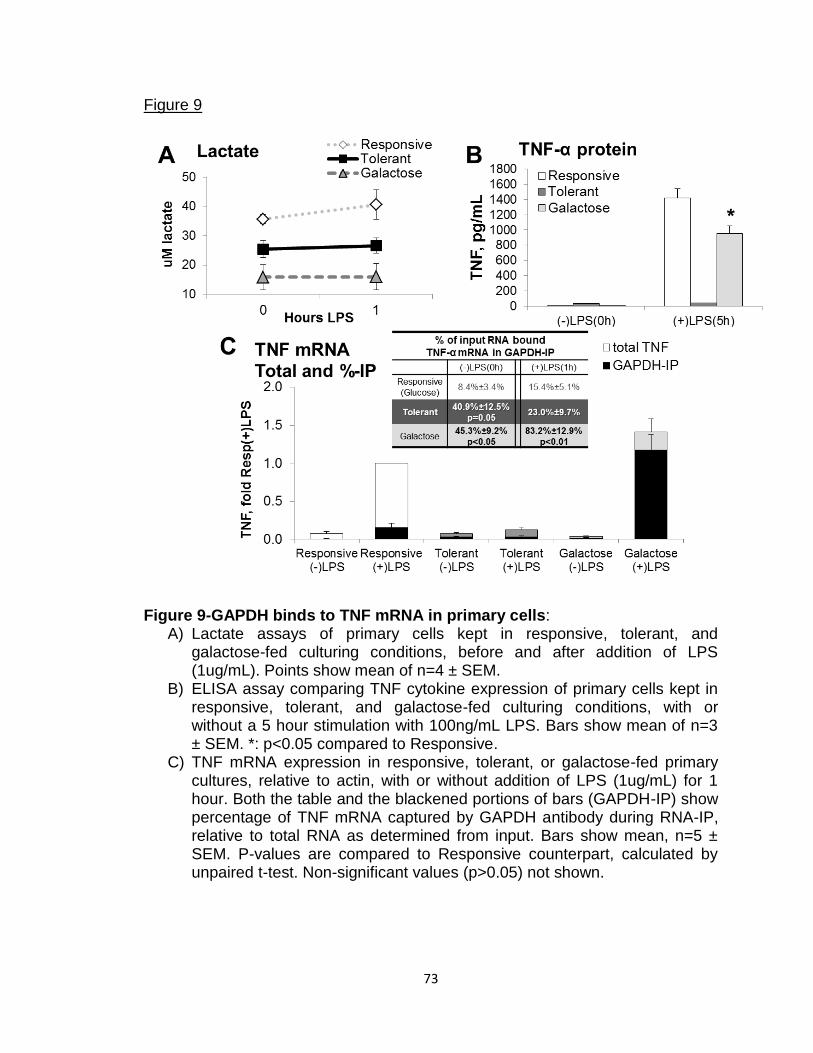
73
Figure 9
Figure 9-GAPDH binds to TNF mRNA in primary cells:
A) Lactate assays of primary cells kept in responsive, tolerant, and galactose-fed culturing conditions, before and after addition of LPS (1ug/mL). Points show mean of n=4 ± SEM.
B) ELISA assay comparing TNF cytokine expression of primary cells kept in responsive, tolerant, and galactose-fed culturing conditions, with or without a 5 hour stimulation with 100ng/mL LPS. Bars show mean of n=3 ± SEM. *: p<0.05 compared to Responsive.
C) TNF mRNA expression in responsive, tolerant, or galactose-fed primary cultures, relative to actin, with or without addition of LPS (1ug/mL) for 1 hour. Both the table and the blackened portions of bars (GAPDH-IP) show percentage of TNF mRNA captured by GAPDH antibody during RNA-IP, relative to total RNA as determined from input. Bars show mean, n=5 ± SEM. P-values are compared to Responsive counterpart, calculated by unpaired t-test. Non-significant values (p>0.05) not shown.
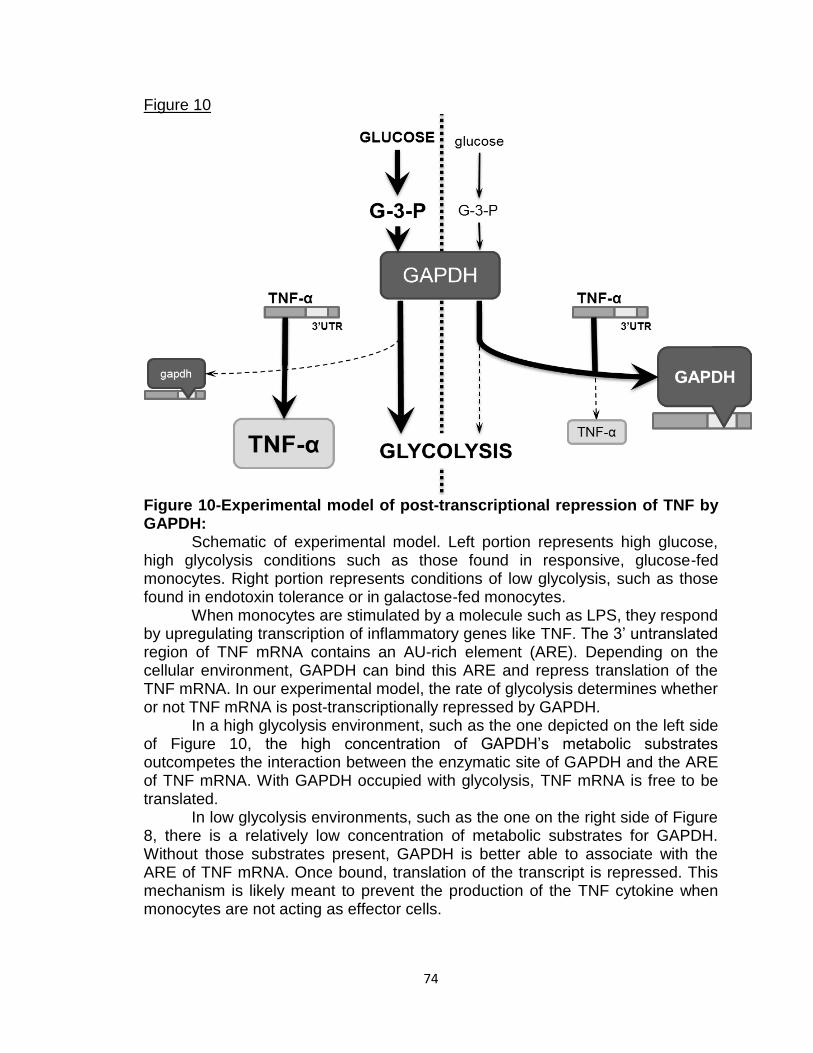
74
Figure 10
Figure 10-Experimental model of post-transcriptional repression of TNF by GAPDH:
Schematic of experimental model. Left portion represents high glucose, high glycolysis conditions such as those found in responsive, glucose-fed monocytes. Right portion represents conditions of low glycolysis, such as those found in endotoxin tolerance or in galactose-fed monocytes.
When monocytes are stimulated by a molecule such as LPS, they respond by upregulating transcription of inflammatory genes like TNF. The 3’ untranslated region of TNF mRNA contains an AU-rich element (ARE). Depending on the cellular environment, GAPDH can bind this ARE and repress translation of the TNF mRNA. In our experimental model, the rate of glycolysis determines whether or not TNF mRNA is post-transcriptionally repressed by GAPDH.
In a high glycolysis environment, such as the one depicted on the left side of Figure 10, the high concentration of GAPDH’s metabolic substrates outcompetes the interaction between the enzymatic site of GAPDH and the ARE of TNF mRNA. With GAPDH occupied with glycolysis, TNF mRNA is free to be translated.
In low glycolysis environments, such as the one on the right side of Figure 8, there is a relatively low concentration of metabolic substrates for GAPDH. Without those substrates present, GAPDH is better able to associate with the ARE of TNF mRNA. Once bound, translation of the transcript is repressed. This mechanism is likely meant to prevent the production of the TNF cytokine when monocytes are not acting as effector cells.

75
Chapter 3
RelB Directly Regulates SIRT3 Expression During Endotoxin Tolerance
ABSTRACT
Sepsis and severe inflammation are marked by distinct immunometabolic
stages. The early stage shows strong inflammation and elevated glycolysis, while
the late stage is characterized by immune suppression and increased
mitochondrial metabolism. The transition from the early stage to the late stage
requires the coordinated activity of NF-kB RelB and the sirtuin proteins, however
the underlying mechanisms involved have not been fully characterized. In this
chapter, we explore how RelB controls SIRT3, a master regulator of
mitochondrial metabolism. We find that RelB upregulates SIRT3 transcription
during the late stage of the endotoxin response in monocytes. RelB does not
regulate SIRT3 through any of its known regulators, but through direct interaction
with the SIRT3 promoter. We believe our findings clarify how metabolism and
immune suppression are linked during endotoxin tolerance and sepsis.
INTRODUCTION
Severe sepsis is one of the major causes of death worldwide. In the
United States alone, estimates place the number of severe sepsis cases at over
750,000 per year, with a mortality rate around 20-30% (1-3). Despite its

76
prevalence, there is still no known molecular-based treatment for sepsis. In order
to design such a treatment, a greater understanding of the molecular
mechanisms of sepsis is necessary.
Sepsis progresses through distinct temporal phases, each with specific
inflammatory and metabolic characteristics. The early phase of sepsis is marked
by an acute inflammatory response, including the “cytokine storm” (4-7). During
this phase, immune cells exhibit a highly glycolytic metabolism. Patients often
show elevated lactate levels during this stage, despite elevated oxygen
saturation (8-11). After several hours, sepsis enters its second stage, one that is
marked both by immunosuppression and a more oxidative metabolism (11-15).
This immunosuppressed stage often leads to the development of secondary
infections, significantly contributing to the high rate of sepsis mortality (15-17).
While the early phase of sepsis lasts a matter of hours, this late phase typically
lasts for days or even weeks. By the time patients receive medical intervention,
they have often progressed to the late phase of sepsis. Despite this, most
attempts at developing a therapeutic intervention have centered on efforts to
block inflammation (18-24). Unsurprisingly, these attempts to block inflammation
during the immunosuppressed late phase of sepsis failed to improve patient
outcome.
At the cellular level, the initiation and progression of these phases is
governed the NF-kB family of transcription factors (25-30). During the early
phase, NF-kB member p65 moves into the nucleus where it binds the promoters
of numerous pro-inflammatory genes (i.e., TNF-α, IL-1β) to activate transcription.

77
p65 also upregulates transcription of RelB, another NF-kB transcription factor
(31). Like p65, RelB binds to the NF-kB consensus sites in the promoters of pro-
inflammatory genes (32-34). Unlike p65, however, RelB represses gene
expression. RelB further prevents p65 activity by forming an inactive heterodimer
with it (35), and by inducing the formation of silent heterochromatin (36, 37).
Once present, RelB prevents futher stimulation of pro-inflammatory genes,
creating a tolerance to any subsequent inflammatory signals (27, 36). Febrile
responses to bacterial pyrogens are markedly reduced in tolerant animals (38). In
fact, this tolerance is so strong that after inducing it in rats with a low dose of
endotoxin, the animals can survive a second, otherwise lethal dose (39). RelB is
not exclusively a repressive transcription factor. In the case of IkBα, for instance,
RelB is positive regulator of transcription when found on the promoter (40).
At the same time that RelB directs the switch from early to late sepsis at
the inflammatory level, the sirtuin proteins direct the switch at the metabolic level
(11). The sirtuin family of NAD+-dependent deacetylases responds to cellular
starvation or stress, such as those which occur during the early stage of sepsis
(10, 41-43). Once activated, the sirtuins act on numerous targets to regulate
metabolism. SIRT3, for instance, is a mitochondrial-specific sirtuin that promotes
the activity of enzymes in the TCA cycle, the Electron Transport Chain, and the
transport of fatty acids into the mitochondria (44). Together, the sirtuins act to
increase mitochondrial oxidative metabolism and decrease glycolysis (11, 45-47).
In recent papers, our lab has shown that these regulators of the
inflammatory and metabolic shifts from early to late sepsis are, in fact,

78
interdependent. We previously observed SIRT1 bound to the TNF-α promoter,
facilitating the switch between p65 and RelB binding (48). Additionally, we found
that RelB was needed for the increase in mitochondrial oxygen consumption
which occurs during late sepsis (49). We also determined that RelB was required
for the late phase increase in SIRT3 expression. This study sought to further
explore how exactly RelB was responsible for this effect on SIRT3. We found that
RelB increased transcription of SIRT3 during endotoxin tolerance. This increase
is not mediated by previously characterized regulators of SIRT3 transcription.
Instead, RelB binding to the SIRT3 promoter appears to directly upregulate
SIRT3 transcription. Together, our findings help explain how immune cells
transition from the early stage to the late stage of the acute inflammatory
response.
MATERIALS AND METHODS
Cell Culturing
THP-1 cells were grown in RPMI 1640 with 10% FBS, L-glutamine, and
penn-strep media. Cells were kept in a 5% CO2 incubator at 37°C and
subcultured every 1-3 days to maintain a density of 20-80(10)4 cells/mL. THP-1
cells were maintained in an undifferentiated state (50).
Stable sh-RNA lines of THP-1 cells were generated using RelB or control
shRNA lentiviral particles (Santa Cruz). Transduced cells were grown with
10ug/mL puromycin for initial selection, then with 5ug/mL for maintenance (49).
THP-1 cells were tolerized with 1ug/mL LPS for 24 hours when indicated.

79
Metabolic Assays
Assessment of oxygen consumption rates (OCR) were made using the
Seahorse XF24 Extracellular Flux Analyzer (Seahorse Bioscience) (51). Plates
were coated with Cell-Tak (BD Biosciences) (52) and dried overnight before
addition of 25(10)4 cells/well in unbuffered RPMI 1640 and 1 hour incubation in a
CO2-free 37°C incubator. Plates were assayed according to manufacturer’s
instructions.
RT-qPCR
RNA was isolated using STAT60 (Tel-Test Inc) (53). RNA quality was
measured on a NanoDrop 1000 (Thermo Scientific) before reverse transcription
using the qScript cDNA Synthesis (Quanta Bioscience) system (54). Quantitative
PCR was done using Taqman reagents and probe/primer mixes on the ABI7500
Fast. For determinations of RNA stability, cells were treated with or without LPS
for 1h before addition of actinomycin D (10ug/mL) for indicated time before lysis
with STAT60 (48).
DNA isolated by chromatin immunoprecipitation was measured by
quantitative PCR using SYBR Green (Applied Biosciences) reagents. The primer
sequences were: TNFα promoter forward, 5’AGAGGGAGAGAAGCAACT-
ACA3’, and reverse, 5’GGGTCAGTATGTGAGAGGAAGA3’; SIRT3 promoter
forward, 5’-GCTCTGCAATTCATCCTGTTTC3’, and reverse, 5’-CGCCGTCCC-
ATTGTCTTTA3’.

80
Western Blotting
THP-1 cells were cultured and treated as indicated in text. Cells were
pelleted and lysed in RIPA buffer. 50ug protein was loaded into each well of a 4-
20% Precise Protein gel (Thermo-Fisher). Blot was run and transferred according
to gel manufacturer’s instructions (55). Blots were imaged using ECL-Plus
chemiluminescent reagent (Perkins Elmer), also according to manufacturer’s
instructions. Densitometric analysis was done with ImageJ software (NIH).
Chromatin Immunoprecipitation
Chromatin Immunoprecipitation (ChIP) was performed using the ChIP
Assay kit (Millipore) according to manufacturer’s instructions (37, 48). Briefly, sh-
RNA cells with or without LPS stimulation were crosslinked with 1%
formaldehyde, pelleted, washed, and lysed. Lysates were sonicated in a 4°C
water bath. Sample inputs were put aside. Remaining lysate was diluted, pre-
cleared with Protein A Agarose beads, then incubated with beads and either
RelB 1°Ab (Santa Cruz) or non-specific IgG. Lysates were rotated with beads
overnight, washed the next day, eluted (alongside input DNA), isolated with QIA-
quick Gel Extraction columns (Qiagen), and eluted with nuclease free water.
Quality of input DNA was assessed and all samples measured through
quantitative PCR, as described above.

81
Luciferase Reporter
THP-1 cells were plated in white 96-well plates in phenol-red free DMEM
(5% FBS, 2g/L glucose or galactose). Cells were then transfected with FuGENE
Transfection reagent and GoClone plasmids (SwitchGear Genomics) containing
either constitutive or SIRT3 promoter. Transfection procedure followed FuGENE
manufacturer’s instructions (56). Assay of luciferase activity was done 24 hours
after transfection using LightSwitch Assay reagents (Active Motif) and the
MicroLumat Plus LB96V (Berthold Technologies) plate luminometer.
Statistics
Statistical analysis and graphical presentations were performed using
Microsoft Excel 2010. Significance was calculated using unpaired Student’s t-
test. All data shown represent results from 3 or more independent observations,
expressed as mean ± SEM.
RESULTS
RelB affects mitochondria during endotoxin tolerance
As our lab has previously described, mitochondrial respiration increases
during endotoxin tolerance (45, 49, 57). At the same time, RelB regulates
transcription, both positively and negatively, for numerous genes. To explore the
role of RelB in mitochondrial metabolism, we stably transfected THP-1 cells with
a RelB or control shRNA lentiviral vector. Cells transfected with nonspecific
control shRNA (ctrl-sh) produced RelB after 24 hour stimulation by LPS, while
RelB-sh cells showed little RelB expression (Fig. 1A). To measure mitochondrial

82
respiration, we compared the oxygen consumption rate (OCR) between these
transfected cells, with or without 24 hour incubation with LPS. Without LPS,
RelB-sh and ctrl-sh cells showed similar basal OCR (Fig. 1B and C). However,
basal OCR increased in ctrl-sh, but not RelB-sh, after the 24 hour LPS stimulus.
This indicates RelB is required for the increase in mitochondrial respiration during
endotoxin tolerance.
RelB affects SIRT3 expression through uncharacterized mechanism
We previously reported that RelB is an upstream regulator of SIRT3
during the TLR4 response (49). The mechanism by which this regulation occurs,
however, has not been determined. To investigate this, we compared SIRT3
expression in RelB-sh and ctrl-sh cells following an LPS stimulus.
We first compared expression of SIRT3 mRNA. Both cell lines showed a
decline in SIRT3 expression 2 hours after LPS addition (Fig. 2A). By 24 hours,
SIRT3 mRNA expression is restored to baseline levels in ctrlsh cells, but
remains flat in RelBsh cells. SIRT3 mRNA degrades at a similar rate in RelBsh
and ctrlsh cells, with or without 24 hour incubation with LPS (Fig. 2B). SIRT3
protein expression mirrors that of mRNA expression (Fig. 2C). Together, these
data indicate RelB supports SIRT3 transcription during endotoxin tolerance.
Transcription of SIRT3 is regulated by three proteins, ERRα, PGC-1α, and
SIRT1 (44, 58, 59). Of these, only ERRα is known to bind the SIRT3 promoter.
After PGC-1α is activated by SIRT1, it joins ERRα as its cofactor. At present,
these factors are the only established regulators of SIRT3 transcription. We
therefore reasoned RelB might promote SIRT3 transcription indirectly by

83
controlling transcription of one or more of these regulators. RelB knockdown,
however, did not reduce expression of ERRα, PGC-1α, or SIRT1 mRNA below
the levels seen in ctrl-sh cells (Fig. 3). In fact, the RelB knockdown appeared to
increase expression of SIRT1 prior to the addition of LPS (Fig 3A). These data
indicate that RelB does not control SIRT3 expression by upregulating the gene’s
known regulators, supporting the hypothesis that RelB regulates SIRT3
transcription directly.
RelB binds SIRT3 promoter to upregulate transcription
We next measured RelB binding to the SIRT3 promoter using chromatin
immunoprecipitation (ChIP). After pulling down RelB and amplifying the
associated DNA, we used qPCR to probe for the presence of promoter DNA. We
first determined the TNF-α promoter was present in the RelB ChIP DNA after 24
hour stimulation with LPS (Fig. 4A). This result is in line with previous reports of
RelB binding to the TNF-α promoter (32). Similarly, we found the SIRT3 promoter
was also isolated by RelB ChIP in LPS stimulated ctrl-sh cells (Fig. 4B). Neither
promoter was observed in RelB ChIP of RelB-sh cells, nor was any promoter
DNA pulled down by non-specific IgG ChIP.
To further demonstrate the role RelB plays in SIRT3 transcription, we
used a luciferase reporter system containing the SIRT3 promoter (Fig. 5). RelB-
sh and ctrl-sh cells were transfected with this construct and luciferase output was
measured following an LPS stimulus. We determined that after overnight LPS
stimulation, luciferase output was reduced in RelB knockdown cells. This further

84
supports our hypothesis that RelB directly promotes transcription of SIRT3 during
endotoxin tolerance.
DISCUSSION
In this study, we demonstrate the role of RelB in mitochondrial respiration
and SIRT3 expression during endotoxin tolerance. We show that RelB promotes
SIRT3 transcription, but not by upregulating transcription of factors known to
induce SIRT3 gene expression. Instead, we show that RelB acts on the SIRT3
promoter directly, and that loss of RelB inhibits gene expression mediated by the
SIRT3 promoter. We propose that RelB is a positive transcription factor of SIRT3
which acts during endotoxin tolerance to help restore mitochondrial metabolism.
Our findings illustrate that RelB has reciprocal functions as a positive regulator of
SIRT3, and a negative regulator of pro-inflammatory genes such as TNF and
IL1β (32-35).
Regulation of SIRT3 transcription is poorly understood. ERRα and
PGC1α are among the only factors previously demonstrated to promote SIRT3
transcription (58). SIRT1 is frequently necessary to activate PGC1α as a
transcription cofactor (59), however it is unclear how directly SIRT1 is involved in
SIRT3 transcription. Thus, characterization of any additional factors which
directly impact SIRT3 transcription is noteworthy.
Previously, our lab has proposed that SIRT1, RelB, and SIRT3 make up a
sequential series of regulators which coordinate the metabolic and inflammatory
transition from the early to late stage responses to acute inflammation (49).

85
During this transition, SIRT1 associates with chromatin and assists with RelB
attachment to NF-kB responsive sites (48). In this report, we demonstrate that
RelB directly affects SIRT3 expression by accumulating on the SIRT3 promoter
and upregulating transcription.
Whether or not RelB binds the SIRT3 promoter as part of a complex with
other proteins remains unclear. Typically, RelB forms a heterodimer with p52 or
p50 when accumulating on DNA (40, 60, 61). RelB also complexes with AhR,
BMAL1, and SIRT1 (48, 62, 63). Furthermore, crystal structure analysis of DNA-
bound RelB indicates it can bind DNA sequences beyond standard consensus
NFkB binding sites (64). Additional research is needed to determine what other
factors are involved in RelB accumulation on the SIRT3 promoter, and the
precise DNA elements which allow this interaction. Regardless, our results
demonstrate a mutually dependent relationship between immunosuppression
and mitochondrial metabolism during sepsis and severe acute inflammation.

86
REFERENCES
1. Angus, D. C., W. T. Linde-Zwirble, J. Lidicker, G. Clermont, J. Carcillo, and M. R. Pinsky. 2001. Epidemiology of severe sepsis in the United States: analysis of incidence, outcome, and associated costs of care. Crit Care Med 29: 1303-1310.
2. Lagu, T., M. B. Rothberg, M. S. Shieh, P. S. Pekow, J. S. Steingrub, and P. K. Lindenauer. 2012. Hospitalizations, costs, and outcomes of severe sepsis in the United States 2003 to 2007. Crit Care Med 40: 754-761.
3. Dellinger, R. P., M. M. Levy, A. Rhodes, D. Annane, H. Gerlach, S. M. Opal, J. E. Sevransky, C. L. Sprung, I. S. Douglas, R. Jaeschke, T. M. Osborn, M. E. Nunnally, S. R. Townsend, K. Reinhart, R. M. Kleinpell, D. C. Angus, C. S. Deutschman, F. R. Machado, G. D. Rubenfeld, S. A. Webb, R. J. Beale, J. L. Vincent, and R. Moreno. 2013. Surviving sepsis campaign: international guidelines for management of severe sepsis and septic shock: 2012. Crit Care Med 41: 580-637.
4. Angus, D. C., and R. S. Wax. 2001. Epidemiology of sepsis: an update. Crit Care Med 29: S109-116.
5. Wang, H., and S. Ma. 2008. The cytokine storm and factors determining the sequence and severity of organ dysfunction in multiple organ dysfunction syndrome. Am J Emerg Med 26: 711-715.
6. Rittirsch, D., M. A. Flierl, and P. A. Ward. 2008. Harmful molecular mechanisms in sepsis. Nat Rev Immunol 8: 776-787.
7. Wheeler, A. P., and G. R. Bernard. 1999. Treating patients with severe sepsis. N Engl J Med 340: 207-214.
8. Hollenberg, S. M., T. S. Ahrens, M. E. Astiz, D. B. Chalfin, J. F. Dasta, S. O. Heard, C. Martin, G. M. Susla, J. L. Vincent, and M. Task Force Amer Coll Critical Care. 1999. Practice parameters for hemodynamic support of sepsis in adult patients in sepsis. Critical Care Medicine 27: 639-660.
9. Boekstegers, P., S. Weidenhofer, G. Pilz, and K. Werdan. 1991. Peripheral oxygen availability within skeletal muscle in sepsis and septic shock: comparison to limited infection and cardiogenic shock. Infection 19: 317-323.

87
10. Brealey, D., M. Brand, I. Hargreaves, S. Heales, J. Land, R. Smolenski, N. A. Davies, C. E. Cooper, and M. Singer. 2002. Association between mitochondrial dysfunction and severity and outcome of septic shock. Lancet 360: 219-223.
11. Liu, T. F., V. T. Vachharajani, B. K. Yoza, and C. E. McCall. 2012. NAD+-dependent sirtuin 1 and 6 proteins coordinate a switch from glucose to fatty acid oxidation during the acute inflammatory response. J Biol Chem 287: 25758-25769.
12. Biswas, S. K., and E. Lopez-Collazo. 2009. Endotoxin tolerance: new mechanisms, molecules and clinical significance. Trends Immunol 30: 475-487.
13. Kimura, F., H. Shimizu, H. Yoshidome, M. Ohtsuka, and M. Miyazaki. 2010. Immunosuppression following surgical and traumatic injury. Surg Today 40: 793-808.
14. Bone, R. C. 1996. Sir Isaac Newton, sepsis, SIRS, and CARS. Crit Care Med 24: 1125-1128.
15. Boomer, J. S., K. To, K. C. Chang, O. Takasu, D. F. Osborne, A. H. Walton, T. L. Bricker, S. D. Jarman, 2nd, D. Kreisel, A. S. Krupnick, A. Srivastava, P. E. Swanson, J. M. Green, and R. S. Hotchkiss. 2011. Immunosuppression in patients who die of sepsis and multiple organ failure. Jama 306: 2594-2605.
16. Otto, G. P., M. Sossdorf, R. A. Claus, J. Rödel, K. Menge, K. Reinhart, M. Bauer, and N. C. Riedemann. 2011. The late phase of sepsis is characterized by an increased microbiological burden and death rate. In Crit Care. R183.
17. Monneret, G., F. Venet, A. Pachot, and A. Lepape. 2008. Monitoring immune dysfunctions in the septic patient: a new skin for the old ceremony. Mol Med 14: 64-78.
18. Hotchkiss, R. S., and I. E. Karl. 2003. The pathophysiology and treatment of sepsis. N Engl J Med 348: 138-150.
19. Dhainaut, J. F., A. Tenaillon, Y. Le Tulzo, B. Schlemmer, J. P. Solet, M. Wolff, L. Holzapfel, F. Zeni, D. Dreyfuss, J. P. Mira, and et al. 1994. Platelet-activating factor receptor antagonist BN 52021 in the treatment of severe sepsis: a randomized, double-blind, placebo-controlled, multicenter clinical trial. BN 52021 Sepsis Study Group. Crit Care Med 22: 1720-1728.

88
20. Bernard, G. R., H. D. Reines, P. V. Halushka, S. B. Higgins, C. A. Metz, B. B. Swindell, P. E. Wright, F. L. Watts, and J. J. Vrbanac. 1991. Prostacyclin and thromboxane A2 formation is increased in human sepsis syndrome. Effects of cyclooxygenase inhibition. Am Rev Respir Dis 144: 1095-1101.
21. Fein, A. M., G. R. Bernard, G. J. Criner, E. C. Fletcher, J. T. Good, Jr., W. A. Knaus, H. Levy, G. M. Matuschak, H. M. Shanies, R. W. Taylor, and T. C. Rodell. 1997. Treatment of severe systemic inflammatory response syndrome and sepsis with a novel bradykinin antagonist, deltibant (CP-0127). Results of a randomized, double-blind, placebo-controlled trial. CP-0127 SIRS and Sepsis Study Group. Jama 277: 482-487.
22. Remick, D. G. 2003. Cytokine therapeutics for the treatment of sepsis: why has nothing worked? Curr Pharm Des 9: 75-82.
23. Marshall, J. C. 2003. Such stuff as dreams are made on: mediator-directed therapy in sepsis. Nat Rev Drug Discov 2: 391-405.
24. Eichacker, P. Q., C. Parent, A. Kalil, C. Esposito, X. Cui, S. M. Banks, E. P. Gerstenberger, Y. Fitz, R. L. Danner, and C. Natanson. 2002. Risk and the efficacy of antiinflammatory agents: retrospective and confirmatory studies of sepsis. Am J Respir Crit Care Med 166: 1197-1205.
25. Bohrer, H., F. Qiu, T. Zimmermann, Y. Zhang, T. Jllmer, D. Mannel, B. W. Bottiger, D. M. Stern, R. Waldherr, H. D. Saeger, R. Ziegler, A. Bierhaus, E. Martin, and P. P. Nawroth. 1997. Role of NFkappaB in the mortality of sepsis. J Clin Invest 100: 972-985.
26. Yoza, B. K., J. Y. Hu, S. L. Cousart, and C. E. McCall. 2000. Endotoxin inducible transcription is repressed in endotoxin tolerant cells. Shock 13: 236-243.
27. Yoza, B. K., J. Y. Hu, S. L. Cousart, L. M. Forrest, and C. E. McCall. 2006. Induction of RelB participates in endotoxin tolerance. J Immunol 177: 4080-4085.
28. Vallabhapurapu, S., and M. Karin. 2009. Regulation and function of NF-kappaB transcription factors in the immune system. Annu Rev Immunol 27: 693-733.
29. Millet, P., C. McCall, and B. Yoza. 2013. RelB: an outlier in leukocyte biology. J Leukoc Biol 94: 941-951.

89
30. Ziegler-Heitbrock, H. W., A. Wedel, W. Schraut, M. Strobel, P. Wendelgass, T. Sternsdorf, P. A. Bauerle, J. G. Haas, and G. Riethmuller. 1994. Tolerance to lipopolysaccharide involves mobilization of nuclear factor kappa B with predominance of p50 homodimers. J Biol Chem 269: 17001-17004.
31. Bren, G. D., N. J. Solan, H. Miyoshi, K. N. Pennington, L. J. Pobst, and C. V. Paya. 2001. Transcription of the RelB gene is regulated by NF-kappa B. Oncogene 20: 7722-7733.
32. El Gazzar, M., B. K. Yoza, J. Y. Hu, S. L. Cousart, and C. E. McCall. 2007. Epigenetic silencing of tumor necrosis factor alpha during endotoxin tolerance. In J Biol Chem, United States. 26857-26864.
33. Deng, H., U. Maitra, M. Morris, and L. Li. 2013. Molecular Mechanism Responsible for the Priming of Macrophage Activation*. In J Biol Chem. 3897-3906.
34. Saccani, S., S. Pantano, and G. Natoli. 2003. Modulation of NF-kappaB activity by exchange of dimers. Mol Cell 11: 1563-1574.
35. Marienfeld, R., M. J. May, I. Berberich, E. Serfling, S. Ghosh, and M. Neumann. 2003. RelB forms transcriptionally inactive complexes with RelA/p65. J Biol Chem 278: 19852-19860.
36. Chen, X., M. El Gazzar, B. K. Yoza, and C. E. McCall. 2009. The NF-kappaB factor RelB and histone H3 lysine methyltransferase G9a directly interact to generate epigenetic silencing in endotoxin tolerance. J Biol Chem 284: 27857-27865.
37. Chan, C., L. Li, C. E. McCall, and B. K. Yoza. 2005. Endotoxin tolerance disrupts chromatin remodeling and NF-kappaB transactivation at the IL-1beta promoter. J Immunol 175: 461-468.
38. Beeson, P. B. 1947. TOLERANCE TO BACTERIAL PYROGENS : I. FACTORS INFLUENCING ITS DEVELOPMENT. J Exp Med 86: 29-38.
39. Sanchez-Cantu, L., H. N. Rode, and N. V. Christou. 1989. Endotoxin tolerance is associated with reduced secretion of tumor necrosis factor. Arch Surg 124: 1432-1435; discussion 1435-1436.
90
40. Chen, X., B. K. Yoza, M. El Gazzar, J. Y. Hu, S. L. Cousart, and C. E. McCall. 2009. RelB sustains IkappaBalpha expression during endotoxin tolerance. Clin Vaccine Immunol 16: 104-110.
41. Tu, W., S. Satoi, Z. Zhang, H. Kitade, T. Okumura, A. H. Kwon, and Y. Kamiyama. 2003. Hepatocellular dysfunction induced by nitric oxide production in hepatocytes isolated from rats with sepsis. Shock 19: 373-377.
42. Hotchkiss, R. S., and I. E. Karl. 1992. Reevaluation of the role of cellular hypoxia and bioenergetic failure in sepsis. Jama 267: 1503-1510.
43. Taylor, D. E., A. J. Ghio, and C. A. Piantadosi. 1995. Reactive oxygen species produced by liver mitochondria of rats in sepsis. Arch Biochem Biophys 316: 70-76.
44. Giralt, A., and F. Villarroya. 2012. SIRT3, a pivotal actor in mitochondrial functions: metabolism, cell death and aging. Biochem J 444: 1-10.
45. Liu, T. F., C. M. Brown, M. El Gazzar, L. McPhail, P. Millet, A. Rao, V. T. Vachharajani, B. K. Yoza, and C. E. McCall. 2012. Fueling the flame: bioenergy couples metabolism and inflammation. J Leukoc Biol 92: 499-507.
46. Zhong, L., A. D'Urso, D. Toiber, C. Sebastian, R. E. Henry, D. D. Vadysirisack, A. Guimaraes, B. Marinelli, J. D. Wikstrom, T. Nir, C. B. Clish, B. Vaitheesvaran, O. Iliopoulos, I. Kurland, Y. Dor, R. Weissleder, O. S. Shirihai, L. W. Ellisen, J. M. Espinosa, and R. Mostoslavsky. 2010. The histone deacetylase Sirt6 regulates glucose homeostasis via Hif1alpha. Cell 140: 280-293.
47. O'Neill, L. A., and D. G. Hardie. 2013. Metabolism of inflammation limited by AMPK and pseudo-starvation. Nature 493: 346-355.
48. Liu, T. F., B. K. Yoza, M. El Gazzar, V. T. Vachharajani, and C. E. McCall. 2011. NAD+-dependent SIRT1 deacetylase participates in epigenetic reprogramming during endotoxin tolerance. J Biol Chem 286: 9856-9864.
49. Liu, T. F., V. Vachharajani, P. Millet, M. S. Bharadwaj, A. J. Molina, and C. E. McCall. 2015. Sequential actions of SIRT1-RELB-SIRT3 coordinate nuclear-mitochondrial communication during immunometabolic adaptation to acute inflammation and sepsis. J Biol Chem 290: 396-408.

91
50. Yoza, B. K., J. D. Wells, and C. E. McCall. 1998. Interleukin-1beta expression after inhibition of protein phosphatases in endotoxin-tolerant cells. Clin Diagn Lab Immunol 5: 281-287.
51. Ferrick, D. A., A. Neilson, and C. Beeson. 2008. Advances in measuring cellular bioenergetics using extracellular flux. In Drug Discov Today, England. 268-274.
52. Rogers, P. D., R. E. Kramer, S. W. Chapman, and J. D. Cleary. 1999. Amphotericin B-induced interleukin-1 beta expression in human monocytic cells is calcium and calmodulin dependent. Journal of Infectious Diseases 180: 1259-1266.
53. Kedzierski, W., and J. C. Porter. 1991. A NOVEL NONENZYMATIC PROCEDURE FOR REMOVING DNA-TEMPLATE FROM RNA-TRANSCRIPTION MIXTURES. Biotechniques 10: 210-214.
54. Moser, M. J., R. A. DiFrancesco, K. Gowda, A. J. Klingele, D. R. Sugar, S. Stocki, D. A. Mead, and T. W. Schoenfeld. 2012. Thermostable DNA Polymerase from a Viral Metagenome Is a Potent RT-PCR Enzyme. Plos One 7.
55. El Mezayen, R., M. El Gazzar, M. C. Seeds, C. E. McCall, S. C. Dreskin, and M. R. Nicolls. 2007. Endogenous signals released from necrotic cells augment inflammatory responses to bacterial endotoxin. Immunology Letters 111: 36-44.
56. Gebremedhin, S., A. Singh, S. Koons, W. Bernt, K. Konopka, and N. Duzgunes. 2014. Gene delivery to carcinoma cells via novel non-viral vectors: nanoparticle tracking analysis and suicide gene therapy. Eur J Pharm Sci 60: 72-79.
57. McCall, C. E., M. El Gazzar, T. Liu, V. Vachharajani, and B. Yoza. 2011. Epigenetics, bioenergetics, and microRNA coordinate gene-specific reprogramming during acute systemic inflammation. J Leukoc Biol 90: 439-446.
58. Kong, X., R. Wang, Y. Xue, X. Liu, H. Zhang, Y. Chen, F. Fang, and Y. Chang. 2010. Sirtuin 3, a new target of PGC-1alpha, plays an important role in the suppression of ROS and mitochondrial biogenesis. PLoS One 5: e11707.

92
59. Nemoto, S., M. M. Fergusson, and T. Finkel. 2005. SIRT1 functionally interacts with the metabolic regulator and transcriptional coactivator PGC-1{alpha}. J Biol Chem 280: 16456-16460.
60. Derudder, E., E. Dejardin, L. L. Pritchard, D. R. Green, M. Korner, and V. Baud. 2003. RelB/p50 dimers are differentially regulated by tumor necrosis factor-alpha and lymphotoxin-beta receptor activation - Critical roles for p100. Journal of Biological Chemistry 278: 23278-23284.
61. Muller, J. R., and U. Siebenlist. 2003. Lymphotoxin beta receptor induces sequential activation of distinct NF-kappa B factors via separate signaling pathways. Journal of Biological Chemistry 278: 12006-12012.
62. Vogel, C. F. A., E. Sciullo, W. Li, P. Wong, G. Lazennec, and F. Matsumura. 2007. ReIB, a new partner of aryl hydrocarbon receptor-mediated transcription. Molecular Endocrinology 21: 2941-2955.
63. Bellet, M. M., L. Zocchi, and P. Sassone-Corsi. 2012. The RelB subunit of NF kappa B acts as a negative regulator of circadian gene expression. Cell Cycle 11: 3304-3311.
64. Moorthy, A. K., D.-B. Huang, V. Y.-F. Wang Don Vu, and G. Ghosh. 2007. X-ray structure of a NF-kappa B p50/ReIB/DNA complex reveals assembly of multiple dimers on tandem kappa B sites. Journal of Molecular Biology 373: 723-734.

93
FIGURES Figure 1
Figure 1-RelB affects mitochondrial response to LPS:
A) Western blot of RelB expression in cells transfected with RelB-shRNA or non-targeting control lentiviral vector (ctrl-sh), following LPS stimulation. Blot shown is representative of 4 independent experiments.
B) Basal oxygen consumption rates (OCR) of RelB-sh and ctrl-sh cells, as measured by Seahorse XF24 assay. Bars represent average OCR rates, prior to injection of any compounds.
C) Cell Mito Stress test of RelB-sh and ctrl-sh cells, with or without 24h LPS stimulation. Wells injected with 1uM oligomycin, 5uM FCCP, and 1uM antimycin/rotenone, respectively. Graph is representative of 3 independent experiments.

94
Figure 2
Figure 2-RelB promotes SIRT3 expression following LPS stimulation:
A) RT-qPCR analysis of SIRT3 mRNA expression, normalized to GAPDH. Bars represent means of 3 independent experiments, ± standard error of the mean (SEM). Expression values are relative to ctrl-sh (+)LPS(24h). p-values calculated by unpaired student’s t-test.
B) Densitometric analysis of SIRT3 Western blots. Bars represent mean density of bands at 32-kDa following labeling with SIRT3 antibody, mean of 3 independent experiments. Bars represent mean ± standard error of the mean (SEM). Expression values are relative to ctrl-sh (+)LPS(24h). p-values calculated by unpaired student’s t-test.
C) Assay of SIRT3 stability by RT-qPCR. Data points show levels of SIRT3 mRNA after addition of actinomycin D, relative to untreated cells. SIRT3 expression normalized to GAPDH. Points represent mean of 3 independent experiments.

95
Figure 3
Figure 3-RelB does not promote known regulators of SIRT3 transcription: RT-qPCR analysis of A) ERRα; B) PGC-1α; and C) SIRT1 mRNA expression, normalized to GAPDH. Bars represent means of 3 independent experiments, ± standard error of the mean (SEM). Expression values are relative to ctrl-sh (+)LPS(24h). p-values calculated by unpaired student’s t-test.

96
Figure 4
Figure 4-RelB accumulates on the SIRT3 promoter:
A) Amplification of TNF-α promoter in ChIP-DNA, as measured by qPCR. DNA was pulled down by RelB or IgG ChIP in RelB-sh and ctrl-sh cells. Data relative to starting input DNA. Bars represent means of 3 independent experiments, ± SEM. Expression values are relative to ctrl-sh (+)LPS(0h). p-values calculated by unpaired student’s t-test.
B) Amplification of SIRT3 promoter in ChIP-DNA, as measured by qPCR. DNA was pulled down by RelB or IgG ChIP in RelB-sh and ctrl-sh RNA cells. Data relative to starting input DNA. Bars represent means of 3 independent experiments, ± SEM. Expression values are relative to ctrl-sh (+)LPS(0h). p-values calculated by unpaired student’s t-test.

97
Figure 5
Figure 5-SIRT3 promoter shows impaired transcription in absence of RelB: Relative luciferase expression of SIRT3 promoter reporter plasmid. Reporters transfected into RelB-sh or ctrl-sh RNA cells and stimulated with LPS as indicated. Luciferase normalized to positive control. Bars represent means of 3 independent experiments, ± SEM. p-values calculated by unpaired student’s t-test.

98
CHAPTER 4
SUMMARY, DISCUSSION, AND CONCLUSIONS
The overall goal of this thesis is to explore some of the mechanisms
connecting metabolism and the immune response. In Chapter 2, I describe a
novel mechanism of TNFα regulation in monocytes. I show that GAPDH binds to
TNFα mRNA to repress its translation. I demonstrate that this mechanism is
metabolism-sensitive, and can be altered through pharmacological manipulation
of glycolysis. Additionally, I show that this mechanism occurs not only in THP-1
cells, but in primary human mononuclear cells. In Chapter 3, I explore how NF-kB
member RelB promotes mitochondrial oxidative metabolism. I show that RelB
promotes transcription of SIRT3 during endotoxin tolerance, but not by affecting
expression of known regulators of SIRT3 transcription. Instead, RelB binds the
SIRT3 promoter and directly upregulates transcription.
In Chapter 2 of this thesis, I was able to reach conclusions regarding the
role of glycolysis in TNF expression. I first demonstrate that when glycolysis is
downregulated artifically through use of galactose-based media, monocytes
produce less TNF cytokine in response to LPS. Galactose does not decrease
TNF mRNA expression, nor does it accelerate its degradation. Instead, galactose
increases GAPDH binding to the TNF mRNA. This binding also occurs during
endotoxin tolerance, when glycolysis is also downregulated. After manipulating
the rate of glycolysis through various treatments, I concluded the rate of
glycolysis regulated the level of GAPDH-TNF mRNA binding. Using both ELISA

99
and a luciferase reporter system, I concluded that GAPDH-TNF mRNA binding
repressed translation of the TNF transcript. I also concluded that the 3’UTR of
the TNF mRNA was sufficient for this metabolism-sensitive mechanism of post-
transcriptional repression. Finally I demonstrated that this mechanism contributes
to regulation of TNF expression in primary human mononuclear cells, not just in
THP-1 cells.
This work is not without its limitations. While I describe a novel mechanism
of metabolic/innate immune cell communication, I was unable to determine the
extent of its biological impact. In endotoxin tolerant THP-1 cells, I affected a
limited reversal of TNF post-transcriptional repression by treating cells with either
insulin or EX527 to increase glycolysis. These treatments increased TNF
cytokine levels in response to LPS, however, the increase was less than robust.
This limited response is not entirely surprising. With the repression of TNF
transcription in the tolerant cells, there is little TNF mRNA present to benefit from
enhanced translation. GAPDH-mediated post-transcriptional repression therefore
may be more biologically important when there is less repression of TNF
transcription. One such time is during initial inflammation. GAPDH binding might
therefore act to fine-tune TNF cytokine production during acute inflammation, in
order to regulate immune cell recruitment and activation in response to the
glucose supply of the local microenvironment. In the context of sepsis, TNF
transcription also increases as immunosuppression starts to resolve. If glycolysis
remains low during resolution, GAPDH binding to TNF mRNA may delay the
return to immunoresponsiveness. This suggests that increased glycolysis would

100
contribute to restoring normal homeostasis in a septic individual. This hypothesis,
however, remains to be tested.
My findings in Chapter 2 add to an emerging body of evidence that
GAPDH regulates expression of pro-inflammatory genes. In murine hepatic cells,
GAPDH represses cyclooxygenase-2 expression by binding and destabilizing the
3’UTR ARE of the COX-2 mRNA (1). In T-cells, GAPDH-ARE binding represses
production of IFN-γ (2). In human vascular endothelial cells, GAPDH binds and
destabilizes endothelin-1 mRNA by binding the ET-1 3’UTR ARE (3). Oxidative
stress, however, blocks GAPDH interaction with ET-1 mRNA and prevents the
destabilization of the transcript. In contrast, GAPDH upregulates production of
colony stimulating factor-1 (CSF-1) in ovarian cancer (4, 5). GAPDH interacts
with CSF-1 mRNA 3’UTR ARE and stabilizes the transcript. My data indicate
GAPDH is also capable of binding a 3’UTR ARE and preventing translation
without destabilizing the transcript. Taken together, these findings show GAPDH-
ARE binding has context-specific effects on RNA.
It is unclear why GAPDH has such different effects in different contexts.
GAPDH might complex with other proteins or microRNAs in order to exert its
effects on ARE-containing mRNA. These partners might differ by cell type or
other context. Alternatively, GAPDH might undergo post-translational
modifications which determine its effects on RNA stability and/or binding. Under
certain stress conditions, GAPDH undergoes post-translational modifications
including S-thiolation, S-nitrosylation, oxidation, sulphonation, acetylation, and

101
others (6-8). Ultimately, further research is necessary to understand the
significance of GAPDH binding to AU-rich RNA elements.
My work supports the notion that TNF expression can be increased
through artifical upregulation of glycolysis. Specifically, promoting glycolysis
through use of various treatments, including insulin, reduces GAPDH binding to
TNF mRNA and increases TNF cytokine levels in a small but significant way.
Interestingly, intensive insulin therapy was used for septic patients in the recent
past. In 2001, van der Berghe et al published an influential study showing that
septic patients given intensive insulin therapy had improved survival, a
decreased rate of blood infections, and required fewer antibiotics (9).
Subsequent studies demonstrated that low doses of insulin increased TNF-α
protein production in macrophages, but did not affect TNF-α mRNA (10, 11). The
effectiveness of intensive insulin therapy was later disputed when subsequent
clinical trials failed to show a reproducible benefit to patients (12).
To our knowledge, no molecular mechanism was ever proposed to explain
why some studies observed an increase in TNF protein without a corresponding
increase in TNF mRNA. My findings in Chapter 2, however, can potentially
explain why this was observed. When given a glycolysis-enhancing treatment
such as insulin, tolerant THP-1 cells produced more TNF cytokine in response to
a second LPS stimulus. Insulin did not affect expression of TNF mRNA in these
cells. Instead, it decreased GAPDH-TNF mRNA binding without affecting total
TNF RNA levels. It is therefore plausible that septic patients who received

102
intensive insulin therapy and showed increased TNF cytokine production would
also have reduced GAPDH-TNF mRNA binding, as well.
The findings in Chapter 2 also raise several questions outside the original
scope of the project. For instance, this study did not seriously explore other
possible mRNA targets of GAPDH binding. The AU-rich element is found on
transcripts of numerous pro-inflammatory genes (13-15). It therefore stands to
reason that other mRNAs are similarly repressed by GAPDH binding during
tolerance and periods of low glycolysis. Preliminary experiments indicate GAPDH
binds IL-1β and IkBα mRNA (data not shown), both of which contain AREs. The
mRNA targets of GAPDH binding could be comprehensively assessed through
microarray or RNA sequencing analysis of immunoprecipitated RNA. Given our
lab’s expertise and capabilities, however, we instead opted to focus on the
mechanism.
The work in Chapter 2 of this thesis focuses on how metabolism regulates
inflammation during the endotoxin response. In Chapter 3, this thesis explores a
way in which immune factors regulate metabolism. I first demonstrate that
mitochondrial oxygen consumption normally increases in endotoxin tolerant
THP1 cells. This increase does not occur, however, in RelB knockdown cells.
Tolerant RelB knockdown cells show reduced expression of SIRT3, both at the
mRNA and the protein level. This reduction does not result from changes in
mRNA stability, indicating SIRT3 transcription is reduced when RelB is absent.
My findings also show that RelB does not promote SIRT3 expression by acting
indirectly through a known SIRT3 upregulatory factor. Expression of SIRT3
103
upregulatory factors either remained the same or increased in RelB knockdown
cells. Instead, RelB appears to promote SIRT3 transcription directly. RelB binds
to the SIRT3 promoter in tolerant cells. Furthermore, RelB knockdown cells
transfected with a luciferase reporter plasmid containing a SIRT3 promoter show
reduced luciferase activity.
My findings in Chapter 3 include certain limitations, primarily in regards to
the chromatin immunoprecipitation work. Due to technical issues, the RelB ChIP
data presented only includes two independent experiments. Subsequent RelB
ChIP assays failed to generate expected control results, even after extensive
troubleshooting. Although the technical issue was never resolved, the substantial
increase in RelB binding to the TNF and SIRT3 promoters provide statistical
significance. Despite this limitation, the data support the conclusion that RelB
binds the SIRT3 promoter to upregulate transcription.
These technical issues also limited the ability of this project to explore
what additional factors partnered with RelB at the SIRT3 promoter. RelB typically
complexes with one or more other proteins when binding gene promoters and
regulating transcription (16). RelB is very labile protein on its own (17). RelB
stabilizes, however, when associated with NF-kB members p100 or p52 (18, 19).
RelB typically partners with p52 when binding DNA, although when acting as a
positive transcription factor of IkBα, RelB partners with p50 (20-22). Other
partners of RelB include SIRT1, AhR, and BMAL1 (23-25). Further work will be
necessary to determine which of these factors participates in RelB binding to the
SIRT3 promoter.

104
The work in Chapter 3 of this thesis expands upon previous findings by
our lab group, and adds to our understanding of immune-metabolic
communication during endotoxin tolerance. In a recent paper I contributed to and
co-authored, we found that SIRT1, RelB, and SIRT3 act in a sequential axis of
immunometabolic regulation (26). Our lab previously demonstrated that in
response to LPS, SIRT1 transiently binds near NF-kB sites to remove p65 and
load RelB, and that SIRT1 promotes expression of RelB (23). SIRT1 and RelB
both act as upstream upregulators of SIRT3 (26). My findings in Chapter 3
explain how this regulation takes place.
There is an increasing amount of evidence the sirtuins play important roles
in acute inflammation and sepsis. During chronic inflammation caused by
lipotoxicity, SIRT3 attenuates inflammation by limiting production of mitochondrial
ROS (27). MAPK kinases such as JNK are activated by ROS, including ROS
from mitochondrial sources (28, 29). Without mitochondrial ROS, inflammation
and bacterial killing is impaired in macrophages (30). During early sepsis,
impairing inflammation may improve survival. Mice treated with the SIRT1
inhibitor EX527 at the same time they receive CLP are also less likely to survive
(31). These results make sense, as inhibition of SIRT1 enhances inflammation
during early septic hyper-inflammation. If SIRT1 is inhibited by EX527 after 24
hours, during the immunosuppressive phase, however, the survival of treated
mice dramatically improves.
The SIRT1 inhibitor EX527 clearly helps restore immune function in
immunosuppressed mice (31). Tolerant mice treated with EX527 show greater

105
leukocyte adhesion, greater macrophage polarization towards the M1 type, and
increased bacterial clearance. SIRT1 directly promotes RelB expression (23). As
my findings show, RelB then directly promotes SIRT3 expression. Thus, by
blocking SIRT1, EX527 effectively inhibits the entire SIRT1-RelB-SIRT3 axis. In
light of this, it may be worth testing further how greatly each member of this axis
contributes to mortality during the later stages of sepsis and endotoxin tolerance.
In this thesis, I have explored multiple mechanisms by which metabolism
and immunity communicate during the endotoxin response. I first demonstrate
that glycolysis regulates production of the inflammatory cytokine TNF through
post-transcriptional repression. I then show how RelB, a major regulator of the
immune response, also promotes transcription of SIRT3, a master controller of
mitochondrial metabolism. Together, this work illustrates how tightly enmeshed
inflammation and metabolism truly are. Although further work is necessary, these
findings have potentially significant implications for the treatment of sepsis and
other immunometabolic conditions.

106
REFERENCES
1. Ikeda, Y., R. Yamaji, K. Irie, N. Kioka, and A. Murakami. 2012. Glyceraldehyde-3-phosphate dehydrogenase regulates cyclooxygenase-2 expression by targeting mRNA stability. Arch Biochem Biophys 528: 141-147.
2. Chang, C. H., J. D. Curtis, L. B. Maggi, Jr., B. Faubert, A. V. Villarino, D. O'Sullivan, S. C. Huang, G. J. van der Windt, J. Blagih, J. Qiu, J. D. Weber, E. J. Pearce, R. G. Jones, and E. L. Pearce. 2013. Posttranscriptional control of T cell effector function by aerobic glycolysis. Cell 153: 1239-1251.
3. Rodriguez-Pascual, F., M. Redondo-Horcajo, N. Magan-Marchal, D. Lagares, A. Martinez-Ruiz, H. Kleinert, and S. Lamas. 2008. Glyceraldehyde-3-phosphate dehydrogenase regulates endothelin-1 expression by a novel, redox-sensitive mechanism involving mRNA stability. Mol Cell Biol 28: 7139-7155.
4. Bonafe, N., M. Gilmore-Hebert, N. L. Folk, M. Azodi, Y. Zhou, and S. K. Chambers. 2005. Glyceraldehyde-3-phosphate dehydrogenase binds to the AU-Rich 3' untranslated region of colony-stimulating factor-1 (CSF-1) messenger RNA in human ovarian cancer cells: possible role in CSF-1 posttranscriptional regulation and tumor phenotype. Cancer Res 65: 3762-3771.
5. Zhou, Y., X. Yi, J. B. Stoffer, N. Bonafe, M. Gilmore-Hebert, J. McAlpine, and S. K. Chambers. 2008. The multifunctional protein glyceraldehyde-3-phosphate dehydrogenase is both regulated and controls colony-stimulating factor-1 messenger RNA stability in ovarian cancer. Mol Cancer Res 6: 1375-1384.
6. Tristan, C., N. Shahani, T. W. Sedlak, and A. Sawa. 2011. The diverse functions of GAPDH: views from different subcellular compartments. Cell Signal 23: 317-323.
7. Grant, C. M., K. A. Quinn, and I. W. Dawes. 1999. Differential protein S-thiolation of glyceraldehyde-3-phosphate dehydrogenase isoenzymes influences sensitivity to oxidative stress. Molecular and Cellular Biology 19: 2650-2656.
8. Foster, M. W., D. T. Hess, and J. S. Stamler. 2009. Protein S-nitrosylation in health and disease: a current perspective. Trends in Molecular Medicine 15: 391-404.

107
9. van den Berghe, G., P. Wouters, F. Weekers, C. Verwaest, F. Bruyninckx, M. Schetz, D. Vlasselaers, P. Ferdinande, P. Lauwers, and R. Bouillon. 2001. Intensive insulin therapy in critically ill patients. N Engl J Med 345: 1359-1367.
10. Brundage, S. I., N. N. Kirilcuk, J. C. Lam, D. A. Spain, and N. A. Zautke. 2008. Insulin increases the release of proinflammatory mediators. J Trauma 65: 367-372.
11. Leffler, M., T. Hrach, M. Stuerzl, R. E. Horch, D. N. Herndon, and M. G. Jeschke. 2007. Insulin attenuates apoptosis and exerts anti-inflammatory effects in endotoxemic human macrophages. J Surg Res 143: 398-406.
12. Chen, L. 2010. A literature review of intensive insulin therapy and mortality in critically ill patients. In Clin Nurse Spec, United States. 80-86.
13. Chen, C. Y. A., and A. B. Shyu. 1995. AU-rich elements: characterization and importance in mRNA degradation. Trends in Biochemical Sciences 20: 465-470.
14. Guhaniyogi, J., and G. Brewer. 2001. Regulation of mRNA stability in mammalian cells. Gene 265: 11-23.
15. Lu, J. Y., N. Sadri, and R. J. Schneider. 2006. Endotoxic shock in AUF1 knockout mice mediated by failure to degrade proinflammatory cytokine mRNAs. Genes Dev 20: 3174-3184.
16. Millet, P., C. McCall, and B. Yoza. 2013. RelB: an outlier in leukocyte biology. J Leukoc Biol 94: 941-951.
17. Marienfeld, R., F. Berberich-Siebelt, I. Berberich, A. Denk, E. Serfling, and M. Neumann. 2001. Signal-specific and phosphorylation-dependent RelB degradation: a potential mechanism of NF-kappaB control. Oncogene 20: 8142-8147.
18. Marienfeld, R., M. J. May, I. Berberich, E. Serfling, S. Ghosh, and M. Neumann. 2003. RelB forms transcriptionally inactive complexes with RelA/p65. J Biol Chem 278: 19852-19860.
19. Fusco, A. J., O. V. Savinova, R. Talwar, J. D. Kearns, A. Hoffmann, and G. Ghosh. 2008. Stabilization of RelB requires multidomain interactions with p100/p52. Journal of Biological Chemistry 283: 12324-12332.

108
20. Derudder, E., E. Dejardin, L. L. Pritchard, D. R. Green, M. Korner, and V. Baud. 2003. RelB/p50 dimers are differentially regulated by tumor necrosis factor-alpha and lymphotoxin-beta receptor activation - Critical roles for p100. Journal of Biological Chemistry 278: 23278-23284.
21. Muller, J. R., and U. Siebenlist. 2003. Lymphotoxin beta receptor induces sequential activation of distinct NF-kappa B factors via separate signaling pathways. Journal of Biological Chemistry 278: 12006-12012.
22. Chen, X., B. K. Yoza, M. El Gazzar, J. Y. Hu, S. L. Cousart, and C. E. McCall. 2009. RelB sustains IkappaBalpha expression during endotoxin tolerance. Clin Vaccine Immunol 16: 104-110.
23. Liu, T. F., B. K. Yoza, M. El Gazzar, V. T. Vachharajani, and C. E. McCall. 2011. NAD+-dependent SIRT1 deacetylase participates in epigenetic reprogramming during endotoxin tolerance. J Biol Chem 286: 9856-9864.
24. Vogel, C. F. A., E. Sciullo, W. Li, P. Wong, G. Lazennec, and F. Matsumura. 2007. ReIB, a new partner of aryl hydrocarbon receptor-mediated transcription. Molecular Endocrinology 21: 2941-2955.
25. Bellet, M. M., L. Zocchi, and P. Sassone-Corsi. 2012. The RelB subunit of NF kappa B acts as a negative regulator of circadian gene expression. Cell Cycle 11: 3304-3311.
26. Liu, T. F., V. Vachharajani, P. Millet, M. S. Bharadwaj, A. J. Molina, and C. E. McCall. 2015. Sequential actions of SIRT1-RELB-SIRT3 coordinate nuclear-mitochondrial communication during immunometabolic adaptation to acute inflammation and sepsis. J Biol Chem 290: 396-408.
27. Koyama, T., S. Kume, D. Koya, S. Araki, K. Isshiki, M. Chin-Kanasaki, T. Sugimoto, M. Haneda, T. Sugaya, A. Kashiwagi, H. Maegawa, and T. Uzu. 2011. SIRT3 attenuates palmitate-induced ROS production and inflammation in proximal tubular cells. Free Radic Biol Med 51: 1258-1267.
28. Kamata, H., S. Honda, S. Maeda, L. Chang, H. Hirata, and M. Karin. 2005. Reactive oxygen species promote TNFalpha-induced death and sustained JNK activation by inhibiting MAP kinase phosphatases. Cell 120: 649-661.
29. Bulua, A. C., A. Simon, R. Maddipati, M. Pelletier, H. Park, K. Y. Kim, M. N. Sack, D. L. Kastner, and R. M. Siegel. 2011. Mitochondrial reactive oxygen species promote production of proinflammatory cytokines and are

109
elevated in TNFR1-associated periodic syndrome (TRAPS). J Exp Med 208: 519-533.
30. West, A. P., I. E. Brodsky, C. Rahner, D. K. Woo, H. Erdjument-Bromage, P. Tempst, M. C. Walsh, Y. Choi, G. S. Shadel, and S. Ghosh. 2011. TLR signaling augments macrophage bactericidal activity through mitochondrial ROS. Nature 472: 476-480.
31. Vachharajani, V. T., T. Liu, C. M. Brown, X. Wang, N. L. Buechler, J. D. Wells, B. K. Yoza, and C. E. McCall. 2014. SIRT1 inhibition during the hypoinflammatory phenotype of sepsis enhances immunity and improves outcome. J Leukoc Biol 96: 785-796.

Patrick Millet
Molecular Genetics and Genomics 2375 Forsyth Ct, Apt D
Wake Forest University Winston-Salem, NC 27103
Medical Center Blvd [email protected]
Winston-Salem, NC 27101
Cell: (240)-479-1059
EDUCATION:
Doctor of Philosophy in Molecular Genetics and Genomics Oct. 2015
Wake Forest University Winston-Salem, NC
GPA: 3.81/4.0
Dissertation: Interdependent Regulation of Metabolism and Inflammation in
Human Monocytes
Bachelor of Science in Biochemistry and Molecular Biology May 2007
Dickinson College Carlisle, PA
GPA: 3.65/4.0
Magna cum Laude
PROFICIENCIES
Molecular Genetics Metabolism Immunology
RNA immunoprecipitation Mitochondrial biology ELISA
Chromatin immunoprecipitation Respirometry Human blood samples
Quantitative PCR Biochemical assays Immune cell tissue culturing
RNA interference Western blotting Northern blotting
Mammalian cell transfection Molecular cloning Reverse transcription
RESEARCH EXPERIENCE:
PhD Candidate -- Wake Forest Baptist Medical Center Aug. 2009 – Present
● Discovered mechanism of communication between inflammatory and
metabolic pathways
Winston-Salem, NC
● Conceptualized and implemented self-directed research plans ● Identified GAPDH and TNF-α mRNA interactions during
inflammation, analyzed causes and effects
● Explored relationships between mitochondrial biology, NF-kB family
transcription factors, and TLR4 signaling
● Authored and submitted research and review articles for publication ● Presented research findings scientific conferences, lab meetings, and
departmental seminars
Laboratory Technician -- Institute of Human Virology Oct. 2007 – July 2009
● Aided research on kinetics of HIV entry into host cells Baltimore, MD
● Oversaw core laboratory functions, including molecular cloning, tissue
culturing, and preparation of pseudoviruses

● Managed general laboratory functions, ordered and organized supplies,
and provided technical assistance
● Trained others in laboratory techniques
Research Assistant -- Henry Jackson Foundation June 2007 – Oct. 2007
● Assisted with research on changes in proteosome subunits caused by
HIV infections
Rockville, MD
● Performed biochemical and immunological assays using immortalized
human cell lines and tissues from HIV-infected humanized mice
Student Researcher -- Dickinson College Biology Department June 2005 – May 2007
● Researched the role of host factors on Brome Mosaic Virus RNA
synthesis and stability
Carlisle, PA
● Performed genetic manipulations and measured gene expression in S.
cerevisiae model organism
PUBLICATIONS:
Liu TF, Vachharajani V, Millet P, Bharadwaj MS, Molina AJ, McCall CE. Sequential actions of
SIRT1-RELB-SIRT3 coordinate nuclear-mitochondrial communication during immunometabolic
adaptation to acute inflammation and sepsis. J Biol Chem. 2015;290(1):396-408.
Millet P, McCall C, Yoza B. RelB: an outlier in leukocyte biology. J Leukoc Biol. 2013;94(5):941-
951.
Liu TF, Brown CM, El Gazzar M, McPhail L, Millet P, Rao A, et al. Fueling the flame: bioenergy
couples metabolism and inflammation. J Leukoc Biol. 2012;92(3):499-507.
PRESENTATIONS:
Millet P, McCall C. GAPDH Participates in Posttranscriptional Repression of TNF-α in Endotoxin
Tolerant Monocytes. Poster presented at: Development of Innate Immunity. 47th Annual Meeting of
the Society for Leukocyte Biology and the International Endotoxin and Innate Immune Society; 2014
Oct 23-25; Salt Lake City, UT.
Liu TF, Millet P, Molina A, McCall CE. Mitochondrial Sirt3 NAD+-Dependent Deacetylase
Regulates Oxidative Bioenergetics during the TLR4-Induced Acute Inflammatory Response. Poster
presented at: Inflammation in Innate and Adaptive Immune Mechanisms. 45th Annual Meeting of the
Society for Leukocyte Biology; 28-30 Oct 2012; Maui, HI.
Millet P, Liu TF, Molina A, McCall CE. NF-kB RelB Contributes to Mitochondrial Biogenesis and
Bioenergetics During Immune Response. Poster presented at: Frontiers in Basic Immunology. National
Cancer Institute; 2012 Oct 4-5; Bethesda, MD.
TEACHING EXPERIENCE:
College Teaching Prep Program -- Wake Forest University Jan 2014 – Feb 2015
● Completed program of instruction in undergraduate teaching
● Participated in several workshops to learn topics including active
learning techniques, inclusiveness in the classroom, motivating
students, and learner-centered education

Visiting Lecturer -- Winston Salem State University Jan 2014 – May 2014
● Created and taught multiple lectures of upper-level biochemistry
course
● Wrote and graded exam questions
● Received feedback and mentoring from current professor
Graduate School Honor Code Panel -- Wake Forest University Jan 2012 – Jan 2014
● Participated in disciplinary hearings of other graduate students
regarding honor code violations including plagiarism, data fabrication
● Discussed and voted on recommended disciplinary measures
Community Outreach Volunteer Teacher -- Brain Awareness Council Feb 2013 – May 2013
● Gave presentations on neurobiology and the brain to students from
local elementary, middle, and high schools