Embed Size (px)
Citation preview

rv--
Final Report
INTERCITY BUS ROUTE EVALUATION FOR STATEWIDE PLANNING
E. J. KANNEL K. A. BREWER R. L. CARSTENS MAY 1981
~ of T~R..11~.s'..o ~'<) 0
~~~ 1 () ~
* * . IOWll<
Prepared for the Iowa Department of Transportation
ISU-ERl-Ames-81217 Pro"-1456
TA l · 09-8008
Io8p 1456
PROPERTY Of k1Na DOT Ubrmy
The preparation of this document was financed by the Iowa Department of Transportation and the U.S. Department of Transportation, Urban Mass Transportation Administration.

~~·
I i
I .
'
Prepared for the Iowa Department of Transportation
1 \ ISU-ERl-Ames-81217 I r Project 1456
DOT IA-09-8008
----------
ENGINEERING RESEARCH ENGINEERING RESEARCH ENGINEERING RESEARCH · ENGINEERING RESEARCH ENGINEERING RESEARCH
Final Report
INTERCITY· BUS ROUTE EVALUATION FOR
STATEWIDE PLANNING Project Staff
E. J. Kannel K. A. Brewer R. L. Carstens S. L. Ring
Graduate Assistants F.K. Hamad G. R. Moen
May 1981
DEPARTMENT OF CIVIL ENGINEERING ENGINEERING RESEARCH INSTITUTE IOWA STATE UNIVERSITY AMES, IOWA 50011

I
1
i I
1·
iii
TABLE OF CONTENTS.
LIST OF FIGURES
LIST OF TABLES
1. INTRODUCTION
Research Objectives
Research Scope
2. INTERCITY BUS RESEARCH AND DEVELOPMENT
Industry Status and Transportation Policy
Transportation Demand Models
Operating Cost Formulation
Assistance Programs in the States
Summary
3. OPERATING CHARACTERISTICS OF INTERCITY CARRIERS IN IOWA
Carrier Classifications
Iowa. Volume and Revenue Trends
Total System Cost and Revenue ,Components
Financial Condition of Carriers
4. CO~TER CARRIERS
Providers and Types of Service
Service Characteristics
Operating Revenues and Expenses
Summary
5. PASSENGER AND REVENUE FORECASTING MODELS
Revenue Analysis from Individual Cities
Model Development for Route Analysis
vii
ix
1
3
4
7
8
10
14
15
18
19
19 . . '\,
23
34
39
40
43
51
57
59
60
66

iv
Validation of the Model
Application of the Forecasting Models
Revenue Estimation in the Corridor
Summary
6. OPERATING COST RELATIONSHIPS
7.
Background
An Operating Cost Model
Updating of the Model
Application of the Model
Summary
SOCIAL AND GENERAL WELFARE ASPECTS OF INTERCITY BUS SERVICE
Introduction
Review of Selected State Programs
Definition of Iowa Social-Welfare Parameters
Case Study Examination
Summary
8. CASE STUDY ANALYSIS
Analysis in a New Service Corridor
Analysis in an Existing Corridor
Summary
9. ADDITIONAI. SERVICE CONSIDERATIONS AND RECOMMENDATIONS
Service Factors
Systems Data
Other Carrier Input
72
73
80
82
85
85
86
96
98
99
101
101
103
107
117
119
121
121
131
137
139
140
143
146
I .~
I
I'
I I
\
I
v
Swnmary of Results
Recommendations
10. ACKNOWLEDGMENTS
11. REFERENCES
APPENDIX. UNIT REVENUE CHARACTERISTICS FOR REGULAR ROUTE AND CHARTER SERVICE
150
152
153
155
159

...-------------------------·---·------
I I I
I
I
I - ,
,,
I
3.1. Operating 1978.
3.2. Operating
3.3. Operating
5 .1. Adjustment routes.
vii
LIST OF FIGURES
cost distribution for all carrier types
expense trends for carrier groups.
revenue trends for carrier groups.
factors for trip frequency on existing
in 24
25
26
79

-----------------------
-,)
~-'
,-"'.:: ....
_· .......
ix
LIST OF TABLES
3.1. Iowa travel, revenue, and cost trends for selected carriers.
3.2. Unit operating expenses for total system.
3.3. Unit operating revenues for total system.
3.4. Unit revenues for regular route and charter services.
3.5. 1979 revenue characteristics of selected short-haul Greyhound routes in Iowa.
3.6. 1979 unit operating costs for major categories.
3.7. Operating ratios for Iowa Class I intercity carriers.
3.8. Return on investment for Iowa Class I intercity carriers.
4.1. Li~t of cities served by selected commuter buses in Iowa.
4.2. Characteristics of the vehicles used in the commuter operations in 1979.
4.3. Load factors on commuter services for the first six months of 1980.
4.4. Average fare per mile for the commuter bus service.
4.5. Average fare per mile for selected intercity carriers.
4.6. Unit operating expenses and revenues for the commuter bus service.
4.7. Operating expenses of selected commuter carriers.
5.1. Unit revenue characteristics in cities served by Greyhound.
5.2. Abbreviations used for route analysis.
'5.3. Data summaries for the 11 routes used in model develop-· : ment.
5.4. Characteristics of selected factors for study routes.
5.5. Model validation for passenger model.
5.6. Bus-mile adjustment factors for new route analysis.
Page
22
27
29
31
32
33
36
37
41
45
48
49
52 ' !
53
55
64
68
69
70
74
77

x
6.1. Expense items considered for inclusion in operating cost · model.
6.2. Details of expense components.
·Page
88
92
6.3. Analyses of five expense components as percentages of 94 total expenses.
6.4. Average proportion of total expenses attributable to 95 each expense component (1977-1979).
7.1. General social-welfa~e indicator values for selected 108 Iowa communities.
8.1. Data for proposed route through Mount Pleasant. 124
8.2. Revenue and cost comparisons for proposed route. 129
8.3. Travel characteristics for the existing route case study. 134
8.4. Monthly distribution of passengers on intercity carriers. 136
A.l. Unit regular route passenger revenue trends for total 161 system.
A.2. Unit express revenue trends for total system. 162
A.3. Unit charter revenue trends for total system. 163
.... _-
~-· ..

I 'v
1. INTRODUCTION
Maintenance of an intercity bus service system is a crucial element
in an effective transportation network. Intercity bus carriers offer
the opportunity for mobility to all population segments, but especially
to the transportation-disadvantaged. Furthermore, they provide a service
that can minimize the adverse impact of vehicular travel on the environ
ment, and they can offer a service that is energy-efficient when compared
with other forms of passenger travel.
In spite nf the general benefits, a pattern of decreasing utiliza
tion of these services is clear. Ridership and the economic viability
of the carriers have steadily declined. Annual reports filed by the
carriers with the Interstate Commerce Commission indicate that on a
national scale, intercity bus ridership has declined approximately 25%
in the past 10 years. The total regular route ridership on carriers
serving Iowa has dropped 17% in a similar time period. Ridership in
1979 was only 4% of the peak volumes observed 35 years earlier. Although
a cause and effect relationship has not been clearly established, the
declining utilization of intercity carriers has been accompanied by
decreases in the number of cities receiving service, reductions in serv
ice frequency, and lower quality of service at terminals.
In a regulated industry, when losses occur in segments of the regu
lar route passenger service, charter and express revenues may be expected
to provide the income necessary to cover the regular passenger service
expense. In other cases, cross-subsidization of a route from other more
profitable runs is necessary. However, due to the general affluence of
today's. population and the public's desire for the flexibility, comfort,

2
convenience, and speed of automobile or air travel, even the more lucra-
tive market corridors have difficulty generating profits that can sup-
port a carrier's weaker routes. A consequence is a request by the
regulated carrier to either abandon public service to portions of the f_
service area or to increase the rates.
Within Iowa, service has been reduced or lost completely in several
corridors. The abandoned service connections are typically in the
smaller communities. But in 1977, the last route between two metropoli-
tan centers was also lost when a carrier dropped its regular route ser-
vice completely. Four communities in the state with populations over
5,000 are currently without intercity bus service.
Several states, including Iowa, consider the operations of the
intercity bus carriers part of the total state transportation planning
effort. Some states have established a means of providing financial
assistance. Similarly, the 1978 Surface Traµsportation Act demonstrated
the federal government's concern for maintaining the viability of inter-
city bus carriers. This legislation authorized programs for operating
assistance and terminal or facility development for intercity bus ser-
vice. The federal operating assistance program was designed to make
funds available. to state and local governments for initiation, improve-
ment, or continuation of intercity bus service. These grants were to
be used to subsidize up to 50% of a route's deficit attributed to oper-
ating costs. The remaining moneys to cover the deficit were to be gen-I .
erated from other public funds.
Although the program never became a reality, it did generate inter-
est in the intercity bus market. Additional studies have been initiated

3
to examine market conditions, and polic~ issues. Iowa and other states
are evaluating their planning·,, regulatory, and financial roles in rela
tion to statewide needs and the n~eds of carriers.
Research Objectives
The goal of this research is to evaluate the needs of the intercity
common carrier bus service in Iowa. The purpose of this analysis is to
provide a framework to be used by the Iowa Department of Transportation
to identify potential costs and revenues on routes in which the state is
interested in sustaining, improving, or initiating intercity bus service.
Within the framework of the overall goal, the objectives are to:
1. Examine the detailed operating cost and revenue data of the
intercity carriers in Iowa. The data would include specific
information about individual routes, to the maximum extent
possible.
2. Develop ~model or models t6 estimate demand in cities and
corridors served by the bus industry.
3. Develop a cost function model for estimating a carrier's oper
ating costs. The cost model should consider the variations
associated with carriers of different sizes.
4. Establish the criteria to be used in assessing the need for
changes in bus service.
5. Outline the procedures for estimating route operating costs and
revenues and develop a matrix of community and social factors
to be considered in evaluation. The methodology would identify

4
the data needs and steps that state agencies would.follow in
fulfilling their roles in ,the evalua~ion process.
6. Present a case study to, demonstrate the, methodology.
Research Scope
Carriers Included in the Analysis
This research was developed to study the regular route intercity
bus carriers identified in an initial study conducted by the Engineering
Research Institution (1]. Because of a growing interest in the small-
scale commuter bus carrier, the transit planners and regulatory personnel
requested that a special effort be undertaken to assess the operations
of commuter services. ·The research examines nine C?rriers.that provide
interlining service and seven additional carriers providing special ser-
vices.
Data Sources for Operating Characteristics
A condition specified for the cost and demand models and 'the evalu-
ation methodology was that the procedures be applicable using.existi~g
data sources. For model development, the researchers used data fro~
~nnual reports and other special information that management could pro-
vide from their records. The estimation procedures do not require
special ticket sampling, passenger surveys, or other more costly inven-
tory techniques.
Similarly, the data used to structure the social or community in-
terest evaluation were obtained from secondary data sources. A number
of factors to be assessed in the evaluation of the state's interest when
r-1
, I
I .-
I \
I I

.I I .. I
5
considering matters of funding or operation is developed in the research.
The factors are based on information obtained through communications
with other states that have assistance programs, from published reports,
and from the experiences of the researchers. The states contacted
directly were California, Georgia, Michigan, Oregon, Pennsylvania, New
York, North Carolina, and Wisconsin.
The associated commuter bus study for this research required special
contact with the carriers. Surveys were completed to determine start-up
costs, marketing efforts, and other operating characteristics. Operat-
ing revenues and expenses were obtained from the special surveys as well
as from the annual reports.
Time Period for Analysis
The details of the annual reports were examined for the period
1976 through 1979. The route-specific passenger data were assembled
by the carriers and the staff for 1979 only. Commuter data,were ob-
tained for the first six months of 1980, where possible, because this
represented the only experience of the newest carriers.
Methodology
The forecasting and evaluation methodologies were developed using
readily available statistical tools. Model calibration was performed \
using computer facilities, but each application phase can be completed
with a standard calculator.
The models use linear regression, classification, and/or matrix
formulations that can be applied using data bases readily accessible
to the Department of Transportation.

I
7
2. INTERCITY BUS RESEARCH AND DEVELOPMENT
Interest in the intercity bus industry appeared to swell with the
passage of the 1978 Surface Transportation Act [2], which was designed
to provide opportunities for financing intercity passenger carrier op
erations and facilities. However, interest had been evident before
this as states acknowledged that energy shortages, lowered profitability
for the carriers, and reduced services to communities were important
factors in statewide transpo~tation planning. Many states, including
Iowa, had completed inventories and planning studies. Several states,
including Michigan,· Pennsylvania, New York, and New Jersey, were provid
ing assistance before the federal programs were proposed; other states
have continued in this direction. In addition, research had been under
taken to develop intercity demand models and cost analyses. The travel
demand research has varied from detailed microeconomic studies of rail
passenger potential in the Northeast Corridor to sketch planning fore
casts for regional transit systems operating van programs. Cost esti
mation models have ranged from cost analyses using aggregate data from
the Interstate Commerce Commission's annual reports to specific corridor
'studies completed by the carriers as they prepare to abandon routes.
This section reviews selected intercity bus studies, but the de
tails of individual programs are not discussed. Reports with more
extensive literature and program reviews are identified in the text.

8
Industry Status and Transportation Policy
Status and Issues
Pursuant to the 1978 Surface Transportation Act, the Secretary of
the Department of Transportation submitted a report to .. detail the con-
ditions that exist in the 1ritercity pas~enger carrier industry [3].
The report primarily documents the condition of the industry and exam-
ines policy areas that should be examined to improve the potential for
maintaining viable services.
The status report did not surpris,e those who had pressed for atten-
tion to the industry. 'The inte~city bus industry carries over 50% of
the common-carrier intercity passengers; yet it accounts for less than
2% of the passenger-miles because much of the travel is short-haul
movement serving rural communities. The importance of providing this
local, rural service is, in fact, why the government is concerned about
the viability of the bus carriers. ,In most communities, bus service is
the only remaining form of public transportation; the loss of this po-
tentially energy-efficient means of transportation during an energy-
awareness period has caused great concern.
The industry totals show that during the period from 1970 to 1978,
the route-miles served decreased by 12%, bus-miles were reduced 11%, and
passenger volume dropped 17%. The total revenues increased from $901
million to $1.389 billion (54%); but, at the same time, expenses rose
from $812 million to $1.334 billion (64%). The net result is that the I
carriers' financial condition is deteriorating. The carriers must seek
relief through increased rates, decreased service to communities in the

I
9
high loss corridors, direct financial assistance through subsidy pro
grams, or indirect assistance through tax reductions, marketing programs,
or user subsidies. Each of these areas is currently an alternative.
As a regulated industry, route and fare adjustments must be
approved by the Interstate Commerce Commission or a state regulatory
agency, or both. Because the criteria used for evaluation are applied
differently by the different regulatory bodies, the regulatory decisions
often are not uniform. Regulatory reform is an issue receiving consid
erable attention [4,5]. The regulatory issues are beyond the scope of
the current research project, but they cannot be separated completely
from the analysis of corridor service.
Direct and indirect assistance programs also are not uniform among
the states. Selected states provide direct subsidies from their own
funds; others pass through Section 18 moneys available from the Urban
Mass Transportation Act. Some states provide planning and marketing
assistance; others have not addressed the problem in detail. Fravel
[6] effectively summarized the major programs in the various states.
A single program that has provided a measure of relief for all
carriers is the Energy Tax Act of 1978 [7]. This act exempts privately
owned bus companies from payment of federal excise taxes on new buses
and parts, and provides federal tax rebates on diesel fuel. This provi
sion was expected to save the industry $17 million in 1978 [3].
Transportation Policy Analysis
The National Transportation Policy Study Commission (NTPSC) was
mandated through the 1976 Federal Aid Highway Act to investigate U.S.
transportation needs and the role of all transportation modes in meeting

----·------
10
those needs through the .year 2000 [8]. The main report [9] and a spe
cial report [10] on intercity bus transportation provide more resource
materials .on existing service and the role of bus travel. The bus sec
tor is projected to increase in absolute numbers of passenger-miles by
as much as 35% in h~gh growth ·scenarios. Yet, as a portion of the total
movement, bus usage would decline to approximately 1.1% of all intercity
passenger-miles.
The NTPSC recommended that the role and financial viability of
the bus industry be enhanced by adjusting the regulatory environment
affecting bus rates, rate bureaus, and entry and exit procedures.
The commission also advocated subsidies for certain uneconomic routes
where social benefits exceeded the costs [10]. However, they did not
state the criteria that should be used to determine the benefits.
Transportation Demand Models
Intercity travel forecasting models have ranged from simple esti
mates based on trips per 'Capita t'o sophisticated mod~ls incorporating
probabilistic estimates, price elasticities, cross-elasticities, service
factors, socioeconomic characteristics and more. The simplest models
are deficient because they cannot describe the effects of changes in
service. The more complex models can provide information regarding
service changes, but they frequently are poor estimators. In addition,
the latter models may be data-intensive and intractable. Hartgen and
Cohen [11] summarize several of the more sophisticated models that have
been developed. These models have been used primarily for rail corridor
analysis in the Northeast Corridor.
a

I
11
Applications in the bus market have similarly ranged from the simple
to the complex. A Wisconsin study summarized several efforts in bus de-
mand analysis, including three of the more complex models used in that
state [12]. The models generally estimated travel between city pairs for
all modes of concern. The equations were developed with regression tech-
niques using only the system variables of time, price, and frequency.
They concluded that travel cost was more important than time. Frequency
was an important factor for rail and air modes, but the results were
mixed for the bus mode. One model found frequency to be important; the
others did not. In all cases, the frequency variable recognized a dimin-
ishing marginal utility for increased frequencies. The adjusted fre-
-0.Sf quency was calculated as F' = 1 - e , where e is the base of Naperian
logarithms and f is the actual daily frequency. The models were viewed
as acceptable, even though only 60% of the variation in the dependent
variable could be explained by the model.
Analyses in Iowa have previously examined passenger volume by bus
from individual cities [l]. The selected regression model was able to
explain 92% of the variation in ticket sales (R2 = 0.92) using two com-
munity factors: retail sales, and number of physicians and dentists.
However, there were no origin-destination pairs considered, so the
analyses could not directly address relative price, time, or distance
factors for bus travel. A service variable that incorporated departure
frequencies, the number of competing carriers in the city, and an aver-
age travel-time estimate to other metropolitan centers was constructed.
The level of service variable, however, always entered the equations
with an inappropriate sign because of colinearity in the data. If the

12
service level va~iable had been used alone, the appropriate interpreta
tion would have been possible, but the percent of variation in ticket
sales that could be explained would have been only 60%.
A Michigan study also developed ridership models at the city level
by grouping cities into level of service categories and area [13]. The
2 strongest models could incorporate only city population. Although R
values of 0.90 or higher were obtained, the estimates in individual
cities frequently had errors of 400% or more. Based on these analyses,
the Michigan study estimated that there would be 66 annual riders for
each 100 persons in the city. The rider~hip would also increase by 10
persons per daily departure frequency. These conclusions, however, are
based on the earlier-described unstable regression equations.
The most wide-range set of explanatory variables was established
in Georgia [14]. Georgia researchers examined travel demand as a trip
generation problem from individual cities as well as a network distribu
tion problem. The generation equations considered city and area popu
lations, population density, minority populations, age, income, average
family size, and level of service variables similar to the Iowa concept.
The results again indicated that a measure of city population was the
only significant variable in regression models. Additional efforts to
incorporate service characteristics only marginally improved the statis
tical strength. The actual prediction errors in individual cities could
not be readily identified, but it was noted that all cities below 3,000
population would have a negative number of trips based on the equation.
The network distribution effort described the bus system in the
format used in urban transportation analysis. Modifications were
I

! :
\
13
necessary to scale times and distances .to levels acceptable within
the model. The large variations in the total' statewide system pre
vented the development of successful distributions. The model was
also undesirable from the viewpoint of data input; the data were ob-·
tained by extensive sampling of ticket sales.
Burkhardt and Lago presented a series of regression models that
address passenger flows on a route basis [15]. Although the data were
related to commuter orientations around sel.ected activity centers· and
the routes defined a general linear area instead of a specific path, the
results were of interest because both community and service characteris
tics were included 'in the final models. Furthermore, the models used
calibration procedures generally known and accepted in traditional plan
ning offices.
The richest of the models, in terms of factors; was a system model
to estimate monthly passengers. The explanatory variables were bus
miles of travel, service frequency, corridor popula,tion, fares, and
competing carrier service in the corridor. All variables retained the
correct sign, but the competing carrier service factor was not statis
tically significant. The researchers reported fare elasticity of -0.61
and a frequency elasticity of 0.49 (estimated at the sample means). The
elasticities have the correct sign, but they are based on data from a
single point in time rather than reflecting actual changes due to price
or frequency adjustments. Between 60 and 80% of the total variation was
explained in the selected models.
)

14
Operating Cost Formulation
The efforts to establish cost patterns for the intercity bus
industry have focused on evaluation of the data reported in annual
reports to the Interstate Commerce Commission (ICC) or to the state
regulatory agencies. This approach is necessary because the carriers-
particularly the smal~er carriers--are not prepared to summarize or to
directly allocate the various cost components to specific operations.
The variations in wage rates, fringe benefits, insurance, and other
management costs can be determined, but not normally on a route-by-route
basis. The studies reviewed here were restricted to data obtained from
annual reporting formats.
Van Der Walker examined the operator's cost patterns with a view
towards establi~hing standards by which to compare carrier performance
[16]. The hypothesis was that an average cost model could be developed
and future regulatory decisions could be based on how well the carriers
were meeting the standards.
The operating costs were examined as a total cost, as well as by the
major cost categories, including maintenance of equipment, transportation,
station, traffic solicitation and advertising, insurance and safety, ad
ministration and depreciation. The factors considered for predicting
cost differences were a loading factor (passenger-miles/bus-miles), a
scale factor (bus-miles), and density (an estimate of actual passenger
miles/total seat-miles). The size factor was not significant and the
reported densitr factor had an illogical sign. _Only the load factor
appeared to be useful for explaining cost differences.

I I
15
Yordan used the same data set and found entries (passengers per
bus-mile) to be most important [17]. The percent of total miles oper
ating in charter service was a significant explanatory variable, and
wage rates were marginally significant. However, the model indicated
that expenses per mile increased as the percentage of charter miles
increased. This is contrary to conventional wisdom and is inconsis-.
tent with the current research findings.
The more complex Cobb-Douglas production function was applied by
Fravel to examine carrier costs [18]. He argued that since the indus
try is regulated, the price of service and the output are controlled
outside the firm. Therefore, he concluded, the industry must be a cost
minimizing industry. The inputs to minimize were vehicles, fuel, and·
labor costs. Nonlinear models were developed in the form of:
Total e?Cpenses = K (bus-miles)a (fuel)b (hourly wages)c
The major expense .categories were. analyzed separately. Only the bus
miles variable was a significant indicator. Fravel concluded that there
were negative economies of scale for the largest Class I carriers (e.g.,
Greyhound and American) and constant returns to scale for the smaller
Class I carriers in North Carolina. In other words, there were ·no cost
advantages to having a large-scale operation.
Assistance Programs in the States
Contacts were made with other states that have assistance programs.
The principal objective was to determine the criteria used by the states
to evaluate funding decisions. More details on the individual programs
are given by Fravel [6].

16
Michigan
Michigan has provided 'state funds for operating,assistan~e, ter
minal improvements, and rolling stock. Several factors were identified
regarding the selection of new routes for funding. These included:
• Potential to become·self-sustaining within two years.
• Amount of existing service in the travel corridor.
• Type of service.
• Availability of connections to other routes.
• Population in the area to be served.
• Special market contributers, such as state institutions,
colleges, and military bases.
The only quantifiable criterion was the desire to attain profitability
within two years. The requirement was later dropped; generally the new
routes were not meeting the standard. Although ridership did increase
on selected routes, the overall financial condition of the carriers was
not improved. A more complete evaluation of the program is given in the
Michigan report [13].
Pennsylvania
Pennsylvania also uses funds of the commonwealth to assist the
carriers. The transit planners have not identified set standards for
selection, but they have established simple priorities. The priorities
are:
1. To preserve existing service in rural and small communities.
2. To upgrade services if funds are available after Priority 1.
Although there are no fixed factors for evaluation, the state agency will
consider an operation for funding only if there is a commitment of support
' \

17
from the local government and the carrier petitions for the assistance.
It is not essential that the carrier be able to eventually cover all cost~,
but the state's interest is guarded by carefully reviewing the expenses
and fare structure for the operation. The carrier's costs are evaluated
by measuring cost components for driver's wages, fuel, terminals, etc.,
against current standards. Adjustments may be made for layover times,
idle time, premium payments, dead-head miles, and other accountable ele-'
ments.
New York
As part of the total transit system, intercity buses in New York
are eligible for state funds. The allocation process has traditionally
centered on fixed formulas based on passengers served and miles traveled.
Studies have addressed other efficiency and effectiveness variables [19].
These factors address economic elements but do not address social con-
siderations.
The distribution of funds to intercity carriers is hampered because
the funds come through the counties. A carrier has to negotiate with
several local units on a long-distance route in order to acquire funding.
Consequently, carriers are discouraged about the required efforts to ob-
tain public assistance.
California
A $1-million program for intercity carriers was implemented in
California for fiscal year 1980. The factors considered in the evalua-
tion process included, but were not limited to, the following [20]:
• Relative contribution to a statewide network.
• Practicality and ease of implementation.

----------------------------
18
• Need for service, considering low-mobility population elements
and the availability of alternative services. I
• Potential ridership.
• Potential costs. I
• Ability of the applicant to ·d I h · prov1 ~ t e service. I
I I
potent~al for self-sufficiency and The primary considerations were the
the long-term benefit. However, a definition of the long-term benefit
was not, or could not, be defined. Unlike Pennsylvania and New York,
California did not require the carriers to take the initiative. If a
service were deemed desirable, the state would evaluate it as long as
the project was consistent with the regional plans.
Summary
A wide variety of models has been developed for demand and cost
estimation. Generally the models demonstrate statistical significance
but fail to produce accurate estimates in individual communities or
corridors. In some cases, the models addressed policy variables related
to supply, but the models were simultaneously comparing modes and re-
quired a large data base. No models directly addressed the need for
simple formulations that could provide accurate forecasts in all corri-
dors.
Not all state evaluations are included in this review. Those shown,
however, are sufficient to indicate their present status regarding prior-
ities for distribution. To date, the states have been either unable to
establish fixed criteria or have felt it was inappropriate to describe
fixed criteria to define priorities.
19
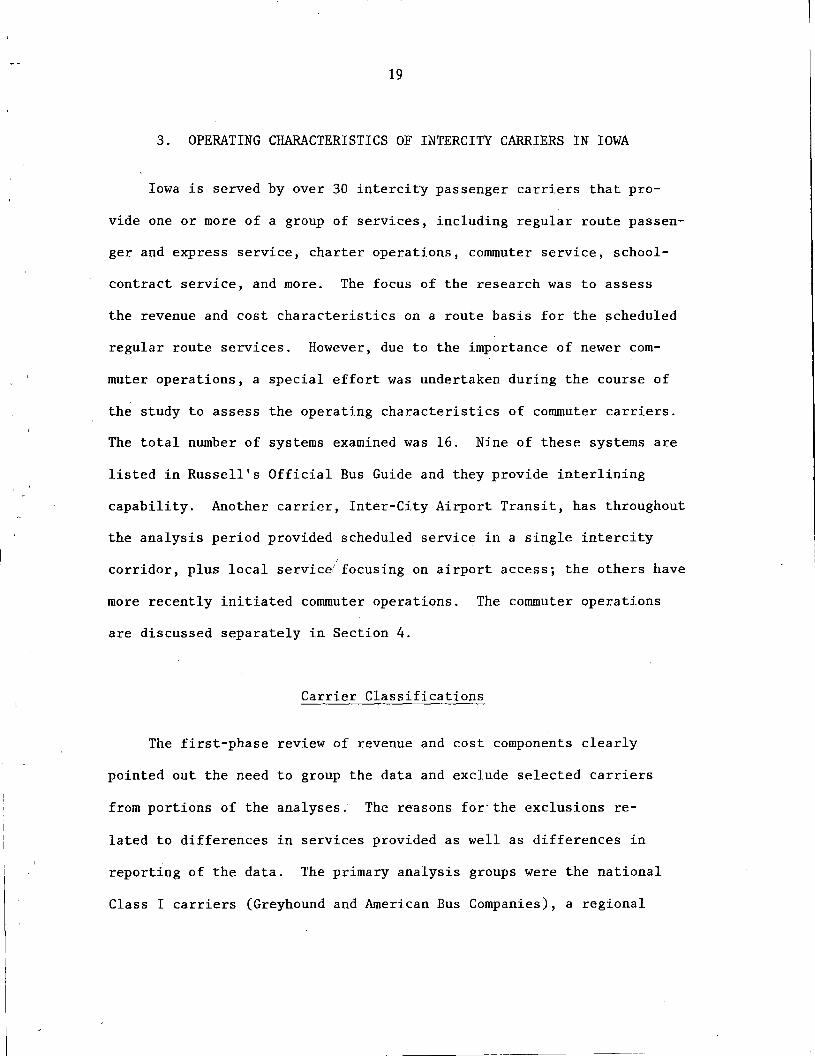
3. OPERATING CHARACTERISTICS OF INTERCITY CARRIERS IN IOWA
Iowa is served by over 30 intercity passenger carriers that pro-
vide one or more of a group of services, including regular route passen-
ger and express service, charter operations, commuter service, school-
contract service, and more. The focus of the research was to assess
the revenue and cost characteristics on a route basis for the scheduled
regular route services. However, due to the importance of newer com-
muter operations, a special effort was undertaken during the course of
the study to assess the operating characteristics of commuter carriers.
The total number of systems examined was 16. Nine of these systems are
listed in Russell's Official Bus Guide and they provide interlining
capability. Another carrier, Inter-City Airport Transit, has throughout
the analysis period provided scheduled service in a single intercity I
corridor, plus local servic~ focusing on airport access; the others have
more recently initiated commuter operations. The commuter operations
are discussed separately in Section 4.
Carrier Classifications
The first-phase review of revenue and cost components clearly
pointed out the need to group the data and exclude selected carriers
from portions of the analyses: The reasons for-the exclusions re-
lated to differences in services provided as well as differences in
reporting of the data. The primary analysis groups were the national
Class I carriers (Greyhound and American Bus Companies), a regional

20
Class I carrier (Jefferson), primary Class II and III carriers (Iowa
Coaches, Midwest Coaches, Missouri Transit, and Scenic Hawkeye), and
secondary Class II and III carriers (Inter-City Airport Transit, Reid
Bus Lines, and River Trails Lines). The class designations used follow
the definitions of the Interstate Commerce Commission (ICC), except for
the primary and secondary notations added by the researchers. Class I
carriers have an annual revenue in excess of $3 million; Class II car
riers have an annual revenue between $1 million and $3 million; and
Class III carriers have annual revenues of less than $1 million. The
Iowa Transportation Regulation Board categorizes all carriers with
revenues in excess of $500,000 in a Class I group. This group would
include ICC Class I carriers plus the primary Class II and III groups
defined above. Other carriers are not included in the study either
because they do not provide a significant inter-line service within the
state or because their primary role is as a charter carrier. Carriers
without express revenues in Iowa or with fewer than 1,000 Iowa regular
route passengers are not included.
The primary analyses will consider the Iowa Class I definition
carriers. However, throughout this section, revenue and cost compari
sons will also be provided for the other group.
Iowa Volume and Revenue Trends
The annual reports submitted to the Transportation Regulation
Board of the Iowa Department of Transportation were obtained for the
period 1976 to 1979. Detailed analyses of year-to-year changes were

21
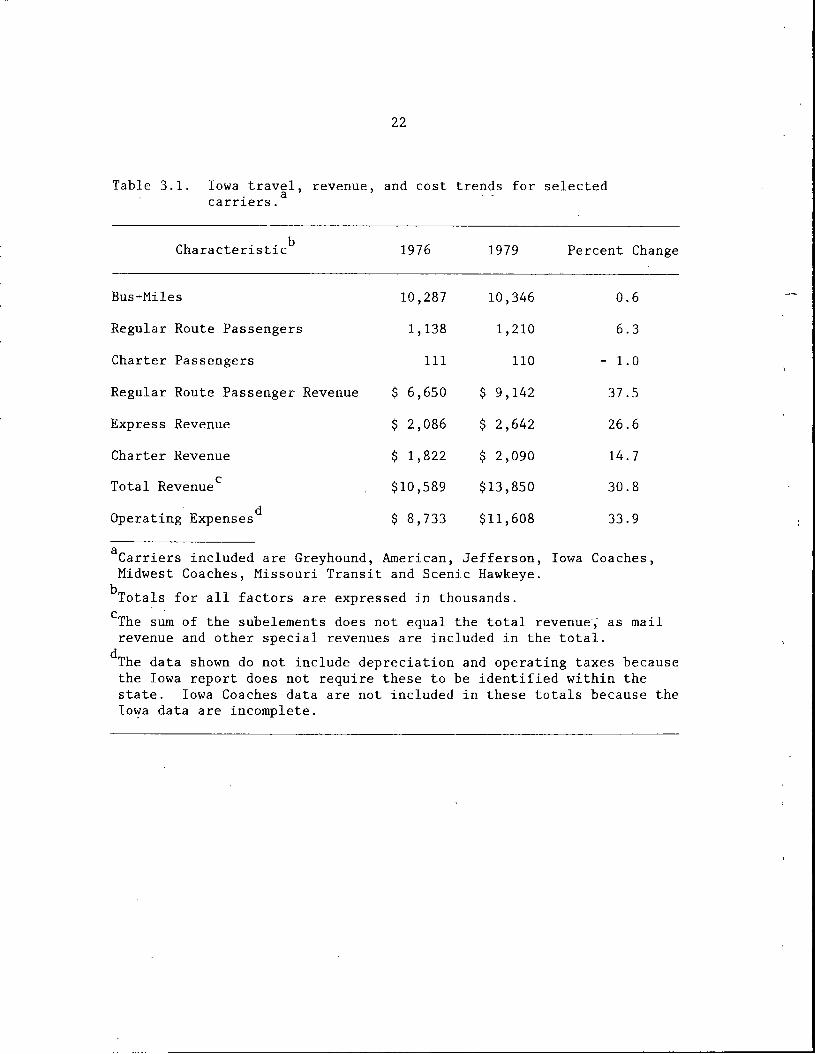
made for both the cost and revenue components. The pattern of change
for operations directly attributed to Iowa is presented in Table 3.1
for the seven Iowa Class I carriers.
The amount of service provided within the state by these carriers
has remained relatively constant during this period, while the regular
route passenger ridership has gained slightly. These data are consis
tent with recent national trends, but the decline in charter passengers
in the state is contrary to the trends these carriers are reporting on
a systemwide basis.
Revenues for passenger movement have increased more rapidly than
total passenger volumes in the state, but the carriers have not exper
ienced substantial real gains because of increased operating costs.
The operating expenses shown have increased at a faster rate than have
the revenues. Comparisons drawn from this table are not complete, be
cause not all expense items are given. The Iowa report only asks the
carriers to break out the operating costs for the 4,000-series elements
in the ICC report, i.e., maintenance, transportation, station, advertis
ing and solicitation, insurance, and general administration. Deprecia
tion an.d operating taxes are not defined by the carriers within Iow<;i
unless they choose to do so. This in itself poses a problem because
some carriers allocate a portion of the latter elements in the summary
sheet, without referencing this addition, while other carriers do not.
These differences can easily go undetected in computer summaries.
Comparisons at the state level are limited in a second way because
the cost components are clearly not based on detailed tabulations of
cost within the state; rather, they are often direct, proportionate -
---------------------------------------
22
Table 3.1. Iowa travel, revenue, and cost trends for selected . a carriers.
Characteristicb 1976 1979 Percent Change
Bus-Miles 10 ,287 10,346 0.6
Regular Route Passengers 1,138 1,210 6.3
Charter Passengers 111 110 - 1. 0
Regular Route Passenger Revenue $ 6,650 $ 9,142 37.5
Express Revenue $ 2,086 $ 2,642 26.6
Charter Revenue $ 1,822 $ 2,090 14.7
Total Revenue c $10,589 $13 ,850 30.8
Operating Expenses d $ 8,733 $11,608 33.9
aCarriers included are Greyhound, American, Jefferson, Iowa Coaches, Midwest Coaches, Missouri Transit and Scenic Hawkeye.
b Totals for all factors are expressed in thousands.
cThe s~ of the subelements does not equal the total revenue,- as mail revenue and other special revenues are included in the total.
dThe data shown do not include depreciation and operating taxes because the Iowa report does not require these to be identified within the state. Iowa Coaches data are not included in these totals because the Iowa data are incomplete.

I -
23
allocations. For example, Greyhound allocates all cost components
simply on the basis of the percent of bus-miles provided in Iowa. Jef
ferson apparently has allocated costs using,bus-miles in some years and
passenger revenue in other years. Scenic Hawkeye makes an effort to
attribute the costs to the operating factor they feel is most highly
associated with the cost component. Fuel, oil, equipment repair, and
transportation costs were allocated in the same proportion as bus-miles.
Insuranc~, advertising, and administration were based on passenger-mile
data. Since the Iowa cost components are often either undefined or sim
ple allocations, the remaining comparisons deal with total system figures.
Total System Cost and Revenue Components
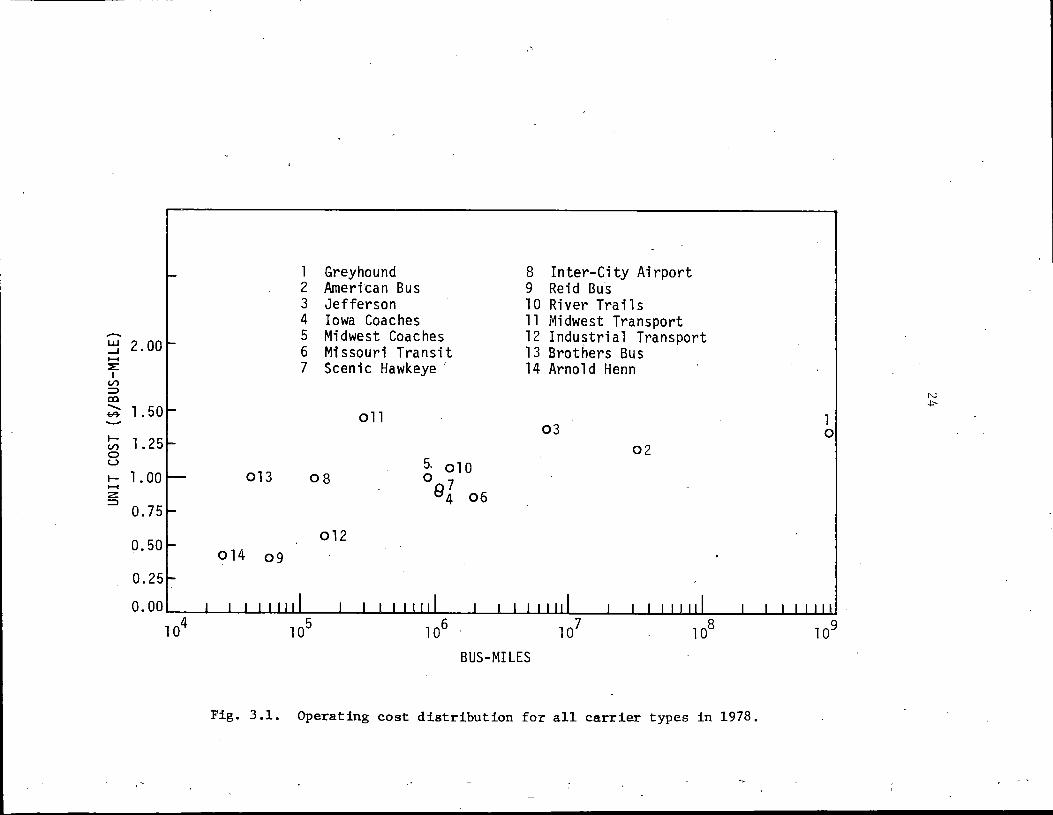
A general view of the cost of operating a service is given in Fig.
3.1, where total operating costs are converted to a unit basis (dollars
per bus-mile). Examination of the figure as a whole suggests that there
are no clear, discernible variations in operating costs with increasing
operating mileage. Low mileage carriers, such as Midwest Transportation,
have costs exceeding those of the largest carrier, Greyhound. On the
other hand, another low mileage carrier, Reid Bus Lines, reports oper
ating costs at less than 30% of Greyhound's costs. Carriers 11-14 on
the graph represent the commuter group. These operators have widely vary
ing cost patterns, which can be explained at least partially by the fact
that in some cases they have operated for less than a year.
A better assessment may be obtained by examining only established
carriers. Figures 3.2 and 3.3 show the unit cost and revenue trends
for the seven largest carriers. Table 3.2 provides a detailed summary
LLJ 2.00 -' ....... ::::!!: I
V') ::> cc - 1. 50 ~
I- 1.25 V') C> <....>
I- 1. 00 ....... z ::>
0.75
0.50
0.25
0.00
l o4
013
014 09
l Greyhound 2 American Bus 3 Jefferson 4 Iowa Coaches 5 Midwest Coaches 6 Missouri Transit 7 Seen i c Ha wk eye '
oll
08
012
5. Ol 0 0 7
94 06
8 Inter-City Airport 9 Reid Bus 10 River Trails 11 Midwest Transport 12 Industrial Transport 13 Brothers Bus 14 Arnold Henn
03 02
BUS-MILES
Fig. 3.1. Operating cost distribution for all carrier types in 1978.
l 0

2.00
..-.1.50 w _J ........ :::E
I U')
=> co --b'l-
w
~ 1.00 w 0... >< w <..!:) z .......
~ w 0... 0 0.50
..
-- -- - ----------------------
25
JEFFERSON
GREYHOUND AND AMERICAN
IOWA COACHES, MIDWEST COACHES MISSOURI TRANSIT, AND SCENIC HAWKEYE
o.oo..__ _ _._ ______ ..__ _____ _._ _____ --J
1976 1977 1978 1979
YEAR
Fig. 3.2. Operating expense trends for carrier groups.

2.00
l. 50
w 1.00 :::::> z w > w ~
(.!)
z ....... f-
~ ::e 0.50 0
1976
26
IOWA COACHES, MIDWEST COACHES, MISSOURI TRANSIT, AND SCENIC HAWKEYE
1977 YEAR
1978 1979
Fig. 3.3. Operating revenue trends for carrier groups.

27
Table 3.2. Unit operating expenses for total system.
Yearly Expenses Per Bus-Mile (Dollars)
Percent Change Carrier 1976 1977 1978 1979 1976 to 1979
Greyhound 1.21 1.23 1.36 1.51 24
American 0.99 1.08 1.23 1.37 38
Jefferson 1.13 1.23 1.38 1.63 44
Iowa Coaches 0. 77 0.81 0.90 1.03 34
Midwest Coaches 0.87 0.91 1.01 1.09 25
Missouri Transit 0.69 0.77 0.87 0.92 33
Scenic Hawkeye o. 72 0.81 0.92 0.95 32
Inter-City Airport 0.76 0.81 1.00 1.07 41
Reid Bus Lines 0.38 0.38 0.41 ·0.41 8
River Trails 0.38 0.83 1.09 1.16 40a
a The percentage change for River Trails used 1977 as a base.

28
of unit costs and Table 3.3 provides unit revenues from all sources.
The ICC Class I carriers exhibit costs substantially higher than the
Class II and III carriers ($1.50 compared to $0.95 for 1979). The Reid
Bus Line operation is a major outlier in the latter group, lowering
the unweighted average nearly 10 cents per mile. Similar trends occur
for the revenue data.
One can also note that the percentage increase in revenue and
expenses for the individual carriers averages approximately 33%, but
there was a wide range in the increases experienced by individual
carriers. To put these increases in perspective, the Consumer Price
Index increased from 170.5 in 1976 to 217.7 in 1979, an increase of
27.7% [21].
As seen in Fig. 3.2, the most dramatic change was the cost in
crease for Jefferson Lines. The 44% increase in unit cost changed the
operating expenses in the four-year period from a point that was 7%
lower than their closest competitor to a point 8% above that competitor.
Other carriers experiencing large cost increases were the small Class
II carriers, Inter-City and River Trails.
Revenue Data by Service Type
The profit margin for charter operations is usually greater than
the profit margin for regular route service because ticketing and
stationing costs are reduced. Unfortunately, it was not possible to
assign costs to the different service types, but the unit revenue-gener
ating rates were analyzed. Complete tables showing passenger revenue
per regular route-mile, express revenue per regular route-mile, and char
ter revenue per charter-mile are presented in Appendix A. A combined

29
Table 3.3. Unit operating revenues for total system.
Yearly Operating Revenue Per Bus-Mile
(Dollars) Percent Change
Carrier 1976 1977 1978 1979 1976 to 1979
Greyhound 1.25 1.28 1.41 1. 61 29
American 0.98 1.11 1.20 1. 30 33
Jefferson 1.32 1.36 1.44 1. 74 32·
Iowa Coaches 0.82 0.89 0.93 1. 09 33
Midwest Coaches 0.88 0.96 1.03 1.14 29
Missouri Transit 0.67 0.70 0.79 0.90 34
Scenic Hawkeye . 0. 74 0.82 0.90 1.02 38
Inter-City Airport 0.75 0.82 1.02 1.10 47
Reid Bus Lines 0.43 0.47 0.50 0.47 9
River Trails 0.44 1. 02 1.22 1.29 26a
a The percentage change for River Trails used 1977 as a base.

30
sUmmary for 1979 is given in Table 3.4. The revenue picture clearly
shows that for the smaller carriers, the charter potential is greater.
However, for the long-haul carrier, the regular route service does
nearly as well or better than charter operations.
Revenue Data by Route
The variations in average revenue potential for the different
sized carriers is apparent. In addition, the variation between corri
dors served by the same carrier can be substantial. Table 3.5 shows
the differences in load factors and passenger revenue on selected
routes of a single carrier. The passenger revenues per bus-mile vary
by nearly a 3 to 1 ratio. The passenger demand models in 'Section 5
attempt to explain these variations.
Cost Items by Category
Detailed cost analyses are presented in Section 6; the general
categories of operating costs are presented here. Table 3.6 shows the
4,000-series items of the ICC reports, plus a column combining other
factors considered as operating expense but not summarized specifically
in the Iowa summary 'sheets. Depreciation, and operating taxes and
licenses constitute the major portion of the latter group. There are
wide variations in the carrier cost components, but some consistencies
exist if the carriers are identified by group. The carrier group pre
viously identified as secondary Class II and III carriers exhibits a
range of values that does not fit the pattern of the larger carriers.
The variance between these groups of carriers can be attributed either
to reporting differences from year to year or to actual differences.
These carriers generally confounded the interpretations that might be

31
Table 3.4. Unit revenues for regular route and charter services.
Carrier
Greyhound
American
Jefferson
Iowa Coaches
Midwest Coaches
Missouri Transit
Scenic Hawkeye
Inter-City Airport
Reid Bus Lines
River Trails
1979 Regular Route Revenue Per Regular Route-Mile
(Dollars)
1. 61
1.25
1.84
1.04
1.12
0.87
0.70
a
0.48
0.55
1979 Charter Revenue Per Charter-Mile
(Dollars)
1.43
1.41
1.50
1.10
1.22
1. 01
1. 31
b
b
1.30
aLocal service and intercity miles cannot be separated.
bNo charter operations are performed.

32
Table 3.5. 1979 revenue characteristics of selected short-haul Greyhound routes in Iowa.
Route
A
B
c
D
E
Average Passenger
Load
11.5
15.6
6.6
14.7
9.2
Passenger Revenue Per
Passenger-Mile (Dollars Per
Passenger-Mile)
0.073
0.075
0.064
0.078
0.082
Passenger Revenue Per
Bus-Mile (Dollars Per
Bus-Mile)
0.847
1.175
0.425
1.430
0.756
Operating Expense Per
Bus-Mile (Dollars Per
Bus-Mile)a
1.51
1. 51
1.51
1.51
1.51
aOperating expense represents only the systemwide average for 1979 and is not an estimate of the expenses on these specific runs.
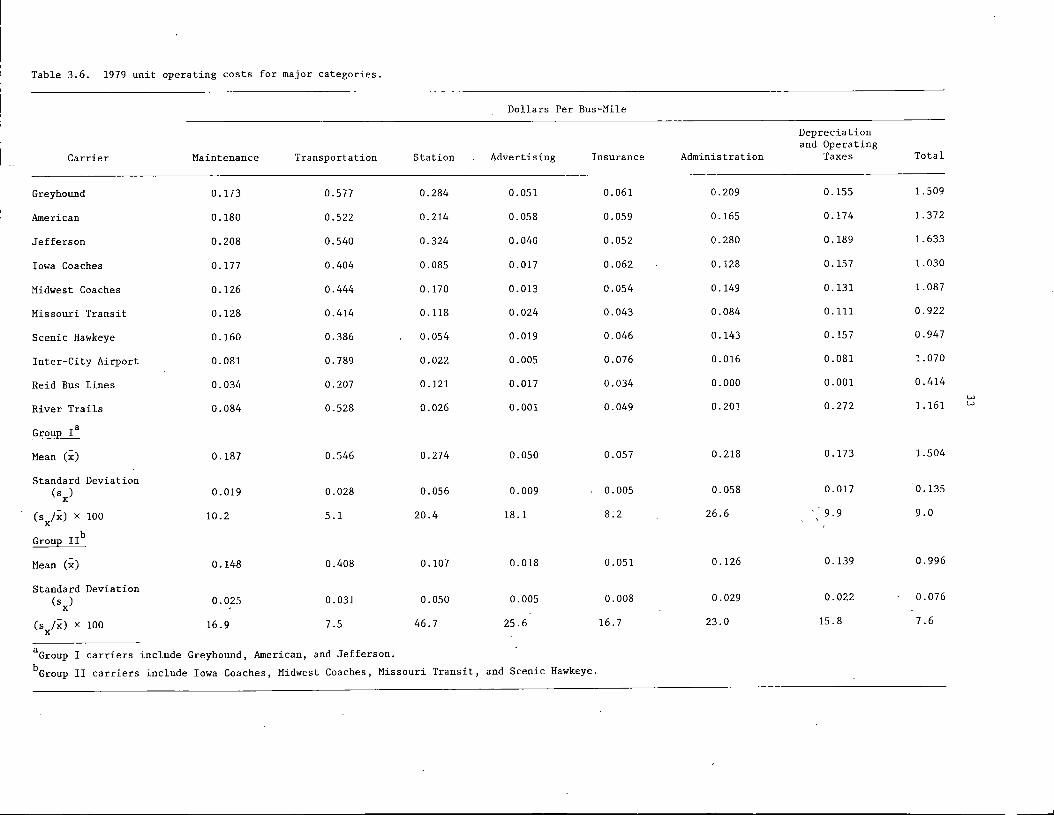
Table 3.6. 1979 unit operating costs for major categories.
Dollars Per Bus-Mile
Depreciation and Operating
Carrier Maintenance Transportation Station Advertising Insurance Administration Taxes Total
Greyhound 0.173 0.577 0.284 0.051 0.061 0.209 0.155 1.509
American 0.180 0.522 0.214 0.058 0.059 0.165 0.174 1.372
Jefferson 0.208 0.540 0.324 0.040 0.052 0.280 0.189 1.633
Iowa Coaches 0.177 0.404 0.085 0.017 0.062 0.128 0.157 1.030
Midwest Coaches 0.126 0.444 0.170 0.013 0.054 0 .149 0.131 1.087
Missouri Transit 0.128 0.414 0.118 0.024 0.043 0.084 0. 111 0.922
Scenic Hawkeye 0.160 0.386 0.054 0.019 0.046 0.143 0.157 0.947
Inter-City Airport 0.081 0.789 0.022 0.005 0.076 0.016 0.081 1.070
Reid Bus Lines 0.034 0.207 0 .121 0.017 0.034 0.000 0.001 0.414 w
River Trails 0.084 0.528 0.026 0.001 0.049 0.201 0.272 1.161 w
GrouE Ia
Mean (x) 0.187 0.546 0.274 0.050 0.057 0.218 0.173 1.504
Standard Deviation Cs) 0.019 0.028 0.056 0.009 0.005 0.058 0.017 0.135
(s /x) x 100 10.2 5.1 20.4 18.1 8:2 26.6 ·,· 9 .9 9.0 x
GrouE II b
Mean (x) 0.148 0.408 0.107 0.018 0.051 0 .126 0.139 0.996
Standard Deviation (sx) 0.025 0.031 0.050 0.005 0.008 0.029 0.022 0.076
Cs /x) x 100 16.9 7.5 46.7 25.6 16.7 23.0 15.8 7.6 x
a Group I carriers include Greyhound, American, and Jefferson. b Group II carriers include Iowa Coaches, Midwest Coaches, Missouri Transit, and Scenic Hawkeye.

34
made for the remainder of the intercity bus industry and, therefore,
were not included in model development.
Jefferson and the two national carriers share comparable cost
patterns, and the remaining four carriers are generally similar. The
table displays the means (x), standard deviations (s ), and the ratio of x
these measures, expressed as a percentage. Using a one-way analysis of
variance statistical model, the differences in costs between groups for
maintenance, insurance, and the depreciation and operating taxes were
found not to be significant (a= 0.05). However, for each of these
categories, the three Class I carriers have the highest cost. The
Class I carriers clearly have larger unit costs for transportation,
stations, advertising and administration.
The ratio of the standard devtation to the mean is useful for
selecting factors to estimate cost. The smaller the ratio, the more
stable the cost component for the carriers. This concept is used in
Section 6 to select representative cost components.
Financial Condition of Carriers
The financial viability of the carrier is determined by the car-
rier's ability to generate sufficient revenues to meet expenses and
develop a return on the investment. The standard evaluation factor for
passenger and freight motor carriers has been the operating ratio.
This is the ratio of operating expenses to operating revenue, ex-
pressed as a percentage. A carrier must have a ratio of less than 100
to meet expenses. In a regulatory environment, the ratio is monitored
so that it is neither so low that excessive profits are attained nor

35
so high that the carrier cannot achieve a reasonable profit. An appro
priate operating ratio becomes a policy issue in regulation. The Iowa
Transportation Regulation Board (TRB) currently views a ratio of 93.25
to be an acceptable level for rate-making decisions.
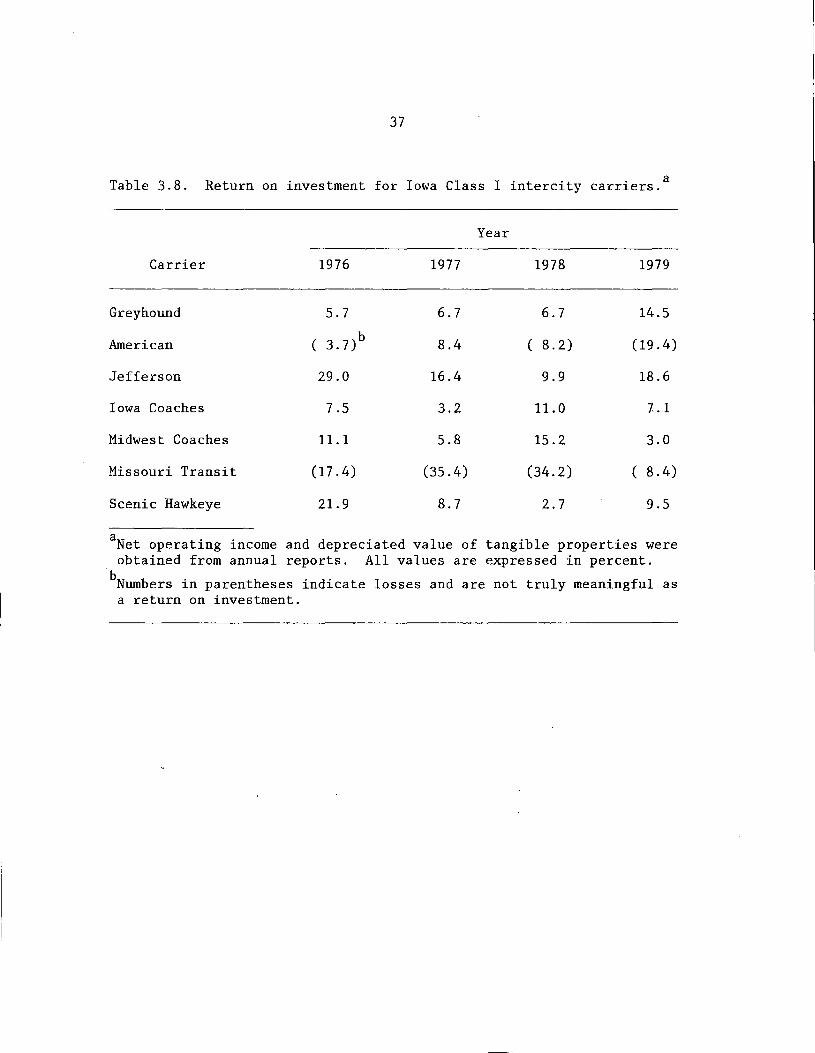
A second measure of financial strength is the rate of return on
the investment. This is the ratio of net operating income to the total
tangible assets, expressed as a percentage. This value may be compared
with the rate of return that could be obtained from other investments.
Tables 3.7 and 3.8 depict the trends in operating ratios and
re~urn on investment, respectively. The total system operating ratios
indicate that American and Missouri Transit have consistently shown
operating expenses exceeding the revenues. The other carriers have
ratios above 90%. But in 1979, a year generally considered a strong
year for intercity buses, only one carrier had an operating ratio
better than the 93.25 cutoff considered by the regulation board.
The condition is even more critical if one examines the operating
ratio of the Iowa portion only. In this case, no operator for whom a
ratio could be computed was able to meet operating expenses in 1979.
The Iowa ratio is subject to greater manipulation by the manner in
which the costs are allocated to the Iowa operation. Even so, the
carriers, planners, and regulators need to address the reasons for
these conditions in order to assess the long-term impact of this defi
cit relationship.
The data in Table 3.8 paint the same picture, but with a different
brush. Two carriers are regularly operating at a loss. The returns for

Table 3.7. Operating ratios for Iowa Class I intercity carriers.
1976 1977 1978 1979
Total Total Total Total Carrier Iowa System Iowa System Iowa System Iowa System
Greyhound 107.4 97.3 105.3 96.6 105.9 96. 7 100.8 93.7
American a 101.2 97.4 102. 7 105.8
Jefferson 86.0 85.4 90.5 90.5 95.2 95.2 101.3 93.9
Iowa Coaches 93.7 91.0 97.3 94.2
Midwest Coaches 98.6 94.5 97.6 95.0 w
"' Missouri Transit 102.5 108.9 110.6 104.2
Scenic Hawkeye 107 .3 96.3 115.3 98.9 112.5b 96.7 106.lb 92.9
aiowa ratios could not be computed for several carriers because of their method of reporting.
bComputed by the Engineering Research Institute. The reporting procedure changed in 1978, but calculations were based on cost allocation procedures previously used by the company.
37
Table 3.8. Return on investment for Iowa Class I intercity carriers.a
Year
Carrier 1976 1977 1978 1979
Greyhound 5.7 6.7 6.7 14.5
American ( 3.7)b 8.4 ( 8.2) (19.4)
Jefferson 29.0 16.4 9.9 18.6
Iowa Coaches 7.5 3.2 11.0 l.l
Midwest Coaches 11. 1 5.8 15.2 3.0
Missouri Transit (17.4) (35.4) (34.2) ( 8.4)
Scenic Hawkeye 21. 9 8.7 2.7 9.5
aNet operating income and depreciated value of tangible properties were obtained from annual reports. All values are expressed in percent.
bNumbers in parentheses indicate losses and are not truly meaningful as a return on investment.

38
the other carriers have varied widely. Only Jefferson Lines has consis
tently shown returns at or above the opportunity rates generally obtained
from other low-risk investments in current money markets.

39
4. COMMUTER CARRIERS
The predominance of the private automobile for traveling has
created traffic congestion, fuel shortages, shortages of parking facil
ities, and greater noise and air pollution. These conditions, combined
with the energy shortages in the winter of 1973-1974, gave impetus to
the national concern for more efficient use of energy resources and, in
particular, to promotion of car pools and other higher occupancy modes
of travel, such as buses or vans.
The commuter bus service is one of the modes that has: been pro
moted and developed in Iowa to reduce gasoline consumption. This
service is tailored to serve travelers who use the bus on a regular
basis, usually for daily trips to and from work. Several services have
been organized in and around Iowa urban areas to ·serve groups of people
whose travel needs apparently are not being served adequately by either
conventional mass transportation services or the private automobile.
Because of the unique nature of the commuter operations, they can
not be analyzed directly with other regular route common carriers. In
deed, because these operations are fairly new, special surveys were
necessary to obtain background data. The service data reflect opera
tions reported in annual reports and/or in special surveys covering the
first six months of 1980. This section reviews general cost and operat
ing charact~ristics for this group of carriers and examines the carriers
in relation to standard intercity bus operations. More details of the
commuter operations are presented by Hamad [22).
ways:
40
Providers and Types of Service
Commuter bus services in Iowa have been initiated in two different
l. The private operator initiated the service after the need
was established by consulting with employers and/or employees
through interviews and surveys.
2. The service was started following recommendations based on
studies conducted by the Department of Transportation or
other government agencies.
The providers of commuter bus services in Iowa include carriers
of different sizes and different fields of operations. They can be
grouped as follows:
• Group 1: Iowa Class I car.riers, whose main operation is the
regularly scheduled bus service. This group includes two main
carriers: Jefferson Lines and Scenic Hawkeye Stage Lines.
e Group 2: Iowa Class II carriers, which provide charter bus
service and school bus service in addition to their commuter
operations. This category includes Midwest Transportation Com
pany only.
• Group 3: Class II carriers, whose primary operation is the com
muter bus service. The survival of these operators is thus based
on the success and continuation of the commuter bus service.
This group includes Industrial Transportation, Brothers Bus Com
pany, Arnold Henn, Guttenberg Coach Lines, and Best Cab.
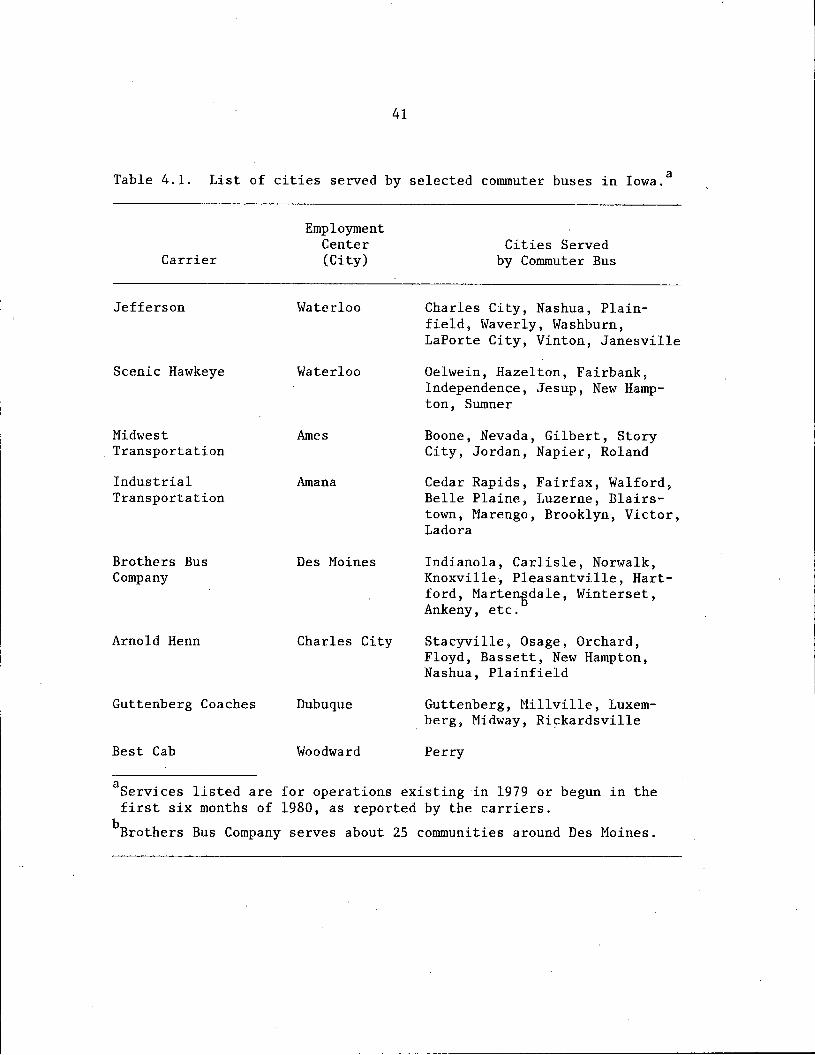
The cities served by these carriers are identified in Table 4.1.
41
Table 4.1. List of cities served by selected commuter buses in Iowa.a
Carrier
Jefferson
Scenic Hawkeye
Midwest Transportation
Industrial Transportation
Brothers Bus Company
Arnold Henn
Guttenberg Coaches
Best Cab
Employment Center (City)
Waterloo
Waterloo
Ames
Amana
Des Moines
Charles City
Dubuque
Woodward
Cities Served by Commuter Bus
Charles City, Nashua, Plainfield, Waverly, Washburn, LaPorte City, Vinton, Janesville
Oelwein, Hazelton, Fairbank, Independence, Jesup, New Hampton, Sumner
Boone, Nevada, Gilbert, Story City, Jordan, Napier, Roland
Cedar Rapids, Fairfax, Walford, Belle Plaine, Luzerne, Blairstown, Marengo, Brooklyn, Victor, Ladora
Indianola, Carlisle, Norwalk, Knoxville, Pleasantville, Hartford, Marte~dale, Winterset, Ankeny, etc.
Stacyville, Osage, Orchard, Floyd, Bassett, New Hampton, Nashua, Plainfield
Guttenberg, Millville, Luxemberg, Midway, Rickardsville
Perry
aServices listed are for operations existing in 1979 or begun in the first six months of 1980, as reported by the carriers.
b Brothers Bus Company serves about 25 communities around Des Moines.

42
The services offered can be classified in two ways. The first is
a bus service along a regular certificated route, as in the case of
the Jefferson commuter bus service. Before initiating the commuter
service in the Waterloo area, Jefferson operated a regularly scheduled
bus in the same corridor where their commuter service was offered. The
carrier needed only to add more runs and additional stops along that
route to meet the needs of the commuters at the John Deere Plant.
The second type of service, which represents the majority of the
commuter bus operations, is a bus service along a special route. The
carrier in this case had to acquire a certificate from the Transporta
tion Regulation Board to initiate the service, unless it already pos
sessed operating authority in that corridor, as in Scenic Hawkeye's
case. Both types of operations serve commuters whose work trips gener
ally range between 10 and 40 miles one-way. The commuter bus service
appears to be acceptable for relatively longer trips because the fare
per mile decreases with increasing distance, and excess travel time is
a small fraction of the total trip time. The commuter carrier service
is also viewed more favorably than the regular route service because
the latter is less likely to be available for long trips at service
levels comparable to the commuter bus service.
Almost all of these services are offered five days a week with
three to eight round trips per day. Several commuter services meet the
requirements of day and night shifts. However, most of the trips are
offered in the morning and afternoon peak hours.

43
Service Characteristics
Commuter operators are generally providing lower-cost service than
are regular route intercity carriers. This lower cost can be clearly
understood by looking at some of the characteristics of the commuter
bus service. A detailed description of the factors that have a sig
nificant impact on the reduction of the service cost will be presented
here.
Drivers
Commuter operators usually employ part-time, nonunion drivers. A
common arrangement is to select a driver from the riders using the
service. A driver's wages may be a free ride to and from work or the
free ride plus a daily fixed amount. This procedure is used when the
bus is scheduled to rotate with the work shifts,_ thus eliminating the
need to pay layover time or split-shift premium pay that would be
incurred if the drivers were employees of the carrier. Two companies
using this arrangement pay approximately $10 per day to their drivers.
In other cases, the drivers are carrier employees. However, the
drivers are not eligible for company benefits and they receive a lower
rate pe,r mile or a lower hourly rate than full-time employees of the
regular route carriers. For example, Jefferson Line commuter run oper
ators earn approximately 80% of the rate earned by full-time employees.
In another case, an hourly pay schedule was used in which minimum wage
law rates were paid.
One carrier currently shows no expense for drivers because the
owner is also the driver and no charges were assessed for these services.
44
This carrier has been operating for seven months only and is likely to
change that practice after the company is established.
Vehicles
The majority of the vehicles used in commuter services are buses
with average capacities that range from 36 to 43 seats (Table 4.2).
Best Cab is the only company using a van with 12 seats.· Most of the
buses are older (10 years or more), low-cost vehicles; a few of them are
fully depreciated.
The condition of the vehicles used, which is usually reflected by
the price, has a great influence on the cost. The vehicles used in
Iowa range in price from $1,000 to almost $30,000. The annual rate of
depreciation of these vehicles varies from 10 to 33%. Often the older
buses are depreciated over three to five years and the newer buses over
five to ten years. The fact that Scenic Hawkeye buses were fully depre
ciated when placed into the commuter service would help in reducing
total operating expenses, since no depreciation cost is added.
Most vehicles in commuter operation are owned by the carrier,
although some are leased. A recent study [23] has shown. that the cost
of services provided with vehicles obtained under contract is likely to
be substantially higher than the cost of services provided with vehicles
owned by the operator. It must be noted, however, that the purchase of
equipment with moneys on which interest rates are 14% and higher can
substantially increase the per mile cost of equipment for commuter oper
ators, particularly since the number of miles of service is low.
Intercity regular route carriers usually have their own mechanics
and garages, and thus maintain their own vehicles. All commuter bus
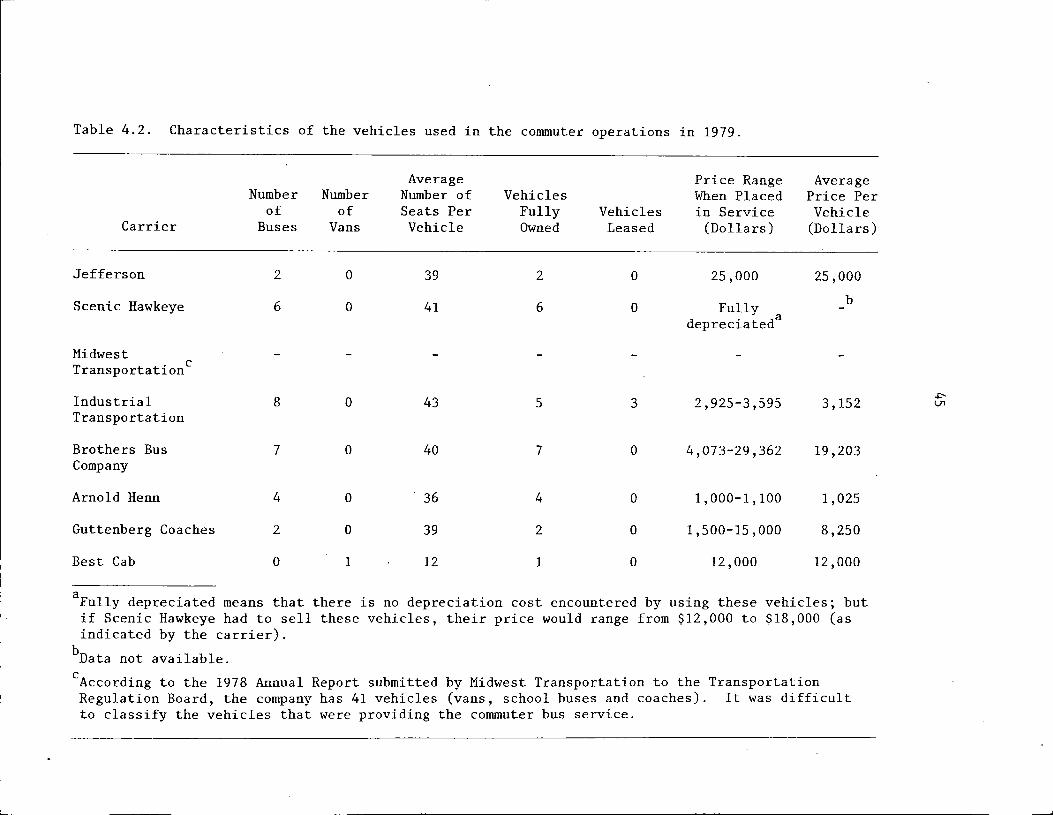
Table 4.2. Characteristics of the vehicles used in the commuter operations in 1979.
Carrier
Jefferson
Scenic Hawkeye
Midwest T . c ransportation
Industrial Transportation
Brothers Bus Company
Arnold Henn
Guttenberg Coaches
Best Cab
Number of
Buses
2
6
8
7
4
2
0
Number of
Vans
0
0
0
0
0
0
1
Average Number of Seats Per Vehicle
39
41
43
40
36
39
12
Vehicles Fully Owned
2
6
5
7
4
2
1
Vehicles Leased
0
0
3
0
0
0
0
Price Range When Placed in Service
(Dollars)
25,000
Fully depreciateda
2,925-3,595
4,073-29,362
1,000-1,100
1,500-15,000
12,000
Average Price Per Vehicle
(Dollars)
25,000
b
3,152
19,203
1,025
8,250
12,000
aFully depreciated means that there is no depreciation cost encountered by using these vehicles; but if Scenic Hawkeye had to sell these vehicles, their price would range from $12,000 to $18,000 (as indicated by the carrier).
bData not available.
cAccording to the 1978 Annual Report submitted by Midwest Transportation to the Transportation Regulation Board, the company has 41 vehicles (vans, school buses and coaches). It was difficult to classify the vehicles that were providing the commuter bus service.

46
service providers, except Jefferson and Scenic Hawkeye, which have more
extensive regular route service, and Midwest Transportation, which also
has a large school bus fleet, maintain their vehicles at private garages,
which may result in high maintenance costs when problems are encountered.
Industrial Transportation had its own maintenance shop for a short pe
riod, then the management determined it was not feasible for a small
carrier to absorb the cost of operating a maintenance facility.
Dead-Head Mileage and Station Cost
Dead-head mileage is nonproductive mileage that increases cost.
The costs incurred due to dead-heading are usually passed on to the
customer. This problem can become particularly severe for shorter
trips. Among the four carriers that submitted the requested informa
tion (Scenic Hawkeye, Jefferson, Guttenberg Coaches, and Best Cab),
Scenic Hawkeye is the only carrier that incurr~d dead-head mileage in
its operation. The dead-head mileage was estimated to be 160 miles
weekly. This represented 4.4% of their total weekly commuter mileage.
In most cases, dead-head mileage was avoided by keeping the buses parked
at the work place or at the central office after work.
The station cost for commuter bus services is substantially less
than that experienced by the intercity regular route service. In some
cases_, station cost for commuter carriers was zero. The need for a
station was.minimized because of the following:
• Riders were picked up from locations close to their residences
along the bus route.
o Buses were parked at the users' place of work or at the driver's
home.

47
• Drivers also acted as ticket agents to sell passes, collect
fares, keep ridership records, and other activities.
Reducing terminal ·services also reduces the operating costs. The
station expenses represent approximately 10% of the operating cost for
regular route carriers.
Load Factors
The fare charged per passenger trip depends on both the vehicle
trip costs and the average nwnber of passengers per bus (load factor).
Higher bus occupancy figures will lower per-passenger trip costs and
make it possible to cover costs with lower fares. Table 4.3 shows that
the occupancy rates on commuter buses ranged between 61 and 92%. These
load factors are considered good compared with other bus operations.
Table 3.5 showed five routes where the occupancy rates ranged from 15
to 25%. The higher commuter occupancy rates are made possible by
scheduling buses mostly during peak periods to attract a large nwnber
of users. The use of weekly and monthly passes helps to guarantee a
fixed nwnber of riders for a specified period, which tends to keep the
daily load factors equal.
Fares
The effect of the various service characteristics discussed in
this section can be seen easily by examining the average per-mile fares
charged by the commuter carriers as indicated in Table 4.4. As expected,
the fare per mile decreases with trip length. Arnold Henn has the
lowest fares, ranging from 3.1 to 4.3 cents per mile. The low fares
are possible because no wages are paid to the drivers, vehicle deprecia
tion is low, and the station cost is zero. The highest fare per mile

48
Table 4.3. Load factors on commuter services for the first six months of 1980.
Average Average Bus Load Number of Seating Factor
Carrier Riders Per Bus Capacity (Percent)
Jefferson 27 39 69
Scenic Hawkeye 34a 41 83
Midwest Transportation b
Industrial Transportation 43
Brothers Bus Company 40
Arnold Henn 22 36 61
Guttenberg Coaches 27 39 69
Best Cab 11 12 92
aThis estimate was based on the daily ridership data for February and May of 1980.
bData not available.

49
Table 4.4. Average fare per mile for the commuter bus service.
Distance (Miles)
Carrier 0-9 10-19 20-29 30-39 40-49
Jefferson 10.0a 6.7 6.9 5.9 6.2
Scenic Hawkeye 8.0 5.7 3.7
Midwest Transportation 9.2 5.3
Industrial Transportation 9.8 7.4 5.2 4.6
Brothers Bus Company 9.3 6.9 5.2
Arnold Henn 4.3 4.0 3.1
Guttenberg Coaches 8.3 6.5 4.9
Best Cab 10.4
a All values are expressed in cents per mile.

50
(10.4 cents per mile) was experienced by the smallest carrier, Best
Cab. Its operations consist of three round trips per day on a 12-mile
route. The difference between the rates of Jefferson and Scenic Hawkeye
can be explained by the difference in the vehicles used and drivers'
wages. Scenic Hawkeye had fully depreciated commuter buses and paid
their drivers $9.50 per round trip, which ?mounts to about 12 cents per
mile. Jefferson Lines valued its two buses at $50,000 and paid their
drivers 25 cents per mile.
Table 4.5 indicates the average fares per mile for the regular
route intercity operations of two carriers. As one would expect, the
fares for the intercity operation are much higher than those of the
commuter services. Labor rules and type of vehicles used for the
intercity operations play an important role in this difference. The
use of full-time union drivers with higher wages and associated bene
fits and the use of newer, more expensive vehicles add significantly to
the operating costs of the service. Moreover, station cost is more
substantial for the regular intercity carriers. These variations in
costs can be seen easily by comparing the rates that Scenic Hawkeye
charges on its intercity and commuter operations. According to Tables
4.4 and 4.5, Scenic Hawkeye's rates for intercity operations are be
tween 36% and 146% higher than those charged for commuter operations of
the same trip length. The differences in rates are as follows:
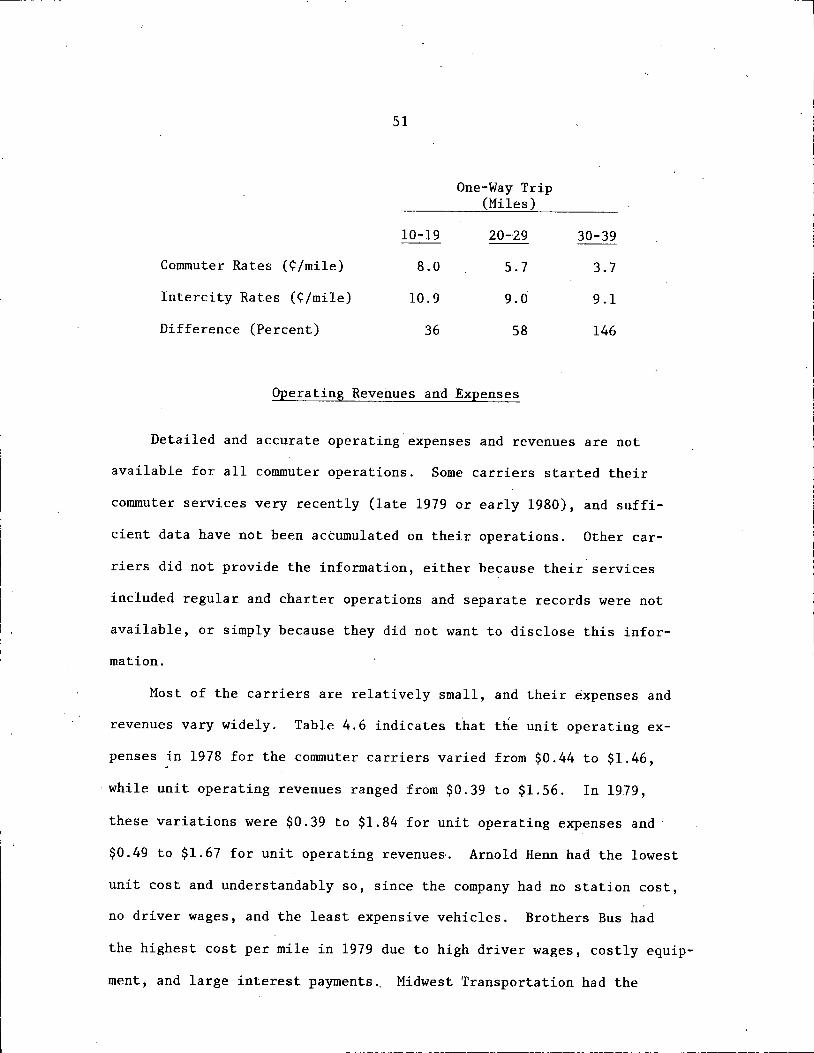
51
One-Way Trip (Miles)
10-19 20-29 30-39
Commuter Rates (¢/mile) 8.0 5.7 3.7
Intercity Rates (¢/mile) 10.9 9.0 9.1
Difference (Percent) 36 58 146
Operating Revenues and Expenses
Detailed and accurate operating expenses and revenues are not
available for all commuter operations. Some carriers started their
commuter services very recently (late 1979 or early 1980), and suffi-
cient data have not been accumulated on their operations. Other car-
riers did not provide the information, either because their services
included regular and charter operations and separate records were not
available, or simply because they did not want to disclose this infor-
mat ion.
Most of the carriers are relatively small, and their expenses and
revenues vary widely. Table 4.6 indicates that the unit operating ex-
penses in 1978 for the commuter carriers varied from $0.44 to $1.46,
·while unit operating revenues ranged from $0.39 to $1.56. In 1979,
these variations were $0.39 to $1.84 for unit operating expenses and
$0.49 to $1.67 for unit operating revenues·. Arnold Henn had the lowest
unit cost and understandably so, since the company had no station cost,
no driver wages, and the least expensive vehicles. Brothers Bus had
the highest cost per mile in 1979 due to high driver wages, costly equip-
ment, and large interest payments.. Midwest Transportation had the

52
Table 4.5. Average fare per mile for selected intercity carriers.
Distance (Miles)
Carrier 0-9 10-19 20-29 30-39 40-49
Greyhound 29.0a 14.6 12.1 11. 4 11. 4
Scenic Hawkeye 18.1 10. 9 9.0 9.1 9.2
aAll values are expressed in cents per mile.

'· .....
Table 4.6. Unit operating expenses and revenues for the commuter bus service.a
1978 1979
Operating Operating Operating Operating Expenses Expenses Expenses Expenses
(Excluding (Including Operating (Excluding (Including Operating Depreciation Depreciation Revenue Depreciation Depreciation Revenue
and Taxes) and Taxes) Per and Taxes) and Taxes) Per Carrier Per Bus-Mile Per Bus-Mile Bus-Mile Per Bus-Mile Per Bus-Mile Bus-Mile
Jefferson
Scenic Hawkeye NA NA NA NA NA 0.83b
Midwest 1. 21 1.46 1.56 NA NA NA (J1
w Transportation
Industrial Transportation 0.54 0.58 0.89 0.69 0. 71 0. 77
Brothers Bus Company 0.87 1.02 1.01 1.58 1.84 1.67
Arnold Henn 0.41 0.44 0.39 0.38 0.39 0.46
Guttenberg 0.84b l.06b 0.49b Coaches
Best Cab 0.58b 0.7Sb 0.56b
aValues shown with a dash indicate the carrier was not in operation. Values shown with NA indicate the data were not available.
bAn estimated value provided by the carrier.

54
highest unit cost in 1978, but this cost is not purely for the commu
ter operations, since the largest portion of the carrier's operations
is charter service.
One would usually expect that the operators of small-scale commu-
ter carriers can provide a service at a lower cost than can regular inter
city carriers. A comparison of the unit costs in Table 4.7 with those
of the intercity carriers in the previous section (Table 3.6) shows
that this is not always true. Midwest Transportation had a unit cost
in 1978 of $1.46, which is higher than those of all other carriers,
including the regular route carriers. (Unfortunately this value does
not represent the commuter cost. No meaningful data were provided by
the carrier in 1979 or 1980 when the commuter services were more exten
sive.) In 1979, Brothers Bus had the highest unit cost of $1.84. These
high unit costs do not represent the costs of the majority of the com
muter services. They are due to special characteristics of the two re
spective operations.
Some carriers show operating expenses higher than their revenues,
and consequently no profit is made. In most cases, this is due to the
fact that the carriers had started their operation in that same year.
Usually one would anticipate additional initial expenses, referred to
as start-up costs. These include permits, licenses, market studies,
etc. These expenses will affect the cost of operation in the first
year, but their influence will be minimal in subsequent years. In the
case of Brothers Bus, the loss was due to high driver wages and costly
equipment that generated relatively high depreciation costs. It is
important here to note the way in which the equipment was obtained.
I
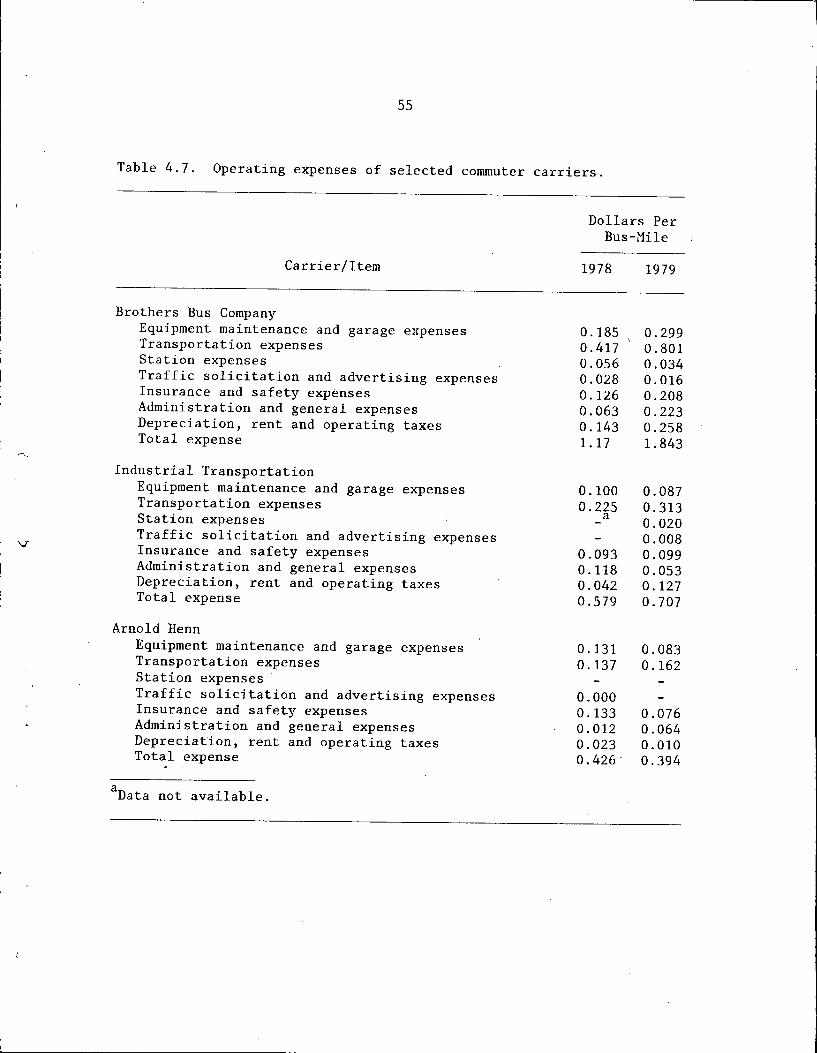
55
Table 4.7. Operating expenses of selected commuter carriers.
Carrier/Item
Brothers Bus Company Equipment maintenance and garage expenses Transportation expenses Station expenses Traffic solicitation and advertising expenses Insurance and safety expenses Administration and general expenses Depreciation, rent and operating taxes Total expense
Industrial Transportation Equipment maintenance and garage expenses Transportation expenses Station expenses Traffic solicitation and advertising expenses Insurance and safety expenses Administration and general expenses Depreciation, rent and operating taxes Total expense
Arnold Henn Equipment maintenance and garage expenses Transportation expenses Station expenses Traffic solicitation and advertising expenses Insurance and safety expenses Administration and general expenses Depreciation, rent and operating taxes Total expense
aData not available.
Dollars Per Bus-Mile
1978
0.185 0.417 0.056 0.028 0.126 0.063 0.143 1. 17
0.100 0.225
a
0.093 0.118 0.042 0.579
0.131 0.137
0.000 0.133 0.012 0.023 0.426-
1979
0.299 0.801 0.034 0.016 0.208 0.223 0.258 1.843
0.087 0.313 0.020 0.008 0.099 0.053 0.127 0.707
0.083 0.162
0.076 0.064 0.010 0.394

56
During fiscal year 1978, the company paid $1,045 for interest on loans.
The interest was included in administration expense, which was still
reasonable ($0.063 per mile). In fiscal year 1979, the company pur
chased equipment with loans totaling $109,000 and the interest payments
increased to $10,231. This raised the administration cost to $0.223 per
mile, which is nearly four times the administration cost experienced by
Industrial Transportation and Arnold Henn.
One thing that is interesting to note is the ability of the carrier
to manipulate its operating expenses. Most of the owners of the commuter
carriers are employees of their own company. They could be drivers,
bookkeepers, managers, or a combination of these. If outside personnel
were hired to do these jobs, the result would be an increase in the
operating expenses. Instead, many owners perform these jobs and do not
charge the company any wages if the company is not making enough profit.
In other situations, a salary may be charged for these services. For
example, the owner of Guttenberg Coaches drives the bus and with the
help of his wife handles all administrative responsibilities, yet he
does not charge the carrier. The owner of Industrial Transportation
charged_ the company a salary in 1978, when revenues were high; when
revenues went down in 1979, no wages were charged for general officers.
The manipulation of the operating expenses in this fashion will enable
commuter operators to keep costs down. However, this does not reflect
the true cost of the commuter service.

I I
57
Summary
Although commuter bus services are small-scale and fairly new, the
services have proven to be an acceptable alternative to the driving alone
and carpooling modes which had been used by the subscribers of the com
muter bus for their work trips. Generally commuter operators are pro
viding lower cost service than regular route intercity service. The
reasons for this have been due to the use of part-time and nonunion
labor, low capital investment in equipment, m1nimized dead-head mileage
expense, minimal or zero station costs, and the manipulation of operat
ing expenses. Commuter carriers that varied from these general operat
ing conditions experienced costs as high or higher than other regular
route carriers.

I
I
59
5. PASSENGER AND REVENUE FORECASTING MODELS
Decisions regarding operating or financing policies need to be
made with the best possible information. Carriers, planning agencies,
and regulatory bodies would ideally base their actiohs regarding service
to communities on detailed evaluations of the effects of pricing,
service frequency, travel times, population characteristics and other
factors affecting the demand for the service. However, these relation
ships have never been clearly identified due to the complexity of the
interactions and a host of uncontrolled factors that may affect the
utilization of a community service. Even the actual demand or utiliza
tion on existing routes cannot always be clearly assigned to specific
cities or route segments within a corridor.
As discussed in Section 2, previous research efforts to model
intercity bus movements have ranged in scope from macro-level analysis
based on annual. reports of systemwide characteristics, to micro-level
models based on tri.p data between individual_ city pairs. The macro-level
analysis is useful for establishing general relationships, but the
results are not applicable for corridor analyses. The micro-level
analyses are more relevant to analysis of individual trip-making deci
sions, but have the disadvantages of being less stable and more expen
sive to develop due to the data sampling requirements. Since the focus
of this research is to examine the potential of intercity bus service
in corridors, the forecasting efforts focus on the passenger volume and
revenue potential associated with the unique characteristics within
those corridors. Classification models and linear regression tools

60
were used to examine the relationships between service and community
characteristics and demand. Conceptually, this demand could be measured
by the number of passengers, passenger revenues, express revenues,
passenger-miles, load factors or other elements relating to the inten
sity of use. Practically, the measures of demand are limited by the
adequacy of the data and the ability to assign these factors to discrete
points or route segments. Conceptually, the factors that explain
demand variations would include demographic characteristics of the
communities, socioeconomic factors and service characteristics such as
frequency, fare and quality. Practically, the demographic factors are
highly correlated with each other and often do not provide distinctly
different elements for modeling purposes. Furthermore, bus frequency,
fares per mile, and operating speed from several cities may be nearly
equal and therefore do not help explain demand variations among those
cities.
Modeling efforts were completed to identify volume variations at
the city level and the corridor level. The recommended forecasting
procedure focuses on the corridor or route analysis, but the city
analysis is also presented.
Revenue Analysis from Individual Cities
Although revenue data are reported to the regulatory bodies only
on a sy~temwide basis, the individual carriers do maintain data regard
ing income from individual ticket agents. This information is needed
to determine commissions, but can also be used for evaluating demand
variations. However, these data are not continuously compiled by all
/\.

61
the carriers and are not used regularly for the latfer purpose. As an
example of the difficulty in tabulating the data for this research, in
one case it was necessary to search 10 ledger pages to identify the
receipts from seven agents for a single month of the year. In another
case, an agent did not request payment of the commission during an
entire 12-month period. Since an objective of the research was to
develop a methodology using only data that was readily accessible to
the Department of Transportation, no additional effort was undertaken
to obtain these data from all carriers.
The revenue-generating capability from individual cities was
analyzed by comparing the sales data obtained from Greyhound and from
Scenic Hawkeye for 1979. These\revenue data are limited by several
factors, including:
1. The agents do not necessarily report sales for a full year
or a full month. An estimating procedure was necessary to
factor the sales for Scenic Hawkeye agents. The partial-
year sales were adjusted on the basis of the fraction of
the total revenues received from regular route operations \ .
<luring the reporting period, compared to the total regular
route revenues for the year.
2. The passenger revenue recorded by an agent may not represent
the total revenue obtained from passengers from a particular
city. Discussions with the manager pointed out a tendency of
some passengers to obtain a short-distance ticket from a local
agent and then obtain the continuing trip ticket at a larger
terminal. As a result, although the bus industry eventually

62
accounts for the revenue, the generating source may not appear
to be the actual origin city.
3. The revenue-generating potential from a city with more than
one carrier is incomplete because data were seldom available
from all competing carriers. The effect of a competing carrier
was analyzed as an independent variable in some analyses and
was controlled in other analyses by studying only those cities
served by i single carrier.
Passenger and express-revenues were compiled from 53 Iowa cities
served by Greyhound and 21 cities served by Scenic Hawkeye. Each carrier
was examined separately. The revenues from the cities exhibited tremen-
dous variations; statistical efforts were undertaken to explain those
variations.
Variables Considered in the Analysis
Independent Variables
The variables used to explain revenue variations f<)cused on com-
munity and supply factors. The principal community factors were city
and county populations, college enrollments, and elderly population.
Service characteristics included service frequency by carrier, presence
or absence of competitors, and service level by competitors.
Dependent Variables
Due to the large variation in city size, the revenues vary widely. i I
The standard deviation for total revenues was twice as large as the mean
value. To reduce the variance, revenue per person was also evaluated.
The variance for per capita revenues is substantially lower than for
total revenues, but even here the standard deviation was over 50% of

63
the mean value. The revenue range was from $0.10 per resident to over
$9. 00 per resident. Countywide rate data and logarithmic transforma··
tions were also examined, but these did not aid the analyses.
~~ression Models
Regression models were developed for total passenger revenue. On
first examination these appeared to be strong models. Over 90% of the
variation could be explained (R2 = 0.92), and the variables were signif
icant at the 0.001 level. The model for cities served by Greyhound
was:
Annual passenger revenue ($) = -5760 + 5.77 (college enrollment)
+ 3.67 (city population)
Unfortunately, this model is not effective for policy planning because
service variables were not signif~cant. Furthermore, the models are
less than desirable for estimating in individual cities, because errors
of 300% and more were evident in selected cities.
Models using unit revenue data and transformed variables were also
ineffective as predictors. Hence, the efforts were ~witched to general
classification models to examine variations by grouping cities of com
parable sizes.
Classification Models for Revenue Analysis
The 53 cities served by Greyhound were classified into six popula
tion classes. The unit passenger, express and total revenue data
(dollars per 1970 city resident) are shown in Table 5.1. These data
show a tendency toward increasing revenues with increasing city size,
but no definite trend was identifiable. The variations within and
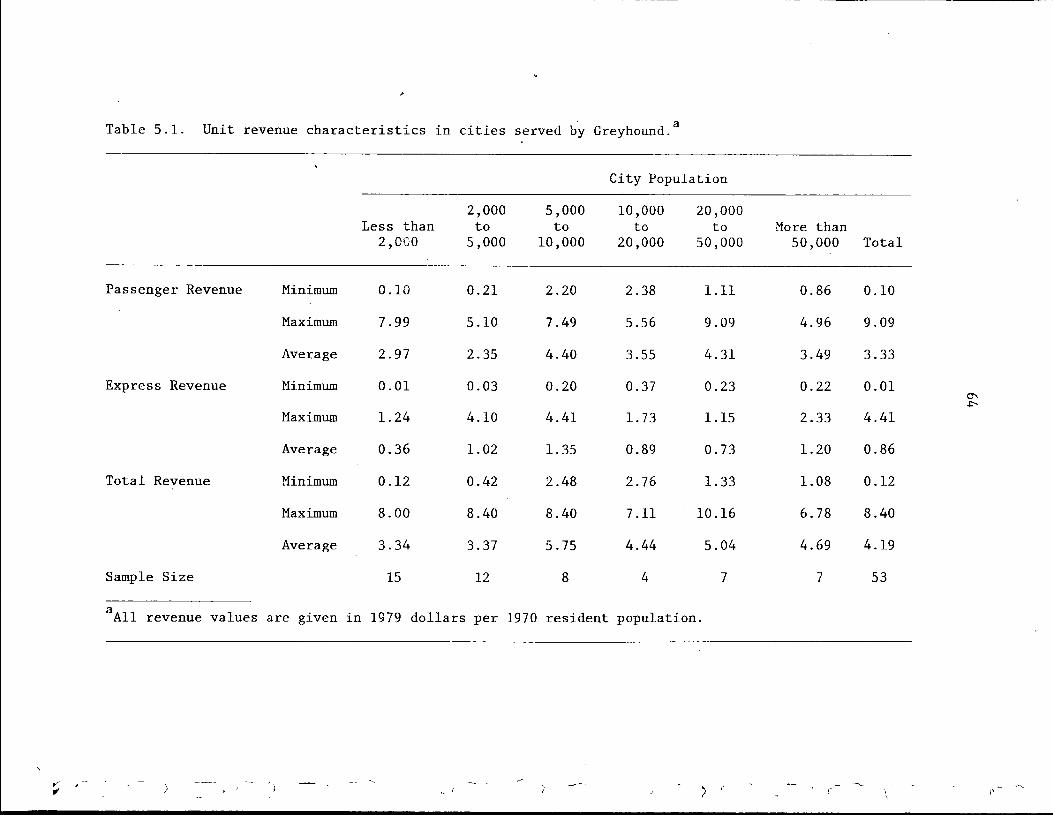
Table 5.1. Unit revenue characteristics in cities served . a
by Greyhound.
City Population
2,000 5,000 10,000 20,000 Less than to to to to More than
2,000 5,000 10,000 20,000 50,000 50,000 Total
Passenger Revenue Minimum 0.10 0.21 2.20 2.38 1.11 0.86 0.10
Maximum 7.99 5.10 7.49 5.56 9.09 4.96 9.09
Average 2.97 2.35 4.40 3.55 4.31 3.49 3.33
Express Revenue Minimum 0.01 0.03 0.20 0.37 0.23 0.22 0.01 °' .i:-.
Maximum 1.24 4.10 4.41 1. 73 1.15 2.33 4.41
Average 0.36 1.02 1.35 0.89 0.73 1.20 0.86
Total Revenue Minimum 0.12 0.42 2.48 2.76 1.33 1.08 0.12
Maximum 8.00 8.40 8.40 7 .11 10.16 6.78 8.40
Average 3.34 3.37 5.75 4.44 5.04 4.69 4.19
Sample Size 15 12 8 4 7 7 53
aAll revenue values are given in 1979 dollars per 1970 resident population.
•'I ,, > I'

I
65
between classes were examined using a one-way analysis of variance
model. This test indicated that the variation between groups was not
significantly different than the variance within each group c~ = 0.05).
The practical interpretation is that an estimate of revenue per person
in any city based on the overall average would be as good as an estimate
based on the average of the city-size group to which it belongs. For
these cities, the overall average values were $3.33 and $0.86 for pas
senger and express revenues, respectively. The range in the costs is
also shown in Table 5.1.
The possible variations created by having a competing carrier were
examined by deleting cities with competitive service. Although the av
erage values changed approximately 3%, the interpretation was the same.
Of greater concern was the variation found between the national carrier
and the regional carrier. The range of revenues per person from the
cities was comparable for both carriers, but the average rates for Scenic
Hawkeye were $1.72 and $0.77 for unit passenger and express revenues,
respectively. This most clearly demonstrates the potential differences
between long-haul and short-haul carriers. Even though the two carriers
may attract passengers equally within a community, the actual revenues
achieved may be substantially different. In many cases, the local car
rier generates revenues only from the origin to a connecting carrier
station, whereas the national carrier can more readily serve as the sin
gle source provider. This suggests that a more consistent forecasting
approach would be to examine passenger demand and then apply trip length
and fare per mile factors for the specific company being analyzed. This
approach is addressed in the corridor analyses that follow.

------------------------------------
66
Model Development for Route Analysis
The initial impetus of this study was to develop a methodology for
estimating potential revenues and costs on specific routes so that the
viability of these routes could be assessed. Route-specific cost data
are virtually nonexistent. Route-specific volume data are more readily
defined, although the data analyses are easily clouded unless the I ,_
routes in question are nearly closed-system entities. An example of a
route that is sufficiently identifiable is Iowa Coaches' operation from
Prairie du Chien, Wisconsin, to Cedar Rapids, Iowa. On the other hand,
the main Greyhound operations from Salt Lake City, Utah, to Chicago,
Illinois, are summarized only for that entire distance, thus precluding
any meaningful analysis in Iowa.
\ Through the cooperation of the carriers, it was possible to identify
passenger volumes along several Iowa routes. The variability of demand
on these routes was examined to establish a procedure for estimating
potential demand in proposed corridors.
Variables Considered in Model Development
Independent Variables
The factors considered to explain corridor travel variations in-
eluded community characteristics and intercity service characteristics.
Service factors considered included daily service frequency, fares,
fare per mile, average bus speed, distance, travel time ratios between
bus and automobile, and carrier competition in the corridor. The com- \ '
munity demographic factors considered included population of the origin
and destination cities, population in the corridor between cities,

I
67
county populations, elderly population, college enrollment, and business
employment. Various combinations and transformations of these variables
were evaluated, but only the principal factors are presented in the
following sections.
pependent Variables
The choice of dependent variables was largely constrained by the
availability of data from the carriers. Passengers, passenger-miles,
passenger revenues, and express revenues for each route were available
only from one carrier. Even in this case the measures were not all
independent because the passengers and passenger-miles were related by
a constant fare per mile factor, which was independent of the route
considered. The only measure consistently available from all carriers
was annual passenger number, so this measure was used as the primary
analysis variable. To minimize the relative variance between corridors,
the passenger variable was also evaluated on three different rate bases,
passengers per bus-mile, passengers per round trip, and passengers per
person in the service area. Only the principal models are detailed in
this report.
Routes Included in the Analysis
Eleven routes were included in the model development phase; four
additional routes were used to check the model. The routes used repre
sent services provided by Greyhound, Iowa Coaches, Jefferson Lines,
Missouri Transit, and Scenic Hawkeye. Table 5.2 lists the data abbre
viations used in the study; Table 5.3 provides the data summaries for
the 11 routes used in model development; and Table 5.4 gives the means
and standard deviations for sel~cted characteristics. The bus-mile

68
Table 5.2. Abbreviations used for route analysis.
Abbreviation
BM
COMP
CORPOP ·
DIST
FARE
FPM
FREQ
OBS
PAS
PASPBM
PASPFR
PASPTP
POPI
POPJ
SPEED
STUDS
TIME
Definition
Annual bus-miles on route, in thousands
Dummy variable indicating presence (1) or absence (0) of a competing carrier in the same general corridor
Population in the corridor, in thousands (This included the population of all cities over 5,000 on the route between origin and destination. Also included were cities less than 5,000, if those cities were county seats.)
Distance in miles between the end points
One-way fare in dollars
Fare per mile in dollars per mile
Number of daily round trips
Observation number associated with the route for identification purposes
Annual passengers, in thousands
Passengers per bus-mile, PAS/BM
Passengers per round trip, in thousands, PAS/FREQ
Passengers per population served where population is the sum of POPI, POPJ, and CORPOP
Population in origin city from 1970 census data, in thousands (The city population included all incorporated cities immediately adjacent to the central city. The origin was assumed to be the largest of the two cities.)
Population in destination city from 1970 census data, in thousands (The city population included all incorporated cities inµnediately adjacent to the central city.)
Average overall bus speed in miles per hour, or distance between origin and destination divided by time
College student enrollment, in thousands (1979 enrollment) in all cities served by the route
Bus-time in hours between cities
·I
I I '
I
I

1.
/I
J

Table 5.4. Characteristics of selected factors for study routes.
PAS a BM FREQ FARE FPM DIST
Mean 16.4 106.6 1.82 9.92 0.102 95.3
Standard Deviation 13.3 38.9 1.47 4. 71 0.030 33.8
3units are defined in Table 5.2.
/ ., ....
SPEED PASPTP
34.1 0.075
3.9 0.064
PASPFR
8.88
3.97
PASPBM
0.144
0.096
....... 0

I I
I j '
-~
71
and passenger data were generally provided directly by the carrier;
however, an approximation was necessary to allocate traffic to a portion
of a route with a through-route component. The allocation was based on
data provided by the carrier.
Regression Models of Corridor Travel
An ideal model for estimating passengers in the corridors would
contain factors related to the community and factors related to the bus
service. Models containing only service factors, such as frequency or
fares, do not allow the operator and the planner to determine varia
tions due to the differences in the cities served. On the other hand,
models that do not incorporate frequency or fare elements do not provide
decision makers with a basis for evaluating scheduling or fare policies.
Linear-form and product-form models using totals and rate variables
were analyzed. Several models were statistically valid and explained
80% to 90% of the variance in the dependent variable. Unfortunately,
most models did not include policy-sensitive variables, such as rela
tive travel time or fares.
The prediction errors for passenger movement in any single corri
dor were considerably lower than the errors from revenue models in
individual cities, but still the errors were nearly 70% in one or more
corridors. The exception was a model using annual passengers per daily
round trip as the dependent variable and bus-miles and population fac
tors as independent variables.
The recommended model for passenger estimation is:
PASPFR = -0.1 + 0.050 BM + 0.041 POPJ + 0.056 CORPOP
(a = 0.007) (a= 0.015) (a = 0.004) (5.1)

72
The percent of variation explained was 90% and the coefficient of
variation was 17%. The coefficient of variation is the ratio of the
standard error of the estimate to the mean of the dependent variable.
It is an indicator of the variation about the regression line and must
be low for the equation to have strong estimating potential in individ
ual corridors. The values shown below the coefficients represent the
significance level for each parameter.
Eight of the 11 routes had estimating errors of less than 15%; two
more were in thP. range of 15% to 25%; the largest error was 38%. Consid
ering the large variation in route demand, these estimates are well
within the range expected for estimates of discrete observations.
Validation of the Model
A useful evaluation of regression mod~ls is to develop estimates
in cases not used for the calibration of the model. Four routes were
used in this evaluation stage. These included the Reid Bus Line route
from Harlan, Iowa, to Omaha, Nebraska; the River Trails route from
Davenport to Dubuque; the Iowa Coaches line from Dubuque to Sioux City;
and the former Sedalia-Marshall-Boone line (SMB) from Des Moines to
Sioux City. The Dubuque to Sioux City run is somewhat different from
the other routes because it is an entire cross-state route, while the
other routes represent shorter corridors with limited intervening popu
lation centers. The Reid operation is also nontypical. This carrier
is an owner-operator system, comparable to newer commuter operations.
It serves a corridor with a very low population density. The two daily
1 I
/

I
73
round trips increase the bus-miles of travel beyond the marginal passen
ger potential for this run. Passenger revenues account for only 25% to
30% of the system revenue. The carrier cu-r·rently relies more on its
express business than on passenger revenue.
Table 5.5 shows the key variables for these, routes. Estimation
errors for three of the four routes centered around the 25% value, with
the major outlier of concern being the Reid operation. As expected, the
population density in the service area was too low to generate a demand
consistent with the amount of bus-miles traveled in the corridor. The
second daily round trip has low passenger potential. If the operator
provided only one round trip with the bus-miles reduced to 29, the
passenger estimate would have been 1600 persons compared to the 2400
actually served. This suggests that a 100% increase in the service
frequency had only increased the demand by 50%.
The 25% error for other routes is within the range established for
regular route carriers used in the calibration phase. The combined es
timated trips on the four routes is within 11% of the observed volumes.
Application of the Forecasting Models
The route evaluation phase considers impacts for both new and exist
ing routes. Passengers, passenger revenues, and express revenues are
addressed on a route basis.
Treatment of Frequency Adjustments on New Routes
The passenger estimation equation implies that the number of passen
gers per round trip is a direct function of the number of bus-mile~. On

Table 5.5. Model validation for passenger model.a
Thousands of Passengers Percent
A Route BM !]
POPJ CORPOP .FREQ PAS (Estimated) Error
Harlan-Omaha 58 58 0 2 2.4 6.0 + 150
Dubuque-Davenport 53 62.3 62.3 1 6.9 5.4 22
Dubuque-Sioux City 256 62.3 214.0 1 38.0 27.3 28
Des Moines-Sioux Cityb 154 45.9 13.1 1 9.7 11.9 + 22
aUnits are defined in Table 5.2. b on the 1977 the last was offered by the carrier. Based report, year service
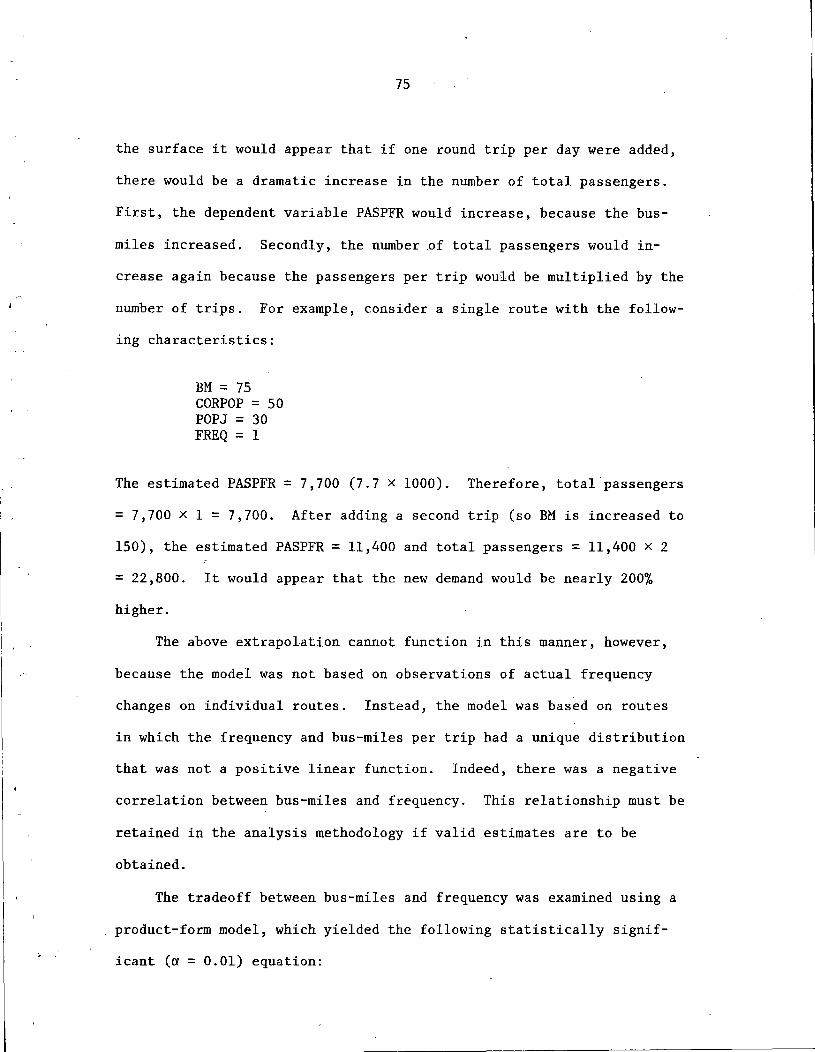
75
the surface it would appear that if one round trip per day were added,
there would be a dramatic increase in the number of total passengers.
First, the dependent variable PASPFR would increase, because the bus-
miles increased. Secondly, the number of total passengers would in-
crease again because the passengers per trip would be multiplied by the
number of trips. For example, consider a single route with the follow-
ing characteristics:
BM = 75 CORPOP = 50 POPJ = 30 FREQ = 1
The estimated PASPFR = 7,700 (7.7 x 1000). Therefore, total passengers
= 7,700 x 1 = 7,700. After adding a second trip (so BM is increased to
150), the estimated PASPFR = 11,400 and total passengers= 11,400 x 2
= 22,800. It would appear that the new demand would be nearly 200%
higher.
The above extrapolation cannot function in this manner, however,
because the model was not based on observations of actual frequency
changes on individual routes. Instead, the model was based on routes
in which the frequency and bus-miles per trip had a unique distribution
that was not a positive linear function. Indeed, there was a negative
correlation between bus-miles and frequency. This relationship must be
retained in the analysis methodology if valid estimates are to be
obtained.
The tradeoff between bus-miles and frequency was examined using a
product-form model, which yielded the following statistically signif-
icant (a = 0.01) equation:
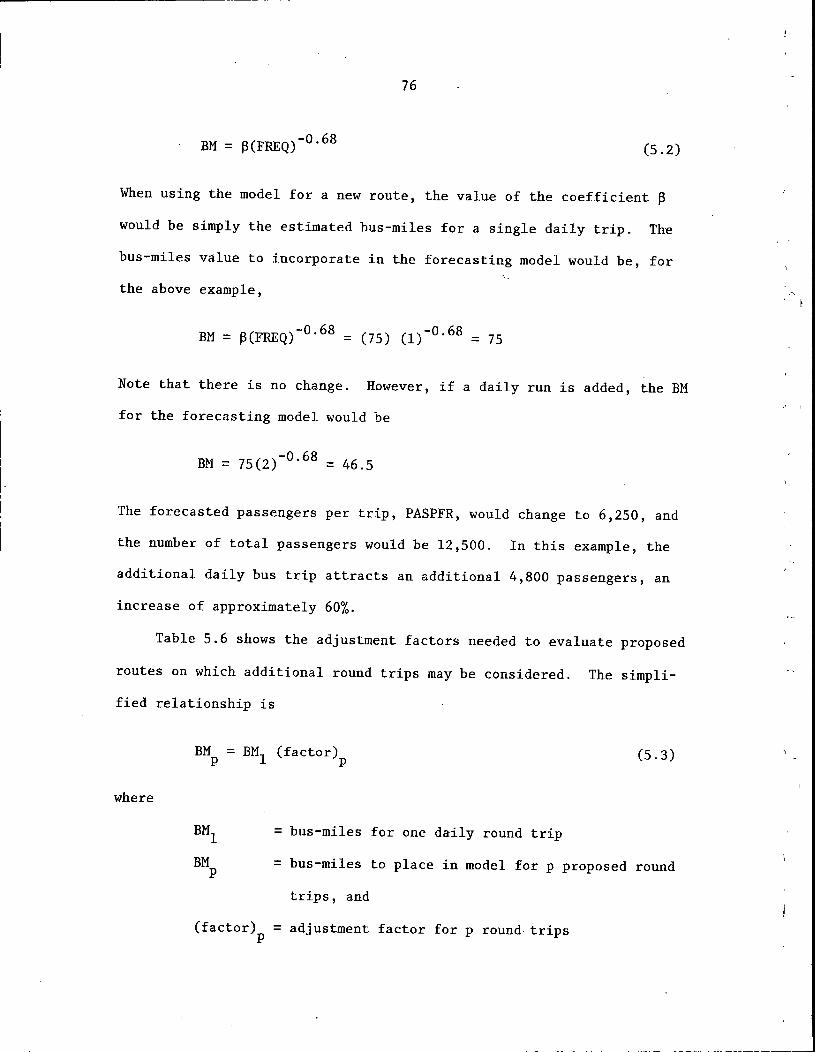
76
BM= ~(FREQ)- 0 · 68 (5.2)
When using the model for a new route, the value of the coefficient ~
would be simply the estimated bus-miles for a single daily trip. The
bus-miles value to incorporate in the forecasting model would be, for
the above example,
BM= ~(FREQ)- 0 · 68 = (75) (1)-0 · 68 = 75
Note that there is no change. However, if a daily run is added, the BM
for the forecasting model would be
BM = 75(2)-0 ·68 = 46.5
The forecasted passengers per trip, PASPFR, would change to 6,250, and
the number of total passengers would be 12,500. In this example, the
additional daily bus trip attracts an additional 4,800 passengers, an
increase of approximately 60%.
Table 5.6 shows the adjustment factors needed to evaluate proposed
routes on which additional round trips may be considered. The simpli-
fied relationship is
where
BM p
BM1
BM p
(factor)
=
=
= p
(5.3)
bus-miles for one daily round trip
bus-miles to place in model for p proposed round
trips, and
adjustment factor for p round. trips
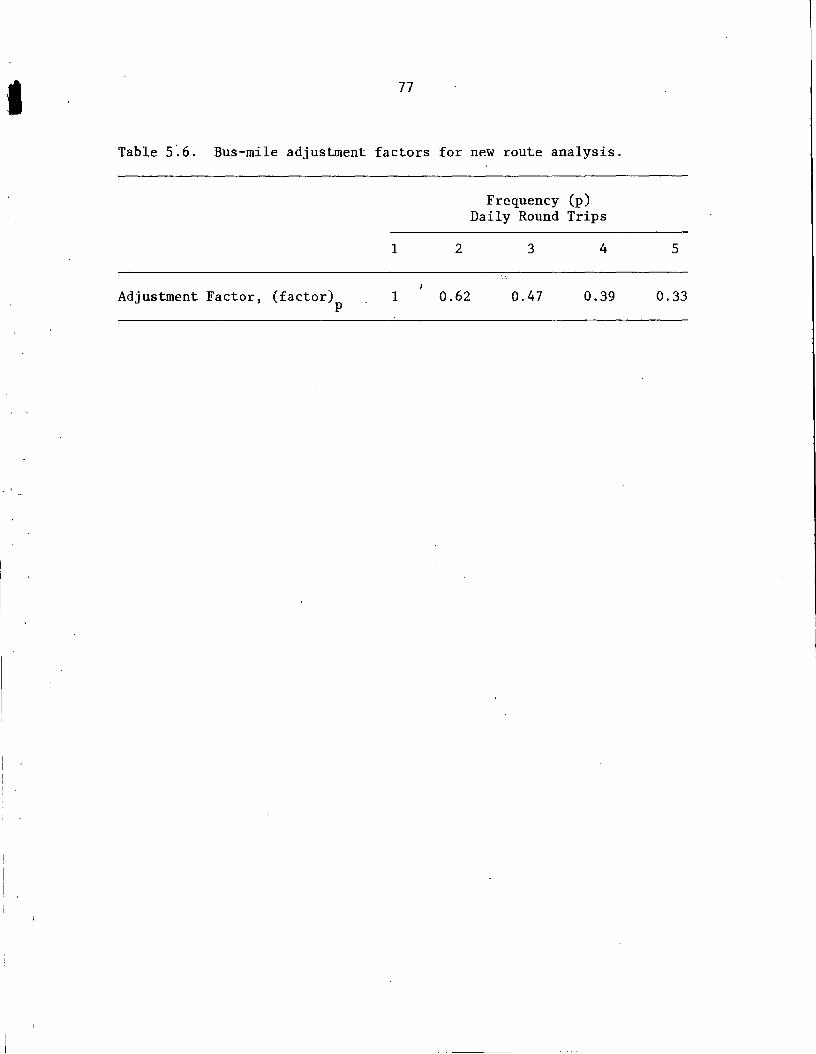
I 77
Table 5'.6. Bus-mile adjustment factors for new route analysis.
Adjustment Factor, (factor) p
1
1
2
0.62
Frequency (p) Daily Round Trips
3 4
0.47 0.39
5
0.33

---------------------------------
78
Treatment of Frequency Adjustments on Existing Routes
If adjustments in frequency are to be considered for existing
routes for which passenger data are available, the appropriate base
to use is the known passenger dem~nd. The demand equation is not
necessary. The anticipated passenger demand on .proposed runs can be
determined using the same general relationship found for service fre-
quency and bus-miles noted earlier. The expression is
where
PAS p
PAS p
= PAS e
FREQ 0.68 p
FREQ 0.68 e
(5.4)
= passengers on proposed system with FREQ daily p
trips
PAS = passengers on existing service with FREQ e e
FREQ , FREQ =proposed and existing daily round trips, p e
respectively
The appropriate adjustment factors may be determined directly from
Fig. 5.1, so
PAS = PAS (adjustment factor) p e
(5 .5)
The figure clearly shows the decreasing return obtained for in-
creased daily operations. As should be expected, the increased volume
obtained by adding another run when there are already several in ser-
vice is significantly less than the increment achieved when there is
only one round trip. Although any number of additions or deletions

'\ ,,,, ~ /
~/ E = EXISTING NUMBER OF DAILY ROUND TRIPS
2.00 2.00
1. 75 0:: l. 75 0
I-u cl: LL.
I- 1. 50 1. 50 :z::
°" ---LLJ :;:: I-
l. 25 V')
1. 25 ::::> 'J 0 cl: .......
1. 00 '° 0:: 1. 00 LLI
~ :z:: LLI V')
0.75 V')
0.75 cl: c..
0.50 0.50
0.25 0.25
0.00 0.00 0 l 2 3 4 5 6
PROPOSED NUMER OF ROUND TRIPS IN CORRIDOR
Fig. 5 .1. Adjustment factors for trip frequency on existing routes.

80
could be analyzed, it is recommended that the incremental change should
be no greater than two.
The researchers identified one case that could be used to test the
existing service model for frequency adjustment impacts. The SMB
Stagelines dropped one of two daily trips from Des Moines to Sioux City
in 1977. In 1976, regular route passengers totaled 16,700. The model
would estimate a new passenger demand as
PAS(l) = PAS(2) (adjustment factor from Fig. 5.1)
= 16,700 (0.62)
= 10,350
The actual number of passengers served in 1977 was 9,700. This compari
son shows a difference of only 6.7%.
Revenue Estimation in the Corridor
Passenger Revenues
The passenger revenue may be estimated from the expression
Annual passenger revenues = passengers x fare per mile
x average trip length (5.6)
The fare per mile would be based on the existing or proposed fare struc
ture in the corridor being analyzed. On a new route, the average trip
length can be reasonably estimated by determining the weighted average
distance of the population centers from the largest end-point city. The
expression is
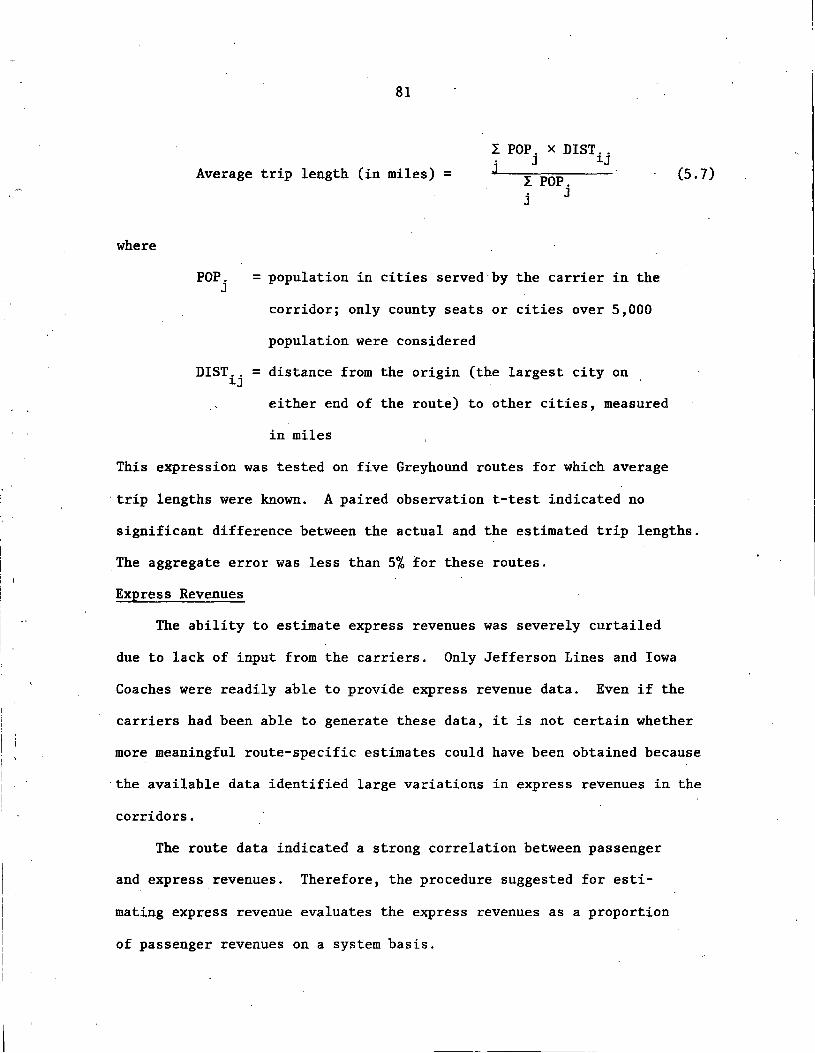
where
81
I POP. x DIST .. J 1J
Average trip length (in miles) = I POP. j J
POP. =population in cities served by the carrier in the J
corridor; only county seats or cities over 5,000
population were considered
DIST .. =distance from the origin (the largest city on 1J
either end of the route) to other cities, measured
in miles
This expression was tested on five Greyhound routes for which average
· trip lengths were known. A paired observation t-test indicated no
(5. 7)
significant difference between the actual and the estimated trip lengths.
The aggregate error was less than 5% for these routes.
Express Revenues
The ability to estimate express revenues was severely curtailed
due to lack of input from the carriers. Only Jefferson Lines and Iowa
Coaches were readily able to provide express revenue data. Even if the
carriers had been able to generate these data, it is not certain whether
more meaningful route-specific estimates could have been obtained because
·the available data identified large variations in express revenues in the
corridors.
The route data indicated a strong correlation between passenger
and express revenues. Therefore, the procedure suggested for esti-
mating express revenue evaluates the express revenues as a proportion
of passenger revenues on a system basis.

82
The data for the medium-sized carriers produced the following
average ratios of express revenues to passenger revenues for the period
1976 to 1979: Iowa Coaches (0.338), Midwest Coaches (0.362), Missouri
Transit (0.303), and Scenic Hawkeye (0.281). The overall mean for this
group was 0.321, with a standard deviation of O.Q394. The standard
deviation is only 12% of the mean value, which indicates reasonable
stability on a system basis.
The comparable data for the larger carriers were: Greyhound
(0.235), American (0.204), and Jefferson (0.451). The mean value for
this group (0.297) was very close to the value for the other carriers,
but the standard deviation was 0.112 or 37% of the mean.
As a first-level approximation, the express revenues on a new
route could be estimated as a fraction of the estimated passenger
revenue. The appropriate fraction should be based on previous exper
ience of the carrier, but lacking that information, the express revenue
may be estimated as 30% of the forecasted passenger revenue.
Summary
The analyses have considered several community and supply charac
teristics, but only a small number of variables are incorporated in the
final model. Passenger estimation tools are provided for analyzing new
routes and existing service. The passenger revenue capability is tied
into the demand forecasts by applying average trip length and average
fare per mile factors. ~oute-specific express revenues were not iden
tifiable on all systems. An estimation methodology based on the current
average fraction of express revenue to passenger revenue is recommended.

83
Each forecasting tool will be applied in a case study example.
These analyses appear in Section 8 .
. I
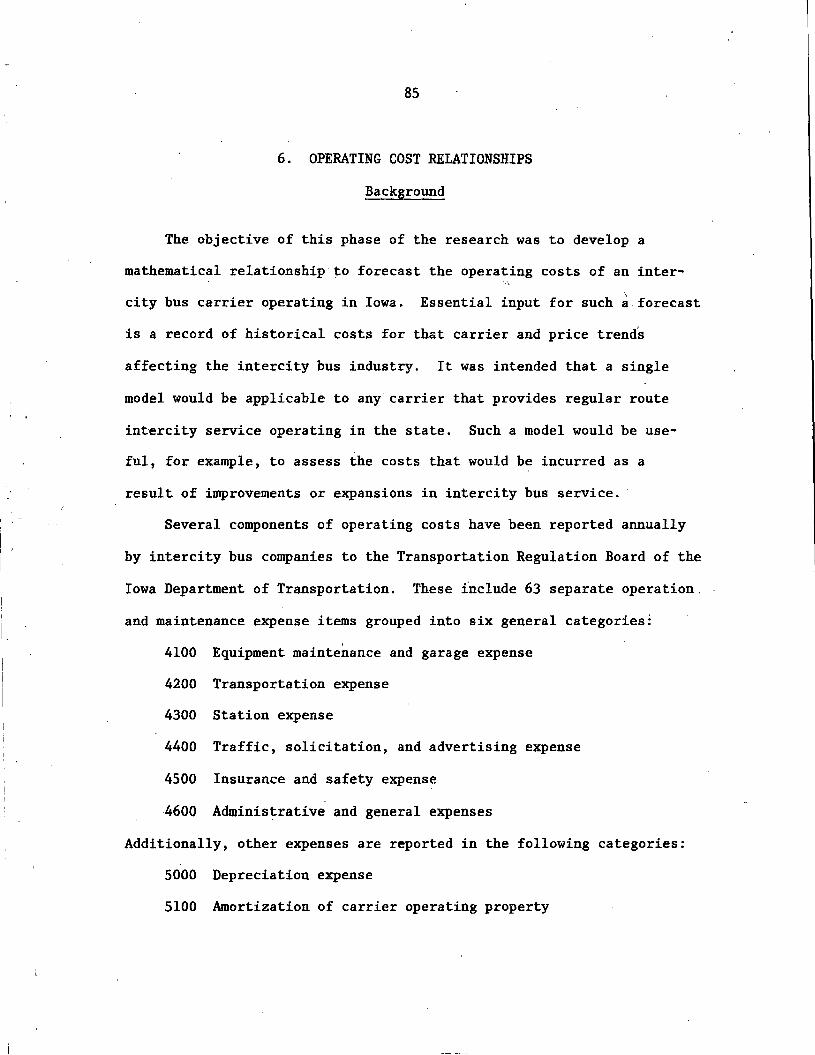
85
6. OPERATING COST RELATIONSHIPS
Background
The objective of this phase of the research was to develop a
mathematical relationship to forecast the operating costs of an inter-
city bus carrier operating in Iowa. \
Essential input for such a forecast
is a record of historical costs for that carrier and price trends
affecting the intercity bus industry. It was intended that a single
model would be applicable to any carrier that provides regular route
intercity service operating in the state. Such a model would be use-
ful, for example, to assess the costs that would be incurred as a
I. result of improvements or expansions in intercity bus service.
Several components of operating costs have been reported annually
by intercity bus companies to the Transportation Regulation Board of the
Iowa Department of Transportation. These include 63 separate operation.
and maintenance expense items grouped into six general categories:
4100 Equipment maintenance and garage expense
4200 Transportation expense
4300 Station expense
4400 Traffic, solicitation, and advertising expense
4500 Insurance and safety expense
4600 Adminis~rative and general expenses
Additionally, other expenses are reported in the following categories:
5000 Depreciation expense
5100 Amortization of carrier operating property

86
5200 Operating taxes and licenses
5300 Operating rents
Operating costs vary significantly among carriers. In 1979, for
example, total expenses per bus-mile for the highest-cost carrier among
the seven largest carriers serving Iowa were $1.63. The lowest-cost
carrier in this group operated for an average of $0.92 per bus-mile, a
ratio of L 77 to 1 for these two carriers. Given this disparity in
operating costs among carriers, it is apparent that an acceptable .model
must be capable of using as input the historical data on operating
expenses for the specific carrier that is the subject of the analysis
being undertaken. What is required, then, is a practical method for
updating these costs so that they may be projected to current or future
costs. ·
An Operating Cost Model
Certain desirable characteristcs were established for an operating
cost model that would be applicable to any carrier operating within the
state. First, the model would include a limited number of expense
components, each of which could be updated with reasonable confidence
by using a generally recognized price index. Collectively these com
ponents should represent a significant portion of the total expenses
for an intercity bus operation. These expense components should also
bear a direct relationship to the variable costs of providing intercity
bus service and should be relatively free of influence by ownership or
operating characteristics that might be unique to specific carriers.

87
Furthermore, the relationship between these expense components and the
total costs of a bus operation should be constant over time and the
same for all carriers.
Many individual expense items are not reported each year by all of
the intercity carriers operating in Iowa. For e~ample, in 1978 five of
the seven carriers that afforded the basis for the cost model did not
report expenses in the following categories:
•Expenses of general office employees.
• Other regulatory commission expenses.
Several other categories were omitted by at least one carrier. Other
items are reported in a form that is not consistent from one carrier to
another, either because of different operating characteristics or be
cause of different accounting methods. Examples, taken from 1978 for
the same seven carriers, include the following:
• [Station] salaries and commissions, from zero to 10.4 percent
of expenses.
• Commissions paid, from 4.5 to 14.0 percent.
•Salaries for general officers, from zero to 7.4 percent.
• Operating rents, from a credit equal to 0.36 percent of expenses
to a cost equal to 3.3 percent of the total expenses.
Hence, an initial effort was made to identify those cost elements that
appeared to be consistently reported by all of the intercity bus carriers
filing reports in Iowa for the period 1976-1979. All of the cost items
that were investigated are listed in Table 6.1.
As a result of this investigation, nine expense items were identi
fied that were most consistently reported by the carriers. These items

88
Table 6;1. Expense items considered for inclusion in operating cost model.
Code Expense Item
4110 Supervision of shop and garage
4122 Operation and maintenance of service equipment
4140 Repairs to revenue equipment
4160 Tire and tube revenue equipment
4210 Supervision of transportation
4220 Drivers' wages and bonuses
4230 Fuel for revenue equipment
4240 Oil for revenue equipment
4311 [Station] salaries and commissions
4331 Commissions paid
4340 Interline commissions paid
4350 Interline commissions earned (credit)
4410 [Traffic, etc.] salaries and expenses
4470 Advertising
4520 Public liability and property damage insurance
4611 Salaries of general officers
4612 Expenses of general officers
4613 Salaries of general office employees
4616 Expenses of general office employees
4620 Law expenses
4630 General off ice supplies and expenses
4651 Outside auditing expenses
Models Tested
x
x
x
x
x
x
Final Model
x
x
x
x

89
Table 6·. 1. (continued)
Models Final Code Expense Item Tested Model
4673 Other regulatory commission expenses
5000 Depreciation expenses x x
5200 Operating taxes and licenses x
5300 Operating rents x

90
are indicated in the "models tested" column in Table 6.1. All of the
other expense items either were frequently not reported by some car
riers or their proportionate contribution to operating expenses tended
to be highly erratic. Models including these expense items were then
tested for conformance with the desirable chara~.~eristics described
previously.
It was also necessary at this stage to identify those carriers
whose reported expenses also conformed with the established criteria
for reporting consistency. As a result of this analysis, it was con
cluded that only data from the seven Class I and Class II carriers
should be used in the subsequent process of model development. Data
reported by the Class III carriers generally exhibited a distribution
of operating expenses that was substantially different from the pattern
for the larger carriers. Furthermore, these expenses were not consis
tent within the group of Class III carriers itself.
To determine the most suitable model, two or more cost elements
were summed for each of the seven carriers for each year, 1977-1979.
The proportion of total expenses represented by these cost elements for
each such sum was calculated. This process was repeated using different
combinations of cost elements until, through trial and error, the
combination was identified that best satisfied the evaluation criteria.
As part of the evaluation process, the standard deviation and mean
were calculated for the proportion of total expenses represented by
that combination of expense elements. This was done for each annual
period 1977-1979 using the sample of seven Class I and Class II carriers.
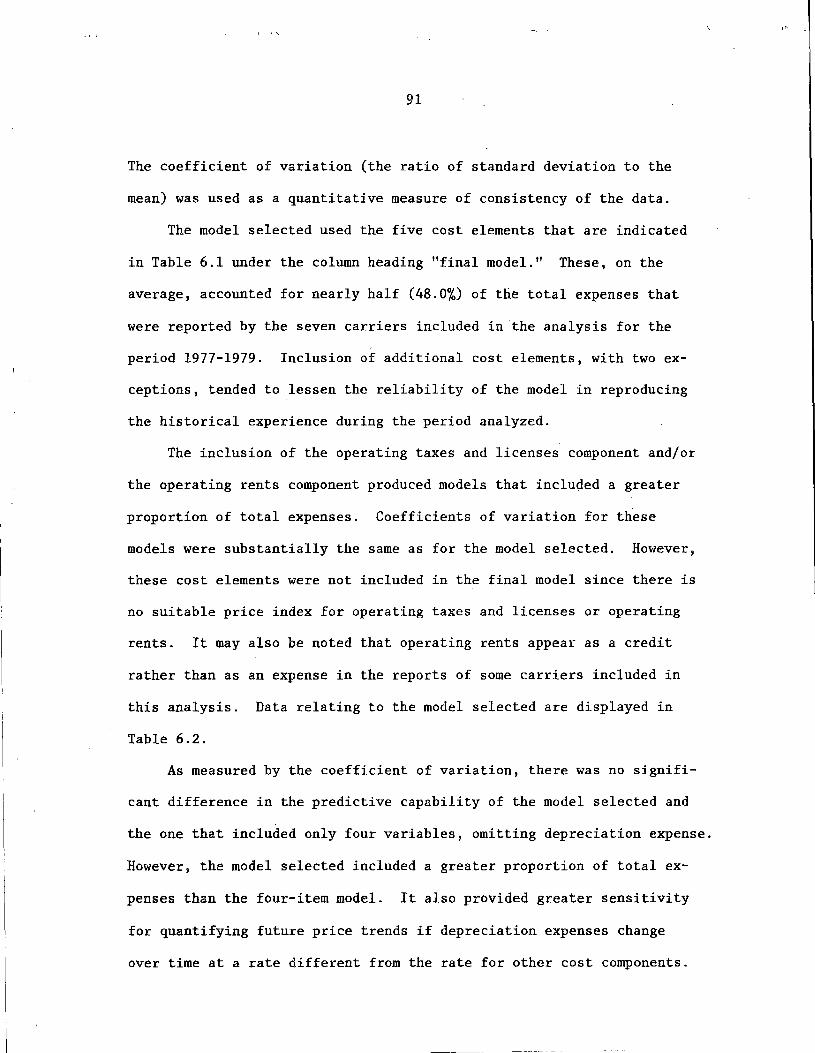
91
The coe~ficient of variation (the ratio of standard deviation to the
mean) was used as a quantitative measure of consistency of the data.
The model selected used the five cost elements that are indicated
in Table 6.1 under the column heading "final model." These, on the
average, accounted for nearly half (48.0%) of the total expenses that
were reported by the seven carriers included in the analysis for the
period 1977-1979. Inclusion of additional cost elements, with two ex
ceptions, tended to lessen the reliability of the model in reproducing
the historical experience during the period analyzed.
The inclusion of the operating taxes and licenses component and/or
the operating rents component produced models that included a greater
proportion of total expenses. Coefficients of variation for these
models were substantially the same as for the model selected. However,
these cost elements were not included in the final model since there is
no suitable price index for operating taxes and licenses or operating
rents. It may also be noted that operating rents appear as a credit
rather than as an expense in the reports of some carriers included in
this analysis. Data relating to the model selected are displayed in
Table 6.2.
As measured by the coefficient of variation, there was no signifi
cant difference in the predictive capability of the model selected and
the one that included only four variables, omitting depreciation expense.
However, the model selected included a greater proportion of total ex
penses than the four-item model. It also provided greater sensitivity
for quantifying future price trends if depreciation expenses change
over time at a rate different from the rate for other cost components.

Table 6.2. Details of expense components. a
Carrier
Iowa Midwest Missouri Scenic Greyhound American Jefferson Coaches Coaches Transit Hawkeye
1977 Subtotal (five items) 109, 421. 9 16,313.8 3,465.5 411.0 431.1 772.2 444.3 Total Expense 242, 771.3 36,677.0 8,086.2 861.2 844.5 1,443.2 894.8 Percent (five items) 45.1 44.5 42.9 47.7 51.0 . 53.5 49.7
1978 /
Subtotal (five items) 113,656.4 16,442.1 4,136.0 479.8 437.5 853.2 458.3 Total Expense 258,490.2 38,489.6 9,406.5 922.7 896.7 1,682.4 952.2 Percent (five items) 44.0 42.7 44.0 52.0 48.8 50.7 48.1 l.C
N
1979 Subtotal (five items) 135,322.7 20,937.2 4,603.0 525.7 500.7 930.5 542.7 Total Expense 301, 791. 9 46,220.0 10,483.9 973.6 987.2 1,735.7 1,074.1 Percent (five items) 44.8 45.3 44.0 54.0 50.7 53.6 50.5
1977-1979 Subtotal (five items) 358,401.0 53,693.1 12,204.5 1,416.5 1,369.3 2,555.9 1,445.3 Total Expense 803,053.4 f21,386.6 27,976.6 2,757.5 2, 728.4 4,861.3 2,921.1 Percent (five items) 44.6 44.2 43.6 51.4 50.2 52.6 49.5
aCosts are given in thousands of dollars.

93
An average of about 80% of the depreciation expense for intercity
carriers consists of the depreciation associated with revenue equip
ment. Although a price index for motor coaches was previously reported
by the Bureau of Labor Statistics, this index has not been calculated
since July 1979. However, a suitable proxy exists in the form of the
index for heavy trucks, an index tµat tended to change at .the same rate
as the index for motor coaches, when both were being reported.
Shown in Table 6.3 are the standard deviations and the means for
the parameter used for evaluation, the percentage of total expenses
represented by the five expense elements selected for the model. Also
shown in Table 6.3 is the coefficient of variation for each year of the
period of the analysis and for the combined three-year period. The
proportion of each cost component included in the sample data is dis
played in Table 6.4.
where
The equation developed from these data is as follows:
c
A
M
= cost of bus service per bus-mile
= adjustment factor to account for the proportion of
costs in selected categories; for ICC Class I car
riers (Greyhound, American, Jefferson), A= 2.27;
for ICC Class II carriers (Iowa Coaches, Midwest,
Missouri, Scenic Hawkeye), A= 1.96
= multiplier for updating costs

94
Table 6.3. Analyses of five expense components as percentages of total expenses.
Percent of Total Expense Coefficient
Standard of Year Deviation Mean Variation
..
1977 3.84 47.8 0.080
1978 3.64 47.2 0.077
1979 4.24 49.0 0.086
1977-1979 3.77 48.0 0.078
'·

95
Table 6;4. Average proportion of total expenses attributable to each expense component (1977-1979).
Percent
Subtotal Component Total Expenses (Five Items)
Repairs to Revenue Equipment 8.2 17.1
Tire and Tube Revenue Equipment 1.4 3.0
Drivers' Wages and Bonuses 24.9 51.8
Fuel for Revenue Equipment 7 .4 15.5
Depreciation Expenses 6.1 12.6
Total 48.0 100.0

96
CR' etc. = component cost per mile for repairs to revenue
equipment, tires, driver's wages, fuel, and depre
ciation expense
Updating of the Model
The multiplier or updating factor included in the equation is
based upon the average proportionate costs of each of the five com
ponents for the seven carriers included in the analysis for the period
1977-1979. It is also a function of the appropriate price index for
each factor. The base period for selecting these indices was August
1979.
where
The equation for M, the updating multiplier, is as follows:
M = 0.00070 CPIR + 0.00013 PPIT +_0.00204 HEITPU + 0.00031 PPIF
+ 0.00057 PPID
CPIR = consumer price index, automobile maintenance and
repair
PPIT = producer price index, truck tires (code 07120105)
HEITPU = hourly earnings index, seasonally adjusted, for
.transportation and public utilities
PPIF = producer price index, diesel fuel to commercial
consumers (code 05730301)
PPI0 =producer price index, motor trucks, 10,001 lbs
gross vehicle weight and over (code 14110281)

97
Indices for updating 1979 costs may be obtained from the following
sources, each a publication of the U.S. Department of Labor, Bureau of
Labor Statistics:
• CPI detailed report (CPIR).
• Producer prices and price indexes (PPIT ;·· PPIF, and PPID) .
• Employment and earnings (HEITPU).
Values of the price indices used were as follows for August 1979:
CPIR = 245.7
PPIT = 222.9
HEITPU = 254.3
PPIF = 505.8
PPID = 222.4
To demonstrate the calculation of the multiplier, the following
calculation is shown using the· component indices for June 1980:
M1980 = 0.00070 (267.3) + 0.00013 (249.1) + 0.00204 (270.6)
+ 0.00031 (690.2) + 0.00057 (246.9) = 1.13
Thus, operating expenses for June 1980 are 1.13 times thos·e for 1979. '-
It may be anticipated that the proportionate contribution of vari-
ous cost elements may change during a period when prices are increasing
rapidly. Under such circumstances, the model should be recalculated
not less frequently than every three years. It is recommended, for
example, that the adjustment factor, A, and the equation for the updat-
ing multiplier, M, be revised in 1983 using operating cost data and the
appropriate cost indices for 1982. Each coefficient in the equation
for M may be ,calculated from the following relationship:
where
R K = I
98
K = coefficient for a specific price index
R = ratio, specific cost component to total cost in the five
designated cost components
I = price index applicable to a specific cost component
For example, the coefficient associated with repairs to revenue equip-
ment was determined in 1979 as follows:
The ratio, R, was obtained from Table 6.4, which indicates 17.1%
of the cost of the five components is associated with this element, so
R = 0.171. The consumer price index, I, was reported to be CPIR = 245.7.
Therefore
0.171 R K = = = 0.00070 I 245.7
Application of the Model
In addition to operating costs, other factors are also relevant to
the determination of the incremental costs associated with an improve-
ment in service or an additional route. Such determination might be
made to establish the appropriate reimbursement for a carrier providing
such services under a purchase of service agreement, for example.
Various policy decisions are necessary, including to what extent is a
carrier afforded a contribution toward fixed costs and permitted to
realize a profit.
The specific services that are likely to be carried out under such
an arrangement would normally constitute only a relatively minor addition

99
to the total service conducted by a carrier. Given a typical relation
ship between fixed and variable costs for intercity bus carriers, a rate
of reimbursement equal to the total average costs per bus-mile would
probably be more than sufficient for a carrier to achieve a satisfactory
return on the marginal investment. Although such a determination is be
yond the scope of this research, the variable portion of total costs
appears to vary significantly among t~e seven largest carriers providing
bus service in Iowa. The range probably varies from about 65% to over
80% variable costs within this group of companies. If a median value of
75% is assumed for the variable component of costs, reimbursement at a
rate of 83% of the average total costs would yield an operating ratio of
about 90% on the incremental service. It may be seen that the capability
to project separately the expenses for an intercity carrier will not pre
clude the necessity for difficult policy decisions in making determina
tions as to the appropriate reimbursement for additional bus services.
Summary
It is possible to calculate with reasonable assurance the operating
expenses of an intercity bus carrier, given historical data concerning
key cost components for that carrier. However, this calculation does
not necessarily provide a complete answer as ,to what would constitute
the appropriate reimbursement for additional bus services that might be
performed under a purchase-of-service agreement. A policy decision is
still required to establish the extent to which reimbursement for
incremental services should contribute to fixed costs and provide a
return on equity.
101
7. SOCIAL AND GENERAI, WELFARE ASPECTS OF INTERCITY BUS SERVICE
Introduction
Personal mobility has long been recognized as a basic need for
achieving a satisfactory quality of life in the United States. The
concentration of our population into an urban setting with specialized
economic and social character has made travel a necessity if individ-
uals and households are to accomplish selected activities which 50
years ago were accomplished within the local farmstead (e.g., caring
for an elderly relative). Burkhardt suggested in 1973 that the need
for mobility (trip-making below the national average per capita travel)
by residents of rural and small community areas become the basic cri-
terion for transportation planning [24]. Burkhardt's analysis was
addressed to special interest groups with definite transportation
characteristics differing from the overall aggregate transportation
consumer (e.g.; the elderly, the low income, the handicapped). Minne~
sota and Missouri were included in these analyses.
Different levels of mobility needs were considered in an economic
analysis of statewide rural bus service for Pennsylvania. In that
study, a small fraction of the mobility need was projected to be satis-
fied by bus service [25]. Relating personal mobility levels, the need
to travel to carry out basic lifestyle functions, the availability of
public bus transportation, and the cost of providing bus system service
suggest that any subsidy to bus service may have to undergo economic
analysis. Therefore, any consideration of the social and general
102
welfare aspects of intercity bus service in Iowa must be made in light
of the type of system that can be reasonably assumed to exist through
the economic marketplace outside Iowa.
Assumed Minimum Viable System in the Absence of Economic Regulation
Intercity bus travel from the other 47 contiguous continental
states was assumed to generate sufficient travel demand to assure
continuity of service along Interstates 29, 35, 80, and 380. Service
along these corridors was presumed Lo be of sufficient interest to jus
tify a route stop: Sioux City, Council Bluffs, Des Moines, Newton, Iowa
City, Davenport, Cedar Rapids, Waterloo, Ames, and Mason City (served
through Clear Lake at I-35). These communities have sufficient concen
trations of population (10,000 or more persons), social activity and
economic activity to produce intercity bus traffic justifying interrup
tion of interstate route service.
A case could be developed to argue that other communities and
other interstate routes should be included in a minimUJD economically
viable system. However, in this section, we are examining intercity
bus service from a social and general welfare point of view. In that
context, when Iowa is considered as one area within a multistate region,
only the Interstate Highway System represents sufficiently dense travel
corridors to guarantee extensive intercity bus service in the absence
of economic regulation. All other communities and areas within Iowa
become candidates for social and general welfare justification of
support for intercity bus service or as feeder services to the longer
haul routes.

103
Review of Selected State Programs
California
An extensive analysis was conducted on behalf of the California
Department of Transportation to identify transit performance measures
that could be related to the economic, social, and functional value of
providing public transportation service [26]. A total of 168 per
formance measures were reviewed; 11 were selected for further analysis:
1. Cost per passenger
2. Employment served
3. Reliability
4. Headway
5. Transit dependents served
6. Population served
7. Transit utilization rate
8. Transit supply rate
9. Productivity
10. Self-support ratio
11. Connectivity
A cumbersome expression for weighted worth of transit service was
developed. The detailed results are of little value in examining
social and general welfare benefits of intercity bus service in Iowa.
However, the 11 variables considered do contain social-welfare charac
teristics: employment, population, transit dependents, and self-support
of service. These factors were considered for inclusion in the Iowa
analyses.

104
The legislative intent was to allow three options to utilize the
intercity funding, including [27]:
1. Fare reductions (with the goal of increased ridership).
2. Increased frequency of existing service.
3. Increased access to other transportation systems.
The legislative program assumed that the route system existing prior to
the program was considered an economically justified structure. The
subsidy had to be associated with an expansion of service, reduction of
fare-box income, or some management change intended to reduce operating
costs and/or increase revenue. Apparently no direct consideration was
given to social-welfare analyses, except through the traditional trans-
portation planning process in providing consideration to community
needs and desires.
Michigan
An analysis of the intercity bus industry and the impact of a
subsidy program on the industry in Michigan was completed in 1978 [28].
Clearly, the intent of the Michigan program was to utilize social and
welfare measures to guide the expenditure of public funds. The program ~
policy sought to discourage abandonment of low-volume rural intercity
routes, because these operations provide service to a unique clientele
that cannot afford, or does not have access to, other public transporta-
tion modes.
Results from national travel surveys and Michigan bus rider surveys
were used to show that persons with incomes of less than $7500 per year
utilized bus, rail, and air travel modes in the following proportion:
4:2:1. Furthermore, persons over 65 years of age used the bus as much

105
as rail and air combined. A strong philosophical case was made for the
social value of rural intercity bus service.
However, careful scrutiny of the report indicates that application
of the subsidy money was assigned more on cost considerations and
self-support criteria than on social-welfare indicators. One of the
key criteria in initiating the program was that ridership estimates and
cost projections be such that any subsidized route was to be self-paying
at the end of two years. Since at the end of two years only subsidized
routes along major travel corridors had gained a significant number of
riders, the self-sufficiency criterion was dropped. This change in
policy did not appear to be the result of social or welfare function
evaluation, but more a recognition that certain routes selected for
funding would never be financially self-sufficient.
Wisconsin
The Wisconsin Department of Transportation conducted an extensive
analysis of intercity bus passengers in June 1976 prior to making any
legislative recommendation about the need for subsidization of intercity
bus service [29]. Among the findings applicable to Iowa were the fol-,_
lowing points.
Almost three-fourths of the tickets purchased were one-way rather
than round trip. Persons beginning a trip on the bus had "home" as an
objective 41.4% of the time, "visiting friends" 18.7% of the time, and
"work" 10.8% of the time. Persons who terminated a trip on the bus had
"home" as an objective 30.7% of the time, "visiting friends" 33.7% of
the time, and "vacation" 9.5% of the time as the most dominant activities.

106
Clearly·, recreational travel is an important component of intercity bus
demand in Wisconsin.
Over 60% of the Wisconsin bus riders were female; 32% were in the
18-24 age range (the most common response). Since no children were
surveyed and questions about the "number of persons in the traveling
party" were so poorly worded that children were not identified, no
accurate estimate can be made of age, except to note that most riders
are either young (25 years or younger) or old (55 years or older).
Middle-aged people are notably absent.
Student was the most common occupation at 30.8%, followed by
professional/technical at 17.7% and retired at 12.2%. It was also noted
that 18.8% of all persons reported a 1975 income of less than $5,000
per year and 35.6% reported incomes of less than $10,000 per year. When
bus travelers are mostly students and the elderly with low incomes, it
is not surprising that this same sample most often gave "inconvenience"
and "it takes too long" as reasons for not using a bus on a one-way trip
of 100 miles or more. The elderly in particular have difficulty re-
maining seated for long periods of time.
" In spite of having a significant body of information related to
social-welfare characteristics of the intercity bus users in Wisconsin,
the Wisconsin Department of Transportation concluded in 1977 that no
overwhelming justification existed to institute a subsidy program for
intercity routes at that time [30]. They concluded that pricing poli-
cies associated with alternative transportation modes would have a
greater impact on bus ridership than would the changes that could be
attained by a bus subsidy program.

107
New York·
The New York State Department of Transportation has conducted a
number of studies to evaluate public transportation, but all measures
used are "performance" measures in terms of engineering, econo~y, and
management efficiency [31]. .
Application to Iowa
A reasonable extrapolation is that intercity bus passengers in
Iowa are similar to those in WisconHin. It is likely that there is a
social need for more mobility in Iowa rural and small-town areas. It
is also obvious that it is easier to discuss social and welfare values
of intercity bus service than it is to quantify these values in a way
related to providing bus service.
Definition of Iowa Social-Welfare Parameters
Population
Cities and communities in Iowa having various characteristics
deemed significant are shown in Table 7.1. The primary factor to be
considered has to be community po~ulation. It is the simplest aggre
gate measure of social need for mobility. How large should a city
without intercity bus service be before some social-economic structure
penalty is incurred? Burkhardt indicated that sufficient demand for
public transportation services would be generated in cities of 5,000
or more [24]. Table 7.1 indicates Creston, Perry, Centerville, and
Chariton as cities of 5,000 or more persons without intercity bus serv
ice.

Table 7 .1. General social-welfare indicator values for selected Iowa communities. a
Full-Time State Employ- Private Students Ins ti tu- Resident Daily
ees of a Employers ti on Elderly Urban Departures Major (With more Commu- (Facility Bus Each Direction Popula- Highway Public than 1000 nity 4-Year Resi- Per-b Per- County Serv-Community ti on Access Employer Employees) College College dents) cent sons Seat ice E w N s
Des Moines 201,404 us 69/65 @ 3800 7 58 7,651 7.38 25,838 x x 16 12 8 4 West Des Moines 20,712 I 35/80; US 6· x via metro bus , Urbandale 16,410 End IA 141, x via metro bus Windsor Heights 6,303 IA 5, IA 90 x via metro bus Clive 2,928 x via metro bus
Cedar Rapids 108,987 us 30 @ us 218 7 2,817 1, 119 3. 35 11, 748 x x 5 4 5 10 Marion 18,190 and I 380; End x via metro bus IA 149, IA 150, us 151
Davenport 99,836 us 61 @ us 6; 3 710 300 3.37 11,820 x x 18 17 2 0 Bettendorf 24,290 I 80; End I x via metro bus 74, IA 130, IA 22
Sioux City 85,925 us 20 @ I 29 1,029 2,831 3.12 10,931 x x 2 8 5 I-' and US 77 and 0 co US 75; End IA
12, us 73
Waterloo 73,064 us 20 @ us 218 3 1,631 2.66 9,322 x x 2 3 4 Cedar Falls 33,154 and I 380 and 1000 10,382 x via metro bus Evansdale 5,038 US 63;· End IA x via metro bus 21, IA 57, IA 58, IA 281
Dubuque 62,309 us 20 @ us 61 2 3,476 and US 52; End
2.06 7,229 x x 6 4 0
IA 3
Council Bluffs 60,348 I 29 @ I 80 and US 6 and
1,328 274 1. 95 6,825 x x 12 12 6 2
US· 275; End IA 92, IA 183, IA 191
Iowa City 47,744 us 218 @ I 80 5000 23,374 0.88 3,092 x x 6 6 8 4 Coralville 6,605 and US 6 and via metro bus Oakdale IA 1 88 x via metro bus
Ames 43,561 us 30 @ us and I 35
69 5000 23,486 0.62 2, 172 x 2 2 4 5

Table 7 .1. (continued)
Full-Time State Employ- Private Students Ins ti tu- Resident Daily
ees of a Employers tion Elderly Urban Departures Major (With more Commu- (Facility Bus Each Direction
Popula- Highway Public than 1000 nity 4-Year Resi- Per-b Per- County Serv-Community ti on Access Employer Employees) College College dents) cent sons Seat ice E w N s
Clinton 34,719 us 30 @ us 67; 2 428 1.19 4,166 x 2 2 1 End IA 136
Burlington 32,366 us 34 @ us 61; 1.32 4,628 x 2 2 2 2 West Burlington 3, 139 End IA 99 917 0.08 269 via urban bus
Mason City 31,839 us 18 @us 65 1,289 1.11 3,872 x x 0 1 6 5 and I 35
Fort Dodge 31,263 us 20 @ us 1,392 1.17 4,095 x 1 1 2 169; End IA 7
Ottumwa 30,263 us 34 @ us 990 1.29 4,530 x x 2 4 2 2 63; End IA 23
Marshalltown 26,506 US 30 @ IA 14; 643 573 0.98 3,434 x x 3 3 2 2 End IA 330 ......
0
'° Muscatine 23' 166 US 61 @ IA 22; 492 0. 77 2, 711 x 3 3 2 2· End IA 38
Newton 15,619 I 80 and us 6 0.56 1,952 x 4 4 0 0 @ IA 14
Keokuk 15,173 us 61/218 271 0.58 2,019 x 0 0 2 2
Fort Madison 13,991 US 61; End IA 90 998 0.54 1,875 x 0 0 2 1 2, IA 88, IA 103
Ankeny 13., 212 us 69; I 35 2,867 0.08 265 0 0 2
Boone 12,468 us 30 435 0.69 2,418 x 2 2 0 0
Oskaloosa 11,224 us 63 @ IA 92 542 0.61 2,121 x 2 3 0 2
Spencer 10,374 us 18 @ us 71 16 0.43 1,490 x 0 2 2
Indianola 9,611 us 65/69 @ IA 830 0.33 1,159 x 0 0 2 2 92
Carroll 9,218 us 30 @ us 71 36 0.33 1,159 x 2 2 0 0
j i
.J

Table 7.1. (continued)
Full-Time State Employ- Private Students Ins ti tu- Resident Daily
ees of a Employers ti on Elderly Urban Departures Major (With more Commu- (Facility Bus Each Direction
Popula- Highway Public than 1000 nity 4-Year Resi- Per-b Per- County Serv-Community ti on Access Employer Employees) College College dents) cent sons Seat ice E w N s
Charles City 9, 119 us 18 @ us 218 52 0.42 1,482 x 0 0 3 3
Fairfield 8,715 us 34 @ IA 1 0.38 1,333 x 2 2 0 0
Grinnell 8,685 us 6 and IA 1,232 0.33 1, 151 4 4 0 0 146; IA 110
Storm Lake 8,591 US 71 @ IA 7; 23 2,076 0.34 1,176 x 2 2 End IA 110
Webster City 8,488 us 20 @ IA 17 149 0.34 1,196 x 3 0 2
Creston 8,234 us 34 @ End IA 430 0.45 1,589 x 0 0 0 0 25
Le Mars 8,159 us 75 @ IA 3· ' 603 0.33 1,142 x 0 4 4
End IA 60 f-' f-'
Estherville 8, 108 IA 9 @ IA 4 394 0.33 1,151 x 0 0 3 3 0
Knoxville 7,755 IA 92 @ IA 14 0.42 1,457 x 4 3 0 0 and IA 5
Oelwein 7,735 IA 3 and IA 0.38 1,322 0 0 1 1 150
Decorah 7,703 IA 3 and IA 2,072 0.35 1,215 x 150
Waverly 7,351 us 218 @ IA 3 1,098 0.28 979 x 0 0 3 3
Atlantic 7,306 us 6 and IA 83 27 0.39 1,366 x 3 3 0 0 @ us 71
Cherokee 7 ,272 us 59 and IA 3 29 297 0.33 1,141 x 0 0
Mount Pleasant 7,007 us 34 and us 602 362 0.30 1,051 x 2 2 0 0 218
Perry 6,906 IA 141 @ End 0.36 1,263 0 0 0 0 IA 144
Clear Lake 6,876 US 18 @ End IA 0.29 1,009 0 0 107; I 35

Table 7.1. (continued)
Community
Pella
Centerville
Iowa Falls
Washington
Shenandoah
Denison
Red Oak
Algona
Independence
Maquoketa
Clarinda
Harlan
Chariton
Glenwood
Vinton
Sheldon
Eagle Grove
Anamosa
Emmetsburg
Orange City
Sioux Center
Monticello
Population
6,784
6,531
Highway Access
IA 163
IA 2 @ IA 5
6,454 us 20 @ us 65
6,317 IA 92 @ IA 1
6,242 US 59 @ IA 2
6,218 us 30@ us 59
6,210 US 34@ IA 48
6,032 us 18 @ us 169
5,910 US 20@ IA 150
5,677 US 61 @ IA 64
5,'312 US 71 @ IA 2
5,251 US 59@ IA 44
5 ,009 US 34 @ IA 14
5,002 us 275 @us 34
4,962 US 218 @ End IA 101
4,535 US 18 @ IA 60
4,489 IA 17
4,389 US 151 @ End IA 64
4,150 US 18@ IA 4
4,017 IA 10
3,996 us 75
3,~69 US 151 @ IA 38
Employees of a
Major Public
Employer
Private Employers
(With more than 1000
Employees)
Full-Time Students
Community
College
273
776
9
8
6
241
21
419
55
512
18
4-Year College
1,545
97
861
1,218
State Institu
tion (Facility
Residents)
746
779
Resident Elderly
Per-b Percent sons
0.31 1, 100
0.40 1,410
0.27 948
0.36 1,257
0.33 1,163
0.25 888
0.38 -1,347
0.29 1,019
0.25 880
0.31 1,101
0.34 1,176
0.25 888
0.32 1,122
0.15 524
0.26 910
0.21 743
0.23 803
0.14 500
0.20 701
0.16 575
0.13 458
0.19 649
County Seat
x
x
x
x
x
x
x
x
x
x
x
x
x
x
x
Urban Bus
Service
Daily Departures
Each Direction
E w N s
0 2 0 2
0 0 0 0
2 2
2 0 0
0 0 3 3
2 2 2 2
0 0 2 2
2 0 1
1 1
0 0 1 1
0 3 0 3
0 0 0 2
0 0 0 0
0 0 3 3
0 0 2 2
0 0
0 0 0 0
2 2 0 0
1 0
0 0 2 2
0 0 1 1
2 2 0 0

Table 7 .1. (continued)
Full-Time State Employ- Private Students Ins ti tu- Resident Daily
ees of a Employers ti on Elderly Urban Departures Major (With more Commu- (Facility Bus Each Direction
Popula- Highway Public than 1000 nity 4-Year Resi- Per-b Per- County Serv-Community ti on Access Employer Employees) College College dents) cent sons Seat ice E w N s
Mount Vernon c 3,268 us 30 @ IA 1 898 0.10 344 0 0 1
Eldora 3,223 IA 175 @ End 204 0.17 596 x 0 0 0 0 IA 215
Onawa 3,154 IA 175; I 29 7 0.18 637 x 0 0 3 3
Lamoni 2,540 us 69; I 35 1,349 0.09 312 0 0 3 2
Rockwell City 2,396 us 20 @ IA 4 94 0.16 543 x 0 0 0 0
Toledo 2,356 us 63 and US 73 0.11 370 2 2 0 0 30
Bellevue 2,336 us 52 @ End IA 0.11 397 0 0 0 . 0 62
..... Ida Grove 2,261 us 59 @ IA 175 0.14 486 x 0 0 0 0 .....
"' Fayette 1,947 IA 150 @ End 520 0.06 202 0 0 1 1
IA 93
Williamsburg 1,807 IA 149; IA 80 6 0.10 347 0 0 2 2
Mapleton 1,647 IA 141; IA 175 13 0.11 375 0 0 0 0
Center Pointe 1,456 IA 150; I 380 10 0.07 231 0 0 0 0
Mitchellville 1,341 us 6· , I 80 63 0.04 150 1 0 0
Woodward 1,010 IA 89; End IA 584 0.06 197 0 0 0 0
141
Calmar 1,008 US 52 @ End IA 434 0.07 258 0 0 150·, IA 24
Peostac 116 us 20 445 0.01 50 0 0 0 0
Aman a c d IA 149/220 0 0 0 0
aSource: References 32-40.
bPercent of state's elderly.
cFlag-stop bus route service available.
dData not available.

113
While this by no means implies a bus line should run through these
cities, it does suggest that transportation access in these areas
should be examined for adequacy if social criteria are applied to
transportation development and regulation.
College Students
A population subset that can be a strong indicator of bus travel
demand (and that represents a population element strongly dependent on
bus service) is the resident student population. Iowa student popula
tions consist of two types: community college and four-year colleges.
Four-year college students generally live on or near a campus away from
their nuclear family home, tend to purchase or borrow transportation,
and travel mostly on weekends and during holiday seasons. In contrast,
community college students tend to travel to and from school on a daily
basis by personal automobile and live in their family home. Their
daily schedules may be quite variable and not consistent with the serv
ice schedule offered by a regular route carrier. Thus, for intercity
bus transportation, four-year college students have a more significant
need for public service and provide the larger demand. After examining
some communities in Iowa, approximate values of 500 full-time, four-year
college students and 1000 full-time two-year community college students
were established as the minimum levels of student population to create
a significant social factor. As Table 7.1 indicates, no communities in
Iowa having this level of student population are without intercity bus
service.
Different types of bus service are generally required by the two
types of students .. Due to the nature of the travel, community college

114
students need a localized or commuter-type bus service, while four-year
college students typically need access to a regional or national trans/
portation system (i.e. , regular intercity 1brrie,rs) . . I
Elderly Persons
As previously cited, the elderly are major users of bus service.
They also are generally low-income, with restricted access to automobile
transportation, and dependent upon others. The question to be answered
is, "How many elderly make a socially significant concentration?".
Since "retired" was listed as an occupation about half as often (40%)
as "student," an elderly population level was based on this student-to-
elderly ratio. If 500 full-time, four-year college students is taken
to be socially significant, then 1000 (or more) elderly persons is a
liberal estimate of social significance. Cities listed in Table 7.1
with more than 1000 elderly and no intercity bus service include Creston, '\,
Perry, Centerville, and Chariton. It is unlikely that 1000 persons
over 65 years of age are going to generate very many trips per person,
but it is a measure of social need.
State Institutions
'· When persons are detained in state institutions, a social need
exists for traveling to and from these institutions. In some cases the
institutionalized person is permitted to travel, but not to drive.
Eldora and Woodward are two communities in Iowa with state institutions
and no intercity bus service.
Major Employers
A large employment complex does not assure any significant demand
for intercity bus service. However, if energy conservation is considered

115
to be a social value, then major employer concentrations create a
potential for commuter-type bus services that may take on a social
character. Des Moines, Cedar Rapids, Davenport, Waterloo, _Dubuque,
Iowa City, Aines, Clinton, Burlington, Ottumwa, Marshalltown, Muscatine,
Newton, Keokuk, Fort Madison, Charles City, Pell~, and Ainana are areas
with candidate employer concentrations. Since 60 miles is often con
sidered a reasonable automobile commuting range and bus service is
typically only half as efficient in time and reliability from the
individual perspective, a 30-mile bus commuting range is a good radius
for seeking concentrations of employees for commuter buses. If em
ployee concentrations and job concentrations cannot be found within the
30-mile radius~ then the presence of a large employer may not warrant
the intercity bus service.
Ridership data on commuter routes serving John Deere employees in
Waterloo and Dubuque indicate that 15% to 35% of the employees who could
ride the service were using it [41]. Based on data from the East-Central
Iowa Council of Governments, the researchers have estimated that on
four of the routes serving the Ainana Refrigeration Industries, approxi
mately 17% of the eligible factory workers are using the commuter
service [42].
Off setting Factors
Two other factors that should be considered in weighing the evalu
ation of the social value of providing bus service to a community are
presence of a county seat of government and location at a major highway
crossroads. Being a county seat does not make a community socially
significant, except within its own county, but if a community has other

116
indications of social significance and is not a county seat, some lesser
importance must be associated with the other factors. Anything that
dissipates the focus of social interaction in an area reduces the social
urgency of providing intercity bus service.
A major highway crossroads is desirable to·permit both north-south
and east-west routing of bus service. If this is not possible, then
the social interest in bus service has to be examined from a hub-and-
spoke route pattern. The hub at which directional travel may change
must be examined for importance to the social need identified. For
example, if Creston and Chariton were communities targeted for needing
social interaction, but the intercity bus routes provided through a
regulated structure were Creston-Des Moines and Chariton-Des Moines,
the indirectness of this hub-and-spoke pattern would substantially
reduce the social value of such a bus service.
Adequate Service
No literature documents a definition of adequate service for
social-welfare purposes. Flag stops are not adequate, because the
persons considered to be in social-welfare need will neither tolerate
' nor utilize flag stops. Some have argued that to be socially adequate,
a morning and evening connection should exist in each direction of
service (i.e., two departures per day in each of four directions).
Denison is the only city smaller than Muscatine with such a level of
bus service. If this concept of service is even remotely correct, then
only the larger Iowa cities have sufficient intercity bus services to
be socially attractive.

I
117
Case Study Examination
Southeast Iowa
In examining all of the social-welfare factors mentioned, one
corridor appears to have some merit for consideration of increased bus
service. The Iowa City-Washington-Mount Pleasant-Fort Madison north
south corridor has strong aggregate social merit, even though it does
not have any single isolated social need previously mentioned. Mount
Pleasant has east-west bus service, a four-year college with more than
500 studen.ts, and a state resident institution. Fort Madison has a
major state institution and has north-south service. Iowa City has
major east-west service, unique state social service facilities, and
excellent bus connections to the north. Washington has limited east
west service. All of the communities have more than 1000 elderly
persons. North-south service in this corridor would create four-direc
tion bus service in all of the cities and would permit direct bus travel
for socially relevant. needs. Whether or not these needs would generate
actual travel can only be determined by an economic demand estimate.
This is one corridor, however, wi~h a combination of socially important
travel needs.
Southwest Iowa
Creston sits in a unique location surrounded by corridors of rela
tively high levels of intercity bus service. Interstate 80 north of
the Creston area, Interstate 35 on the east side of the area, and the
US 71 and 275 routes west of Creston provide a reasonable level of
service to communities along those corridors. A study conducted in the
early 1970's identified the degree of social and economic isolation of

118
Creston· as a regional center community [43]. However, in terms of the
social indicator values outlined in this section, it has only population
(8,234 in 1970) and number of elderly (1,589 in 1970) in its favor.
The student population in the area results from a small community
college only. Creston is a county seat, but it·is not located on a
major highway crossroads. No large employer or state institution is
there. Thus, the social value of intercity bus service to Creston must
be considered in the context of a more regional system along US 34
between larger hubs.
East-Central Iowa
A corridor from Iowa City-Cedar Rapids-Waterloo-Mason City is
another interesting area to examine for its potential social value for
intercity bus service. In the general area, there are major social
service facilities and a large university at Iowa City, an institutional
facility at Anamosa, an institutional school at Vinton, a large univer-
sity at Cedar Falls, a small college at Waverly, large community col-
leges in Cedar Rapids, Waterloo, and Mason City, and large employers in
Iowa City, Cedar Rapids, Waterloo, Cedar Falls, and Charles City.
' Certain short shuttles between high concentrations of activity
also exist. Cedar Rapids and Iowa City are within 30 miles of each
other and offer an opportunity for a high accessibility bus corridor
for either employment or social services. Independence, Waverly, and
Cedar Falls are all within 30 miles of Waterloo, which fits the criteria I for shuttle bus access to Waterloo for employment and education. Clear
Lake and Mason City have the potential for a more limited commuter-type
bus shuttle corridor, perhaps for employment and education. This
)

I
I
119
segmented analysis then leaves a corridor with nodes at Iowa City,
Cedar Rapids, Waterloo, and Mason City. This service may tie the
localized intercity services having a social value to the larger hubs.
In this study, intervening communities, such as Vinton and Charles
City, must be examined for their social.value and economic potential
along a corridor already justified by the presence of much larger or
more dominant communities.
Summary
In examining these three different regional corridors from a
social value perspective, a heuristic pattern of analysis has been
illustrated. No definite social value scale or welfare index can be
constructed. The general and approximate guidelines presented in this
section can be applied to a single community to identify the character
istics that may contribute social value to intercity bus service. A
more useful application of these ideas is to examine a series of com
munities within a corridor to provide some insight into the social merit
of providing services to communities along the corridor. In any case,
the reader is cautioned to bear in mind that no part of this analysis
is based on primary (first-hand) data for Iowa.
\ I j
I.
! •
121
8. CASE STUDY ANALYSIS
· The procedures for estimating ridership in a corridor and operating
costs were discussed in Sections 5 and 6, respectively. Section 7
identified social, community, and other locational factors that should
be considered for route evaluation. That section·also detailed charac-
teristics of selected corridors throughout the state. In this section
the analysis is completed by applying the revenue and cost models to
specific corridors. The principal case study involves service to an
area not presently served. A second analysis shows the calculations
for an existing route.
Analysis in a New Service Corridor
The corridor selected for analysis was a north-south service area
from Mount Pleasant to Iowa City and Cedar Rapids. Mount Pleasant, the
county seat of Henry County, has only eas.t-west bus service provided by
Trailways (American Bus Company), operating between Burlington and Des
Mo-ines. East-west rail passenger service is also provided by Amtrak.
The commlln.ity of 7,000 is the home of a private college, as well
as a state mental health institution. A northerly route is particularly
relevant to serve the needs of these institutions. Iowa City, located
50 miles north of Mount Pleasant, is the home of the University of Iowa
Medical Center and the University of Iowa. Service connections between
the Medical Center and the Mental Health Institute had been recommended
previously during informal discussions. The continuation of service

122
to Cedar Rapids would provide access to the largest regional center in
the area.
Selection of Route
Transit service between Iowa City and Cedar Rapids is now provided
by Missouri Transit and Trailways; the more extensive service is by
Missouri Transit. The most feasible method of acquiring service in the
new corridor was the diversion of an existing run to this corridor.
The route analyzed considered an operation originating in Ottumwa and
served by Missouri Transit. Missouri Transit currently has one round
trip each day between Ottumwa, Iowa City, and Cedar Rapids and a second
round trip taking a more direct route between Ottumwa and Cedar Rapids,
but not connecting to Iowa City. Within these corridors, the only city
that has a population of over 5,000 or is a county seat is Sigourney, a
county seat with a population of 2,300. One proposal is to divert the
Iowa City run from Sigourney to a Mount Pleasant corridor. The proposed
route would run from Ottumwa on US 34 to Fairfield, a county seat
community of 8,700, and continue to Mount Pleasant. The trip would
continue north on US 218 to Ainsworth and then divert west eight miles
on IA 92 to serve Washington, another county seat with a population of
6,300. IA 1 would be used to complete the trip to Iowa City and Inter-
state 380 could be used from there to Cedar Rapids.
Demand Estimation
Factors in Demand Model
The three components for the demand estimation were the bus-miles
of travel, the corridor population, and the population at the destination.

I
, I
. I ~
123
These data are summarized in Table 8.1. For the demand model, all
variables are expressed in thousands. Corridor populations count only
those cities with 5,000 or more persons, or cities serving as the
county seat. Bus-miles were approximated by the expression
Annual bus-miles = 365 x one-way road miles x 2 1000
This assumes one round trip daily. Road miles were taken from the
state road map.
Passenger Demand Equation
Based on the demand model for a single round trip (Eq. 5.1)
PASPFR = .-0.1 + 0.050 BM + 0.041 POPJ + 0.056 CORPOP
so
PASPFR = -0.1 + 0.050 (100.7) + 0.041 (29.6) + 0.056 (75.0)
That is, the expected ridership would be 10,400 per year.
If one were to consider the impact of a second daily trip in the
same corridor, the bus-miles value would need to be adjusted. Refer-
ring to Table 5.6, the bus-mile adjustment factor for new routes when
going from 1 to 2 is 0.62. The adjusted bus-miles would be 0.62 (100.7)
= 62.4. Therefore.,
PASPFR = -0.l + 0.050 (62.4) + 0.041 (29.6) + 0.056 (75) = 8.4
Since there are now two trips, the new passenger estimate is 16,800.
The additional run would increase the ridership approximately 62%, if
the route represented the only service throughout the corridor.
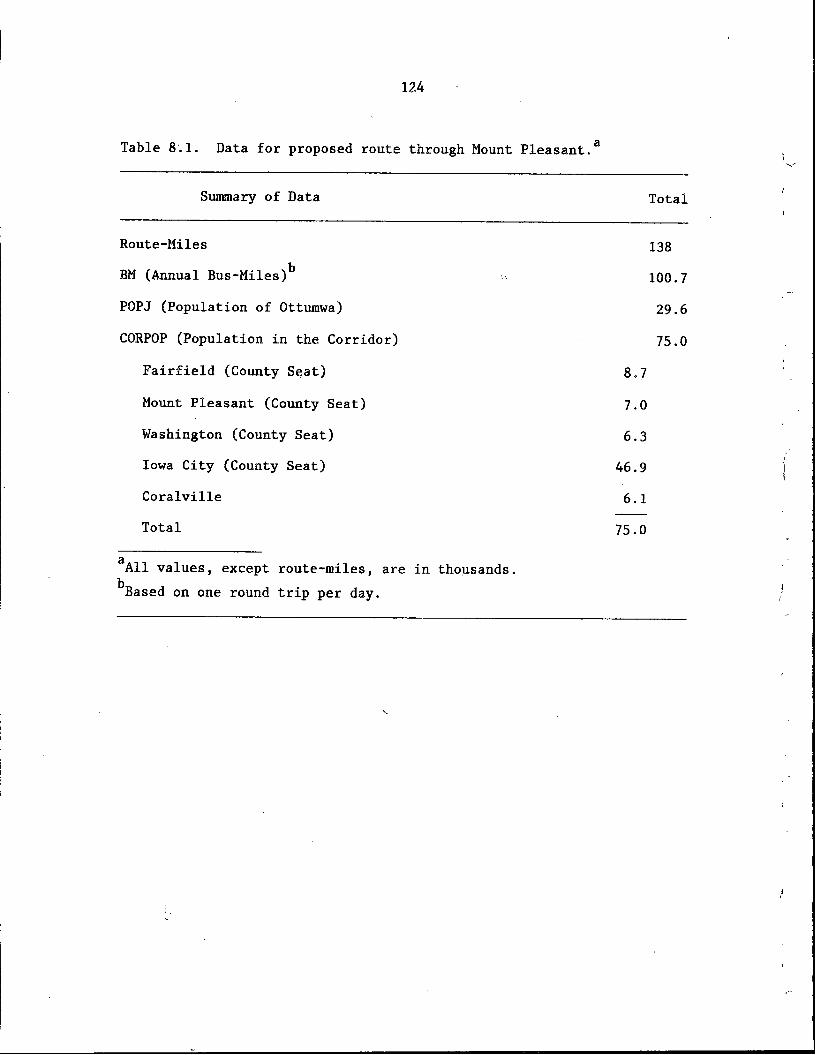
124
Table 8 .1. a Data for proposed route through Mount Pleasant.
Summary of Data
Route-Miles
BM (Annual Bus-Miles)b
POPJ (Population of Ottumwa)
CORPOP (Population in the Corridor)
Fairfield (County SP,at)
Mount Pleasant (County Seat)
Washington (County Seat)
Iowa City (County Seat)
Coralville
Total
aAll values, except route-miles, are in thoµsands.
bBased on one round trip per day.
Total
138
100.7
29.6
75.0
8.7
7.0
6.3
46.9
6.1
75.0

125
Passenger Revenue
The passenger revenue would be estimated by calculating the average
trip length and multiplying by the average fare per mile.
where
The average trip length is (Eq. 5.7)
Average trip length (miles) =
:l. POP . x DIST ..
.L j
J 1J
POP. J
POP. =population of cities in the corridor over 5,000, or J
county seats
DIST .. =distance in miles along the route from the origin 1J
city (largest end-point city) to the city in question
The distances from Cedar Rapids to the other cities are: Iowa City and
Coralville (28), Washington (59), Mount Ple_asant (90), Fairfield (112),
and Ottumwa (138). Using these values and the populations from Table
8.1, the average trip length is 72 miles.
The average fare for Missouri Transit operations in Iowa in 1980
was determined to be $0.075 per passenger-mile. On that basis, when a
single round trip is offered,
Annual passenger revenues = $0.075 per passenger-mile x 10,400
passengers x 72 miles = $56,160 or $56,000.
Express Revenues
The express revenue components were more difficult to identify on
a route basis. A first approximation may be based on the data in Sec-
tion 5. In this case, the Missouri Transit overall express revenues

126
were noted to be approximtely 30% of the passenger revenues. This
value was also the average recommended for calculation if the carrier
had not been specified. On this basis,
Annual express revenue= $56,000 x 0.30 = $16,800 or $17,000
Therefore, the total revenue would be $73,000 for this run.
Other Considerations for Revenue
This case study has posed the possibility of diverting an ex.isting
run from a lower density corridor to the study corridor. Portions of
the existing run and the new run have common segments. In this case,
not all of the revenues calculated would be new.
The existing route through Iowa City passes through Sigourney
(population of 2,300, located 84 route-miles from Cedar Rapids). The
demand model would estimate a total of 8,500 persons using this route.
The average trip length is 60.5 miles. The lower demand and shorter
average trip length on this route indicate that a relatively greater
portion of the activity would be centered in the Iowa City-Cedar Rapids
corridor, because of the lower density on the route extension. The pas
senger revenue on that route would be $39,000, the freight revenue would
be $12,000, and the total revenue would be $51,000. It is estimated,
therefore, that by switching to the more populous corridor, a net gain
of $22,000 would be realized. The tradeoff requires an increase in bus
miles, from 85,400 to 100,700. If the costs do not exceed the revenues,
or if other community benefits are sufficient to justify the change, the
service in the corridor should be pursued.
' ,.-
I

127
Cost Development
The Cost Model
The cost estimation model determines future cost on the basis of
present cost patterns, adjusted by consumer price index changes. The
model was given in Section 6 as
Unit operating cost= (A)(M)(CR + CT+ CW+ CF + CD)
The terms were previously defined and the example calculation was given
to determine the multiplier M for the period June 1980. The multiplier
estimated the June 1980 costs to be 1.13 times the 1979 levels.
If Missouri Transit is considered the provider, the latest unit
costs for that carrier would be determined. In 1979, these were deter-
mined from the annual report:
CR= repair to revenue equipment = $155,188/1,883,180 = $0.0824/mile
CT = tires = $29,791/1,883,180 = $0.0148/mile
c = w drivers' wages = $494,493/1,883,180 = $0.2626/mile
CF = fuel = $174,064/1,883,180 = $0.0924/mile
CD = depreciation = $76,938/1,883,180 = $0.0409/mile
$0.4931/mile
The total unit cost for June 1980 would then be
C = 1.96 (1.13)($0.4931) = $1.09/mile
where the 1.96 factor is A for the smaller category group. The unit
cost value can be compared with the $0.92 per mile value experienced in
1979.

128
In case the analyst is examining only general cost levels, not the
cost for a particular company, an average cost may be determined. For
example, Table 6.2 summarizes the components of costs for all carriers.
The bus-miles traveled by Iowa Coaches, Midwest, Missouri, and Scenic
Hawkeye, were (in thousands) 946, 908, 1,883, and 1,134, respectively.
The unit costs for these carriers were $0.55, $0.55, $0.49, and $0.48.
The unweighted average is $0.52. Using this, one would expect the
average total cost for a carrier in this group to be
C = 1.96 (1.13)($0.52) = $1.15/mile
Total Cost Calculation
The total costs for operating the proposed Missouri Transit route
and the current route are shown in Table 8.2. The forecasts show that
the proposed route would be beneficial when one examines the incremental
changes. The incremental revenues exceed the costs by $5,300. The
unit revenues for the entire route are improved by 20%. Overall,
however, the proposed route still generates revenues less than the
fully allocated cost of operation. From the company's viewpoint, the
' route change would still be advantageous because of the additional
revenue and the potential to connect the new riders with other longer
trips. From the regulator's viewpoint, the cost and revenue tradeoff
must still receive·attention. Even if only the direct operating cost, /.
estimated to be approximately 75% of the total unit cost, were assigned
to the route, the expenses would be $82,300, which still exceeds the
total route revenue. Passenger and freight rate increases of 13% would
be needed to cover even these costs.

Table 8.2. Revenue and cost comparisons for proposed route.
Existing Route Through Sigourney
Proposed Route Through Mount Pleasant
Incremental Increases (Differences Between Proposed and Existing Routes)
Bus-Miles
85,400
100, 700
15,300
Revenue (Dollars)
51,000
73,000
22,000
Cost (Dollars)
93,100
109,800
16,700
Unit Revenue
(Dollars Per Mile)
0.60
0. 72
0.12

130
Additional Service Considerations
The integration of the propos~d route into an existing run must
also address schedule coordination. The proposed route is 20 miles
longer than the existing service and, in one direction, would have to
connect with another run. This can be accomplished by reducing the
number of intermediate stops. Station stops on this route are recom-
mended only in the communities included in the corridor population
component, plus Kalona. Kalona, with a population of 1,600, is located
at the intersection of two state highways and is on the direct path of
the bus.
Another factor to be addressed is the pote~tial conflict between
carriers. Trailways currently serves east-west travel from Burlington
to Des Moines, including the corridor from Mount Pleasant to Ottumwa. I I
Trailways may object to the proposed service, indicating unfair compe-
tition. In reality, the two operations are not serving the same demand,
but a second alternative could be examined to evaluate the potential
for Trailways to provide the north-south service. In this case, a
possibility is to divert one of two runs going from Burlington to Iowa
' City through Muscatine. This route would become a Burlington-Mount
Pleasant-Iowa City operation. The potential benefits for this alter-
native would certainly be lower, because Muscatine, a city of 23,000,
would have reduced service. The two towns receiving additional service
have a total population of 13,000. Furthermore, the operating costs
for this carrier would be higher than they would be for the Missouri
Transit operation.

131
Validation of Ridership Estimates
There are no data available to verify the accuracy of demand in
the corridor, but some guidance is given by past experience. The
demand model estimated 8,500 passengers for a single round trip on the
existing route through Sigourney. The carrier's_ data indicated that
the northerly run served 3,050 persons in 1979. The southerly run in
this corridor aggregates all operations from Cedar Rapids to Springfield,
Missouri, but the researchers estimated Iowa intrastate ridership on
the basis of the carrier's input. Based on those data, a combined
total of 7,000 riders was estimated in the corridor. Therefore, the
forecast is approximately 21% higher than the estimate. However, a
second, shorter trip is available between Cedar Rapids and Ottumwa that
does not serve Iowa City. Part of the total corridor demand is accommo
dated on that run, rather than the Iowa City run. The volumes could
not be determined, but overall, the model appears to be representing the
volumes in the corridor satisfactorily.
Analysis in an Existing Corridor
A second corridor is briefly analyzed here to show the application
of the models in a corridor with existing service. Only minor adjust
ments are needed. The principal difference is that known demand and
costs are used as the base.
The corridor selected is the Cedar Rapids to Mason City corridor
served by Jefferson Lines. The principal cities served in the corridor
132
are Vinton, Waterloo, Cedar Falls, Waverly, and Charles City. The
relevant community and travel characteristics in this corridor were
discussed in Section 7. The bus demand data on one route were avail-
able, but the total demand is not known because of routing variations
in the corridor.
Existing Travel in the Corridor
Travel in the Mason City to Cedar Rapids corridor is not as clearly
defined as would be desired, because there is not a true balance in the
service. Jefferson Lines summarizes the passenger data by links within
major corridors. The links appear as run n'ilmbers in the Russell's
Guide schedules. To obtain round-trip information in the corridor, it
is necessary to combine two or more runs. Runs 201 and 202 can be
combined to show round-trip activity in the Mason City to Waterloo I I
corridor. A second daily connection between the cities is possible in
each direction, but a transfer is necessary. In addition, the runs are
not strictly equivalent because the southbound runs begin or end in the
study cities, but the main northbound run terminates in Minneapolis,
Minnesota, thereby confounding the passenger and revenue mix. The '-
picture is further clouded because of other imbalances in the service.
In particular, Mason City may be reached from Waterloo three times each
day, but the reverse movement is possible only twice each day. Since
it was impossible ·to segregate the reported data for all runs partially
covering the corridor of interest, the analysis is based on the single
round-trip combination clearly reported, i.e., Runs 201 and 202.

-------~-------------------------------.
133
Demand Analysis
Although the passenger volumes are known for the routes considered,
it may be useful to compare the given data with the demand model. The
corridor characteristics are summarized in Table 8.3. The estimated
demand is
Annual passengers = -0.1 + 0.050 (109) + 0.041 (39)
+ 0.056 (135) = 14.5
The forecasted number of passengers is 14,500, compared to the reported I
value of 14,000, resulting in an error of 3.5%. The accuracy of this
estimate is partially a reflection of the fact that this route was one
of the 11 considered in the calibration phase.
I \ I Expanded Service Projection
Considering a second daily round trip'· passenger demand would be
based on the known condition and then adjusted using Fig. 5.1. The
equation is I ;
PAS = PAS x (adjusted factor) p e (5.5)
From Fig. 5.1, the adjustment factor when going from one daily trip
to two is 1.60. Therefore,
PAS(2) = 14.0 x (1.60) = 22.4 or 22,400
Passenger and express revenues would be expected to increase by the same
ratio. One should note that this route has significantly higher express
revenues than does the average route. The ratio of express revenues
to passenger revenues (0.76) was significantly higher than the average

134
Table 8. 3. T·ravel characteristics for the existing route case study. a
Summary of Data
Route-Miles
BM (Annual Bus-Miles)b
POPJ (Population of Mason City and Clear Lake)
CORPOP (Population in the Corridor)
Vinton (County Seat)
Waterloo Area
Waterloo
Cedar Falls
Evansdale
Waverly (County Seat)
Charles City (County Seat)
Total
PAS (Passengers on Runs 201 and 202)b . b
Passenger Revenue
b Express Revenue
Passenger-Milesb ,_
aAll values except route-miles are in thousands.
bThese data were provided by Jefferson Lines.
145
109
39
135
4.9
73.0
33.1
5.0
7.3
9.1
135
14
68
52
1082
135
for all companies (0.30), and even much higher than the average for all
Jefferson runs (0.45).
Trip Length Comparison
The average trip length may be estimated from the data in Table
8.3 to be
Trip length = passenger-miles = passengers
Using the trip length model (Eq. 5.7)
l: POP. x DIST .. Trip length = j J 1J
l: POP. j J
1082 14 = 77 miles
The trip length was estimated to be 83 miles. This error is less than
8%. The trip length variable, however, is not needed because the
passenger and freight revenues are known.
Data Expansion
In many cases, it is not possible to obtain complete annual data,
but samples may be obtained for special analyses. For example, Grey-
hound may sample two-week periods, three to five times during a year,
to monitor the flow in a particular corridor. Expansion of sampling
data to obtain meaningful annual data is possible if it can be estab-
Hs·hed that the time period sampled represents a consistent portion of
the larger unit of measure. Table 8.4 presents the monthly distribu-
tion of passengers as determined from several independent sources. The
monthly variations between carriers were tested using an analysis of
variance model. The test showed that there are significant differences
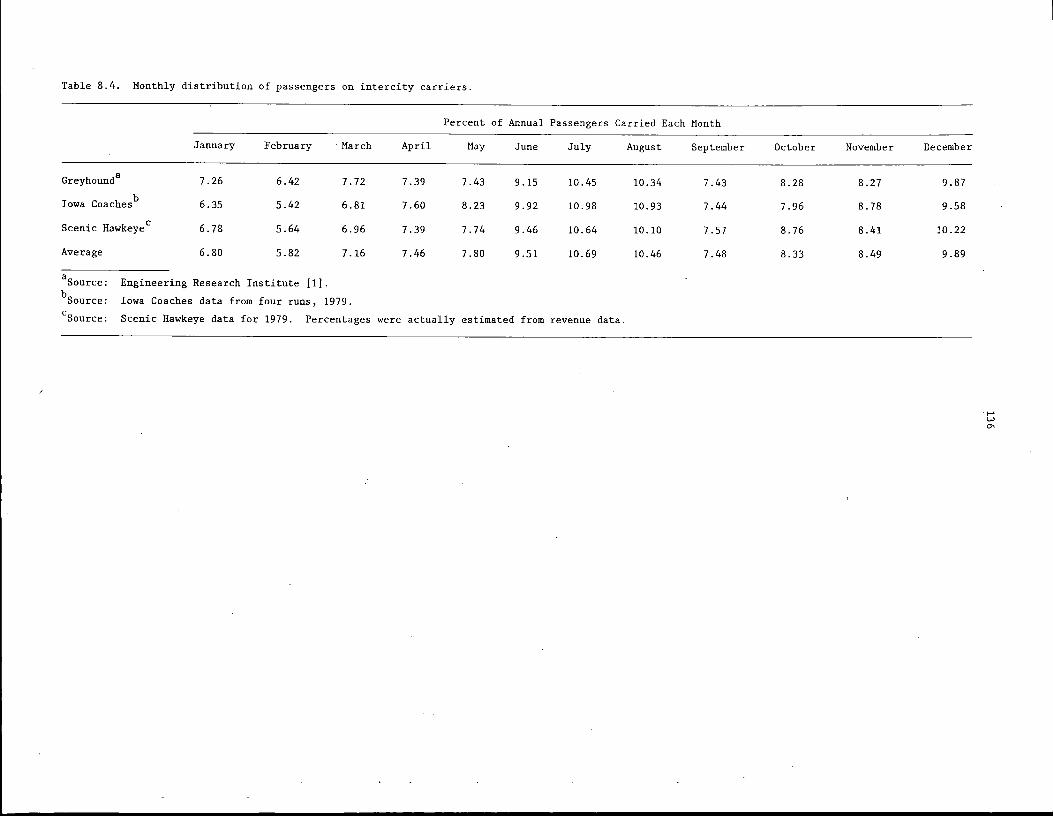
Table 8.4. Monthly distribution of passengers on intercity carriers.
January February March
Greyhound a 7.26 6.42 7.72
Iowa Coaches b 6.35 5.42 6.81
Scenic Hawkeye c 6.78 5.64 6.96
Average 6.80 5.82 7.16
aSource: Engineering Research Institute [1].
bSource: Iowa Coaches data from four runs, 1979.
Percent
April May
7.39 7.43
7.60 8.23
7.39 7.74
7.46 7.80
of Annual Passengers Carried Each
June July August
9.15 10.45 10.34
9.92 10.98 10.93
9.46 10.64 10.10
9.51 10.69 10.46
cSource: Scenic Hawkeye data for 1979. Percentages were actually estimated from revenue data.
Month
September October November December
7.43 8.28 8.27 9.87
7.44 7.96 8.78 9.58
7.57 8.76 8.41 10.22
7.48 8.33 8.49 9.89

: I
137
between months of the year (a= 0.05), but that there were no signifi
cant differences between the carriers. Thus, an average factor for each
month could represent the portion of the annual value in that month,
regardless of the carrier being examined.
Cost Development
The extrapolation of costs would be accomplished in the same
manner as demonstrated in the first case study. The only difference is
that. ~efferson Lines is an ICC Class I carrier, and the adjustment
factor would be 2.27.
Other Service in the Corridor
The general Waterloo-Cedar Rapids corridor was of special interest
to the Iowa Department of Transportation because of the special interest
in the commuter service to the John Deere Plant in Waterloo. Those
commuter operations were more fully detailed in Section 4. The Jeffer
son commuter services were incorporated as part of Runs 201 and 202,
but in other runs, the commuter data stand alone. The May 1980 data
indicated the passenger revenues were averaging $0.82 per mile. This
compares favorably with the passenger revenue of Runs 201 and 202
($0.78) for the same month. The significant difference is that the
regular routes generate another $0.52 in express r~venues that the
commuter service does not obtain.
Summary
The case study examples demonstrated the application of the reve
nue and cost models. These models may be used in conjunction with the

138
evaluation of the community factors discussed in the previous section
to help determine benefits that may accrue in a corridor. The models
provide consistent results and help determine economic benefits, but
there are no easy formulas for combining costing elements with community
factors to arrive at a quantified decision. This responsibility still
resides with the policy makers.

139
9. ADDITIONAL SERVICE CONSIDERATIONS AND RECOMMENDATIONS
One of the objectives of the federal financing program relating to
intercity buses was to consider funding for initiation, improvement or
continuation of intercity bus service. This report has developed a
methodology for estimating potential demand for new or adjusted services,
and the costs of providing those services. In addition, evaluation
criteria that go beyond the financial considerations have been offered
and discussed in relation to existing and potential service corridors
in Iowa.
The scope of the research did not directly orient the study toward
the many other aspects of concern in today's operating environment.
For example, the study does not directly evaluate the reasonableness of
a particular fare, the potential for coordinating the regional transit
systems to provide service if a regular route line is abandoned, the
implications of requiring more data or less data from the carriers, or
the effect of certification procedures on the owners' decisions about
service. Yet, during the course of the study, as the researchers dug
through files, visited with private management and state planners and
regulatory personnel, and analyzed the operations, many additional
insights were obtained that were not included in the modeling or com
munity evaluation phase. The factors are grouped in the general cate
gories of service characteristics, data systems, and carrier-government
interaction.

140
Service Factors
The effect of service frequency on passenger volume is directly
assessed in the demand model. Other factors, such as fares, fare per
mile, relative travel time between automobile and bus, or time of day,
were not identified as statistically significant variables in demand
analysis. One cannot conclude from this, however, that these factors
do not affect individual decisions. One can more likely explain .the
absence of the variables on the basis of the data set used. In the
study, the researchers examined cross-sectional data, i.e., data from
several carriers at a single point in time. Thus, for example, .even
though there are variations in route fares between companies, the
analysis does not examine the effects of changes in ridership ·on a
specific route with changes in fares on that route over a period of
time. To that extent, any interpretation is limited by the degree to
which the aggregate, cross-sectional data are comparable to time series
data for a sing!.e car-rier. With that proviso, the following observa
tions were noted regarding fares, time of service, and speed.
Fares
Using the corridor data, the price elasticity of demand was deter
mined to be approximately -0.80, if only fare is considered. This
indicates that a 10_% increase in fare would result in an 8% decrease in
ridership. This relationship is only suggestive of the possible order
of magnitude because other relevant factors, such as frequency and
distance, are not included. If one examines fare and distance in
combination, the fare elasticity moves to -1.20; or if fare and

141
frequency are taken together, the fare elasticity is +0.40. The latter
indicates that under a given service condition, the ridership would
increase with increasing fares. This is intuitively incorrect and
appears this way only because of the intercorrelations in the cross-
sectional data set.
The only safe conclusion to make regarding the fare increases on a
route is that these data for a single point in time are insufficient to
make a valid assessment. The -0.80 elasticity is the same general
order of magnitude as the -0.60 value offered by Burkhardt and Lago
[15]; but in order to make truly accurate statements, the ridership
changes would need to be examined on individual routes over time while
controlling for other decision variables, such as the costs of competing
modes.
Perhaps the greater concern should be the effect fares might have
on the operating policies of the individual company. An examination of
the allowable rate structure of Midwest Coaches and Scenic Hawkeye is
enlightening. Both of these carriers are ICC Class II carriers operat
ing with small but major routes crossing state boundaries. Midwest
is based in Minnesota; Scenic Hawkeye is based in Iowa. In each case,
the allowable fare per mile rates on interstate movements are approxi
mately 50% higher than for intrastate movements. The states have
scrutinized rate increase requests carefully while presumably trying to
protect the communities from arbitrary and unnecessary rate increases;
the ICC has more frequently allowed the increases to take effect. In
effect, the interstate routes are paying a higher proportion of the
total system operating costs.

142
In the long run, this imbalance may actually create a situation in
which some state residents lose, rather than gain, in the process. The
following scenario describes the problem. Consider a carrier with one
route serving only intrastate trips. This route provides connecting
service to other carriers, but the unit revenues .. :are only 70% of the
average unit costs. A second route serves an equal-length interstate
corridor. Because of the higher allowable fares in this corridor, the
route generates revenues exceeding costs by 5%. If the company contem
plates increasing service in one of these corridors to generate more
!evenue, the corridor to be selected is obvious. If the company has not
generated sufficient profits to purchase the necessary rolling stock,
the service in the intrastate corridor may be in jeopardy. Significant
pressures may be placed on the state to abandon this unprofitable route
so the equipment can be used in .the higher return corridor. The intra
state corridor would then go from the lower-priced service to no service
at all. The Transportation Regulation Board must examine the restricted
intrastate fare structure from this viewpoint when considering the im
pacts of differential rate increases for interstate and intrastate routes.
Service Hours
The routes included in the analysis were almost _exclusively operat-·
ing between 6:00 a.m. and 9:00 p.m. No noticeable service hour factors
were identifiable in those routes, but Jefferson Line data on other
runs did provide some interesting insights.
A total of 16 northbound and southbound runs operate through Des
Moines between Kansas City and Minneapolis. Although, as expected, the
runs beginning during the period 6:00 p.m. to 6:00 a.m. have lower

143
ridership rates than other prime-time departures, the average differ
ence was only 10%. Even when departures are grouped between 10:00 p.m.
and 6:00 a~m., ridership on these off-hour departures averages only 25%
less than the other departure times.
This variation suggests that off-peak hours ··can still have substan
tial use. This interpretation, however, must be constrained to rela
tively long distance runs where departure time from any one city is not
crucial to the decision to make the trip. Certainly a run from Iowa
City to Des Moines at 11:00 p.m. would not be an attractive alternative
for most travelers.
Travel Time
One of the points noted in the Jefferson data was that a Kansas
City northbound run to Des Moines beginning at midnight served approxi
mately 90% as many passengers as a similar run beginning about noon.
The substantive difference in the schedule was that the noon run had 10
stops, plus three flag stops. The midnight run stopped only to discharge
passengers as needed at the 10 stops. Travel time was thereby reduced
45 minutes, or 16%. Jefferson Lines has recognized the attractiveness
of the express runs and has scheduled a regular limited-stop express run
from Kansas City to Minneapolis.
Systems Data
The most consistent complaint among researchers and planners is
that there are insufficient data to do a more thorough evaluation. In
spite of the fact that the certified carriers are required to submit
144
annual reports (which may be in excess of SO pages), the "appropriate"
data are often not available, or they are incomplete or inaccurate. On
the other hand, the carrier generally feels the data-reporting burden
is excessive and questions whether the data are ever used.
General problems with data reporting are knq~n to planners and
operators alike. The review in this section identifies only selected
specific items related to the Iowa reporting system.
Bus-Miles
The analysis of regular route operations should be premised, to
the maximum extent possible, on the data related to the regular route
portion of the total service. The cost elements for regular route serv
ice are not directly identifiable because equipment, facilities, and
even personnel are interchanged between the typical major activities of
regular route and charter service. However, the revenue data can be,
and are, identifiable by service category .. Therefore, unit revenues
(dollars per mile) can be calculated separately for these major cate
gories. Unfortunately that is true only at the system level and not at
the state level, because the supplemental Iowa report does not specify
bus-mile data by type of operation. Therefore, variations in unit reve
nues for charter and regular route services can be analyzed only at the
total system level. It is recommended that more complete identification
be required in the state report, with state regular route miles listed
apart from total state mileage.
Passenger-Miles
The same observation related to bus-miles is applicable to passen
ger-miles. A great deal of effort is expended by some, but not all,

145
carriers to tabulate passenger-mile data on routes, but the relevance
to the planner is lost when charter and regular route data are simply
aggregated.
The relevance of the passenger-mile data is also suspect because
not all carriers feel they can justify expending the resources needed
to develop this factor. In at least one case, the passenger-mile esti-
mate was determined to be simply passenger revenue divided by an·esti-
mated systemwide average fare per passenger-mile. Such a system does
not allow the analysts to make any distinctions regarding the relative
usage in the state beyond what can'be interpreted from the revenue data.
It is~felt that overall, the data collection costs could be reduced
and the data quality could be improved by using a sampling procedure.
Companies would not continually monitor each regular route; but instead
would sample each route for a two-week period, three to five times per
year, and extrapolate these values on the basis of past experience or
on the factors given in Table 8.4. A suggested sampling schedule would
include two weeks in February, May, July, and October. This schedule
would allow an examination of seasonal variations. The seasonal samples ,
could be extrapolated to annual totals based on the data in Table 8.4.
The time saved by reducing the sampling load (at least for those car-
riers currently keeping daily records) could possibly be used to sample
other data elements desired for planning purposes, such as limited
origin-destination ticket sampling.
Charter passenger-miles should be monitored continuously, because
the demand fluctuations are likely to be greater than for regular
service.

146
Reported Expenses
Expense item swnmaries on the Iowa supplemental report are mis
leading because not all carriers include the same expense items. All
carriers report the 4000-series expenses, but some carriers have also
included the 5000-series data for depreciation, amortization, operating
taxes, and rents. From year to year, an individual carrier may even
change the reporting method. The state form should be adjusted to
clarify the precise values desired. It is recommended that both the
4000 and 5000 series be included in the swnmary.
Other Carrier Input
Throughout the study, the carriers were generally most cooperative
in providing operating details, as well as general input regarding
their operations and their interactions with the Department of Transpor
tation. There were no formal surveys or unofficial tallies, but the
following comments highlight some elements affecting thr: operations of
the carriers.
Data Requirements for Rate Analysis
The carriers' willingness to share data seemed to be strengthened
by their desire to show that there were no capricious efforts to hide
revenues or exaggerate costs when requesting rate increases. This was
noted during initial contacts with ·the carriers, which occurred shortly
after the Transportation Regulation Board had denied a rate increase for
the smaller carriers. After a preliminary review, the board had re
quired the carriers to submit monthly revenue statements for a previous

147
year by ·source (passenger, charter, and express) and by origin (Iowa or
interstate), and expense statements attributable to Iowa intrastate
service. The statements were to include an allocated revenue and ex
pense statement "itemized in detail by each function performed by the
carrier, and the basis for each allocation," and more. These data had
to be received at the state offices nine days following the date of the
request!
Since most companies do not file records in a manner suitable for
direct reporting and do not have computer retrieval systems, they could
not provide a response in the time frame expected. Only Jefferson and
Greyhound were able to provide the data and only those companies were
allowed to increase the passenger rates at that time. The smaller
carriers felt their needs were at least as great as the needs of the
larger carriers, but they were rejected because of the inability to
generate data.
To improve the understanding between planners, regulators, and
operators, each must be more familiar with the needs and capabilities
of the other. This information exchange is accomplished to some degree
when government personnel meet with the carriers' association. However,
it is recommended that one-on-one meetings be held. An excellent
organizational framework already exists in the Iowa Public Transit
Division to accomplish this direct contact. District managers now have
responsibility for contacting urban and regional transit operators
within specified areas of the state. These contacts should be expanded
to include the intercity operators. State personnel should visit each
carrier at least twice each year at the local operating office to review

148
associated problems and progress. This should be a meaningfql exchange
mechanism to improve state-carrier interaction.
Vehicle Certification
Safety must be a high-priority item in transportation systems.
However, two different carriers expressed dismay ·over the length of
time required to certify a vehicle for service. One carrier noted that
it took eight weeks to get a new vehicle certified; neither details nor
explanations for the d~lay were provided. Again, improved communica
tions are necessary to reduce this problem and the delay. Interest pay
ments alone during a two-month period may be $3,000 for a new bus, and
such a delay affords no opportunity to use the vehicle to recoup those
costs.
The Iowa Department of Transportation, working with the counties,
has now developed a program to significantly improve the vehicle certi
fication process. Carriers may now complete the application process in
one day.
Route Certificate Costs
The commuter carriers were asked to identify special start-up
costs, including licensing and legal fees_. In general, theae costs
were not identified as factors reducing the carrier's willingness to
pursue an operation. However, one carrier discussed the fact that the
$400 filing fee ($350 of which would be returned if no hearings were
required) was part of the reason for not seeking permanent operating
authority on a commuter route.

149
Ticket Agents
The final element to be discussed reflects the value of the local
agent as a representative for the carrier. A general consensus is that
the ticket agent, along with the driver, may be the most important
person in a company because he or she is in direct contact with the
customer. The ticket agent, however, is in many cases providing the
facility more as a community service than as a business venture. In
small communities, the commissions earned are miniscule compared to the
frustrations encountered. Bus operators must involve city business
bureaus and/or governments in identifying a local business willing to
undertake the agent's role. Service to the community could be lost or
reduced to flag-stop status unless that role is performed by someone in
the city.
The potential effectiveness of the agent is best demonstrated by a
case reported by the management of Midwest Coaches. After a new agent
was selected in a particular community, the revenues from that community
increased approximately five times from the previous level. Unlike
typical bus-stop locations, such as restaurants, drugstores, or gasoline
stations, this agent did not have frequent peak-period demands in his
own business to prevent him from giving attention to the bus customer.
On the contrary, low-demand periods did exist and the agent took those
opportunities to call potential customers to acquaint them with the
services. The effectiveness of the effort is clear and the example
helps clarify why sales from individual cities are extremely difficult
to model. The community potential was always there, but it was the
marketing effort that brought that potential demand to the system. The

------------------------
.I •l \• :·''' ·· ...
150
real message here to planners and carriers is that one should not ig--
nore the potential gains to be attained by marketing efforts. Carriers
should assess the potential of personal contact as compared to exclusive
use of standard advertising media.
Summary of Results
The demand models, cost models, and social need criteria developed
in this study have provided a base for evaluating potential services in
intercity corridors. A summary of these models is as follows:
Demand
• Passenger demand rates are more stable in the communities
and corridors than is express demand.
• Service frequency, bus-miles of travel, corridor populations,
and populations of the destination city are the principal fac-
tors that explain demand variations.
• The limiting magnitude of error in the corridor passenger
demand is 25%.
• Passenger revenue can be based on calculated demand plus
known fare structures and estimated trip lengths.
• Express revenue can best be estimated as a percentage of
passenger revenue, but the error variations are larger.
• Fare changes and relative travel speed changes affect the
consumer's· evaluation and demand level, but the single time
frame data available for this study cannot specifically iso-
late these effects.

151
Expenses
• Unit costs in subcategories vary substantially between carriers
due to a combination of reporting and operating conditions.
• Cost elements for repairs to service equipment, tires and tubes,
driver's wages, fuel and depreciation, provided a stable base
for comparing carrier costs.
• Cost estimation should be completed by carrier class groups.
• Carrier cost increases should be in line with the changes .in
the Consumer Price Index. Excessive increases or decreases
would merit special review.
Community Service Factors
• Principal evaluation elements include population, elderly,
student enrollment, and presence of state institutions.
• The relative importance of the primary variables should be
adjusted by the role of the city as the local government
center (county seat) and the city location with respect
to the major travel network.
• Specific weights to individual factors cannot be assigned
from the secondary data sets used in the analyses of this
research.
• Service evaluations should include an analysis of an entire
corridor rather than just individual cities.

152
Recommendations
In order to successfully integrate the carrier and government
concerns and to assess the operating environment, the following recom-
mendations are suggested: . .
e The total reporting requirements should be reviewed to determine
the need for the data items. Special sampling procedures are
suggested to reduce routine summaries, with the possibility of
acquiring other special data when needed. (p. 145)
• Time series data should be acquired on selected routes in order
to assess fare impacts, if this item is of concern. This recom-
mendation would be implemented more easily if data sampling were
accepted. (p. 141)
• Modifications in annual reports are necessary at the state level
to assure better consistency in the data. (pp. 143-146)
• Projected costs in rate requests may most readily be assessed
by comparing cost increases with anticipated increases in the
Consumer Price Index for selected items. Special considera-
tions causing faster or slower cost changes should be supported
with more complete documentation. (Section 6)
• State agencies should visit with the carriers on a regular basis.
These meetings would serve to educate both the private and public
sector. A minimum of two meetings per year at the carriers'
facilities is recommended. (p. 147)

153
10. ACKNOWLEDGEMENTS
This research was funded by the Iowa Department of Transportation
and the US Department of Transportation, Urban Mass Transportation
Administration. To accomplish the research tasks, special assistance ..
was required and provided by DOT personnel and the carriers involved
in the study. In particular, Joseph Murphy and Alexis Wodtke of the
Transportation Regulation Board provided significant assistance in
obtaining the secondary data sets and regulatory information. The·
intercity bus industry representatives who shared their records and
discussed .their operations were Joseph Sherman (Iowa Coaches), Bill
Keller (Jefferson), Bob Turpin (Greyhound), Lou Boben and Waldo Jaax
(Midwest Coaches), Helen Schmidt (Missouri Transit), Lawrence Tjossem
(Scenic Hawkeye), and Bob Best (Trailways). Their assistance was most
appreciated.

155
11. REFERENCES
1. Carstens, R. L., Brewer, K. A. and S. L. Ring, et al., Intercity Passenger Carrier Improvement Study, Engineering Research Institute,, Iowa State University, Ames, Iowa, 1977.
2. Surface Transportation Assistance Act of 1978, PL 95-599, Title 23, U.S. Code 1978. ..
3. U.S. Department of Transportation, Intercity Bus Service in Small Communities, Office of the Secretary, Washington, D.C., 1978.
4. Transportation Research Board, The Intercity Bus Industry: Issues and Problems, resource paper for the Conference on Intercity.Bus Transportation, Washington, D.C., September 22-24, 1980.
5. Wodtke, Alexis, "Regulation or Public Subsidy: A Governmental Choice," paper presented to Conference on Intercity Bus Transportation, National Academy of Science, Washington, D.C., September 22-24, 1980.
6. Fravel, Frederic D., North Carolina Intercity Bus Study, Department of Transportation, Raleigh, North Carolina, 1979.
7. Energy Tax Act of 1978, PL 95-618, Title 26, U.S. Code 1978.
8. Federal Aid Highway Act, PL 94-2~0, Title 23, U.S. Code May 1976.
9. National Transportation Policy Study Commission, National Transportation Policies: Through the Year 2000, Final Report, June 1979.
10. National Transportation Policy Study Commission, Intercity Bus Transportation, Special Report No. 7, November 1979.
11. Hartgen, David T. and Gerald S. Cohen, "Intercity Passenger Demand Models: State of the Art," Planning Research Unit, New York Department of Transportation, PRR/12, 1976.
12. Wisconsin Department of Transportation, Intercity Bus Transportation in Wisconsin, .Volume IV, Future Demand for Service, Division of Planning, Madison, Wisconsin, 1977.
13. Taylor, William, Kaufman, Robert and John Bowder, et al., An Analysis of the Intercity Bus Industry and the Michigan Bus Subsidy Program, Highway Safety Research Institute, University of Michigan, Ann Arbor, Michigan, 1978.
14. Moskaluk, M. John, Marks, James R. and Stephen Dickers.on, Georgia Intercity Bus System Evaluation, Engineering Experiment Station, Georgia Institute of Technology, February 1980.
l

156
15. Burkhardt, Jon E. and Armando M. Lago, "Predicting Demand for Rural Transit Systems," Traffic Quarterly, Eno Foundation, Westport, Connecticut, January 1978.
16. Van Der Walker, Jess, Derivation of Cost Functions for Inter-City Motor Carriers of Passengers, Thesis, University of Colorado, Department of Economics, 1964.
17. Yordan, Wesley J., "Regulation of Intercity ·Bus Fares: The Problem of Cost Analysis," Land Economics, Vol. XLIV, No. 2, May 1968.
18. Fravel, Frederic D., "Return to Scale in the U.S. Intercity Bus Industry," Transportation Research Forum Proceedings, Richard B. Cross, Oxford, Indiana, 1978.
19. Kech, Carol and Norm Schneider, Efficiency, Economy, and Effecttiveness: The Development and Application of Multimodal Performance Measures for Transit Systems in New York State, New York Department of Transportation, Preliminary Report 22, 1977.
20. California Department of Transportation, A Program Providing Financial Assistance for Intercity Bus Transportation in California, Division of Mass Transportation, Sacramento, California, January 1980.
21. Department of Labor, Monthly Labor Review, Bureau of Labor Statistics, July 1980.
22. Hamad, Farid K., A Study of the Commuter Bus Services in Iowa, Master of Science Thesis, Department of Civil Engineering, Iowa State University, Ames, Iowa, 1980.
23. Kirby, D. F. and K. U. Bhatt, Guidelines on the Operation of Subscription Bus Services, Urban Mass Transportation Administration, Report No. UI-5021-4, 1978.
24. Burkhardt, Jon E. and Charles L. Eby, Need as a Criterion for Transportation Planning, Transportation Research Record 435, 1973.
25. Burkhardt, Jon E. and William W. Millar, Estimating Cost of Providing Rural Transportation Service, Transportation Research Record 578, 1976.
26. Fuller, Ernest, Performance Measures for Public Transit Service, California Department of Transportation Report DMT-033, 1978.
27. Riley, K. J. J., Communication with Respect to California Senate Bill 620 (1979), Division of Mass Transportation, California Department of Transportation, June 16, 1980.

157
28. Taylor, William, et al., An Analysis of the Intercity Bus Industry and the Michigan Bus Subsidy Program, Highway Safety Research Institute Report UM-HSRI-78-60, The University of Michigan, Septem-ber 1978, PB-296170. ·
29. Intercity Bus Transportation in Wisconsin, Volume II: User Characteristics, Wisconsin Department of Transportation, Madison, April 1977.
30. Intercity Bus Transportation in Wisconsin, Volume IV: Future Demand for Service, Wisconsin Department of Transportation, Madison, September 1977.
31. Keck, Carol A. and Norman R. Schneider, Efficiency, Economy and Effectiveness: The Development and Application of Multimodal Performance Measures for Transit Systems in New York State, New York State Department of Transportation, Planning and Research Bureau Report 22, Albany, November 1977.
32. General Social and Economic Characteristics-Iowa, Report PC(l)-Cl7 Iowa, U.S. Department of Commerce, Bureau of the Census, Washington, May 1972.
33. Fall Term Enrollment-1979, Area Schools, Iowa Department of Public ... Instruction, Des Moines, Iowa, February 28, 1980.
34. Resident Population and Population Movement Reports on Correctional Facilities, State Hospitals and State Homes, Iowa Department of Social Services, Bureau of Management Information, Des Moines, Iowa, June 1980.
35. Personal Communication, Registrars and Admissions Officers of Four-year Colleges and Universities in Iowa.
36. Iowa State Transportation Map, 1979-80, Iowa Department of Transportation, Ames, Iowa.
37. The Official Bus Guide, May 1980, Russell's Guides, Inc., Cedar Rapids, Iowa, 1980.
38. Iowa Directory of Manufacturers 1980, Iowa Development Commission, Des Moines, Iowa, 1980.
39. Informal Communication, Iowa State Comptroller's Office, Des Moines, Iowa, 1980.
40. The Consumer's Register of American Business, National Register Publishing Company, Inc., 1977.
41. Hamad, Farid, A Study of Commuter Bus Services in Iowa, Master of Science Thesis, Department of Civil Engineering, Iowa State University, November 1980.

158
42. Roger Boldt, A Study of Industrial Transportation Incorporated, As A Provider of Public Transit Services, East Central Iowa Council of Governments, Iowa City, 1979.
43. Brewer, K. A. and R. 0. Richards, et al., Integrated Analysis of Small Cities Intercity Transportation to Facilitate the Achievement of Regional Urban Goals, Report DOT-OS-30106, U.S. Department of Transportation, Washington, June 1974.
I ..
- --- ----- ---------------------
159
APPENDIX. UNIT REVENUE CHARACTERISTICS FOR
REGULAR ROUTE AND CHARTER SERVICE

161-
Table A·.1. Unit regular route passenger revenue trends for total system.
Yearly Passenger Revenue Per Regular Route-Mile
(Dopars) Percent Increase
Carrier 1976 1977 1978 1979 1976 to 1979
Greyhound 1.04 1.05 1.13 1.32 27
American 0.79 0.90 0.92 1.03 30
Jefferson 0.99 0.99 1.00 1.25 26
Iowa Coaches 0.59 0.58 0.59 0.80 36
Midwest Coaches 0.63 0.69 0.70 0.83 32
Missouri Transit 0.48 0.47 0.51 0.63 31
Scenic Hawkeye 0.49 0.45 0.47 0.56 14
Inter-City Airport a 0.50 0.41 --Reid Bus Lines 0.12 0.14 O.i2 0.12 0
River Trails 0.33 0.34 0.46 0.55 67
aData not available.
I
l

162
Table A.2. Unit express revenue trends for total system.
Yearly Express Revenues Per Regular Route-Mile
(Dollars) Percent Increase
Carrier 1976 1977 1978 1979 1976 to 1979 ._
Greyhound 0.25 0.25 0.28 0.29 19
American 0.15 0.17 0.20 0.22 49
Jefferson 0.41 0.42 0.49 0.59 46
Iowa Coaches 0.20 0.20 0.21 0.24 19
Midwest Coaches 0.22 0.24 0.28 0.29 30
Missouri Transit 0.13 0.14 0.18 0.18 44
Scenic Hawkeye 0.14 0~12 0.15 0.14 0.0
Inter-City Airport a
Reid.Bus Lines 0.28 0.31 0.36 0.34 25
River Trails b 0.29 0.28 0.40 36c
aN . o express service available.
bNo data available.
cThe percentage change for River Trails used 1977 as a base.

163
Table A.3. Unit charter revenue trends for total system.
,,. Yearly Charter Revenue
Per Charter-Mile -, (Dollars)
/ Percent Increase Carrier 1976 1977 1978 1979 1976 to 1979
Greyhound 0.89 1.01 1.22 1.43 61
American 1.05 1.14 1.49 1.41 34
Jefferson 1.14 1.23 1.36 1.50 32
Iowa Coaches 0.84 0.98 L04 1.10 31
Midwest Coaches 1.11 1.14 1.31 1.22 10
Missouri Transit 0.79 0.87 0.95 1.01 28
Scenic Hawkeye 0.83 1.04 1.15 1.31 58
Inter-City Airport a r· a Reid Bus Lines
River Trails b 1.05 1.24 1.30 24c
aNo charter service available. bNo data available. t The percentage change for River Trails used 1977 as a base.