Embed Size (px)
Citation preview

1
Intercalation of hydrotalcites with hexacyanoferrate(II) and (III) – a ThermoRaman spectroscopic study
Ray L. Frost•, Anthony W. Musumeci, Jocelyn Bouzaid, Moses O. Adebajo, Wayde N. Martens and J. Theo Kloprogge Inorganic Materials Research Program, School of Physical and Chemical Sciences, Queensland University of Technology, GPO Box 2434, Brisbane Queensland 4001, Australia. This is the author-version of a paper that was published as:
Frost, Ray and Musumeci, Anthony and Bouzaid, Jocelyn and Adebajo, Moses and Martens, Wayde and Kloprogge, Theo (2005) Intercalation of hydrotalcites with hexacyanoferrate(II) and (III) – a ThermoRaman spectroscopic study . Journal of Solid State Chemistry 178:pp. 1940-1948.
Copyright 2005 Elsevier Abstract Raman spectroscopy using a hot stage indicates that the intercalation of hexacyanoferrate(II) and (III) in the interlayer space of a Mg,Al hydrotalcites leads to layered solids where the intercalated species is both hexacyanoferrate(II) and (III). Raman spectroscopy shows that depending on the oxidation state of the initial hexacyanoferrate partial oxidation and reduction takes place upon intercalation. For the hexacyanoferrate(III) some partial reduction occurs during synthesis. The symmetry of the hexacyanoferrate decreases from Oh existing for the free anions to D3d in the hexacyanoferrate interlayered hydrotalcite complexes. Hot stage Raman spectroscopy reveals the oxidation of the hexacyanoferrate(II) to hexacyanoferrate(III) in the hydrotalcite interlayer with the removal of the cyanide anions above 250 °C. Thermal treatment causes the loss of CN ions through the observation of a band at 2080 cm-1. The hexacyanoferrate (III) interlayered Mg,Al hydrotalcites decomposes above 150 °C. Key Words: hydrotalcite, brucite, Raman microscopy, hexacyanoferrate(III),
potassium hexacyanoferrate(II)
Introduction
Hydrotalcites, or layered double hydroxides (LDH’s) are fundamentally anionic clays[1]. The structure of hydrotalcite can be derived from a brucite structure (Mg(OH)2) in which e.g. Al3+ or Fe3+ (pyroaurite-sjögrenite) substitutes a part of the Mg2+ [2-8]. The nature of the cations in the hydroxide layers and of the interlayer anions can be varied substantially. This substitution of the trivalent cation for the divalent cation creates a positive layer charge on the hydroxide layers, which is compensated by interlayer anions or anionic complexes [9, 10]. Some ternary systems may also be synthesized and characterized such as the system based upon Co and Cu as the divalent cation with Fe as the trivalent cation [11]. When LDH's are
• Author to whom correspondence should be addressed ([email protected])

2
synthesized any appropriate counter charge balancing anion can be placed in the interlayer. Calcinations of the hydrotalcites leads to the formation of mixed oxides. In the particular case of hydrotalcites containing iron the properties of the final oxides depends on the location of the iron in the brucite-like layers or in the complex anion in the interlayer. Typically the counter anion may be any anion with a suitable negative charge including the hexacyanoferrate(II) and hexacyanoferrate(III) ions [12-20]. The incorporation of these ions has implications in electrochemistry [17, 19, 21-23].The hydrotalcite may be considered as a gigantic cation which is counterbalanced by anions in the interlayer. In hydrotalcites a broad range of compositions are possible of the type [M2+
1-xM3+x(OH)2][An-]x/n.yH2O, where M2+ and M3+ are the di- and
trivalent cations in the octahedral positions within the hydroxide layers with x normally between 0.17 and 0.33. An- is an exchangeable interlayer anion [24]. Normally, the carbonate anion is the major interlayer counter anion. Of course when synthesizing hydrotalcites any anion may be used [4, 25-28]. Reevesite and pyroaurite are based upon the incorporation of carbonate into the interlayer with d(003) spacings of around 8 Å [29, 30]. Normally the hydrotalcite structure based upon takovite (Ni,Al) and hydrotalcite (Mg,Al) has basal spacings of ~8.0 Å where the interlayer anion is carbonate. The concentration of particular anion may also effect the d(003) spacing of the hydrotalcite [31].
The potential application of hydrotalcites as catalysts rests with the ability to make mixed metal oxides at the atomic level, rather than at a particle level. Such mixed metal oxides are formed through the thermal decomposition of the hydrotalcite [32, 33]. There are many other important uses of hydrotalcites such as in the removal of environmental hazards in acid mine drainage [34, 35], and a mechanism for the disposal of radioactive wastes [36]. Their ability to exchange anions presents a system for heavy metal removal from contaminated waters [37]. Structural information on different minerals has successfully been obtained recently by sophisticated thermal analysis techniques [38-43]. In order to gain insight into the redox processes taking place in the interlayer, we report the hot stage Raman spectroscopy of hydrotalcite with hexacyanoferrate(II) and hexacyanoferrate(III) in the interlayer as a function of temperature. Experimental Synthesis of hydrotalcite compounds: A mixed solution of aluminium and magnesium nitrates ([Al3+] = 0.25M and [Mg2+] = 0.75M; 1M = 1mol/dm3) and a mixed solution of sodium hydroxide ([OH-] = 2M) and the desired anion, at the appropriate concentration, were placed in two separate vessels and purged with nitrogen for 20 minutes (all compounds were dissolved in freshly decarbonated water). The cationic solution was added to the anions via a peristaltic pump at 40mL/min and the pH maintained above 9 with the addition of 0.1 M NaOH. The mixture was then aged at 75°C for 18 hours under a N2 atmosphere. The resulting precipitate was then filtered thoroughly with room temperature decarbonated water to remove nitrates and left to dry in a vacuum desiccator for several days. The presence of nitrates (and carbonates) is readily checked quite quickly by obtaining the Raman spectrum of the synthesised hydrotalcite. The nitrate and carbonate anions are characterised by intense sharp bands at 1047 and 1070 cm-1 respectively. In this way phase-pure hydrotalcites with

3
different anions in the interlayer were synthesised. The phase composition was checked by X-ray diffraction and the chemical composition by EDXA analyses. X-ray diffraction X-Ray diffraction patterns were collected using a Philips X'pert wide angle X-Ray diffractometer, operating in step scan mode, with Cu Kα radiation (1.54052 Å). Patterns were collected in the range 3 to 90° 2θ with a step size of 0.02° and a rate of 30s per step. Samples were prepared as a finely pressed powder into aluminium sample holders. The Profile Fitting option of the software uses a model that employs twelve intrinsic parameters to describe the profile, the instrumental aberration and wavelength dependent contributions to the profile. Infrared spectroscopy
Infrared spectra were obtained using a Nicolet Nexus 870 FTIR spectrometer with a smart endurance single bounce diamond ATR cell. Spectra over the 4000−525 cm-1 range were obtained by the co-addition of 64 scans with a resolution of 4 cm-1 and a mirror velocity of 0.6329 cm/s. Spectra were co-added to improve the signal to noise ratio. Raman spectroscopy
The crystals of hydrotalcite minerals were placed and orientated on a polished metal surface on the stage of an Olympus BHSM microscope, which is equipped with 10x and 50x objectives. The microscope is part of a Renishaw 1000 Raman microscope system, which also includes a monochromator, a filter system and a Charge Coupled Device (CCD). A Spectra-Physics model 127 He-Ne laser (633 nm) at a resolution of 2 cm-1 in the range between 100 and 4000 cm-1 was used for Raman excitation. Repeated acquisition, using the highest magnification, was accumulated to improve the signal to noise ratio in the spectra. Spectra were calibrated using the 520.5 cm-1 line of a silicon wafer. Powers of less than 1 mW at the sample were used to avoid laser induced degradation of the sample. Slight defocusing of the laser beam also assists in the preservation of the sample. Spectra at elevated temperatures were obtained in an air atmosphere using a Linkam thermal stage (Scientific Instruments Ltd, Waterfield, Surrey, England).
Spectroscopic manipulation such as baseline adjustment, smoothing and
normalisation were performed using the Spectracalc software package GRAMS (Galactic Industries Corporation, NH, USA). Band component analysis was undertaken using the Jandel ‘Peakfit’ software package, which enabled the type of fitting function to be selected and allows specific parameters to be fixed or varied accordingly. Band fitting was done using a Gauss-Lorentz cross-product function with the minimum number of component bands used for the fitting process. The Gauss-Lorentz ratio was maintained at values greater than 0.7 and fitting was undertaken until reproducible results were obtained with squared correlations of r2 greater than 0.995.
RESULTS AND DISCUSSION

4
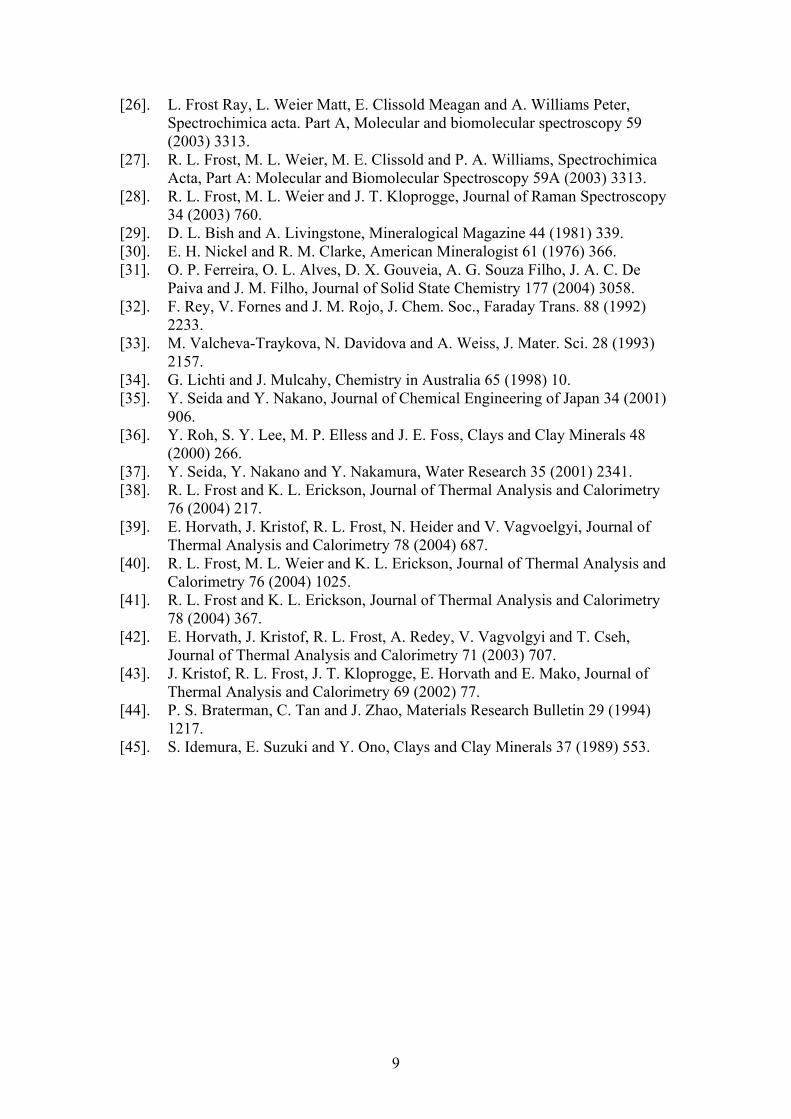
X-ray diffraction The X-ray diffraction patterns for the hexacyanoferrate(II) and hexacyanoferrate(III) interlayered hydrotalcites are shown in Figure 1. For comparison the XRD patterns of the sulphate and carbonate interlayered hydrotalcite are shown. The XRD patterns clearly show the formation of the hydrotalcites with the different anions in the interlayer. The XRD patterns also show no impurities in the synthesised hydrotalcites. Hydrotalcite normally has a d(003) spacing of 7.9 Å. The sulphate interlayered hydrotalcite has a spacing of 8.0 Å. The hexacyanoferrate(II) complex has a spacing of 10.9 Å and the hexacyanoferrate(III) hydrotalcite 11.1 Å. The increased interlayer spacing is due to the size of the anion between the brucite-like layers. Raman spectroscopy The structure of the hexacyanoferrate anion is a regular octahedron with six cyanide ligands at each site with a symmetry of Oh. The selection rules show that the vibrational modes A1g, Eg and T2g will be Raman active only. The T1u mode will be infrared active only. The C3 axis of this octahedron is oriented perpendicular to the hydrotalcite brucite-like hydroxyl sheets [18, 44]. Braterman et al. reasoned that the CN vibrations would correspond to the vibrational modes A1g, Eg and T1u. The fact that the first two modes are observed in the infrared spectrum as low intensity bands provides an indication of symmetry reduction. The T1u mode is split into two modes assigned to Eu and A2u. This is indicative of a reduction in symmetry from Oh to D3d. The Raman spectra of the potassium hexacyanoferrate (II) and (III) ions are shown in Figure 2a. The hexacyano anion is characterised by bands at 2092 and 2064 cm-1 for the potassium hexacynaoferrate(II) salt and at 2133 and 2126 cm-1 for the potassium hexacynaoferrate(III). Bands in these positions are assigned to the CN stretching vibrations. In addition two sets of low intensity bands are observed in the Raman spectra of the potassium hexacyanoferrate(III) at 2079, 2077 and at 2095 and 2091 cm-1 (Figure 2b). These bands correspond to the positions for the potassium hexacyanoferrate (II). The presence of bands attributable to the CN stretching vibrational modes of the hexacyanoferrate(II) in the spectra of hexacyanoferrate(III) are also confirmed by the infrared spectra. The infrared spectra of the potassium hexacyanoferrate (II) and (III) are characterised by bands at 2032 (Fe(II)) and 2113 and 2041 (Fe(III)) cm-1 (Figure 3). A previous study also found an additional band for the hexacyanoferrate(III) at 2076 cm-1 [25]. The band position of the free CN- ion is 2084 cm-1. The band at 2076 cm-1 seems to correspond to the free CN- ion. The two bands at 2091 and 2077 cm-1 correspond with the band positions for the potassium hexacyanoferrate (II) salt. This simply shows that there is some Fe(II) impurity in the Fe(III) compound. A change in oxidation state of the iron in the hexacyanoferrate complexes is reflected in the shift in the CN stretching wavenumber from 2050-2090 cm-1 for Fe(II) to 2115-2125 cm-1 for Fe(III). This shift can be attributed to by a shift in electron density through the pi-bonds of the cyano groups in going from hexacyanoferrate (III) to hexacyanoferrate (II). The Raman spectra of the hydrotalcite synthesised with hexacyanoferrate(II) and (III) in the interlayer are shown in Figure 4. Three bands are observed at 2101, 2094 and 2059 cm-1 for the hexacyanoferrate(II) complex with an

5
additional band at 2048 cm-1, and four bands at 2127, 2118, 2099 and 2059 cm-1 for the hexacyanoferrate(III) interlayered hydrotalcite. Some earlier studies reported only two bands for each of the hexacyanoferrate(II) and (III) interlayered hydrotalcites [12]. Holgadao et al. provided evidence based on Fe-K XANES measurements for the partial oxidation-reduction of the iron in the hexacyanoferrate hydrotalcite [16]. Further Idemura et al. observed a reduction of the Fe in hexacyanoferrate(III) complexes by Mössbauer spectroscopy [45]. Crespo pointed out that the shift in position of the CN stretching wavenumber for the hexacyanoferrate(II) interlayered hydrotalcite was also influenced by the hydrogen bonding between the cyano groups and the interlayer water and also the hydroxyl surfaces of the brucite-like surface [12]. However, this concept is not supported by both the infrared and Raman data of the water and hydroxyl OH bending and stretching modes. In the infrared spectra the bending mode is at 1612 cm-1 and the OH stretching bands between 3000 and 3800 cm-1. Idemura et al. synthesised hydrotalcites with varying amounts of the hexacyanoferrate(II) and (III) in the hydrotalcite through ion exchange from the nitrate interlayered hydrotalcite with the potassium and sodium hexacyano salt solutions with the exclusion of carbonate. Their infrared spectra showed two bands at 2120 and 2040 cm-1; thus indicating some partial reduction of the Fe(III) to (Fe(II) during intercalation. Their infrared work also showed that only a single band at 2040 cm-1 was observed when the sample was dried in vacuum and the second band appeared when the sample was dried in air. Similar observations have been reported by other groups [14-16, 19]. Hot stage Raman spectroscopy Thermal treatment of the hexacyanoferrate(II) interlayered hydrotalcite The hot stage Raman spectra of the hexacyanoferrate(II) in the OH stretching region and in the 2000 to 2150 cm-1 region are shown in Figure 5 and Figure 6 respectively. The hot stage Raman spectra of the hexacyanoferrate(III) in the 2000 to 2150 cm-1 region is shown in Figure 7.The results of the Raman spectral analysis are reported in Table 1. The Raman spectra of the Fe(II) hydrotalcite shows two bands at 2094 and 2059 cm-1 with additional bands at 2048 and 2101 cm-1. At 100 °C two bands are observed at 2098 and 2059 cm-1 with two additional bands resolved at 2124 and 2071 cm-1. In the 150 °C spectrum the intensity of the latter two bands increases. This intensity increases is observed in the 200 °C spectrum. In the 250 °C spectrum the two predominant bands are observed at 2119 and 2074 cm-1. In the 300 °C spectrum a broad band is revealed at around 2084 cm-1. This band corresponds to free CN
- ion and represents the HCN molecules which are being lost above 250 °C. No
intensity remains in the bands at around 2048 and 2094 cm-1. It is proposed that the heating of the hexacyanoferrate(II)interlayered hydrotalcite introduces O2 into the system and causes the oxidation of the Fe(II) to (Fe(III). This oxidation is observed through the development of the additional peaks at around 2124 and 2070 cm-1 which increase in intensity with thermal treatment. Thermal analysis shows that HCN is lost at 270 °C. The spectrum at 300 °C is too noisy to be curve resolved and at this temperature the structure of the hydrotalcite

6
is lost. At 300 °C the hexacyanoferrate(II) hydrotalcite has decomposed according to the following reaction: Mg6Al2(OH)16(Fe(CN)6)0.5
+ 4O2→ 5MgO + MgAl2O4 + 0.5Fe3O4 + 3HCN + 8H2O X-ray diffraction shows that the products of the thermal decomposition of the hexacyanoferrate(II) interlayered hydrotalcite are MgO, Mg2AlO4 (spinel) and Fe3O4. The Raman spectra of the hydroxyl stretching region of the hexacyanoferrate(II) interlayered hydrotalcite are shown in Figure 7. At 25 °C three bands are observed at 3655, 3548 and 3400 cm-1. The first band is assigned to the hydroxyl stretching vibration of the brucite-like hydroxyl surface and the latter two bands are assigned to water stretching bands. At 100 °C much of the intensity of the 3400 cm-1 band has diminished. Three bands are observed at 3700, 3647 and 3552 cm-1 in the 100 °C spectrum. Further heating results in the decrease in intensity of the band at 3552 cm-1. Thermal analysis shows that dehydration of the hexacyanoferrate(II) interlayered hydrotalcite is complete by 150 °C. Thus the two bands in the 200 °C spectrum are attributed to the brucite-like hydroxyl stretching vibrations. Two bands are observed at 3681 and 3626 cm-1. One possible assignment of these bands is to AlOH and MgOH stretching vibrations. Thermal treatment of the hexacyanoferrate(III) interlayered hydrotalcite The Raman spectra of the hexacyanoferrate(III) interlayered hydrotalcite (shown in Figure 7) reveals four bands at 2127, 2119, 2099 and 2072 cm-1 at 25 °C. Significant changes are observed in the 100 °C spectrum. Four bands are observed at 2128, 2121, 2102 and 2072 cm-1. In addition a broad feature is observed at 2080 cm-1. This latter band is present in all the spectra and increases in intensity as the temperature is raised. The band is attributed to free CN
- ions. A previous study
considered the equilibrium between water or hydroxyls with the cyanide ion with water replacing the CN
- ion [25]. In this model the CN
- ions would not be expelled
from the interlayer but rather retained in an equilibrium process. At the elevated temperatures with oxygen present it is more likely that the CN
- ions are expelled and
the octahedral coordination of the Fe(III) maintained by bonding to oxygen. Hansen and Koch reported an infrared band at 2039 cm-1 and a sharp band at 2027 cm-1 [15]. They attributed these bands to free CN
- ions. However the band position for free CN
-
ions is around 2080 cm-1. This may simply mean that the CN- ions have replaced the
OH units on the brucite-like hydroxyl sheets. Such a reaction would release OH ions into the interlayer. The results of this and a previous study do not support the concept of free CN
- ions in the interlayer as no bands are observed at 2027 or 2039 cm-1. the
observation of a broadish band at ~2080 cm-1 may mean that the CN- ions have
moved out of the interlayer and are adsorbed on the surface of the metal oxides which are being formed during the decomposition. In the 150 °C spectrum four bands are observed at 2127, 2118, 2102 and 2061 cm-1. The first two bands are assigned to the CN stretching vibrations of the hexacyanoferrate(III) interlayered hydrotalcite and the second two bands are assigned to the CN stretching vibrations of the hexacyanoferrate(II) interlayered hydrotalcite. The potassium hexacyanoferrate(III) salt used in the experiment showed only very

7
low concentrations of the hexacyanoferrate(II) ion. Thus it is concluded that during the synthesis of the hexacyanoferrate(III) interlayered hydrotalcite some reduction of Fe(III) to Fe(II) occurred. At temperatures above 150 °C, the spectral features of the hexacyanoferrate(III) interlayered hydrotalcite are lost. At 200 °C two broad bands are observed at 2187 and 2112 cm-1. The spectra suffer from a lack of signal to noise, as the thermal background in the spectra increases greatly at the higher temperatures. Thermal decomposition as determined by thermogravimetric methods shows that the hexacyanoferrate(III) interlayered hydrotalcite is dehydrated by 150 °C. This accounts for the very significant changes in the spectra in going from 150 to 200 °C. TGA coupled to a gas evolution mass spectra also shows that the cyanide ion is lost above 200 °C. Dehydration as determined by gas evolution mass spectrometry shows that dehydration has occurred by 150 °C. The loss of the CN ions occurs simultaneously as the dehydroxylation of the hexacyanoferrate(III) interlayered hydrotalcite occurs. The cyanide ion is lost as cyanic acid. This shows that the cyanide ion reacts with the hydroxyl surface of the hexacyanoferrate(III) interlayered hydrotalcite to produce HCN with the oxygen bonded to the cations of the hydrotalcite Such a concept has been previously suggested [15].
CONCLUSIONS Raman spectroscopy confirms the intercalation of hexacyanoferrate(II) and (III) in the interlayer of Mg,Al hydrotalcite with the partial reduction of the hexacyanoferrate(III) interlayered hydrotalcite and the partial oxidation of the hexacyanoferrate(II) interlayered hydrotalcite. This results in a mixed valence combination in the interlayer irrespective of the initial starting hexacyanoferrate. Hot stage Raman spectroscopy shows that the hexacyanoferrate(II) interlayered hydrotalcite undergoes oxidation to the hexacyanoferrate(III) interlayered hydrotalcite before decomposition above 250 °C. The hexacyanoferrate(III) interlayered hydrotalcite remains stable up to 150 °C after which decomposition with the loss of cyanide ions occurs. Free cyanide is lost during the thermal treatment of the hexacyanoferrate(III) hydrotalcite. Acknowledgments The financial and infra-structure support of the Queensland University of Technology Inorganic Materials Research Program is gratefully acknowledged. The Australian Research Council (ARC) is thanked for funding.
8
References [1]. V. Rives and Editor, Layered Double Hydroxides: Present and Future, 2001. [2]. R. L. Frost, W. N. Martens, L. Duong and J. T. Kloprogge, Journal of
Materials Science Letters 21 (2002) 1237. [3]. R. L. Frost, Z. Ding, W. N. Martens, T. E. Johnson and J. T. Kloprogge,
Spectrochimica Acta, Part A: Molecular and Biomolecular Spectroscopy 59A (2003) 321.
[4]. R. L. Frost, W. Martens, Z. Ding, J. T. Kloprogge and T. E. Johnson, Spectrochimica Acta, Part A: Molecular and Biomolecular Spectroscopy 59A (2003) 291.
[5]. L. Hickey, J. T. Kloprogge and R. L. Frost, Journal of Materials Science 35 (2000) 4347.
[6]. T. E. Johnson, W. Martens, R. L. Frost, Z. Ding and J. T. Kloprogge, Journal of Raman Spectroscopy 33 (2002) 604.
[7]. J. T. Kloprogge, L. Hickey and R. L. Frost, Applied Clay Science 18 (2001) 37.
[8]. J. T. Kloprogge, D. Wharton, L. Hickey and R. L. Frost, American Mineralogist 87 (2002) 623.
[9]. R. M. Taylor, Clay Minerals 17 (1982) 369. [10]. H. F. W. Taylor, Mineralogical Magazine and Journal of the Mineralogical
Society (1876-1968) 37 (1969) 338. [11]. A. H. Iglesias, O. P. Ferreira, D. X. Gouveia, A. G. Souza Filho, J. A. C. De
Paiva, J. Mendes Filho and O. L. Alves, Journal of Solid State Chemistry 178 (2005) 142.
[12]. I. Crespo, C. Barriga, V. Rives and M. A. Ulibarri, Solid State Ionics 101-103 (1997) 729.
[13]. I. Carpani, M. Berrettoni, B. Ballarin, M. Giorgetti, E. Scavetta and D. Tonelli, Solid State Ionics 168 (2004) 167.
[14]. J. M. Fernandez, M. A. Ulibarri, F. M. Labajos and V. Rives, Journal of Materials Chemistry 8 (1998) 2507.
[15]. H. C. B. Hansen and C. B. Koch, Clays and Clay Minerals 42 (1994) 170. [16]. M. J. Holgado, V. Rives, M. S. Sanroman and P. Malet, Solid State Ionics 92
(1996) 273. [17]. K. Itaya, H. C. Chang and I. Uchida, Inorganic Chemistry 26 (1987) 624. [18]. S. Kikkawa and M. Koizumi, Materials Research Bulletin 17 (1982) 191. [19]. K. Yao, M. Taniguchi, M. Nakata and A. Yamagishi, Journal of
Electroanalytical Chemistry 458 (1998) 249. [20]. J. Labuda and M. Hudakova, Electroanalysis 9 (1997) 239. [21]. B. R. Shaw, Y. Deng, F. E. Strillacci, K. A. Carrado and M. G. Fessehaie,
Journal of the Electrochemical Society 137 (1990) 3136. [22]. K. Okada, F. Matsushita, S. Hayashi and A. Yasumori, Clay Science 10
(1996) 1. [23]. K. Yao, M. Taniguchi, M. Nakata, M. Takahashi and A. Yamagishi, Langmuir
14 (1998) 2890. [24]. H. C. B. Hansen and C. B. Koch, Applied Clay Science 10 (1995) 5. [25]. J. T. Kloprogge, M. Weier, I. Crespo, M. A. Ulibarri, C. Barriga, V. Rives, W.
N. Martens and R. L. Frost, Journal of Solid State Chemistry 177 (2004) 1382.
9
[26]. L. Frost Ray, L. Weier Matt, E. Clissold Meagan and A. Williams Peter, Spectrochimica acta. Part A, Molecular and biomolecular spectroscopy 59 (2003) 3313.
[27]. R. L. Frost, M. L. Weier, M. E. Clissold and P. A. Williams, Spectrochimica Acta, Part A: Molecular and Biomolecular Spectroscopy 59A (2003) 3313.
[28]. R. L. Frost, M. L. Weier and J. T. Kloprogge, Journal of Raman Spectroscopy 34 (2003) 760.
[29]. D. L. Bish and A. Livingstone, Mineralogical Magazine 44 (1981) 339. [30]. E. H. Nickel and R. M. Clarke, American Mineralogist 61 (1976) 366. [31]. O. P. Ferreira, O. L. Alves, D. X. Gouveia, A. G. Souza Filho, J. A. C. De
Paiva and J. M. Filho, Journal of Solid State Chemistry 177 (2004) 3058. [32]. F. Rey, V. Fornes and J. M. Rojo, J. Chem. Soc., Faraday Trans. 88 (1992)
2233. [33]. M. Valcheva-Traykova, N. Davidova and A. Weiss, J. Mater. Sci. 28 (1993)
2157. [34]. G. Lichti and J. Mulcahy, Chemistry in Australia 65 (1998) 10. [35]. Y. Seida and Y. Nakano, Journal of Chemical Engineering of Japan 34 (2001)
906. [36]. Y. Roh, S. Y. Lee, M. P. Elless and J. E. Foss, Clays and Clay Minerals 48
(2000) 266. [37]. Y. Seida, Y. Nakano and Y. Nakamura, Water Research 35 (2001) 2341. [38]. R. L. Frost and K. L. Erickson, Journal of Thermal Analysis and Calorimetry
76 (2004) 217. [39]. E. Horvath, J. Kristof, R. L. Frost, N. Heider and V. Vagvoelgyi, Journal of
Thermal Analysis and Calorimetry 78 (2004) 687. [40]. R. L. Frost, M. L. Weier and K. L. Erickson, Journal of Thermal Analysis and
Calorimetry 76 (2004) 1025. [41]. R. L. Frost and K. L. Erickson, Journal of Thermal Analysis and Calorimetry
78 (2004) 367. [42]. E. Horvath, J. Kristof, R. L. Frost, A. Redey, V. Vagvolgyi and T. Cseh,
Journal of Thermal Analysis and Calorimetry 71 (2003) 707. [43]. J. Kristof, R. L. Frost, J. T. Kloprogge, E. Horvath and E. Mako, Journal of
Thermal Analysis and Calorimetry 69 (2002) 77. [44]. P. S. Braterman, C. Tan and J. Zhao, Materials Research Bulletin 29 (1994)
1217. [45]. S. Idemura, E. Suzuki and Y. Ono, Clays and Clay Minerals 37 (1989) 553.

10
Room Temp 100°C 150°C 200°C 250°C 300°C
Wave number FWHM %**
Wave number FWHM %
Wave number FWHM %
Wave number FWHM %
Wave number FWHM %
Wave number FWHM %
3699.7 45.0 2.7 3696.7 42.6 2.4 3681.2 58.4 4.6 3654.9 101.2 3.5 3646.7 98.1 4.9 3650.0 78.4 6.0
3625.7 102.5 4.1 3579.2 123.6 4.5
3547.6 183.5 3.6 3552.2 184.7 4.9 3400.5 306.6 16.3
2124.4 15.9 3.1 2119.5 22.7 6.7 2117.1 26.3 11.4 2119.2 33.9 11.5 2101.3 18.4 10.2 2098.3 21.8 28.6 2101.2 20.3 16.4 2100.0 16.2 14.2 2098.7 7.3 1.1 2093.7 12.0 12.4 2084.3 66.4 27.3
2070.6 15.5 6.1 2071.7 25.8 11.3 2075.1 22.5 8.5 2074.3 45.3 18.9 2059.3 18.9 16.0 2059.4 18.7 22.8 2058.4 8.3 1.2 2059.4 11.6 4.0 2047.8 67.3 26.8 2032.2 60.4 15.7 2045.5 59.0 14.7 2049.6 59.7 14.7
1548.1 76.8 6.9 1555.8 95.5 15.7 1541.1 92.2 48.0 1544.9 84.7 52.9 1493.6 51.4 12.5 1498.7 53.3 8.3 1276.4 36.1 2.3 1113.4 44.8 11.6 1117.6 49.5 10.9 1122.7 47.7 15.5 1121.1 63.3 19.8 1016.3 39.7 1.0
698.7 34.6 0.5 586.8 31.4 0.9 507.5 21.2 1.0 507.0 17.7 0.5 510.3 17.2 0.3 476.7 32.9 1.4 472.5 34.5 1.5 471.8 13.4 0.2
361.7 46.2 0.5 288.6 42.3 1.2 277.1 82.6 2.5
257.4 56.8 1.4 241.8 25.1 0.8 233.0 57.0 1.9 218.8 45.1 2.3 223.7 41.3 1.7 224.0 12.6 0.7 224.1 12.1 1.3
196.3 41.3 1.9 195.2 26.8 1.1 192.7 18.5 0.9 202.8 9.7 1.3
Table 1 Results of the Raman spectral analysis of the hexacyanoferrate(II) as a function of temperature. ** % Relative Intensity

11
Room Temp 100°C 150°C 200°C 300°C
Wave number FWHM %**
Wave number FWHM %
Wave number FWHM %
Wave number FWHM %
Wave number FWHM %
3715.7 23.0 0.8 3688.0 46.9 1.4 3696.5 42.6 1.8 3692.3 31.0 0.9 3633.1 100.9 3.3 3622.1 107.4 9.7 3633.7 90.1 3.1 3531.5 200.2 4.2
2186.5 51.6 5.5 2127.2 9.5 15.4 2128.3 6.6 6.4 2126.5 9.5 5.1 2118.8 12.9 12.8 2121.2 12.7 11.3 2118.0 13.9 10.1 2099.4 17.9 10.6 2102.3 19.8 11.4 2102.0 16.5 6.3 2112.3 71.5 10.0 2109.8 42.9 19.2 2072.1 17.3 1.7 2072.5 24.7 3.4 2077.9 24.6 4.1 2069.3 29.0 12.7 2059.5 13.2 4.0 2058.8 9.1 1.4 2060.7 9.6 2.3 2004.3 83.5 15.9 2004.7 82.9 20.3 2012.6 83.8 16.2
1544.9 75.1 18.4 1545.1 84.5 32.3 1516.1 103.2 7.9 1527.4 97.6 54.4 1496.8 57.5 13.4 1113.5 49.5 3.0 1121.8 49.1 17.0 1124.5 55.8 30.0 1116.5 67.4 16.3 1058.7 67.7 19.5
810.6 104.6 3.3 780.5 127.8 7.4
732.6 80.0 5.3 686.0 50.0 2.5 700.3 57.9 3.8 587.9 22.9 1.0 588.5 17.9 0.5 505.1 37.6 1.6 505.6 41.5 1.5 468.7 26.1 1.2 466.8 22.3 0.8 369.9 58.6 2.9 369.0 41.6 1.4 301.2 53.9 3.5 309.6 43.5 1.6 247.3 62.6 4.0 252.9 71.2 4.0 258.9 41.6 1.7 205.4 31.1 0.9 206.8 10.7 0.3 204.7 13.9 1.3
Table 2 Results of the Raman spectral analysis of the hexacyanoferrate(III) as a function of temperature

12
** % Relative Intensity

13
List of Figures Figure 1 Powder X-ray diffraction patterns of the samples used in this study. Figure 2a Raman spectra of the potassium salts of hexacyanoferrate(II) and (III) Figure 2b Raman spectra of the potassium salts of hexacyanoferrate(II) and (III)
expanded in the 2050 to 2100 cm-1 region. Figure 3 Infrared spectra of the potassium salts of hexacyanoferrate(II) and (III) Figure 4 Raman spectra of the hexacyanoferrate(II) and (III) interlayered Mg,Al
hydrotalcite Figure 5 Hot stage Raman spectra of the OH stretching region of the
hexacyanoferrate(II) and (III) interlayered Mg,Al hydrotalcite Figure 6 Hot stage Raman spectra of the 1950 to 2150 cm-1 region of the
hexacyanoferrate(II) interlayered Mg,Al hydrotalcite Figure 7 Hot stage Raman spectra of the 1950 to 2150 cm-1 region of the
hexacyanoferrate(III) interlayered Mg,Al hydrotalcite List of Tables Table 1 Results of the Raman spectral analysis of the hexacyanoferrate(II) as a
function of temperature. Table 2 Results of the Raman spectral analysis of the hexacyanoferrate(III) as a
function of temperature

14
15
5 10 15 20 25 30
Degrees 2 Theta
[Fe(CN)6
[Fe(CN)64
SO42-
CO32-
d003 = 11.1Å
d003 = 10.9Å
d003 = 7.99Å
d003 = 7.90Å
Figure 1

16
2030205020702090211021302150
Wavenumber /cm-1
Ram
an In
tens
ity
K3[Fe(CN)6]
K4[Fe(CN)6] 2092cm-1
2126cm-1
2133cm-1
2057cm-1
2064cm-1
Figure 2a
0.01
0.0101
0.0102
0.0103
0.0104
0.0105
205020602070208020902100
Raman Shift /cm-1
Ram
an In
tens
ity
K3[Fe(CN)6]
2095cm-1
2091cm-1
2079cm-1 2076cm-1
Figure 2b

17
1960198020002020204020602080210021202140
Wavenumber /cm-1
Rel
ativ
e In
tens
ity[Fe(CN)6]
4-
[Fe(CN)6]3-
2041cm-1
2032cm-1
2113cm-1
Figure 3 Infrared

18
19201970202020702120
Wavenumber /cm-1
Ram
an In
tens
ity
[Fe(CN)6]3-
[Fe(CN)6]4-
2118 cm-1
2127 cm-1
2099 cm-1
2059 cm-1
2004 cm-1
2094 cm-1
2101 cm-1
2059 cm-1
2048 cm-1
Figure 4

19
31003200330034003500360037003800
Wavenumbers /cm-1
Ram
an In
tens
ity
25°C
200°C
100°C
150°C
3626 cm-1
3681 cm-1
3647 cm-1
3579 cm-1
3552 cm-1
3655 cm-1
3400 cm-1
3650 cm-1
3697 cm-1
3700 cm-1
3548 cm-1
Figure 5

20
19502000205021002150
Wavenumbers /cm-1
Ram
an In
tens
ity
25°C
300°C
250°C
200°C
100°C
150°C
2048 cm-1
2094 cm-1
2059 cm-12098 cm-1
2101 cm-1 2072 cm-1
2075 cm-1
2117 cm-1
2050 cm-1
2119 cm-1 2074 cm-1
2084 cm-1
2100 cm-1
2120 cm-1
2058 cm-1
2071 cm-1
2124 cm-1
2101 cm-1
2059 cm-1
2059 cm-1
2099 cm-1
Figure 6

21
1900200021002200
Wavenumbers /cm-1
Ram
an In
tens
ity
25°C
300°C
200°C
150°C
100°C
2099 cm-1
2004 cm-1
2127 cm-1
2128 cm-1
2102 cm-1
2127 cm-1
2061 cm-1
2005 cm-1
2012 cm-1
2187 cm-1 2112 cm-1
2069 cm-12110 cm-1
2078 cm-1
2102 cm-1
2072 cm-1
2118 cm-1
2121 cm-1
Figure 7


![Detecting circulating antibodies by controlled surface ... · Mili-Q laboratory grade. The chemical reagents including potassium hexacyanoferrate III (K 3 [Fe(CN) 6]), potassium hexacyanoferrate](https://img.dokumen.tips/doc/110x75/607174369d3bb803a55d02f2/detecting-circulating-antibodies-by-controlled-surface-mili-q-laboratory-grade.jpg)

![Intercalation of hydrotalcites with hexacyanoferrate(II) and (III) – … · 2010. 6. 9. · effect the d(003) spacing of the hydrotalcite [31]. The potential application of hydrotalcites](https://img.dokumen.tips/doc/110x75/60e8d3340c17be51b86a281e/intercalation-of-hydrotalcites-with-hexacyanoferrateii-and-iii-a-2010-6.jpg)