Embed Size (px)
Citation preview

Interannual Variability of OLR as Observed by AIRS and CERES
Joel Susskind, NASA Goddard Space Flight Center1
Gyula Molnar, Morgan State University/GESTAR2
Lena Iredell, Science Applications International Corporation3
Norman G. Loeb, NASA Langley Research Center4
____________________1J. Susskind, NASA GSFC, Code 610, Greenbelt, MD 20771, [email protected],2G. Molnar, MSU/GESTAR, NASA GSFC, Code 610, Greenbelt, MD 20771, [email protected],3L. Iredell, SAIC, NASA GSFC, Code 610, Greenbelt, MD 20771, [email protected],4N. Loeb, NASA LARC, Mail Stop 420, Hampton, VA 23681, [email protected]
https://ntrs.nasa.gov/search.jsp?R=20120012822 2018-07-29T18:43:52+00:00Z

1
Abstract
This paper compares spatial anomaly time series of OLR (Outgoing Longwave
Radiation) and OLRCLR (Clear Sky OLR) as determined using observations from
CERES Terra and AIRS over the time period September 2002 through June 2011. Both
AIRS and CERES show a significant decrease in global mean and tropical mean OLR
over this time period. We find excellent agreement of the anomaly time-series of the two
OLR data sets in almost every detail, down to the 1�������������� ������ ��������� e
extremely close agreement of OLR anomaly time series derived from observations by
two different instruments implies that both sets of results must be highly stable. This
agreement also validates to some extent the anomaly time series of the AIRS derived
products used in the computation of the AIRS OLR product. The paper also examines
the correlations of anomaly time series of AIRS and CERES OLR, on different spatial
scales, as well as those of other AIRS derived products, with that of the NOAA Sea
Surface Temperature (SST) product averaged over the NOAA Niño-4 spatial region. We
refer to these SST anomalies as the El Niño Index. Large spatially coherent positive and
negative correlations of OLR anomaly time series with that of the El Niño Index are
found in different spatial regions. Anomalies of global mean, and especially tropical
mean, OLR are highly positively correlated with the El Niño Index. These correlations
explain that the recent global and tropical mean decreases in OLR over the period
September 2002 through June 2011, as observed by both AIRS and CERES, are
primarily the result of a transition from an El Niño condition at the beginning of the data
record to La Niña conditions toward the end of the data period. We show that the close
correlation of global mean, and especially tropical mean, OLR anomalies with the El

2
Niño Index can be well accounted for by temporal changes of OLR within two spatial
regions which lie outside the NOAA Niño-4 region, in which anomalies of cloud cover
and mid-tropospheric water vapor are both highly negatively correlated with the El Niño
Index. Agreement of the AIRS and CERES OLRCLR anomaly time series is less good,
which may be a result of the large sampling differences in the ensemble of cases
included in each OLRCLR data set.
1. Introduction
OLR (Outgoing Longwave Radiation) is a critical component of the Earth’s
radiation budget and represents the total radiation going to space emitted by the earth-
atmosphere system and integrated over all angles. OLR products have been generated
and monitored globally since 1975 based on broad spectral band measurements taken
at a given satellite zenith angle by the ERB instrument on the Nimbus-6 and Nimbus-7
satellites (Jacobowitz et al. 1984, Kyle et al. 1993); the ERBE instrument on NOAA-9
and NOAA-10; ERBS (Barkstrom 1989); the AVHRR instrument on NOAA operational
satellites (Gruber et al. 1994 and references therein); and most recently by CERES
which has flown on EOS Terra since 2000 and on EOS Aqua since 2002 (Wielicki et al.
1996). Multiyear OLR data sets have also been generated via radiative transfer
calculations, which compute OLR for a given scene using surface, atmospheric, and
cloud products for that scene derived from the atmospheric sounders TOVS (Susskind
et al. 1993) and AIRS (Susskind et al. 2011a).
OLR has been widely used as a proxy for tropical convective activity and rainfall,
particularly in diagnosing and understanding tropical intraseasonal to interannual
variability and monsoons (e.g., Kidson et al. 2002, Jones et al. 2004, Barlow et al. 2005,

3
Kiladis et al. 2005, Hoyos and Webster 2007, Wong et al. 2008, Chiodi and Harrison
2010, Loeb et al. 2012a). In addition, OLR has been used in studies of earth’s radiation
balance (e.g., Clement and Soden, 2005, Fasullo and Trenberth, 2008) and
atmospheric model validation (e.g., Allan et al. 2003). More importantly, anomalies and
trends of OLR have been used to study climate feedbacks and processes (e.g., Chu
and Wang, 1997, Soden and Held 2006, Soden et al. 2008, Dessler et al. 2008, Huang
and Ramaswamy 2009,Chung et al. 2010, Dessler 2010, Trenberth et al. 2010).
This paper has two main objectives. The first objective is to compare anomaly
time-series of CERES and AIRS OLR products, generated by the CERES and AIRS
Science Teams respectively, over the eight year 10 month overlap period of the two
data sets, September 2002 through June 2011. This comparison shows excellent
agreement of these anomaly time series down to the 1������������� scale. Behavior of
OLR over this short time period should not be taken in any way as being indicative of
what long term trends might be. The ability to begin to draw potential conclusions as to
whether there are long term drifts with regard to the earth’s OLR, or any geophysical
parameter for that matter, would require consistent global observations for a time period
of at least 20 years, if not longer. Nevertheless, a very close agreement of eight year 10
month OLR anomaly time series derived using two different instruments in two very
different manners is an encouraging result. It demonstrates that one can have
confidence in the eight year 10 month 1�������OLR anomaly time series as observed by
each instrument. The second objective of the paper is to explain why global mean, and
especially tropical mean, OLR have decreased over the time period under study in

4
terms of the correlations between OLR anomaly time series on different spatial scales
with the El Niño Index as defined later in this paper.
2. AIRS and CERES OLR data sets used
In this paper we use the operational monthly mean OLR and OLRCLR data
products produced by the AIRS and CERES Science Teams. We obtained the AIRS
OLR products from the Goddard DISC and the CERES products from the CERES
Science Team website. AIRS was launched on the EOS Aqua satellite in a 1:30 AM/PM
local crossing time orbit in May 2002. The operational processing of AIRS data began
after AIRS became stable in September 2002. We use the AIRS Version-5 monthly
mean Level-3 1� x 1�� �����-longitude grid products which contain separate products
generated for each of the 1:30 AM and PM local time orbits. We averaged the AM and
PM products together to generate and use a single monthly mean product on the 1� x 1��
grid for each month. In addition to AIRS OLR and OLRCLR, we also use the AIRS Level-
3 surface skin temperatures, water vapor profiles, and cloud products to demonstrate
the behavior of factors contributing significantly to the anomaly time series of OLR and
OLRCLR. Section 3 provides a discussion of how the AIRS Science Team OLR and
OLRCLR products were computed at the Goddard DISC.
CERES has flown on both EOS Terra, which was launched in December 1999 on
a 10:30 AM/PM local crossing time orbit, and on EOS Aqua, the same platform that
carries AIRS. The CERES Science Team generates a number of different OLR data
sets using CERES observations. The latest versions of the longest record CERES OLR
data sets are referred to as the CERES EBAF (Energy Balanced And Filled) Edition-2.6r
data sets, which like AIRS, are Level-3 products presented on a 1� x 1�� �����-

5
longitude grid. The CERES EBAF data set was obtained from
http://ceres.larc.nasa/gov/order_data.php. CERES EBAF Edition-2.6r uses the latest
calibration improvements with Edition-2 CERES cloud retrievals (Minnis et al. 2008,
Minnis et al. 2011), angular dependence models (Loeb et al. 2005), and time-space
averaging (Doelling et al. 2012). At the time of this writing, the Level-3 CERES Terra
EBAF Edition-2.6r OLR data set extended to June 2011 and the AIRS Level-3 products
extended to March 2012. There was no comparable EBAF Edition-2.6 data set available
for CERES Aqua. For these reasons, the comparisons shown in this paper use CERES
Terra and AIRS OLR products for the overlap time period September 2002 through
June 2011.
3. Computation of AIRS OLR as a function of surface and atmospheric conditions
OLR at a given location is affected primarily by the earth’s skin surface
temperature, Tskin; skin surface s��� �������������; atmospheric vertical temperature
profile, T(p) and water vapor profile, q(p); and the heights, amounts, and spectral
emissivities of multiple layers of cloud cover. OLR also depends on the vertical
distributions of trace gases such as O3(p), CH4(p), CO2(p), and CO(p). OLR is
computed for a specific Field of Regard (FOR), given all the needed geophysical
parameters, using an OLR Radiative Transfer Algorithm (RTA). Mehta and Susskind
developed such an OLR RTA used in conjunction with the TOVS (TIROS Operational
Vertical Sounder) retrieval methodology (Susskind et al. 1997) in order to generate the
TOVS Pathfinder Path-A OLR data set (Mehta and Susskind 1999a, 1999b). AIRS OLR
is computed using AIRS/AMSU sounding products in a completely analogous manner,
including use of the same Mehta and Susskind OLR RTA (Susskind et al. 2003).

6
AIRS measures IR channel radiances over the interval 650 cm-1 to 2668 cm-1.
Most AIRS results shown in this paper were derived using the AIRS Science Team
Version-5 retrieval algorithm (Susskind et al. 2011a) which generates the values of Tskin,
��, T(p), q(p), O3(p), and cloud parameters, from which OLR and OLRCLR are computed.
These geophysical parameters are determined for each AIRS 45 km x 45 km FOR
which lies within a single AMSU-A footprint. The AIRS Version-5 OLR product, referred
to as � below, is computed as a sum of fluxes in 14 contiguous spectral bands
according to
� = � ������� = � �1 ��� ��� ��
��� ��,��� + �����,���� + �����,���� (1)
where Fj,CLR is the computed clear sky flux going to space integrated over all angles
emanating from spectral band j ; Fj,CLDk is the analogous computed flux emanating from
an opaque cloud at cloud top pressure pk ; and ��kj is the radiatively effective cloud
fraction where ��kj is the product of the geometric fractional cloud cover �k as seen
from above for the cloud at pressure pk and the emissivity of that cloud in spectral band
j.
Mehta and Susskind (1999a,b) parameterize Fj for a given sounding as a function
of Tskin, surface spectral emissivity �j in spectral band j, T(p), q(p), and O3(p). The
parameterization coefficients used by Mehta and Susskind are computed based on line-
by-line calculations (Susskind and Searl, 1978) which used the atmospheric line
parameter data base of McClatchey et al. (1972). The spectral bands used in Equation
1 range from 2 cm-1 through 2750 cm-1. There is no need to make radiometric
measurements at all frequencies in order to perform the calculation shown in Equation
1. The AIRS Version-5 retrieval algorithm determines the surface spectral emissivity �v

7
as a function of frequency over the AIRS spectral range using AIRS observations.
Surface emissivities at frequencies lower than 650 cm-1 are set equal to those at 650
cm-1 and are irrelevant with regard to the computation of OLR in any event because the
atmosphere is opaque at those frequencies. The AIRS Version-5 retrieval algorithm
determines the effective cloud fraction ��kj at 800 cm-1 for each of up to two cloud layers
k. The clouds are assumed to be gray, that is, ��k is assumed to be independent of
frequency in the calculation of OLR. This is a valid approximation for opaque clouds but
not so for cirrus clouds which have a cloud spectral emissivity which depends on the
cloud drop size distribution. The results shown later in this paper demonstrates that the
gray cloud approximation does not appear to have significant negative consequences
with regard to the study of OLR anomaly time-series. No other approximations are
made in the calculation of Equation 1.
AIRS OLRCLR, the clear sky OLR, is also a product computed for each AIRS FOR
obtained using Equation 1 but setting both ��1 and ��2 equal to zero. Geophysical
parameters are determined from AIRS observations under both cloud-free and cloudy
conditions, though their quality is poorer under very cloudy conditions, especially at or
near the surface. For this reason, the AIRS Version-5 OLRCLR product for a given FOR
is included in the generation of the Level-3 monthly mean gridded OLRCLR product only
for those cases in which the AIRS retrieved cloud fraction is less than 90% and which
also pass an OLRCLR quality control procedure which indicates the retrieval is of
acceptable accuracy down to the surface (Susskind et al. 2011a). Quality Controlled
AIRS Version-5 OLRCLR products that are included in the OLRCLR Level-3 product are
produced in roughly 75% of the FOR’s observed by AIRS. The OLR product generated

8
for each FOR is always included in the Level-3 OLR product, both because of the need
for complete sampling with regard to OLR, and also because computed values of OLR
are not affected significantly by surface and atmospheric conditions beneath the cloud
in very cloudy cases.
The CERES Science Team uses a different procedure for determining the
ensemble of cases to be included in its Level-3 OLRCLR product. The gridded CERES
OLRCLR product is generating by averaging values of CERES OLR only for those
CERES footprints determined to be cloud-free by use of coincident MODIS spectral
radiance measurements. The MODIS cloud mask used by the CERES Science Team is
described in Minnis et al. (2011). As a result of this difference in sampling
methodologies, the AIRS monthly mean OLRCLR product includes a significantly larger
ensemble of cases than that found in the CERES monthly mean OLRCLR product. The
significant sampling differences between the two ensembles of cases included in each
OLRCLR data set is most likely the largest factor that would negatively affect the
comparison of OLRCLR anomaly time series contained in the AIRS and CERES Level-3
data sets.
This paper also shows some results comparing OLR computed using the
prototype AIRS Version-6 Science Team retrieval algorithm with the Version-5 OLR
product. AIRS Version-6 uses an improved OLR RTA (Iacono et al. 2008) in the
computation of OLR. The approach used to compute OLR in Version-6 is very similar to
that used in Version-5, with the minor difference that 16 spectral bands are used in the
computation of OLR as opposed to the 14 bands used in Equation 1. This new RTA
does have two very important upgrades compared to Mehta and Susskind (1999a,b)

9
however. Most significantly, the new OLR RTA is generated using more up to date line
absorption parameters, especially in the very strong water vapor absorption band near
300 cm-1. In addition, the new OLR calculation allows for inclusion of the effects of
variations in space and time of CO2 profiles, as well as those of other minor absorption
species such as CO, CH4, and N2O, in the calculation of OLR. The Version-5 OLR RTA
did not include these effects and parameterized atmospheric transmittances only in
terms of variable atmospheric profiles of temperature, water vapor, and ozone. The
AIRS Version-6 retrieval algorithm also has other improvements in methodology which
lead to improved values of the geophysical parameters themselves (Susskind et al.
2011b). The AIRS Science Team Version-6 retrieval algorithm is expected to become
operational at the Goddard DISC in mid-2012. We obtained the Version-6 OLR results
shown in the paper from the AIRS Science Team Computing facility at JPL. They are
not available to the public at the time of the writing of this paper.
4. Comparison of AIRS and CERES OLR and OLRCLR Data Records
Figure 1a shows global mean monthly mean values of AIRS Version-5 OLR and
OLRCLR, as well as those of CERES Terra EBAF Edition 2.6r OLR and OLRCLR,
henceforth referred to as CERES OLR and OLRCLR, for the overlap period starting
September 2002 and extending until June 2011. AIRS OLR and OLRCLR products for
parts of November 2003 and January 2010 were missing from the daily AIRS data
record, and therefore observations for these days were not included in the generation at
the DISC of the monthly mean OLR and OLRCLR values for these months. We
approximated what AIRS monthly mean OLR products for these months would have
been if the whole month were observed, on a grid box basis, by setting grid point

10
differences between AIRS and CERES OLR for an incomplete month equal to the
average value of the corresponding AIRS/CERES differences for the previous month
and subsequent month, and adding these differences to the CERES monthly mean
products. We used the same procedure to correct the AIRS OLRCLR data records for
those two months. We use these approximated OLR and OLRCLR monthly mean records
as if they were actual observations in the subsequent discussion.
Some reported monthly mean CERES OLRCLR data points for individual 1�������
grid boxes have also been modified because these CERES OLRCLR data values
appeared to be significant outliers when compared to nearby CERES OLRCLR values, as
well as with colocated AIRS OLRCLR values. For each grid box for each month, we
eliminated any CERES OLRCLR value that differed by more than 20 W/m2 from the
corresponding AIRS OLRCLR value. We then spatially interpolated the remaining nearest
values of the difference, CERES OLRCLR minus AIRS OLRCLR, to generate replacement
values of this difference for the grid boxes that were found to be of questionable
accuracy as described above. Note that only 2.6% of the CERES OLRCLR monthly mean
gridded values, which occurred primarily in the vicinity of Antarctica, were replaced in
this manner. These replaced differences were then added to the AIRS OLRCLR product
for the corresponding grid boxes to generate the replacement values of CERES OLRCLR
which are used in all subsequent calculations.
We observe a number of features in Figure 1a. The most prominent result is that
to first order, the AIRS and CERES OLR and OLRCLR data sets appear to be biased
compared to each other. Figure 1b presents the differences between the AIRS and
CERES monthly mean global mean values of OLR and OLRCLR shown in Figure 1a. The

11
difference between AIRS Version-5 OLR and CERES OLR shows a small annual cycle
superimposed on a nearly constant bias. Part of this annual cycle, with a maximum in
June and a minimum in December, may be the result of the large diurnal cycle of OLR
over land. The CERES Science Team adjusts for the effects of the diurnal cycle on
CERES Terra observations as described in Loeb et al., 2012b (supplementary
information). The AIRS monthly mean OLR product averages daytime and nighttime
OLR observations together but does not make any other correction for diurnal cycle.
Figure 1b also contains horizontal lines showing the average value of each difference.
The average value of the difference between AIRS and CERES OLR, computed over
the eight year time period September 2002 through August 2010, is 8.62 W/m2. This
average difference was computed over a full eight year period so as to minimize the
effect of the annual cycle on its value.
The differences between AIRS and CERES OLRCLR are similar to, but smaller
than, those of OLR, with regard to both their mean value and their seasonal cycle. The
mean value of AIRS minus CERES Terra OLRCLR is 8.03 W/m2, which is roughly
0.6 W/m2 less than that of AIRS minus CERES Terra OLR. The seasonal cycles of the
differences between AIRS and CERES OLR on the one hand, and AIRS and CERES
OLRCLR on the other, are displaced in time relative to each other. This displacement
might be a result of the significant sampling differences in the cases included in the
AIRS and CERES OLRCLR data sets, respectively.
The large biases between the AIRS Version-5 OLR and OLRCLR data records
and those of CERES are at first disconcerting but are readily understood. The AIRS
OLR product derived using the AIRS Science Team Version-6 retrieval algorithm has

12
been found to have much smaller biases compared to CERES Terra OLR than does
AIRS Version-5 OLR. The substantial, though nearly constant in time bias between OLR
as computed from AIRS products and observed by CERES is primarily a result of the
use of an older set of line by line absorption coefficients in the parameterization of the
Version-5 OLR RTA (Mehta and Susskind 1999a,b), compared to that used in the
improved OLR RTA (Iacono et al. 2008) used in Version-6. The main difference
between the two OLR parameterizations is that the Iacono et al. (2008) OLR RTA has
more absorption in the water vapor rotational band near 300 cm-1 than does Mehta and
Susskind (1999a). As a result of this, lower values of OLR would be computed in
Version-6, compared to those computed in Version-5, especially under very moist
conditions. Globally, there is more water vapor in the atmosphere in the northern
hemisphere summer, and less in the northern hemisphere winter, than in the annual
mean. This would contribute to the larger (more positive) differences in the Version-5
OLR product from that of CERES OLR product in the northern hemisphere summer,
and smaller (less positive) OLR differences in the northern hemisphere winter, as
shown in Figure 1b.
A prototype of the AIRS Version-6 retrieval algorithm has been run at the AIRS
Science Team Facility for April 2003 and April 2011. Monthly mean values of AIRS
Version-6 OLR and OLRCLR for these months are indicated in Figure 1a by blue
triangles and blue squares respectively. Figure 1b includes the monthly mean
differences between AIRS Version-6 OLR and CERES OLR for these months, shown in
green triangles, with values of 3.24 W/m2 and 3.27 W/m2 for April 2003 and April 2011,
respectively, and the differences between AIRS Version-6 OLRCLR and CERES OLRCLR,

13
shown in red squares, with values of 0.67 W/m2 and 0.70 W/m2. It is therefore expected
that AIRS Version-6 OLR and OLRCLR time series will be significantly closer to those of
CERES Edition 2.6 than the corresponding time series of AIRS Version-5, at least in the
mean sense. The remainder of this paper will include a comparison of anomaly time
series of AIRS Version-5 OLR and OLRCLR with those obtained from CERES. Anomaly
time-series obtained from two different sets of instruments can agree very well with
each other even if the individual data sets are biased against each other, provided the
bias for a given month of the year is essentially constant in time.
5. Comparison of AIRS and CERES Global Mean and Tropical Mean Anomaly Time
Series
We generated AIRS and CERES monthly mean OLR and OLRCLR climatologies
on a 1� x 1�������� ���������� �����������of the year by taking the average of the
grid box value for that month over an eight-year time period, i.e., eight consecutive
Januaries, eight consecutive Februaries, etc. The same ensembles of eight Januaries,
Februaries, etc., are used in the generation of climatologies for all products shown in
this paper. OLR and OLRCLR anomalies for a given month in a given year, on a 1� x 1��
spatial grid, are defined as the differences between their monthly mean values in that
year and their monthly climatologies for that grid box. The area mean anomaly for a
given month is defined as the cosine latitude weighted average of the grid box
anomalies contained in the area under consideration.
Figure 2a shows the global mean anomaly time series of AIRS Version-5 OLR
and CERES OLR for the period September 2002 through June 2011, as well as the
difference between the two sets of monthly mean anomalies. Figure 2b shows

14
analogous results for tropical mean OLR anomalies, and Figures 2c and 2d show
analogous global mean and tropical mean anomaly time series for the AIRS and
CERES OLRCLR products. We define a term, the El Niño Index, as the difference of the
NOAA monthly mean oceanic Sea Surface Temperature (SST), averaged over the
NOAA Niño-4 spatial area 5�����5��������������50��� �� � �����!"�#��������,
from a NOAA Niño-4 SST monthly mean climatology we generated in an analogous
manner to that used in the generation of the OLR climatologies. Figures 2b and 2d
include the values of the El Niño Index multiplied by 1.5. All anomaly time-series shown
in Figures 2a-2d, as well as anomaly time series shown in subsequent figures, have a
three point smoother applied to them.
Tropical mean OLR and OLRCLR anomalies both tend to track those of the El Niño Index
in phase fairly closely, but the greatest tropical mean OLR anomalies are almost twice
as large as the greatest OLRCLR anomalies. Positive values of the El Niño Index (2003,
2005, 2007, early 2010) correspond to El Niño (positive SST anomalies in the Niño-4
area) periods, and negative values (2008, mid-2010 to the present) correspond to La
Niña (negative SST anomalies) periods. Figures 2a and 2c show that an onset of
negative global mean anomalies for both OLR and OLRCLR began in late 2007. The
negative tropical mean anomalies of both OLR and OLRCLR shown in Figures 2b and 2d
are generally considerably larger than the corresponding global mean anomalies,
especially after mid-2007. The decreases in global mean OLR and OLRCLR in late 2007
are strongly influenced by the significant reduction in tropical mean OLR and OLRCLR
which started a few months earlier. Tropical mean OLR and OLRCLR anomalies became
positive starting in late 2009, roughly coincident with the onset of another El Niño event.

15
Very substantial negative global and especially tropical mean OLR anomalies occurred
in the period starting mid-2010, when the latest La Niña event began. Loeb et al.
(2012a, 2012b)) has already pointed out the existence of this relationship between
CERES OLR anomalies and El Niño/La Niña activity.
The difference between AIRS and CERES tropical mean OLR anomaly time
series, shown in green in Figure 2b, is positively correlated with the El Niño Index, with
a temporal correlation of 0.52. This is a result of fact that both positive and negative
tropical mean AIRS OLR anomalies are slightly larger in magnitude than those of
CERES. An analogous result is found with regard to the difference between AIRS and
CERES global mean OLR, which has a temporal correlation of 0.51 with the El Niño
Index.
5.1 Average Rates of Change and El Niño Corrrelations of Anomaly Time Series
We define the Average Rate of Change (ARC) of an anomaly time series as the
slope of the linear least squares fit of the anomaly time series. We use the term
Average Rate of Change to describe the slope of an anomaly time series rather than the
term Trend, which is generally used to characterize long-term multi-decadal data sets
rather than the eight year 10 month period studied in this paper. Figure 2b shows that
the El Niño Index is highly non-linear over this time period, with fluctuating values that
are primarily positive at the start of the time period and substantially negative at the end
of the time period. The ARC of the El Niño index, computed over the time period
September 2002 through June 2011, is -0.123 ± 0.046K/yr. The uncertainties shown
here and subsequently represent twice the standard error, $��of the regression slope of
the linear least squares fit (Draper and Smith, 1981). The precise value of the ARC of

16
the El Niño index, which depends on the length of the time period used in the
calculation, is less important than its sign, which shows that the El Niño region has
cooled on the average over the time period under study.
Spatial distributions of ARCs of OLR and other geophysical parameters will be
shown later in the paper. Spatial distributions of ARCs of geophysical parameters are
very coherent and are particularly informative with regard to the understanding of why
global mean and tropical mean OLR have decreased over the period September 2002
through June 2011. In this context, it is also very informative, if not more so, to examine
the spatial distribution of temporal correlations of 1���������grid point anomaly time series
with that of the El Niño index. We refer to these temporal correlations of anomaly time
series around the earth with the single anomaly time series of Tskin averaged over the
NOAA Niño-4 region as El Niño Correlations (ENCs). ENCs represent both the phase
and magnitude of the relationship between the time series of grid point anomalies and
that of the El Niño Index. Unlike ARCs, ENCs should not depend significantly on the
extent of the time series used to compute them if these correlations hold up over long
time periods. There should be a very close agreement between the spatial patterns of
ARCs of OLR with those of the ENCs of OLR in those spatial areas in which the ARCs
of OLR are strongly influenced by El Niño/La Niño activity, and these patterns will be of
opposite sign as a result of the negative ARC of the El Niño Index.
Table 1a shows global mean and tropical mean values of the ARCs of AIRS OLR
and CERES Terra OLR anomalies over the time period September 2002 through June
2011, the standard deviations between the two sets of global mean and tropical mean
anomaly time series, and the temporal correlations between each global mean and

17
each tropical mean anomaly time series. All statistics use values of the three point
smoothed anomaly time series shown in Figure 2. The agreement of the ARCs of both
global mean and tropical mean anomaly time series found in the AIRS and CERES OLR
records is on the order of ±0.03 W/m2/yr, which is within the uncertainty of the
respective sets of ARCs. The temporal correlations of the AIRS and CERES global
mean and tropical mean OLR anomaly time series are 0.955 and 0.991 respectively.
Both AIRS and CERES OLR anomaly time series show that global mean OLR has
decreased on the average on the order of %"�"&' W/m2/yr over the time period
September 2002 through June 2011, and that tropical mean OLR has decreased at a
rate of roughly -0.168 W/m2/yr from the beginning of the time period to the end.
Demonstration of the ability to obtain close agreement between global and tropical
mean ARCs of AIRS and CERES OLR anomaly time series, obtained in very different
manners, is more significant than the values of the ARCs themselves, which are
influenced by the extent of the time period used in the AIRS/CERES OLR data record
comparison.
Table 1b shows analogous statistics comparing AIRS and CERES OLRCLR
anomaly time series. The correlations between the AIRS and CERES OLRCLR anomaly
time series are still high, but somewhat reduced from those of the OLR anomaly time
series. In addition, the standard deviations of the OLRCLR anomaly differences are also
somewhat larger than those of OLR, and the global and tropical mean ARCs of OLRCLR
found in both data sets, while still negative, do not agree as closely as those of OLR.
Nevertheless, the agreement obtained between anomaly time series of AIRS and

18
CERES OLRCLR is better than might be expected given the significant sampling
differences between the cases included in each monthly mean OLRCLR data set.
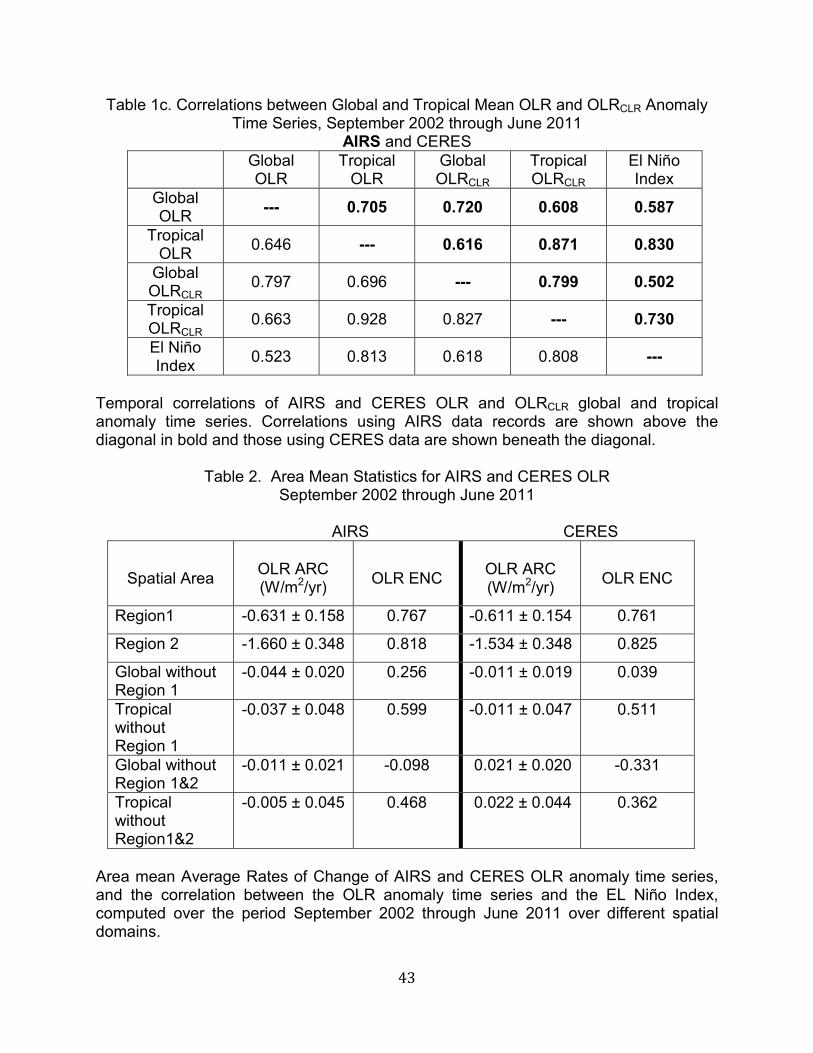
Table 1c shows temporal correlations between global mean and tropical mean
anomaly time series of OLR and OLRCLR as well as the correlations (ENCs) of the
anomaly time series with the El Niño Index. Correlations using AIRS time series are
shown above the diagonal in bold and those using CERES time series are shown
beneath the diagonal. As shown in Table 1c, the temporal correlation between the
CERES global and tropical mean OLR anomaly time series is 0.646, and the
corresponding correlation for the AIRS anomaly time series is 0.705. This shows that
tropical anomalies provide a significant contribution to the global OLR anomaly time
series found in both data sets. The CERES and AIRS tropical mean OLR anomaly time
series also correlate very highly with the El Niño index, with correlations greater than
0.8. CERES and AIRS tropical mean OLRCLR anomaly time series also have high
correlations with the El Niño Index, though somewhat smaller than those of the
corresponding OLR data sets. Both sets of global OLR and OLRCLR anomaly time series
also show moderate correlations, on the order of 0.55, with the El Niño Index. These
correlations of global and tropical anomaly time series with the El Niño Index further
imply that the recent short term decreases in global and tropical OLR over the time
period September 2002 through June 2011, as observed by both AIRS and CERES, are
strongly influenced by changes from El Niño conditions at the beginning of the time
series to La Niña conditions at the end.
5.2 The Spatial Distribution of ARCs and ENCs of OLR
This section compares the spatial distribution of ARCs of AIRS and CERES OLR
19
with each other on a 1��������(������������ basis, as well as the spatial distribution
of the correlations of the anomaly time series with the El Niño Index (ENCs). These
comparisons not only show excellent agreement of ARCs and ENCs of AIRS OLR
products with those of CERES on a small spatial scale, but also depict the spatial
regions that have been contributing significantly to the short term decreases in global
mean and tropical mean values of OLR over the period under study.
The global spatial distributions of OLR ARCs over the time period September
2002 through June 2011 are shown in Figures 3a and 3b for AIRS and CERES,
respectively. As discussed previously, more significant than the values of the ARCs
shown in Figure 3 is the very coherent spatial structure of the ARCs of OLR. Figures 3a
and 3b demonstrate two very important points. The first is the virtually indistinguishable
spatial distributions of the ARCs of AIRS OLR and of CERES OLR. Figure 3c shows
their difference, with a spatial correlation of 0.98 between the ARCs of the 2 OLR data
sets, and a standard deviation of 0.15 W/m2/yr. The global mean AIRS OLR ARC for
this period is 0.035 W/m2/yr lower (more negative) than that of CERES Terra. This small
difference is not monolithic, but occurs primarily near 30°S latitude, especially over
Eastern Australia in which the large negative ARCs of OLR are greater in AIRS than in
CERES.
The most important point of Figures 3a and 3b is that while the global mean and
tropical mean ARCs of OLR are negative, there is considerable spatially coherent
longitudinal structure of the ARCs of OLR at a given latitude, with differing signs and
amplitudes. This structure is largest in the tropics, but is found at other latitudes as well.
Figure 3 shows that positive OLR ARCs as large as 4.2 W/m2/yr exist in the vicinity of
20
the equatorial dateline. These are more than compensated for, in the tropical mean
sense, by negative OLR ARCs at other longitudes, as large as % 3.2 W/m2/yr near the
equator over Indonesia in the vicinity of 120°E longitude.
Figures 3a-d, and some subsequent figures, contain boxes surrounding three
areas. A box, shown in gray, surrounds the NOAA Niño-4 region, 5°N to 5°S and 150°W
westward to 160°E. A second box, shown in black, covers portions of the Eastern
tropical Pacific Ocean, Northern South America, and the equatorial Atlantic Ocean and
is the composite of three adjacent rectangles: 5°N to 20°S, 140°W to 95°W; 8°N to
20°S, 95°W to 70°W; and 8°N to 8°S, 70°W to 10°E. We will refer to the area
encompassed by these three contiguous rectangles as OLR Region 1. A third box, also
shown in black, encompasses the area between 15°S to 30°S and 135°E eastward to
165°W. We will refer to the area encompassed by this box as OLR Region 2.
ARCs of OLR within OLR Region 1 and OLR Region 2 are very negative over the
period September 2002 through June 2011. The decreases in OLR that took place in
these two regions will be shown later in the paper to account for most of the decreases
observed in global and tropical mean OLR which occurred during this time period. OLR
Regions 1 and 2 were selected entirely based on the results shown in Figures 3a and
3b. These regions were chosen both so as to be composed of contiguous rectangular
parts and also to encompass key features shown in these figures. OLR Region 2 is
essentially in the “heart” of the area referred to as the South Pacific Convergence Zone,
which varies its location according to the phases of the El Niño – Southern Oscillation
(ENSO) and of the Interdecadal Pacific Oscillation (Folland et al. 2002, Brown et al.
2011).

21
The spatial distributions of the ARCs of AIRS and CERES OLRCLR are not shown
here, but the difference between the ARCs of the two OLRCLR data sets is shown in
Figure 3d. The general agreement is again reasonably good, with a spatial correlation of
0.82. Figure 3d shows that much of the positive difference of AIRS global mean ARCs
of OLRCLR compared to CERES occurs over the oceans between the latitudes 50°N and
60°S. We do not understand the causes of these differences in OLRCLR at this time but
they are most likely, at least in part, a result of the significant sampling differences of the
ensembles of cases included in the AIRS and CERES monthly mean OLRCLR products.
The remainder of this paper will deal only with the OLR products.
Figures 4a-4c are analogous to Figures 3a-3c but show patterns of ENCs of
AIRS and CERES OLR and their difference. As found with regard to ARCs of OLR,
there is again considerable spatial structure, and excellent agreement, in the ENCs of
AIRS and CERES OLR, with a global spatial correlation of 0.97. This agreement shows
that not only are the slopes of high spatial resolution anomaly time series of AIRS and
CERES OLR in close agreement, but implies that the anomaly time series themselves
are also in close agreement.
The spatial structure of ENCs of OLR closely follows that of the OLR ARCs but
with opposite sign, especially in the tropics. For example, the area of large positive
ARCs of OLR including and surrounding the NOAA Niño-4 region has OLR anomalies
which are highly negatively correlated with the El Niño Index, that is, periods of positive
SST anomalies in the Niño-4 region correspond to negative OLR anomalies in this and
surrounding areas. This anti-correlation of the spatial distributions of ARCs and ENCs of
tropical OLR between September 2002 and June 2011 indicates that the tropical ARCs

22
of OLR shown in Figure 3 are very strongly influenced by time periods containing
significant El Niño/La Niña activity. The origin of these patterns will be addressed in
more detail later in the paper when ENCs of mid-tropospheric water vapor and cloud
cover are discussed.
The inverse relationship between spatial patterns of ARCs and ENCs holds in
some extra-tropical areas as well. Globally, the spatial distribution of ARCs and ENCs of
OLR have correlations of -0.78 and -0.79 for AIRS and CERES respectively. It is
interesting to note that differences between ARCs of AIRS and CERES OLR (Fig. 3c)
are also anti-correlated with the differences in their ENCs (Fig. 4c), with AIRS tropical
OLR anomaly correlations with El Niño activity being slightly higher than CERES OLR
anomaly correlations, thus resulting in slightly more negative tropical ARCs of AIRS
OLR compared to CERES as shown in Table 1a.
Figures 4a and 4b are very similar in appearance, but with opposite sign, to
Figure 3 of Davies and Molloy (2012), which shows the spatial distribution of the
temporal correlation of cloud top height anomalies H) derived from MISR with the
Southern Oscillation Index over the period 2000 through 2010. The sign reversal is
expected because OLR decreases with increasing H), and the Southern Oscillation
Index is similar to, and in phase with, the El Niño Index.
The spatial correlations of the anomaly time series of AIRS OLR with those of
CERES OLR for each 1° by 1° grid point are shown in Figure 4d. The global mean
AIRS/CERES OLR anomaly time series correlation, on a 1° x 1° spatial scale, is 0.93,
with the largest differences occurring in the mid-latitudes and over convective areas in
South American and Africa. This shows that as with their ARCs and ENCs, AIRS and

23
CERES OLR anomaly time series on a 1° x 1° spatial scale also agree closely with each
other.
5.3. Longitudinal Distribution of Equatorial Anomaly Time Series: Hovmöller
Diagrams
Figures 3 and 4 show that the tropics contain large spatially coherent areas with
alternating values of positive and negative ARCs and ENCs of OLR over the time period
under study. This section compares CERES and AIRS Hovmöller diagrams of OLR,
which show the longitudinal distribution of near equatorial anomaly time series of
CERES and AIRS OLR.
Figure 5a and 5b present Hovmöller diagrams showing time series of monthly
mean AIRS and CERES OLR anomalies (vertical scale), integrated over the latitude
range 5°N through 5°S, in each 1° longitude bin (horizontal scale) for the time period
September 2002 through June 2011. The difference between the AIRS OLR Hovmöller
diagram and the CERES OLR Hovmöller diagram is shown in Figure 5c. Figures 5a and
5b, and all subsequent Hovmöller diagrams, have a small amount of smoothing applied
to them. A five point (five month) smoothing was applied in the vertical and a 15 point
(15 degree) smoothing was applied in the horizontal to minimize the effects of small
discontinuities between adjacent rectangular grid points on the figures. Most of the
region covered is ocean. There are three relatively small land areas near the equator:
South America, Africa, and Indonesia. These land areas each lie between the three sets
of narrow black vertical lines shown in Figure 5, one of which is covered by one of the
two thick black vertical lines included in Figure 5. These lines at 140��� ���� 10�#,

24
encompass the longitudinal domain of OLR Region 1. The thick black line at 10�#� ����
on top of the thin line at the western edge of Africa.
The two sets of Hovmöller diagrams of tropical OLR anomalies are essentially
identical, with a correlation coefficient of 0.995 between them. Some of the largest
differences between the AIRS and CERES tropical anomaly time series occur in
November 2003 and January 2010, the two months for which AIRS data was
synthesized. The differences between AIRS and CERES in these two months would
have been much larger if the AIRS “monthly mean” OLR products stored at the Goddard
DISC were used in the calculations, as we did originally. In both cases, the AIRS
“monthly mean” products of the DISC represented averages over less than a month
time period, while the CERES data represented observations taken over the entire
month. The fact that the remainder of the OLR anomaly differences shown in Figure 5c
were so small alerted us to check, and correct for, the cause of the problem with these
two months.
The anomaly time series shown in Figure 5 depict the phase relationship of OLR
anomalies at different longitudes in the vicinity of the equator as a function of time. Such
figures provide insight into the spatial distribution of tropical ARCs and ENCs of OLR in
the vicinity of the equator shown in Figures 3 and 4. In the longitudinal band 160���
westward to 140�#�� �*��� ��� +,-� ��������� � �� �� � negative in late 2002/early
2003 which corresponds to an El Niño period. The very positive OLR anomalies in this
same longitudinal band from mid-2007 through early 2009 and mid-2010 through June
2011 both occur during La Niña periods. These features give rise to the substantial
positive OLR ARC shown in Figures 3a and 3b over the region 5��� – 5�����!"��� ��

25
140�#��.�� ��3 shows very negative values of OLR ARCs near the equator between
100�#������/"�#� ����������.�� ��5 shows that equatorial OLR anomalies between
100�#� �����/"�#�� �� ��� ��� ������ �� �����(� �����/"�#������!"�������� ��of
comparable magnitude. Figure 5 also shows that equatorial OLR anomalies from 140���
eastward to 10�#, within the longitudinal domain of OLR Region 1, tend to be smaller
than, and out of phase with, those from 160��� �� � �����/"�# , especially during La
Niña periods. This phenomenon gives rise to the negative equatorial OLR ARCs shown
in Figure 3 contained within OLR Region 1. The phase relationships discussed above
are also reflected in the ENCs of equatorial OLR shown in Figure 4.
6. The Effect of Phases of El Niño/La Niña on Tropical Water Vapor, Cloud
Cover, and OLR Anomaly Time Series
Figures 3 to 5 show that the spatial patterns of both the Average Rates of
Change and El Niño Correlations of OLR over the time period September 2002 through
June 2011, as observed by AIRS and CERES, are in excellent agreement with each
other, as are their equatorial anomaly time series in the vicinity of the equator. Both
CERES and AIRS OLR products show that the period September 2002 through June
2011 is marked by a substantial decrease in global mean OLR, on the order of
%0.075 W/m2/yr, and a larger decrease in tropical mean OLR on the order of
%0.165 W/m2/yr. This agreement of Average Rates of Change of OLR anomaly time
series derived from observations by two different instruments, in totally independent and
different manners, implies that both sets of OLR products must be stable over the eight
year 10 month period in which they were compared. There should be little question that
there actually was a significant decrease of global mean OLR over the time period

26
September 2002 through June 2011, and that the majority of the decrease occurred in
the tropics.
These results, found by both CERES and AIRS, should not be taken as indicative
in any way as to what will happen in the future. It mainly shows that OLR anomalies and
their Average Rates of Change can be determined very accurately by two totally
independent instrumental and theoretical approaches. The agreement of anomaly time
series of OLR as determined using CERES and AIRS observations also indirectly
validates the anomaly time series of the AIRS derived products used in the computation
of AIRS OLR, at least for the time period September 2002 through June 2011.
This section uses anomaly time series of AIRS derived products to explain the
factors contributing to the anomaly time series of OLR over the period under study and
why OLR anomalies are highly correlated with the El Niño Index. Figures 6a and 6b
show the spatial distribution of the ARCs and ENCs of AIRS Version-5 Tskin over the
period September 2002 through June 2011. The results shown in these figures provide
important insight toward the understanding of the spatial distribution of ARCs and ENCs
of OLR, as well as those of other related geophysical parameters on which OLR
depends. Aside from Tskin, OLR also depends significantly on the atmospheric
temperature profile T(p) and atmospheric water vapor profile q(p), and in the tropics,
even more so on the cloud top pressure pc and radiatively effective cloud fraction ��. It
is impractical to show results relating to anomaly time series of all the important
geophysical parameters affecting those of OLR. In this paper, for demonstrative
purposes, we concentrate on 500 mb specific humidity q500 and radiatively effective
cloud fraction ��. The OLR calculations of course take into account the detailed

27
changes in the entire water vapor profile and the heights and amounts of clouds, as well
as those of the temperature and ozone profiles on which OLR also depends.
A number of important features are found in Figure 6a. While the global mean
ARC of Tskin is essentially zero over this time period, there are areas in which significant
positive and negative Tskin ARCs exist. There has been considerable warming near the
North Pole over this time period, as well as considerable warming and cooling in
different areas over Northern Hemisphere extra-tropical land. In addition, there has
been substantial cooling over much of Africa, especially south of 15°S, as well as over
much of Australia. All of these areas in which extra-tropical land has either warmed or
cooled considerably over the time period under study are also characterized by
increases or decreases in OLR as shown in Figure 3. This is consistent with the fact
that everything else being equal, increases (decreases) in Tskin results in increases
(decreases) in OLR.
Figure 6a also shows that the tropics are marked by a substantial oceanic
surface temperature cooling over and immediately surrounding the Niño-4 region
contained within the gray rectangle. This area of oceanic cooling over the last nine
years is surrounded to the south, west, and north by areas in which oceanic warming
occurred during this period, though to a lesser extent. Figure 3 shows that OLR
changes in these oceanic areas are considerable, and unlike over extra-tropical land,
are of opposite sign to those of the changes in Tskin. This indicates that the changes in
tropical oceanic OLR in these regions are driven by changes in something other than
Tskin.

28
Figure 6b shows that as in the case of OLR, ENCs of Tskin are generally of opposite
sign to their ARCs. The global mean spatial correlation of ARCs and ENCs of Tskin is
-0.56, which is still appreciable but smaller than that for OLR. It is apparent from Figures
6a and 6b that the considerable cooling of Tskin that took place over South Africa and
Australia is related to a strong in phase response of Tskin to El Niño/La Niña activity in
these areas. On the other hand, the significant changes in Tskin that occurred over
Northern Hemisphere extra-tropical land, such as the warming that occurred near the
North Pole, are not in direct response to El Niño activity because ENCs of Tskin in these
areas are not appreciable. It is also interesting to note that in some equatorial oceanic
areas, such as in the vicinity of 90°W and 60°E, Tskin anomalies had moderate positive
correlations with El Niño activity but Tskin in those areas had very small Average Rates
of Change. In addition, while ARCs and ENCs of OLR within OLR Region 1 were all
large and of the same sign, this is not the case with regard to Tskin, in which ARCs and
ENCs of Tskin are of opposite sign in the Atlantic Ocean portion of OLR Region 1 as
compared to the Pacific Ocean. An analogous result occurs within OLR Region 2 in
which ARCs and ENCs of Tskin are of opposite sign over Australia as compared to the
Pacific Ocean to the East.
Figures 6c and 6d show ENCs of 500 mb specific humidity q500 and effective
������� �����01, respectively. In the tropics, ARCs of q500 ����01�2������ �3 are out of
phase with ENCs of these parameters, as was the case with ARCs and ENCs of OLR.
OLR is very sensitive to the concentration of mid-upper tropospheric water vapor in very
moist (i.e., most tropical) areas, in the sense that increasing water vapor concentration
increases atmospheric absorption in some spectral bands and therefore lowers OLR,

29
everything else being equal. OLR also decreases with increasing cloud cover,
especially for high clouds. As with Tskin, ENCs of q500 ����01�� ��(����� �������� ��
the Niño-4 region. This high positive correlation with El Niño activity resulted in both a
significant overall mid-tropospheric drying and a corresponding overall decrease in
cloud cover over the period under study in this region. An analogous situation occurs in
the surrounding areas of warming surface skin temperature, in which ENCs of q500 and
01�� ���� ���������� ������� ��considerable mid-tropospheric moistening as well as
increasing cloud cover in these regions during the period under study. Unlike Tskin
however, there are also large negative ENCs of q500 ����01 contained within most of
OLR Region 1 over this time period, resulting in both considerable mid-tropospheric
moistening and increasing cloud cover over most of OLR Region 1. Again, unlike Tskin,
on the average, OLR Region 2 also is marked by large negative ENCs of q500 and 01�
indicating that there has been considerable mid-tropospheric moistening and increasing
effective cloud fraction within most of OLR Region 2 over the time period under study as
well.
As with OLR, Hovmöller diagrams provide a good depiction of the
interrelationship of equatorial anomalies of different geophysical parameters as a
function of time and longitude. The Hovmöller diagram of monthly mean AIRS Tskin
anomalies for the period September 2002 through June 2011 is shown in Figure 7a.
The vertical gray lines in Figure 7a delineate the longitudinal band containing the Niño-4
region, 150°W longitude westward to 160°E longitude. The largest Tskin anomalies tend
to occur on either side of the dateline between these longitudinal limits. Figure 7a
clearly demonstrates that the large negative Tskin ARC in the Niño-4 region shown in

30
Figure 6a is the result of the transition from an El Niño condition (locally positive Tskin
anomaly) at the end of 2002 to La Niña conditions (locally negative Tskin anomalies) over
the time periods late 2007 through 2008, and especially late 2010 through mid-2011.
Equatorial Tskin anomalies between 100°E and 140°E tend to be smaller than, and of
opposite sign to, those in the vicinity of the dateline. This gives rise to the band of
weaker positive Tskin ARCs near the equator from 100°E to 140°E shown in Figure 6a.
Tskin anomalies in the equatorial Atlantic Ocean are also to some extent out of phase
with those in the Niño-4 region, resulting in the small positive ARCs, and moderately
negative ENCs, of Tskin in the equatorial Atlantic Ocean as shown in Figures 6a and 6b.
Figure 7b and 7c show the Hovmöller diagrams of q500 and ��. As in Figure 5, the
vertical thick black lines delineate the longitudinal extent of OLR Region 1, extending
from 140°W eastward to 10°E. Anomalies of q500 and �� near the dateline generally
both follow those of Tskin very closely, both in magnitude and in phase. This indicates,
not surprisingly, that positive SST anomalies in the Niño-4 region correspond to periods
of increased convection in that area, leading to enhancement of moisture in the mid-
troposphere as well as increases in cloud cover. Conversely, negative SST anomalies
in the Niño-4 area correspond to periods of decreased convection (increased
subsidence) leading to periods of a drier mid-troposphere and decreases in cloud cover.
Water vapor and cloud cover anomalies over Indonesia, from roughly 100°E to 140°E,
are out of phase with those near the dateline, as was found for Tskin. Unlike Tskin
anomalies over Indonesia, which were smaller than those near the dateline, q500 and ��
anomalies over Indonesia are closer in magnitude to those near the dateline. This is the
result of the westward shift of the area of maximum convection during La Niña periods

31
from the dateline to Indonesia. This out-of-phase relationship gives rise to the very
substantial negative ENCs of q500 and �� over Indonesia during this time period, as
shown in Figures 6c and 6d.
Figures 6c and 6d contain substantial negative ENCs of q500 and �� in some
tropical locations in which no significant changes in Tskin exist. The most notable of
these is off the west coast of South America, in the vicinity of 5°N to 20°S from 120°W
eastward to 80° W, which is a part of OLR Region 1. There is also another region of
positive q500 ENCs near the equator going across South America and extending
eastward along the Atlantic Ocean to about 10�#� ��������� which is also contained
within OLR Region 1. Figures 7b and 7c show that equatorial water vapor and cloud
cover anomalies off the west coast of South America are often out of phase with those
at the dateline, especially during the large La Niña events in 2007-2008 and 2010-2011.
This demonstrates that La Niña periods of decreased convection near the dateline also
correspond to periods of increased convection eastward of 120�#, as a result of the
eastward shift of the convective branch of the Walker circulation during La Niña periods
(Power and Smith 2007; Zhou et al. 2011). The same relationship is found to a lesser
extent over the Atlantic Ocean extending to 10�#� ���� ude at the eastern end of OLR
Region 1.
The Hovmöller diagrams of q500 and ��, shown in Figures 7b and 7c, are very
highly negatively correlated with that of OLR, shown in Figure 5. The Hovmöller
diagrams of q500 and �� have correlations of -0.79 and -0.93 respectively with those of
AIRS OLR, and -0.79 and -0.92 with those of CERES OLR. This further demonstrates

32
that anomalies in tropical mid-tropospheric water vapor, and especially in cloud cover,
are the driving forces behind changes in tropical OLR.
7. Attribution of Recent Decreases in Global and Tropical Mean OLR to
Changes Contained within OLR Regions 1 and 2
Figure 3 shows that the largest OLR ARCs occur in the tropics regions covering
Indonesia and near the dateline. OLR ARCs in these areas are roughly equal to each
other and of opposite sign, as are the OLR anomaly time series shown in Figure 5. The
effects of the large positive and negative tropical OLR ARCs near the dateline and over
Indonesia tend to cancel in the zonal mean sense. The large negative tropical mean
ARC of OLR results primarily from OLR anomalies in OLR Region 1. These in turn are
strongly influenced by water vapor and cloud cover anomalies in OLR Region 1, both of
which are very negatively correlated with El Niño activity.
Table 2 shows values of ARCs and ENCs of OLR averaged over different spatial
regions, as determined using each of the AIRS and CERES OLR data sets. ARCs of
OLR anomalies averaged over OLR Region 1, and especially over OLR Region 2, are
considerably larger than the corresponding tropical mean ARCs shown in Table 1a. On
the other hand, the ENCs of AIRS and CERES OLR in OLR Regions 1 and 2 are
comparable to each other, as well as to the corresponding tropical mean OLR ENCs
shown in Table 1c.
The negative tropical mean OLR ARC over the period September 2002 through
June 2011 computed as previously, but after replacing OLR ARCs in OLR Region 1 by
zeroes, is reduced from -0.183 W/m2/yr to -0.037 W/m2/yr for AIRS, and from -0.154
W/m2/yr to -0.011 W/m2/yr for CERES. Likewise, the negative global mean AIRS OLR

33
ARC, excluding ARCs within Region 1, is reduced from -0.094 W/m2/yr to -0.044
W/m2/yr, and from -0.059 W/m2/yr to -0.011 W/m2/yr for CERES. This indicates that
both OLR data sets show that a substantial part of the recent negative global mean and
tropical mean OLR ARCs results from the contribution of OLR anomalies contained
within OLR Region 1 to the overall statistics.
Water vapor and cloud cover anomalies in the relatively small OLR Region 2 also
contribute significantly to the recent decreases in global and tropical OLR. One-third of
this region is in the tropics and the remaining two-thirds is in the subtropics. As shown in
Table 2, both OLR data sets show that otherwise global and tropical mean ARCs,
computed after exclusion of OLR anomalies in both OLR Regions 1 and 2, are
essentially zero. Table 2 shows that ENCs of global and tropical mean OLR are also
substantially reduced when anomalies in OLR Regions 1 and 2 are excluded from the
calculations.
8. Summary
The first part of this paper compared September 2002 through June 2011
anomaly time series of OLR and OLRCLR data records, determined from CERES
observations as generated by the CERES Science Team, and from AIRS observations
as generated by the AIRS Science Team. Excellent agreement was found between the
CERES and AIRS OLR anomaly time series down to the 1 degree latitude by 1 degree
longitude spatial scale. CERES and AIRS data records both show that global mean and
tropical mean OLR have decreased over the time period under study, and more
significantly, that both global and tropical mean OLR anomaly time series are highly
positively correlated with El Niño/La Niña variability as expressed by an El Niño Index.

34
The paper then used anomaly time series of surface skin temperature, mid-tropospheric
water vapor, and cloud amounts derived from analysis of AIRS sounder data over this
time period to explain why global and tropical mean OLR anomaly time series are
positively correlated with the El Niño Index, which like global and tropical mean OLR,
has decreased on the average over this time period as a result of phases of El Niño/La
Niña oscillations.
The AIRS results shown in this paper were based on products derived using the
AIRS Science Team Version-5 retrieval algorithm. The AIRS Version-6 retrieval
algorithm is expected to become operational in mid-2012, and will be used to analyze all
future AIRS observations as well as reanalyze all previous AIRS observations. As
shown in this paper, AIRS Version-6 OLR and OLRCLR data records should be much
closer in the mean to those of CERES. AIRS Version-6 data records will also include
monthly mean values of the spectral components of OLR averaged over each of the 16
contiguous spectral bands used in the computation of OLR in Version-6. Anomaly time
series of OLR computed only over each of these spectral intervals, and the spatial
distribution of their Average Rates of Change and El Niño anomaly correlations, will
provide important additional information to help understand the effect of El Niño/La Niña
oscillations on OLR.
The results shown in this paper should not be taken in any way as to be
indicative of how OLR will change in the future. The EOS satellites carrying AIRS and
CERES are expected to last about 20 years. Having a 20 year time series of
overlapping AIRS and CERES OLR data records would be a very useful first step
towards monitoring and understanding long term variability of OLR. Continuation of

35
AIRS class and CERES class instrumentation beyond the EOS era will be needed to
fully monitor and understand longer term changes in OLR.
References:
Allan, R. P., and M. A. Ringer, 2003: Inconsistencies between satellite estimates of
longwave cloud forcing and dynamical fields from reanalyzes. Geophys. Res. Lett., 30, 4.
Barkstrom, B., E. Harrison, G. Smith, R. Green, J. Kibler, R. Cess, the ERBE Science
Team,1989: Earth Radiation Budget (ERBE) Archival and April 1985 Results. Bulletin of the
American Meteorological Society, 70, 1254-1262.
Barlow, M., M. Wheeler, B. Lyon, and H. Cullen, 2005: Modulation of Daily Precipitation
over Southwest Asia by the Madden-Julian Oscillation. Mon. Weather Rev., 133, 3579-
3594.
Brown, J. R., S. B. Power, F. P. Delage, R. A. Colman, A. F. Moise, B. F. Murphy, 2011:
Evaluation of the South Pacific Convergence Zone in IPCC AR4 Climate Model Simulations
of the Twentieth Century. J. Climate, 24, 1565-1582. doi:10.1175/2010JCLI3942.1.
Chiodi, A. M., and D. E. Harrison, 2010: Characterizing Warm-ENSO Variability in the
Equatorial Pacific: An OLR Perspective. J. Clim., 23, 2428-2439.
Chu, P. S., and J. B. Wang, 1997: Recent Climate Change in the Tropical Western Pacific
and Indian Ocean Regions as Detected by Outgoing Longwave Radiation Records. J. Clim.,
10, 636-646.
36
Chung, E. S., D. Yeomans, and B. J. Soden, 2010: An assessment of climate feedback
processes using satellite observations of clear-sky OLR. Geophys. Res. Lett., 37, 7.
Clement, A. C., B. Soden, 2005: The Sensitivity of the Tropical-Mean Radiation Budget. J.
Climate, 18, 3189-3203. doi: 10.1175/JCLI3456.1.
Davis, R., M. Molloy, 2012: Global Cloud Height Fluctuations Measured by MISR on Terra
from 2000 to 2010. Geophys. Res. Lett., 39, L03701, doi:10.1029/2011GL050506.
Dessler, A. E., Z. Zhang, and P. Yang, 2008: Water-vapor Climate Feedback Inferred from
Climate Fluctuations, 2003-2008. Geophys. Res. Lett., 35, L20704, doi:
10.1029/2008GL035333.
Dessler, A. E., 2010: A Determination of the Cloud Feedback from Climate Variations over
the Past Decade. Science, 330, 1523-1527. doi: 10.1126/science.1192546
Doelling, D. R., N. G. Loeb, D. F. Keyes, M. K. Nordeen, D. Morstad, B. A. Wielicki, D. F.
Young, and M. Sun, 2012: Geostationary Enhanced Temporal Interpolation for CERES
Flux Products. J. Appl. Meteor. & Climate (in preparation).
Draper, N. and H. Smith, 1981: Applied Regression Analysis, Second Edition. Wiley, ISBN
047102995-5.
Fasullo, J. T., and K. E. Trenberth, 2008: The Annual Cycle of the Energy Budget. Part II:
Meridional Structures and Poleward Transports. J. Clim., 21, 2313-2325.

37
Folland, C. K., J. A. Renwick, M. J. Salinger, and A. B. Mullan, 2002: Relative influences of
the Interdecadal Pacific Oscillation and ENSO on the South Pacific Convergence Zone.
Geophys. Res. Lett., 29, 13 doi:10.1029/2001GL014201.
Gruber, A., R. Ellingson, P. Ardanuy, M. Weiss, S. K. Yang, and S. N. Oh, 1994: A
Comparison of ERBE and AVHRR Longwave Flux Estimates. Bulletin of the American
Meteorological Society, 75, 2115-2130.
Jones, C., L. M. V. Carvalho, R. W. Higgins, D. E. Waliser, and J. K. E. Schemm, 2004:
Climatology of Tropical Intraseasonal Convective Anomalies: 1979-2002. J. Clim., 17, 523-
539.
Kidson, J. W., M. J. Revell, B. Bhaskaran, A. B. Mullan, and J. A. Renwick, 2002:
Convection Patterns in the Tropical Pacific and Their Influence on the Atmospheric
Circulation at Higher Latitudes. J. Clim., 15, 137-159.
Kiladis, G. N., K. H. Straub, and P. T. Haertel, 2005: Zonal and Vertical Structure of the
Madden-Julian Oscillation. Journal of the Atmospheric Sciences, 62, 2790-2809.
Kyle, H. L., A. Arking, J. R. Hickey, P. E. Ardanuy, H. Jacobowitz, H. Jacobowitz, L. L.
Stowe, G. G. Campbell, T. Vonder Haar, F. B. House, R. Maschhoff, and G. L. Smith, 1993:
The Nimbus Earth Radiation Budget (ERB) Experiment: 1975-1992. Bull. Am. Meteorol.
Soc., 74, 815-830.

38
Loeb, N. G., S. Kato, K. Loukachine, and N. Manalo-Smith, 2005: Angular Distribution
Models for Top-of-Atmosphere Radiative Flux Estimation from the Clouds and the Earth’s
Radiant Energy System Instrument on the Terra Satellite. Part 1: Methodology. J. Atmos.
Ocean. Tech., 22(4), 338-351.doi:10.1175/JTECH1712.1.
Loeb, N. G., S. Kato, W. Su, T. Wong, F. Rose, D. Doelling, J. Norris, 2012a: Advances in
Understanding Top-of-Atmosphere Radiation Variability from Satellite Observations.
Surveys in Geophysics, doi:10.1007/S10712-012-9175-1.
Loeb, N. G., J. M. Lyman, G. C. Johnson, R. P. Allan, D. R. Doelling, 2012b: Observed
Changes in Top-of-the-atmosphere Radiation and Upper-ocean Heating Consistent within
Uncertainty. Nature Geoscience, doi:10.1038/NGE01375 and supplementary information.
McClatchey, R. A., R. W. Fenn, J. E. A. Selby, F. E. Volz, and J. S. Garing, 1972: Optical
Properties of the Atmosphere (Third Edition). Environ. Res. Papers, 411, AFCRL, Bedford,
MA, 108 pp.
Mehta, A. V. and J. Susskind, 1999a: Outgoing Longwave Radiation from the TOVS
Pathfinder Path A Data Set. J. of Geophys. Res., 104, 12193-12212.
Mehta, A. V. and J. Susskind, 1999b: Longwave Radiative Flux Calculations in the TOVS
Pathfinder Path A Data Set. NASA Tech. Rep., GSFC/CR-1999-208643.
Proc. SPIE International Symp. Infrared Spaceborne Remote Sensing and Instrumentation
XVII, San Diego, CA, August 2009.

39
Minnis, P., Q. Z. Trepte, S. Sun-Mack, Y. Chen, D. R. Doelling, et al., 2008: Cloud Detection
in Non-polar Regions for CERES Using TRMM VIRS and Terra and Aqua MODIS Data.
IEEE Trans. Geosci. Remote Sens., 46, 3857-3884.
Minnis, P., S. Sun-Mack, D. F. Young, P. W. Heck, D. P. Garber, et al., 2011: CERES
Edition-2 Cloud Property Retrievals Using TRMM VIRS and Terra and Aqua MODIS data.
Part 1: Algorithms. IEEE Trans. Geosci. Remote Sens. (in press).
Power, S. B., and I. N. Smith, 2007: Weakening of the Walker Circulation and apparent
dominance of El Niño both reach record levels, but has ENSO really changed?, Geophys.
Res. Lett., 34, L18702, doi:10.1029/2007GL030854.
Soden, B. J., and I. M. Held, 2006: An Assessment of Climate Feedbacks in Coupled
Ocean–Atmosphere Models. J. Clim., 19, 3354-3360.
Soden, B. J., I. M. Held, R. Colman, K. M. Shell, J. F. Kiehl, C. A. Shields, 2008: Quantifying
Climate Feedbacks Using Radiative Kernels. J. Clim., 21, 3504-3520.
Susskind, J. and J. E. Searl, 1978: Synthetic Atmospheric Transmittance Spectra Near 15
4������/�5�4���J. Quant. Spectr. Rad. Trans., 19, 195-215.
Susskind, J., P. Piraino, L. Rokke, L. Iredell, and A. V. Mehta, 1997: Characteristics of the
TOVS Pathfinder Path A Data Set. Bull. of Amer. Meteorol. Soc., 78, 1449-1472.

40
Susskind, J., C.D. Barnet, J.M. Blaisdell, 2003: Retrieval of atmospheric and surface
parameters from AIRS/AMSU/HSB data in the presence of clouds. IEEE Transactions on
Geoscience and Remote Sensing, Issue 2, 41, doi: 10.1109/TGRS.2002.808236, 390-409.
Susskind, J., J. Blaisdell, and L. Iredell, 2009: Improved Determination of Surface and
Atmospheric Temperatures Using Only Shortwave AIRS Channels. Proc. SPIE International
Symp. Infrared Spaceborne Remote Sensing and Instrumentation XVII, San Diego, CA,
August 2009.
Susskind, J., J. M. Blaisdell, L. Iredell, and F. Keita, 2011a: Improved Temperature
Sounding and Quality Control Methodology Using AIRS/AMSU Data: The AIRS Science
Team Version 5 Retrieval Algorithm. Geoscience and Remote Sensing, IEEE Transactions
on Geoscience and Remote Sensing, Issue: 99 Digital Object Identifier:
10.1109/TGRS.2010.2070508, 1-25.
Susskind, J., J. Blaisdell, and L. Iredell, 2011b: Improved Surface and Tropospheric
Temperature Determined Using Only Shortwave Channels: The AIRS Science Team
Version-6 Retrieval Algorithm. Proc. SPIE Optics and Photonics, Paper #8153-5, San
Diego, CA, August 2011.
Trenberth, E. T., J. T. Fasullo, C. O’Dell, and T. Wong, 2010: Relationships between
tropical sea surface temperature and top-of-atmosphere radiation. Geophys. Res. Lett., 37,
L03702, doi:10.1029/2009GL042314.

41
Wielicki, B. A., B. R. Barkstrom, E. F. Harrison, R. B. Lee III, G. L. Smith, and J. E. Cooper,
1996: Clouds and the Earth’s Radiant Energy System (CERES): An Earth Observing
System Experiment. Bull. Amer. Meteor. Soc., 77, 853-868.
Wong, T., B. A. Wielicki, R. B. Lee, III, G. L. Smith, K. A. Bush, J. K. Willis, 2006:
Reexamination of the Observed Decadal Variability of the Earth Radiation Budget Using
Altitude-Corrected ERBE/ERBS Nonscanner WFOV Data. J. Climate, 19, 4028-4040.
Zhou, Y. P., K.-M. Xu, Y. C. Sud, and A. K. Betts, 2011: Recent Trends of the Tropical
Hydrological Cycle Inferred from Global Precipitation Climatology Project and International
Satellite Cloud Climatology Project Data. J. Geophys. Res., 116, D09101, doi:
10.1029/2010JD015197.

42
Table 1a. OLR Anomaly Time Series ComparisonSeptember 2002 through June 2011
Data Set Global Tropical
AIRS ARC (W/m2/yr) %0.094 ± 0.026 %0.183 ± 0.070
CERES Terra ARC (W/m2/yr) %0.059 ± 0.022 %0.154 ± 0.066
AIRS Minus CERES STD (W/m2) 0.136 0.155
AIRS/CERES Correlation 0.955 0.991
Global and Tropical mean statistical comparisons of AIRS and CERES OLR anomaly time series for the period September 2002 through June 2011. Shown are the Average Rates of Change, the standard deviations between the anomaly time series, and the temporal correlations of the anomaly time series.
Table 1b. OLRCLR Anomaly Time Series ComparisonSeptember 2002 through June 2011
Data Set Global Tropical
AIRS ARC (W/m2/yr) %0.021 ± 0.020 %0.072 ± 0.042
CERES Terra ARC (W/m2/yr) %0.089 ± 0.020 %0.144 ± 0.044
AIRS Minus CERES STD (W/m2) 0.222 0.247
AIRS/CERES Correlation 0.772 0.936
Global and Tropical mean statistical comparisons of AIRS and CERES OLRCLR anomaly time series for the period September 2002 through June 2011. Shown are the Average Rates of Change, the standard deviations between the anomaly time series, and the temporal correlations of the anomaly time series.
43
Table 1c. Correlations between Global and Tropical Mean OLR and OLRCLR Anomaly Time Series, September 2002 through June 2011
AIRS and CERESGlobal OLR
TropicalOLR
GlobalOLRCLR
Tropical OLRCLR
El NiñoIndex
GlobalOLR --- 0.705 0.720 0.608 0.587
TropicalOLR 0.646 --- 0.616 0.871 0.830
GlobalOLRCLR
0.797 0.696 --- 0.799 0.502
Tropical OLRCLR
0.663 0.928 0.827 --- 0.730
El NiñoIndex 0.523 0.813 0.618 0.808 ---
Temporal correlations of AIRS and CERES OLR and OLRCLR global and tropical anomaly time series. Correlations using AIRS data records are shown above the diagonal in bold and those using CERES data are shown beneath the diagonal.
Table 2. Area Mean Statistics for AIRS and CERES OLRSeptember 2002 through June 2011
AIRS CERES
Spatial Area OLR ARC (W/m2/yr) OLR ENC OLR ARC
(W/m2/yr) OLR ENC
Region1 -0.631 ± 0.158 0.767 -0.611 ± 0.154 0.761
Region 2 -1.660 ± 0.348 0.818 -1.534 ± 0.348 0.825
Global withoutRegion 1
-0.044 ± 0.020 0.256 -0.011 ± 0.019 0.039
Tropical withoutRegion 1
-0.037 ± 0.048 0.599 -0.011 ± 0.047 0.511
Global without Region 1&2
-0.011 ± 0.021 -0.098 0.021 ± 0.020 -0.331
Tropical without Region1&2
-0.005 ± 0.045 0.468 0.022 ± 0.044 0.362
Area mean Average Rates of Change of AIRS and CERES OLR anomaly time series, and the correlation between the OLR anomaly time series and the EL Niño Index, computed over the period September 2002 through June 2011 over different spatial domains.

44
Figure and Table Captions
Figure 1
a) Monthly mean global mean time series values of AIRS Version-5 and CERES Terra
Edition-2.6 OLR and OLRCLR for the period September 2002 through June 2011.
Monthly mean values of AIRS Version-6 OLR and OLRCLR products are also shown for
April 2003 and April 2011. b) Global monthly mean differences of values shown for
Figure 1a. The green and red horizontal lines show the average values of the
differences between AIRS and CERES OLR and AIRS and CERES OLRCLR
respectively.
Figure 2
Monthly mean global mean AIRS and CERES Terra OLR anomaly time series and their
anomaly differences for the period September 2002 through June 2011. a) Global mean
OLR anomalies. b) Tropical mean (20°N to 20°S) anomalies, as well as the El Niño
Index multiplied by 1.5. c) As in a) but for OLRCLR, and d) as in b) but for OLRCLR.
Figure 3
Spatial 1° latitude by 1° longitude distribution of OLR ARCs over the time period
September 2002 through June 2011. The NOAA Niña-4 region is outlined in gray and
OLR Regions 1 and 2 are outlined in black in this and most subsequent figures showing
spatial distributions of ARCs of different parameters. a) AIRS OLR ARCs, b) CERES
OLR ARCs, c) AIRS minus CERES OLR ARCs, and d) AIRS minus CERES OLRCLR
ARCs.

45
Figure 4
Spatial 1° latitude by 1° longitude distribution of OLR correlations over the time period
September 2002 through June 2011: a) AIRS OLR ENCs, b) CERES OLR ENCs,
c) AIRS minus CERES OLR ENCs, d) AIRS and CERES OLR anomaly correlations.
Figure 5
Hovmöller diagram for time series of monthly mean anomalies (vertical scale) integrated
over the latitude range 5°N through 5°S in each 1° longitude bin (horizontal scale) for
the period September 2002 through June 2011. The longitudinal domain of OLR Region
1 is indicated by the black vertical lines in this and most subsequent Hovmöller
diagrams. a) AIRS OLR, b) CERES OLR, c) the difference between AIRS and CERES
OLR anomalies.
Figure 6
Spatial distribution of ARCs and ENCs of AIRS retrieved geophysical parameters for the
period September 2002 through June 2011. a) ARCs of Surface Skin Temperature
(K/yr). b) ENCs of Surface Skin Temperature. c) ENCs of q500. d) ENCs of 01�
Figure 7
Hovmöller diagrams of AIRS retrieved products. a) Tskin. The longitudinal domain of the
NOAA Niño-4 region is encompassed by the gray vertical lines b) q500. The longitudinal
domain of OLR Region 1 is encompassed by the thick black vertical lines. c) as in b) but
f� �01�

46
Table 1a
Global and Tropical statistical comparisons of OLR anomaly time series for the period
September 2002 through June 2011 for AIRS and CERES Terra OLR. Shown are the
Average Rates of Change, the standard deviations between the anomaly time series,
and the temporal correlations of the anomaly time series.
Table 1b
Global and Tropical statistical comparisons of OLRCLR anomaly time series for the
period September 2002 through June 2011 for AIRS and CERES Terra OLRCLR. Shown
are the Average Rates of Change, the standard deviations between the anomaly time
series, and the temporal correlations of the anomaly time series.
Table 1c
Temporal correlations of AIRS and CERES OLR and OLRCLR global and tropical
anomaly time series. Correlations using AIRS data records are shown above the
diagonal in bold and those using CERES data are shown beneath the diagonal.
Table 2
Area mean Average Rates of Change of AIRS and CERES OLR anomaly time series,
and the correlation between the OLR anomaly time series and the El Niño Index,
computed over the period September 2002 through June 2011 over different spatial
domains.

47
Figure 1
Global OLR and Clear Sky OLR Time Series September 2002 through June 2011
Differences
AIRS Version-5 OLR AIRS Version-6 OLR CERES Edition-2.6r OLR AIRS Version-5 Clear Sky OLR AIRS Version-6 Clear Sky OLR CERES Edition-2.6r Clear Sky OLR
AIRS Version-5 minus CERES OLR AIRS Version-6 minus CERES OLR AIRS Version-5 minus CERES Clear Sky OLR AIRS Version-6 minus CERES Clear Sky
a b8.628.03

48
Figure 2
AIRS CERES AIRS minus CERES
AIRS CERES AIRS minus CERES 1.5 times NOAA Niño-4 Index
OLR Anomaly Time Series September 2002 through June 2011
Global Mean Tropical Mean a b
AIRS CERES AIRS minus CERES
AIRS CERES AIRS minus CERES1.5 times NOAA Niño-4 Index
Clear Sky OLR Anomaly Time SeriesSeptember 2002 through June 2011
Global Mean Tropical Meanc d

49
Figure 3
AIRS minus CERES OLR AIRS minus CERES Clear Sky OLR
Average Rates of Change (ARCs) September 2002 through June 2011
AIRS OLR CERES OLR
Global Mean=-0.094 STD= 0.82 Global Mean=-0.059 STD=0.82
Global Mean=-0.035 STD=0.15 Corr=0.98 Global Mean=0.068 STD=0.16 Corr=0.82
b) a)
c) d)

50
Figure 4
Global Mean=0.04 STD=0.33 Global Mean=0.03 STD=0.36
AIRS ENCs minus CERES ENCs AIRS vs. CERES
OLR Anomaly Correlations September 2002 through June 2011
AIRS ENCs CERES ENCs
Global Mean=0.93 STD=0.04Global Mean=0.01 STD=0.06 Corr=0.97
a) b)
c) d)

51
Figure 5
OLR Anomalies Tropics 5°N to 5°S Monthlies, September 2002 through June 2011
AIRS CERES AIRS minus CERES Correlation=0.995
a) b) c)

52
Figure 6
500 mb Specific Humidity ENCs Effective Cloud Fraction ENCs
AIRS Products September 2002 through June 2011 Tskin ARCs (K/yr) Tskin ENCsa) b)
c) d)
Global Mean=0.08 STD=0.35Global Mean=-0.01 STD=0.10
Global Mean=-0.08 STD=0.28 Global Mean=0.06 STD=0.34

53
Figure 7
AIRS Anomalies Tropics 5°N to 5°S Monthlies, September 2002 through June 2011
Skin Temperature (K) 500 mb Specific Cloud Fraction (%) Humidity (%)
a) b) c)


![Comparison of Anomalies and Trends of OLR as Observed ......AIRS Version 5 Zonal Mean Trends for September 2002 through August 2009 OLR [W/m 2 /yr] Global Mean=-0.12 National Aeronautics](https://img.dokumen.tips/doc/110x75/609fdaff7ebe190290188b5e/comparison-of-anomalies-and-trends-of-olr-as-observed-airs-version-5-zonal.jpg)