Embed Size (px)
Citation preview

SUBMITTED TO IEEE TVCG, APRIL, 2003 100
Interactive Volume Rendering of Thin ThreadStructures within Multivalued Scientific Datasets
Andreas Wenger, Daniel F. Keefe, Song Zhang, David H. Laidlaw
Abstract—We present a threads and halos representation for interactivevolume rendering of vector-field structure and describe a number of addi-tional components that combine to create effective visualizations of multi-valued 3D scientific data. After filtering linear structures, such as flow lines,into a volume representation, we use a multi-layer volume rendering ap-proach to simultaneously display this derived volume along with other datavalues. We demonstrate the utility of threads and halos in clarifying depthrelationships within dense renderings, and we present results from two sci-entific applications: visualization of second-order tensor valued magneticresonance imaging (MRI) data and simulated 3D fluid flow data. In bothapplication areas, the interactivity of the visualizations proved to be im-portant to the domain scientists. Finally, we describe a PC-based imple-mentation of our framework along with domain specific transfer functions,including an exploratory data culling tool, that enable fast data exploration.
Keywords—Scientific Visualization, Diffusion Tensor Imaging (DTI), Fluid Flow Vi-
sualization, Medical Imaging, Direct Volume Rendering, Volume Graphics,Volume Shading, Multi-textures, PC Graphics Hardware
I. I NTRODUCTION
We describe a thread and halo technique suitable for interac-tive volume rendering of thin linear structures together with anumber of components that make it useful for visualization ofmultivalued 3D scientific data. Two scientific applications driveour volume-rendering work: understanding brain anatomy andpathology, and understanding blood flow in coronary arteries.These driving applications have provided the problems, and, asBrooks suggests, the extent to which our application facilitatesthe solution of these problems helps to evaluate and guide ouralgorithm and tool development [1].
Creating comprehensive and accurate visualizations for ex-ploring 3D multivalued data is challenging. The first challengeis to create visualizations in which the data nearer to the viewerdoes not excessively obscure that farther away. The second chal-lenge is to represent many values and their interrelationships ateach spatial location.
Interactive volume rendering with user controlled transferfunctions can provide a promising approach for overcomingmuch of the obscuration problem. By using transparency effec-tively, transfer functions can be designed that show importantfeatures in a dataset throughout a volume. Interactive control al-lows a scientist to weight the relative importance (usually tied toan opacity level) of data values or features while exploring thedataset.
In our work, we rely heavily on volume rendering techniques.In fact, we use a multi-layer volume rendering approach, similarto [2] to enable us to fully represent multivalued datasets. Wealso make heavy use of transfer functions and provide interac-tive controls that are tailored to our application domains.
The authors can be reached at the Brown University Departmentof Computer Science, Brown University, Providence, RI 02912,{aw,dfk,sz,dhl}@cs.brown.edu
The key contribution of our work is a clear volumetric vector-field representation that can be rendered interactively. Datasetsthat can benefit from this representation are common in fluidflow research and medical imaging. Our thread and halo rep-resentation, shown in Figure 1, together with direct volumerendering, provides clear visual indications of complex lin-ear forms, depth relationships among multiple densely packedthreads, and changing data values along the length of the thread.In this paper, we demonstrate that our threads and halos tech-nique can be incorporated into a multi-layer volume renderingscheme and displayed at interactive frame rates on modern con-sumer graphics cards. We also describe the benefits of such animplementation for our scientific collaborators.
In the next section we discuss related work. We then describeour layered volume rendering framework, threads and halos, andour interactive controls. Results for our two driving applicationsare then presented and discussed along with some conclusionsfrom this work.
II. RELATED WORK
Below we survey relevant work in diffusion tensor field vi-sualization, vector field visualization, and hardware-acceleratedvolume rendering.
A. Visualization of Diffusion Tensor Fields
There are several approaches to visualizing diffusion tensorimaging (DTI) datasets. Pierpaoliet al. [3] used a 2D array ofellipsoids to visualize a 2D diffusion tensor field. To give a morecontinuous visual appearance, Laidlawet al. [4] normalize theellipsoids. They also use concepts from oil painting, mappingdata components onto brush strokes and building up the strokesin multiple layers, to represent more values in the data. None ofthese 2D methods generalize well to 3D.
Kindlmannet al. [5] attacked the problem of obscuring datapoints in 3D with a direct-volume-rendering approach: at everydata point they assign an opacity and color based on the under-lying diffusion tensor dataset. However, it is still difficult topick out anatomically distinct regions of the brain and under-stand their connectivity. The direct volume rendering portionof our work is similar to this approach, but makes connectiv-ity information more apparent by using a coloring and lightingscheme based on diffusion magnitude and diffusion anisotropymeasurements.
Delmarcelle and Hesselink [6] introduced hyperstreamlines, amethod that captures all of the attributes of tensors along a path.In our visualizations we represent the type of diffusion along apath through color coding rather than a change in cross sectionshape.
Several improvements to the basic concept of integrating

SUBMITTED TO IEEE TVCG, APRIL, 2003 101
Fig. 1. Interactive renderings of a human brain dataset. The renderings (top) show collections of threads consistent with major white-matter structures: IC=internalcapsule, CR=corona radiata, CB=cingulum bundle, CC=corpus callosum, diagrammed on the bottom. Components of the tensor-valued data control thread direction,color, and density as described in the text. Direct volume rendering simultaneously shows the ventricles (labeled V) in blue for anatomical context.
Fig. 2. Left: a direct-volume-rendered layer showing regions with different diffusion anisotropy. Right: a thread layer showing both the anisotropy and diffusiondirection. The two layers are combined in the center image which shows significantly more information and requires little additional visual bandwidth.
paths along the principle eigenvector field were suggested in[7] and [8], mainly to stabilize the propagation in isotropic re-gions. Basseret al. [9] calculated the trajectories of neuralfibers in brain white matter that were generated from the dif-fusion tensor field by integrating along the eigenvector with thelargest eigenvalue. Zhanget al. [10] used this method to gener-ate streamtubes to visualize continuous directional informationin the brain. We extend Zhang et al.’s algorithm to continuestreamtubes through areas with planar anisotropy. In addition,we filter the resulting paths into a densely packed thread volumerather than representing them as polygonal models.
B. Visualization of Vector Fields
Of the extensive work on creating effective vector field visu-alizations, the following two papers are most closely related toour work. Interrante and Grosch [11] visualized 3D flow withvolume line integral convolution (LIC). As they demonstratedwith offline rendering, their visibility-impeding halos improvedepth perception and help make complex 3D structures easier toanalyze. Our technique builds on this work to produce a similareffect interactively.
Zockleret al. [12] introduced illuminated field lines to visu-alize 3D vector fields. Our illuminated thread representation issimilar, but our volumetric rendering approach renders at a rateindependent of the tube or line complexity and combines with

SUBMITTED TO IEEE TVCG, APRIL, 2003 102
Fig. 3. Three thread volumes showing brain connectivity information (the front of the head points right). Shown without halos on the left, with halos in the center,and after slightly shifting the halos away from the viewer to brighten the threads on the right.
our other volumetric layers to create visualizations that conveymore information.
Li et al. [13] presented a volumetric texture based method tovisualize 3D vector fields. They scan convert properties of thestreamlines into a volumetric texture and then use these proper-ties to look up color and opacity information in an appearancetexture. Our approach differs in that our threads, while individ-ually less visually complex, are much thinner and more denselypacked; we also represent data more complicated than vectorfields.
C. Hardware-Accelerated Volume Rendering
Cabralet al. [14] introduced a 3D texture approach for vol-ume rendering using view-aligned slices that exploit trilinear in-terpolation. In addition, we make significant use of hardwaretexture compression to reduce texture memory consumption.
There are also several volume-rendering implementationsthat make use of dedicated hardware [15] or distributed hard-ware [16], that are capable of visualizing multi-valued volumet-ric datasets.
Our multi-layer volume rendering is closely related to thetwo-level volume rendering presented by Hauseret al. [2]. Inthis scheme, the two levels are an object level and a globallevel. Different rendering styles, such as direct volume ren-dering, maximum intensity projection, or value integration, areused for each level. Our system is based on the same concept ofrendering multiple volumes of information into the same visual-ization space. However, we use separate volumetric datasets forour layers of information, rather than classifying a single vol-ume of data as either focus or context. In some cases our halosand threads could be conceptualized as together forming afo-cuslevel for the visualization with any additional direct volumerendered layers forming thecontextlevel.
Kniss et al. [17] use interactive transfer functions operat-ing on directional derivative values to select boundaries inscalar-valued datasets. We use this technique to visualize ourscalar-valued datasets, although with less sophisticated interac-tive manipulation widgets. In [18], multi-dimensional trans-fer functions and dual-domain interaction are applied to multi-variate meteorological data. They found, as we did, that multi-dimensional transfer functions provide a powerful tool to ex-plore multivariate datasets.
Lum and Ma [19] implemented a hardware-accelerated paral-lel nonphotorealistic volume renderer that uses multi-pass ren-dering on consumer-level graphics cards. Their system em-phasizes edges or depth ordering using artistically motivatedtechniques. Like Lum and Ma, we utilize multiple renderingpasses to enhance visual cues, but our rendering is targeted toexploratory visualization of multi-valued data, which has signif-icant implications for the interface, implementation, and results.
Stompelel al. [20] use nonphotorealistic (NPR) volume ren-dering to more effectively visualize multivariate volumetricdata. They use stroke rendering to display a vector field simul-taneously with a scalar field and produce several NPR effects,including silhouettes. Their silhouettes help to emphasize depthdiscontinuities just like our halos but will not work for featuresas small as our threads because a reliable gradient cannot be cal-culated.
D. Hair, Fur, and Thread Rendering
Several hair and fur rendering algorithms inspired our work.Kajiya and Kay [21] introduced texels to render realistic-lookingfur. Kajiya and Kay also developed a Phong-like lighting modelfor fur; our approach is similar but targets free-floating threads.Instead of providing parameters for lighting, we store derivedvalues from the multivalued datasets along with tangent anddensity values throughout the volume.
Lengyel [22] uses a volumetric texture approach to ren-der short threads in real time. Unlike his short threads, ourdata-defined threads remain individually distinguishable. LikeLengyel, we use Banks’ [23] hair-lighting model but with a dif-ferent implementation appropriate for volume rendering.
III. A L AYERED VOLUME-RENDERING FRAMEWORK
Our visualization framework has four steps. We begin withprimary multivalued volumetric data.Calculate Derived Datasets. Since the primary data is oftendifficult to interpret directly, our first step is to calculate derivedvolumes of data with more intuitive interpretations. For exam-ple, DTI datasets are second-order tensor fields. It is often use-ful to decompose these into several scalar and vector fields toreduce the problem of rendering a tensor field into one of ren-dering several simpler fields.Define Visual Abstractions. In the abstraction step, we group
SUBMITTED TO IEEE TVCG, APRIL, 2003 103
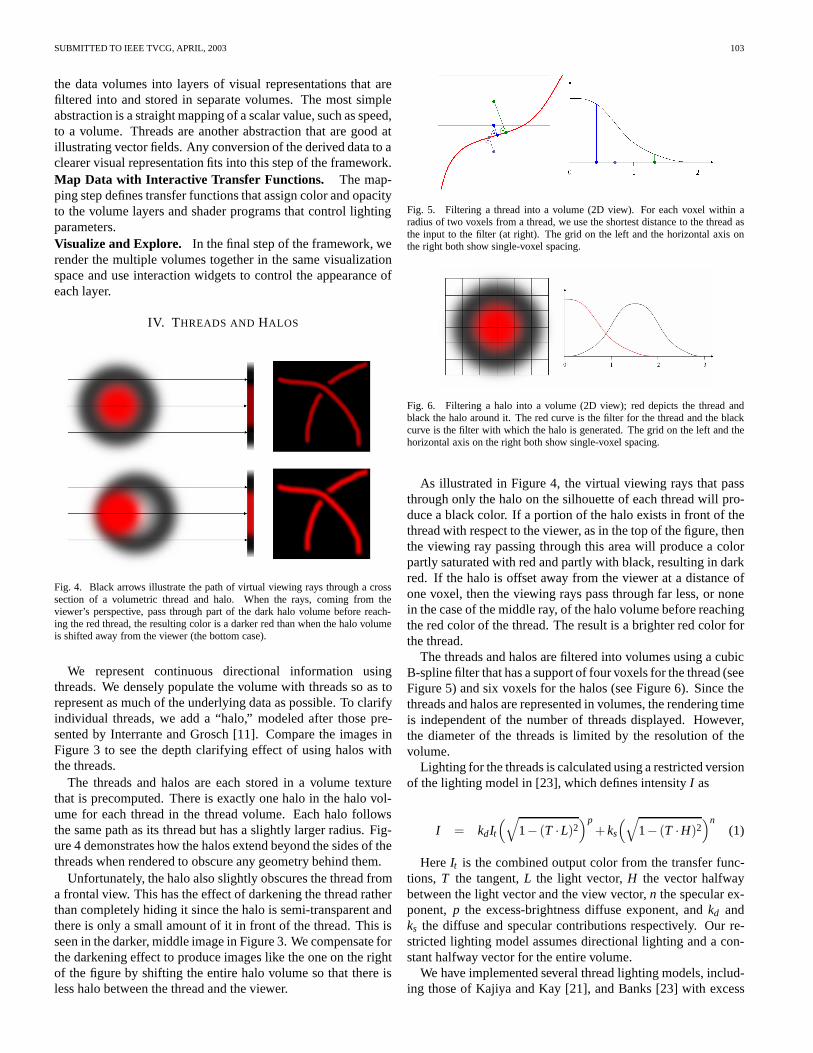
the data volumes into layers of visual representations that arefiltered into and stored in separate volumes. The most simpleabstraction is a straight mapping of a scalar value, such as speed,to a volume. Threads are another abstraction that are good atillustrating vector fields. Any conversion of the derived data to aclearer visual representation fits into this step of the framework.Map Data with Interactive Transfer Functions. The map-ping step defines transfer functions that assign color and opacityto the volume layers and shader programs that control lightingparameters.Visualize and Explore. In the final step of the framework, werender the multiple volumes together in the same visualizationspace and use interaction widgets to control the appearance ofeach layer.
IV. T HREADS AND HALOS
Fig. 4. Black arrows illustrate the path of virtual viewing rays through a crosssection of a volumetric thread and halo. When the rays, coming from theviewer’s perspective, pass through part of the dark halo volume before reach-ing the red thread, the resulting color is a darker red than when the halo volumeis shifted away from the viewer (the bottom case).
We represent continuous directional information usingthreads. We densely populate the volume with threads so as torepresent as much of the underlying data as possible. To clarifyindividual threads, we add a “halo,” modeled after those pre-sented by Interrante and Grosch [11]. Compare the images inFigure 3 to see the depth clarifying effect of using halos withthe threads.
The threads and halos are each stored in a volume texturethat is precomputed. There is exactly one halo in the halo vol-ume for each thread in the thread volume. Each halo followsthe same path as its thread but has a slightly larger radius. Fig-ure 4 demonstrates how the halos extend beyond the sides of thethreads when rendered to obscure any geometry behind them.
Unfortunately, the halo also slightly obscures the thread froma frontal view. This has the effect of darkening the thread ratherthan completely hiding it since the halo is semi-transparent andthere is only a small amount of it in front of the thread. This isseen in the darker, middle image in Figure 3. We compensate forthe darkening effect to produce images like the one on the rightof the figure by shifting the entire halo volume so that there isless halo between the thread and the viewer.
Fig. 5. Filtering a thread into a volume (2D view). For each voxel within aradius of two voxels from a thread, we use the shortest distance to the thread asthe input to the filter (at right). The grid on the left and the horizontal axis onthe right both show single-voxel spacing.
Fig. 6. Filtering a halo into a volume (2D view); red depicts the thread andblack the halo around it. The red curve is the filter for the thread and the blackcurve is the filter with which the halo is generated. The grid on the left and thehorizontal axis on the right both show single-voxel spacing.
As illustrated in Figure 4, the virtual viewing rays that passthrough only the halo on the silhouette of each thread will pro-duce a black color. If a portion of the halo exists in front of thethread with respect to the viewer, as in the top of the figure, thenthe viewing ray passing through this area will produce a colorpartly saturated with red and partly with black, resulting in darkred. If the halo is offset away from the viewer at a distance ofone voxel, then the viewing rays pass through far less, or nonein the case of the middle ray, of the halo volume before reachingthe red color of the thread. The result is a brighter red color forthe thread.
The threads and halos are filtered into volumes using a cubicB-spline filter that has a support of four voxels for the thread (seeFigure 5) and six voxels for the halos (see Figure 6). Since thethreads and halos are represented in volumes, the rendering timeis independent of the number of threads displayed. However,the diameter of the threads is limited by the resolution of thevolume.
Lighting for the threads is calculated using a restricted versionof the lighting model in [23], which defines intensityI as
I = kdIt(√
1− (T ·L)2)p
+ks
(√1− (T ·H)2
)n(1)
HereIt is the combined output color from the transfer func-tions, T the tangent,L the light vector,H the vector halfwaybetween the light vector and the view vector,n the specular ex-ponent,p the excess-brightness diffuse exponent, andkd andks the diffuse and specular contributions respectively. Our re-stricted lighting model assumes directional lighting and a con-stant halfway vector for the entire volume.
We have implemented several thread lighting models, includ-ing those of Kajiya and Kay [21], and Banks [23] with excess

SUBMITTED TO IEEE TVCG, APRIL, 2003 104
Fig. 7. A sequence of renderings of a thread density volume with increasing length threshold from left to right. The rightmost image shows only long threads.
brightness exponents ofp = 2 and p = 4. Kajiya and Kay’slighting model is similar to a Banks model withp = 1. Banksactually uses a value of around 4.8. With a small exponent, thethreads become brighter and the lighting is less dramatic. Wefound p = 2 to be a good value for our applications and also aspeedy one, since it does not require a square-root calculation.
V. L AYERING VOLUMES
Our volume-renderer implementation uses a single stack ofview-aligned texture-mapped slices, rendered back to front andblended with weights 1−α andα. Each slice is rendered mul-tiple times, once for each volume layer. Layers of each slice arealso blended with the weights 1−α andα. We render our directvolume rendered layers first, the halos second, and the threadsthird. For our applications, this is equivalent to rendering thelayers in the order of the scale of their largest structures. Thedirect-volume rendered layers tend to reveal large structures andsurfaces that are easy to make out underneath the more finely de-tailed thread and halo layers. Our intuition is that in most casesthis represents an acceptable heuristic to use when determininglayer ordering.
For direct volume rendered layers, a Phong lighting model(Eq. (2)) is used. As in the thread lighting model describedabove,It is the combined output color from the transfer func-tions,N is the normal,L the light vector,H the halfway vector,ka the ambient contribution,kd the diffuse contribution,ks thespecular contribution, and n the specular exponent:
I = kaIt +kdIt(N ·L)+ks(N ·H)n (2)
Visualizing multiple layers of volumetric data requires an ex-tensive amount of texture memory. We utilize the OpenGL ex-tension ARBtexturecompression, which provides a 4:1 com-pression ratio. Thus, a 2563 eight bit per channel RGBA texturecan be reduced from 64MB to 16MB. With this scheme, we canfit the multiple volume textures required in memory on com-modity graphics cards.
VI. EXPLORATORY CULLING AND TRANSFERFUNCTION
MANIPULATION
Interactive editing of transfer functions has become common-place in volume rendering applications. We describe several ap-
Fig. 8. The interactive exploration tool. Clockwise from upper left are a 2Dbarycentric widget, a 1D widget, a 2D Cartesian widget, and a 2D Cartesianculling widget.
plication specific transfer function modes in the following sec-tion.
Exploratory culling applies a transfer function to an entirethread and halo based on attributes of the linear structure it rep-resents. This is the approach that Weiet al. take in [24] to culldiscrete particle tracks based on the track’s energy. Doleischetal. [25] introduce a more general framework in which degree-of-interest functions are defined to perform similar tasks. In ourapproach the entire thread and its halo are classified according toa metric i.e. thread length which is mapped to a 0. . . 255 domain.Every voxel in the data volume belongs to one class of threads.The cost of classifying the threads and halos for this exampleis an additional byte per voxel and a 1D transfer function thattakes up 256 additional bytes of texture memory.
In our brain visualizations, both long and short threads are im-portant and provide different types of insight into the data. Weuse this culling feature to interactively select a subset of threadsto display based on their average diffusion rate or their length,as seen in Figure 7. This approach is a significant advance overthe state of the art in this application area. Similar culling inZhanget al.’s [26] approach required an entire preprocessingstep taking between several minutes to several hours.
We provide several on-screen widgets, shown in Figure 8, to

SUBMITTED TO IEEE TVCG, APRIL, 2003 105
control transfer functions of the form 1D, 2D, and 2D barycen-tric. Colors are manipulated within the hue, saturation, value,and transparency (HSVα) color space. For the 1D and 2D trans-fer function widgets, color and opacity can be controlled inter-actively along each axis. In the multidimensional cases, the col-ors of the axes are averaged, while the opacities are combinedmultiplicatively. In our informal trials, these combination meth-ods seemed most intuitive. The 2D barycentric manipulationwidget, shown in the top left of Figure 8, is ideal for the brainvisualization application since the space maps naturally to theanisotropy metrics defined in [27].
VII. N EUROIMAGING RESULTS AND DISCUSSION
Our neuroimaging data are acquired using magnetic reso-nance imaging (MRI) and are of two types: second-order tensor-valued water-diffusion-rate images and scalar-valued anatomi-cal images. At each point in a volume, the tensor-valued datacapture the rate at which water is diffusing through tissues. Thatrate is different in different areas – in regions of pure fluid, itis fast; in tissues like bone, it is slow. The rate of diffusion canalso be directionally dependent, particularly in fibrous tissueslike axon tracts and muscles, diffusing more quickly along thefibers than across them. The scalar-valued data are typical T2-weighted MR images.
Within the second-order tensor field measuring the waterdiffusion rate, each valueD is a symmetric tensor with real,positive eigenvalues. FromD we derive several other mea-sures. First, three scalar anisotropy measures introduced byWestin [27],cl , cp, andcs, describe how close to a line, a plane,or a sphere the corresponding ellipsoid shape is for a given mea-surement. Second, the trace ofD, Tr(D), is equivalent to thesum of the eigenvalues ofD and gives a scalar measure of theoverall diffusion rate. Third, the gradient of the trace,∇Tr(D)and its magnitude,|∇Tr(D)|, describe how the diffusion rate ischanging and in what direction; we use these quantities in light-ing calculations for the direct volume rendered layer i.e. in Fig-ure 2.
The fourth category of derived data is a set of threads and ha-los through the tensor field that represent the directions of diffu-sion. These are calculated and distributed within the volume asdescribed by Zhanget al. [10][28][26]. They follow the direc-tion of fastest diffusion in linear regions. In planar regions, theystay within the plane formed by the major and medium eigen-vectors, following whichever is more consistent with the path tothat point. They are not present in isotropic regions.
From the T2-weighted image scalar field we derive the gra-dient of the value and the gradient magnitude, which help de-fine how fast the value is changing and in which directions. Weuse these quantities in lighting calculations. We also derive thesecond directional derivative to help define boundaries betweenhomogeneous regions.
Figure 9 shows the mapping from the scalar- and tensor-valued volumes onto a direct volume rendered layer, a threadlayer, and a halo layer as seen in Figure 8. The first layer di-rectly renders the T2-weighted image. The hyper-intense ven-tricle regions were selected by interactively editing two transferfunctions that are combined multiplicatively to yieldα valuesfor the layer. Color is specified only through the transfer func-
T2 image value
T2 image value
T2 image value
T2 2nd derivative
T2 color & opacity
Volumetric
2D Widget
Data
T2 opacity
1D Widget
Thread color & opacity
2D Barycentric
Widget
Culling
2D Widget
linear anisotropy
planar anisotropy
threads
halos
thread length
thread average
diffusion rate
gradient
gradient magnitude
InteractiveControls
Rendering
Direct Volume Rendering
lighting normal
opacity
color
Threads/Halos/Culling
color
opacity
threads
halos
culling
Fig. 9. A data-flow diagram of the rendering setup for Figure 8.
tion controlling the T2 image value and the gradient magnitude.The second layer renders halos for the threads, and the third
layer renders the threads. The visible portions for these lay-ers are interactively selected via three criteria. First, a transferfunction maps the anisotropy metrics to anα value. For this ren-dering, areas of all types of anisotropy are shown. Second, eachthread and halo can be selected via exploratory culling based onthe thread’s length and on the average diffusion rate along it. Inthis rendering all threads are shown. Third, the thread density isprovided directly by the precalculated thread volume. Likewise,halo density is provided directly by the halo volume. Each of theresults for this dataset is rendered with 2563 volume textures.
Our neuroscientist collaborators gained several insights intotheir data through these visualizations. Figure 1 shows detail ofa diffusion dataset from a normal volunteer. A number of largewhite-matter structures are clearly visible, including the corpuscallosum, internal capsule, corona radiata, and cingulum bundle.
Figure 2 shows a dataset from a patient with a brain tu-mor. Direct volume rendering captures the tumor as an opaquemass and threads show the diffusion direction and variation inanisotropy around it. Note the cradle of threads surrounding thetumor. Using this exploratory visualization has enabled our col-laborators to discover a relationship between the different typesof anisotropy around tumors. In particular, there is a notable in-crease in planar anisotropy (shown as green) in the area aroundthe tumor [29].
VIII. S IMULATED BLOOD FLOW RESULTS AND
DISCUSSION
Our second scientific application involves simulated fluidflow data on incompressible flow through an idealized modelof a bifurcating coronary artery. We have been studying howthe flow structure is related to atherosclerotic lesion formation.Lesions tend to form just downstream of branches. They formon the wall of each branch opposite the exit point of the other

SUBMITTED TO IEEE TVCG, APRIL, 2003 106
Fig. 10. Simulated flow, from right to left, through a model of a branchingcoronary artery. Several complex structures can be seen, including reversal offlow direction, as illustrated by the blue-haloed threads in the side branch im-mediately downstream from the bifurcation. The semi-transparent white shellrepresents vorticity magnitude and gives near-the-wall context for the threads.
branch. We hypothesize that upstream flow structures may pro-vide important insight into why this happens. Our renderingsdepict one time-step of the simulated, pulsatile flow.
The primary data for this application area is a 3D velocityfield. From this, a number of quantities are useful to derive.Speed is one. Another is vorticity, a vector field, that is a com-ponent of the first derivative of the velocity and captures the lo-cal rotational component of the flow. The vorticity vector pointsalong the axis of rotation and its magnitude indicates the rate ofrotation.
Figure 10 shows an idealized model of a branching coro-nary artery. Flow is from right to left, starting in the open endand proceeding down the main artery and into the side branch.Haloed threads, colored according to speed, are rendered to-gether with a diaphanous shell showing relatively low-vorticityregions. A more opaque pink section right at the point of bifur-cation shows the region of highest vorticity.
The same flow is rendered in Figure 11. In this image yel-low threads show vortex lines integrated through the vorticityvector field. The semi-transparent purple form shows low-speedregions.
These two images together show important flow features notseen with other visualization methods, including near-wall kinksin vortex lines and localized looping structure in the vorticity.The interactive lighting in this visualization helped to make thecorrelation between these features more apparent to our collab-orators. The kinks tended roughly to fit into the upstream edgesof separation pockets evident in velocity images. Both of thesedatasets were rendered with 2563 volume textures.
Based on the results of these visualizations, we attempted tocreate an even more compelling visualization of the correlationbetween velocity and vorticity by layering velocity and vorticitylines together in the visualization in Figure 12. This visualiza-tion has two separate sets of thread and halo volumes. To fitboth sets of threads and halos in texture memory we had to cropthe volume size to 256×256×128. Visualizing the two vector
Fig. 11. Integral curves through the vorticity vector field together with thevelocity magnitude field for the flow illustrated in Figure 10. These vortex linesgive additional clues to the flow structure, particularly in areas where it curvesand changes speed.
Fig. 12. Integral curves through both the velocity (yellow and green) and vortic-ity (purple and pink) vector fields for the same flow as illustrated in Figure 10.Correlations among these vector fields can represent important flow structures.
fields simultaneously clarifies correlations among features quitedramatically. This mass of complex linear flow structures is dif-ficult to interpret without the aid of the depth cue enhancinghalos.
Typical rendering rates for both of our application areas arefour to five frames per second. Clipping planes help isolate re-gions of interest and increase the frame rate so that zooming inon those sections does not significantly slow rendering rates. Inmost instances, close to a one frame per second reduction in theframe rate can be seen for each additional volume layer that isrendered.
IX. CONCLUSION
In this paper we present a novel technique for generating andinteractively rendering a thread and halo representation for mul-

SUBMITTED TO IEEE TVCG, APRIL, 2003 107
tivariate datasets that include some fields with important linearfeatures, such as flow lines. This work was motivated by re-cent advances in graphics hardware, volume rendering, halo andother art-based rendering effects, and hair lighting models. Inaddition to presenting our approach to interactively volume ren-der thin threads with halos, we also present a successful fusionof these varied recent research results in the form of an appli-cation motivated by multiple scientific problems. This is an im-portant secondary contribution of our work.
We have been driven in our exploration of these concepts byour collaborations with scientists in both of our application do-mains. Feedback from both groups indicates that they find ourinteractive volume renderer effective in exploring both kinds ofmultivalued datasets. Currently these data are often not wellunderstood and exploring them will lead to new scientific hy-potheses and insights.
X. ACKNOWLEDGMENTS
The authors thank the Brown Scientific Visualization Group,Graphics Group, and Technology Center for Advanced Scien-tific Computing and Visualization. Special thanks go to GeorgeKarniadakis and his group at Brown, Peter Richardson at Brown,Susumu Mori at Johns Hopkins, Mark Bastin at the Universityof Edinburgh, and Thomas Deisboeck at MGH for their data andfeedback. Thanks also to Katrina Avery and Morriah Horani forsuperb editorial input. This work was partially supported byNSF (CCR-0093238) and the Human Brain Project (EB00232:NIBIB and NIMH).
REFERENCES
[1] F. P. Brooks, “The computer scientist as toolsmith II,”CACM, vol. 39, no.3, pp. 61–68, 1996.
[2] H. Hauser, L. Mroz, G. I. Bischi, and M. E. Groeller, “Two-Level VolumeRendering,”IEEE Transactions on Visualization and Computer Graphics,vol. 7, no. 3, pp. 242–252, 2001.
[3] C. Pierpaoli and P. Basser, “Toward a Quantitative Assessment of Diffu-sion Anisotropy,”Magnetic Resonance Magazine, pp. 893–906, 1996.
[4] D. H. Laidlaw, E. T. Ahrens, D. Kremers, M. J. Avalos, R. E. Jacobs, andC. Readhead, “Visualizing Diffusion Tensor Images of the Mouse SpinalCord,” in Proceedings IEEE Visualization ’98. IEEE, 1998, pp. 127–134.
[5] G. L. Kindlmann and D. M. Weinstein, “Hue-Balls and Lit-Tensors forDirect Volume Rendering of Diffusion Tensor Fields,” inProceedingsIEEE Visualization ’99. IEEE, 1999, pp. 183–189.
[6] Th. Delmarcelle and L. Hesselink, “Visualizing Second-Order TensorFields with Hyperstreamlines,”IEEE Computer Graphics and Applica-tions, vol. 13, no. 4, pp. 25–33, 1993.
[7] D. M. Weinstein, G. L. Kindlmann, and E. C. Lundberg, “Tensorlines:Advection-Diffusion based Propagation through Diffusion Tensor Fields,”in Proceedings IEEE Visualization ’99. IEEE, 1999, pp. 249–254.
[8] L. Zhukov and A. H. Barr, “Oriented Tensor Reconstruction: TracingNeural Pathways from Diffusion Tensor MRI,” inProceedings IEEE Vi-sualization 2002. IEEE, 2002, pp. 387–394.
[9] P. J. Basser, S. Pajevic, C. Pierpaoli, J. Duda, and A. Aldroubi, “InVivo Fiber Tractography Using DT-MRI Data,”Magnetic Resonance inMedicine, vol. 44, pp. 625–632, 2000.
[10] S. Zhang, C. T. Curry, D. S. Morris, and D. H. Laidlaw, “Streamtubes andStreamsurfaces for Visualizing Diffusion Tensor MRI Volume Images,” inWorks in Progress IEEE Visualization 2000. IEEE, 2000.
[11] V. Interrante and Ch. Grosch, “Strategies for Effectively Visualizing 3DFlow with Volume LIC,” in Proceedings IEEE Visualization ’97. IEEE,1997, p. 421.
[12] M. Zockler, D. Stalling, and H.-Ch. Hege, “Interactive visualization of3D-Vector fields using illuminated streamlines,” inProceedings IEEEVisualization ’96. IEEE, 1996, pp. 107–113.
[13] G. Li, U.D. Bordoloi, and H. Shen, “Chameleon: An interactivetexture-based rendering framework for visualizing three-dimensional vec-tor fields,” inProceedings IEEE Visualization 2003. IEEE, 2003, pp. 241–248.
[14] B. Cabral, N. Cam, and J. Foran, “Accelerated Volume Rendering andTomographic Reconstruction Using Texture Mapping Hardware,” inACMSymposium On Volume Visualization. ACM, 1994, pp. 91–98.
[15] Y. Wu, V. Bhatia, H. Lauer, and L. Seiler, “Shear-image order ray castingvolume rendering,” inProceedings of the 2003 symposium on Interactive3D graphics. 2003, pp. 152–162, ACM Press.
[16] S. Parker, M. Parker, Y. Livnat, P.-P. Sloan, Ch. Hansen, and P. Shirley,“Interactive ray tracing for volume visualization,”IEEE Transactions onVisualization and Computer Graphics, vol. 5, no. 3, pp. 238–250, 1999.
[17] J. M. Kniss, G. L. Kindlmann, and Ch. Hansen, “Multidimensional Trans-fer Functions for Interactive Volume Rendering,”IEEE Transactions onVisualization and Computer Graphics, vol. 8, no. 3, pp. 270–285, 2002.
[18] J. M. Kniss, C. Hansen, M. Grenier, and T. Robinson, “Volume renderingmultivariate data to visualize meteorological simulations: A case study,” inProceedings of Eurographics - IEEE TCVG Symposiumon Visualization,2002, pp. 189–194.
[19] E. B. Lum and K.-L. Ma, “Hardware-Accelerated Parallel Non-Photorealistic Volume Rendering,” inProceedings of the Non-Photorealistic Animation and Rendering Conference 2002, 2002, pp. 67–74.
[20] A. Stompel, E. B. Lum, and K.-L. Ma, “Visualization of Multidi-mensional, Multivariate Volume Data Using Hardware-Accelerated Non-Photorealistic Rendering Techniques,” in10 th Pacific Conference onComputer Graphics and Applications (PG’02), 2002, p. 394.
[21] J. T. Kajiya and T. L. Kay, “Rendering Fur with Three Dimensional Tex-tures,” inProceedings SIGGRAPH ’89. ACM, 1989, pp. 271–280.
[22] J. E. Lengyel, “Real-Time Fur,” inEurographics Rendering Workshop2000. ACM, 2000, pp. 243–256.
[23] D. C. Banks, “Illumination in Diverse Codimensions,” inProceedingsSIGGRAPH ’94. ACM, 1994, pp. 327–334.
[24] X. Wei, A. Kaufman, and T. J. Hallman, “Case Study: Visualization of Par-ticle Track Data,” inProceedings IEEE Visualization 2001. IEEE, 2001,pp. 465–468.
[25] H. Doleisch, M. Gasser, and H. Hauser, “Interactive feature specificationfor focus+context visualization of complex simulation data,” inProceed-ings of the Symposium on Data Visualisation 2003, 2003, pp. 239–248.
[26] S. Zhang, C¸ . Demiralp, and D. H. Laidlaw, “Visualizing Diffusion TensorMR Images Using Streamtubes and Streamsurfaces,”IEEE Transactionson Visualization and Computer Graphics, 2003, inpress.
[27] C.-F. Westin, S. Peled, H. Gubjartsson, R. Kikinis, and F.A. Jolesz, “Ge-ometrical Diffusion Measures for MRI from Tensor Basis Analysis,” inProceedings of ISMRM 1997, 1997, p. 1742.
[28] S. Zhang, C¸ . Demiralp, D. Keefe, M. DaSilva, B. D. Greenberg, P. J.Basser, C. Pierpaoli, E. A. Chiocca, T. S. Deisboeck, and D. Laidlaw, “Animmersive virtual environment for DT-MRI volume visualization applica-tions: A case study,” inProceedings IEEE Visualization 2001. IEEE, 2001,pp. 437–440.
[29] S. Zhang, M. E. Bastin, D. H. Laidlaw, S. Sinha, P. A. Armitage, andT. S. Deisboeck, “Visualization and analysis of white matter structuralasymmetry in diffusion tensor MR imaging data,”Magnetic Resonance inMedicine, vol. 51, no. 1, pp. 140–147, 2004.


![[shaderx7] 8.1 Cross-Platform Rendering Thread : Design and Implementation](https://img.dokumen.tips/doc/110x75/558deed81a28ab2b7e8b466a/shaderx7-81-cross-platform-rendering-thread-design-and-implementation.jpg)

