Embed Size (px)
Citation preview

Interactive Visualization and Analysis of Network and Sensor Data on
Mobile Devices
Avin Pattath∗ Brian Bue∗ Yun Jang∗ David Ebert∗
Xuan Zhong† Aaron Ault† Edward Coyle†
∗Purdue University Regional Visualization and Analytics Center (PURVAC)†Center for Wireless Systems and Applications (CWSA)
Purdue University, West Lafayette, IN
ABSTRACT
Mobile devices are rapidly gaining popularity due to their smallsize and their wide range of functionality. With the constant im-provement in wireless network access, they are an attractive optionnot only for day to day use, but also for in-field analytics by firstresponders in wide spread areas. However, their limited process-ing, display, graphics and power resources pose a major challengein developing effective applications. Nevertheless, they are vital forrapid decision making in emergencies when combined with appro-priate analysis tools.
In this paper, we present an efficient, interactive visual ana-lytic system using a PDA to visualize network information fromPurdue’s Ross-Ade Stadium during football games as an exam-ple of in-field data analytics combined with text and video anal-ysis. With our system, we can monitor the distribution of attendeeswith mobile devices throughout the stadium through their accessof information and association/disassociation from wireless accesspoints, enabling the detection of crowd movement and event activ-ity. Through correlative visualization and analysis of synchronizedvideo (instant replay video) and text information (play statistics)with the network activity, we can provide insightful information tonetwork monitoring personnel, safety personnel and analysts. Thiswork provides a demonstration and testbed for mobile sensor ana-lytics that will help to improve network performance and providesafety personnel with information for better emergency planningand guidance.
Keywords: mobile visualization, network visualization, visual an-alytics
Index Terms: I.3.2 [Computer Graphics]: Graphics Systems—Network Graphics; I.3.8 [Computer Graphics]: Applications—Visual Analytics
1 INTRODUCTION
Mobile devices are becoming ubiquitous in our high-tech society.As such, technological advances are occurring at an increasing rate,enabling advanced information processing capabilities on such de-vices. Advances in processor clock rate, graphics capabilities, wire-less networking, and low-power designs have increased the poten-tial for detailed analysis using mobile devices.
∗e-mail: {apattath|bbue|jangy|ebertd}@purdue.edu†e-mail: {zhongx|aultac|coyle}@purdue.edu
Simultaneously, the quantity of data available for analysis issteadily increasing, requiring improved processing tools in orderto quickly access and evaluate information. In some situations, itis desirable or necessary to process this information on site and, asa result, mobile devices provide a critical solution to in-field dataanalysis.
Management of sensor and network data is one area that bene-fits from in-field analysis. Wireless networks pose a challenge inextracting relevant connectivity information for issues such as net-work diagnostics and load balancing, while sensor networks posesimilar problems. Additionally, as sensor technology advances, thequantity of data increases, and methods need to be developed toallow in-field visual analysis of large data streams.
In-field analysis can also be beneficial to the analysis of socialbehavior based on situational stimuli. Sporting events are an excel-lent test area for such analysis, as there are many issues that arisein the effective production of such events. For example, the sheerquantity of attendees may require additional considerations withrespect to emergency situations and general crowd control. Also,event organizers can benefit from exploratory data analysis in orderto improve their services and to increase customer satisfaction.
It should be noted that data from seemingly unrelated sourcescan often be used to better analyze some types of situational char-acteristics. One such method is the analysis of network data to de-termine crowd activity and interactions. By examining connectivityinformation in a wireless network, we can extract cues not only onnetwork issues, but also on how users react in certain situations.Thus, the same information that we use to improve network perfor-mance could potentially be used for crowd-guidance situations.
Our work is best described as “visual analytics.” Visual analyt-ics is defined as “the science of analytical reasoning facilitated byinteractive visual interfaces” [21]. More specifically, the integra-tion of mobile devices into the analytical process is referred to as“mobile analytics.” Using state-of-the-art mobile devices, we canenhance the analytical process through interactive, integrated dataanalysis and visualization, enabling the user to extract importantfeatures necessary for rapid, actionable decision making on site.
However, the capabilities of mobile devices are not without theirlimits. Low screen resolution, such as 240 x 320, prevents largeamounts of data from being displayed on screen. Power consid-erations prevent large storage capacities on the device, as well asseverely limiting display and network capabilities. These limita-tions drive us to incorporate compact (but detailed) analysis, cor-relation and visualization techniques through which complex infor-mation can be clearly conveyed.
We must also be aware of issues in data uncertainty and con-fidence. In many cases, using a combination of data sources canhelp to resolve ambiguities. Multi-modal fusion and synchronizedmultiple information techniques can be of great use in the prompt,accurate analysis of input data.
In this paper, we utilize information from Purdue’s Ross-Ade

(a)
(b)
Figure 1: (a) Aerial view of Purdue’s Ross-Ade Stadium. (b) Accesspoint layout in the stadium. This figure shows 18 of the 20 accesspoints in the visualization, that are typically accessed by users. Eightare installed outside (four near the south score board and the otherfour on the west side) and the remaining ten are inside the pavilionon the third, fourth, fifth and sixth floors as shown above.
Stadium during football games as a testbed. Figure 1 shows anaerial view of Ross-Ade Stadium at Purdue and the eStadium ac-cess point (AP) layout in the stadium. Figure 2 shows the wirelesscoverage area of all the APs in the stadium, some of which over-lap. Wireless network access information is collected through theseAPs. We use these network logs, along with the related video andtext data, to display various visualizations synchronized with time.Through the combined visualization and analysis of video and textdata, we can gain insight into network performance and conges-tion, crowd analysis, and emergent social behavior. This work pro-vides a proof of concept for mobile sensor analytics that will helpto improve network performance and provide safety personnel withinformation for better emergency planning and guidance.
Our paper is organized as follows: Section 2 discusses previousrelated work. Section 3 gives a brief description of the eStadiumtestbed. Section 4 discusses in detail, the visualization system weimplemented along with the characteristics of the input data. Sec-tion 5 discusses how the visualization capabilities in our system aidin various analytic tasks. Section 6 presents some analysis and ob-servations made by both visualization experts and system expertsusing our system for game data obtained in November 2005. Fi-nally, section 7 discusses some possible extensions for mobile sen-sor analytics by combining data from various other types of sensors.
2 RELATED WORK
Visual analytics research is a key focus at several research centersnationwide [10], and we build upon techniques developed at thesecenters in this paper. Most notably is the National Visualizationand Analytics Center (NVAC) at Pacific Northwest National Lab(PNNL). Several projects developed at NVAC are related to ourwork. Their InfoStar system [20] has provided some inspirationfor this project, while research by Wong et al. on large-scale graphvisualization [24] and temporal analysis methods [23] has been ap-
Figure 2: eStadium access point coverage. Presently access pointson press box and south score board side are installed. Installation ofaccess points on the north score board is in progress.
plied in the context of mobile visual analytics in this project.
The majority of visual analytics applications for mobile de-vices comes in the form of either mapping tools [13], sometimesenhanced with GPS capabilities, or convenience utilities [5, 14].There have been efforts to use mobile devices in emergency re-sponse situations (such as the Measured Response project headedby the Purdue Synthetic Environment for Analysis and Simulation(SEAS) [1]), and for location-aware services. However, using aPDA for visual situational analysis is a fairly new research topic.
Of the visualization techniques employed in this paper, time-varying (temporal) graph visualization plays an important role.Time varying graph visualization is a common technique for net-work and relational analysis, for communication network analysis[11, 15], social network analysis [6, 22, 16], and relational [19] andgeospatial data [12] visualization. With respect to communicationnetworks, temporal visualization techniques are useful in detectingtraffic anomalies and network intrusion events. In the social net-work context, time-varying visualization is used to display inter-personal communication activities between individuals, and thesetechniques lend themselves readily to the analysis of social trends,or knowledge propagation between agents. In both areas, visualiz-ing task-specific events and relationships strengthens existing ana-lytical techniques; however, none of these techniques are targetedfor mobile information analytics.
Visualization techniques have previously been used in the con-text of sporting events to analyze human performance [9, 8] or forselective content delivery [18, 17]. Television broadcasting com-panies, such as CBS, employ systems such as VizEngine by Vizrt[2] in viewing sporting events in real-time, but these systems aregenerally for creating customized viewer content, not for detailedanalysis of the respective events.
3 THE eStadium TESTBED
eStadium is a long-term, large-scale, collaborative project involv-ing the Center for Wireless Systems & Applications (CWSA), In-formation Technology at Purdue (ITaP), and Purdue IntercollegiateAthletics [3]. The goals of the project include:

• Making Purdue’s Ross Ade Stadium the most technologicallyadvanced in intercollegiate athletics;
• Creating a “Living Lab” for research and education in the de-sign and use of wireless networks;
• Identifying and solving problems in the on-demand deliveryover a wireless network of multi-media applications to foot-ball fans’ PDAs, cell phones, or other portable devices.
eStadium is known as a “Living Lab” because its wireless APsand content/load-balancing servers in the stadium support real users- football fans on game days. Via their PDAs or Smartphones,the fans can access a wide variety of football-related infotainmentapplications that have been developed by the eStadium Vertically-Integrated Project (VIP) team [4, 7]. These applications include:game play-by-play (a list of plays that is updated after each play)up-to-the-moment game statistics, player and coach bios, and asearch tool for food concessions, stadium facilities, and local ho-tels and restaurants.
The most challenging application currently supported by eSta-dium enables fans to view video clips of game highlights [25, 26].This real-time video distribution system consists of a Location Dis-covery System (LODS) and an admission control module imple-mented as a custom plugin under Windows Media Service, whichlimits the video traffic per AP basis. The client logging plugin wasenabled when setting up the eStadium streaming publishing pointso that the client-perceived video streaming performance can berecorded. Both the LODS and admission control are running asWindows services on the video server. These services store theclient networking activities in the syslog and video streaming de-tails in the streaming video log and dump them into a SQL serverdatabase for later analysis of video streaming and networking per-formance.
Cisco APs can be configured to send syslog messages to a remotecomputer; in our case, they are sent to the video server. The loggedevents can be chosen appropriately to help understand the status andmovement of wireless clients. An AP sends a time-stamped syslogmessage whenever a client associates, disassociates, reassociates,authenticates or deauthenticates. These terms/actions, which areused later in the paper, are defined as follows:
Associated: This event occurs, and a corresponding message isgenerated, when a wireless client associates itself with an AP.Once the association process is complete, the wireless clientcan send and receive data packets via that AP.
Disassociated: This event occurs, and a corresponding message isgenerated, when a wireless client disconnects itself from thewireless network and disassociates with the currently associ-ated AP.
Reassociated: When a wireless client changes locations and de-tects another AP with a stronger signal, it may decide to dropits association with one AP and start an association with thenew AP. These two steps are reported as one event, called areassociation, and only one message is generated.
Authenticated: Before the wireless client can associate with anAP, it must authenticate itself with the network. Since ITaPdoes not require authentication in the eStadium network, wedo not see messages related to these events.
Deauthenticated The AP sends a de-authentication message whena wireless client has not sent or received any messages for acertain period of time or when the AP decides that the wirelessdevice has left its coverage area.
Figure 3: System overview
4 NETWORK AND DATA VISUALIZATION ON MOBILE DE-VICES
Mobile devices provide immediate and dynamic access to relevantreal-time information in the field. For example, network analystsmay need to make adjustments to load balancing factors, such aswireless AP power settings and preemptive broadcasting of certaintypes of data, as and when such issues present themselves on site.
With the eStadium testbed, we visualize network informationand video and text information from games on mobile devices. Fig-ure 3 shows our visualization system. As shown in the figure, wecan access the database at selected time intervals and visualize thecorresponding data synchronously. We present our data structures,layouts and primitives of our visualization according to data char-acteristics, and synchronization of all information in the followingsections.
4.1 Data Characteristics
Data for our system comes from several sources, including data ac-quired from APs (hereafter referred to as “syslog” messages), videomessages collected by streaming video servers (as mentioned in thesection 3), and a manually-logged “play-by-play” of the sportingevent in progress. Currently, all messages are parsed from histori-cal data in the form of text logs, but the visualization system is de-signed to present both historical and real-time data. The parsed textlogs of all types are stored on the PDA locally for instant access.Real-time data access will be provided during Fall 2006 games bydirect access to the live SQL play database.
For our application, we consider syslog messages as a tuple con-sisting of a time-stamp, a message type (either “association” or“disassociation”) and the MAC address of the client (connecting)device. Also, we consider any “Reassociation” message as an “As-sociation” event for our application’s purposes. The video messageshave a similar format and contain additional information related tostreaming video data, including which clip was requested, the num-ber of requests, and other diagnostic information. Play-by-play or“game” messages consist of seven parts: the quarter in which themessage is from, the game clock time within that quarter, a text de-scription of the event, an optional video clip of the event, the typeof play event (such as touchdown, interception, etc.), a label indi-cating which team holds the ball currently and the destination of theball for the particular event.
In our implementation, we store the syslog and video messagesin a hash table, hashed on device MAC addresses. We then gen-erate a list of messages within a given time interval from thishash table. All events occurring in the same time interval can bequeried/generated from the hash table using the same query. Thelists generated by such a range query for each different type of

multi-modal data can subsequently be traversed and translated toa relevant visualization.
Because we are working with multi-modal data on different timescales, we must organize our data carefully so our range querieswill return events in the applicable time range. Our main issue isthat while the syslog and video log data are recorded based on thereal-world clock, the play-by-play data is currently logged basedon the game clock. Therefore, it does not have a real-world time-stamp for each event. The closest association we have to remedythis situation is the first video access event for those game events forwhich a video clip is available. Such a remedy allows us to makean abstract association with real-time video events, but introducessome level of uncertainty with respect to when the game eventsoccur.
4.2 Visualization on Mobile Devices
One of the main and obvious concerns for visualization on a PDAor smartphone is the lack of screen space. This becomes an evenbigger challenge when we consider the limited computational re-sources on these devices. The main goal of visualization is to dis-play information in a way that makes the user’s cognitive task eas-ier. While all visualization should display relevant data, the limiteddisplay resolution of mobile devices makes the appropriate visualrepresentation even more crucial. We have to avoid cluttering thescreen, but at the same time, we should also display all the essentialinformation in an aesthetically pleasing manner. Hence we need tofirst extract relevant data at an appropriate level of abstraction, andthen match the data to an appropriate visual representation. In thecase of network data during a football game, we must also take intoaccount the time variation, and provide synchronized visual display.The following sections describe how we solve these two problemsin our system.
4.2.1 Information Selection
Our system handles several different data modes including syslog,video and text. In this case, filtered data not only must convey es-sential information on its own, but the various modes have to becorrelated in order to convey meaningful information. Here we de-scribe how we filter information for the individual data modes.
Syslog Data: The syslog data contains association and disasso-ciation events of each PDA device in the stadium. For visualizationpurposes, we represent an “event” by a set of disassociation andassociation activities. For a given time interval, there are numer-ous such events. Displaying all these events would clutter the PDAscreen and wouldn’t add any useful information. So, we combinethe events between a pair of APs in a particular direction and rep-resent them with a single curve whose thickness is based on thenumber of such events. We also have to display the devices associ-ated with each AP. This can be computed by tracking the AP withwhich a device has an association message without a correspondingdisassociation message during a time interval.
Video Data: Video logs from the eStadium test bed containinformation about how a client perceives videos during a game.Again, displaying all the minute statistics might not be of any prac-tical use since it can crowd the screen. An analyst might be in-terested in looking at the request patterns of videos from varioussections of the stadium. We visualize the number of video accessesfrom each AP for each different video.
Game Data: The eStadium group keeps track of play-by-playevents with links to video replays for important events in the game.The information covered in the game data describes significant hap-penings during the game (for example, touchdowns or field goals).Events are logged by quarters, and events with particular signifi-cance are marked with a game-clock time-stamp. We display thetext statistics and color code actions (touchdowns, field goals, etc.),
from this game log and let a user play related video clips for eventsoccurring in the current time interval.
4.2.2 Information Display
The visualization system consists of several views, each represent-ing a different type of data. These are the initial view, networkevent view, video event view, hybrid view, video download statis-tics view, most popular videos list, play by play visualization, gameevent view and a color legend for different types of plays. These arelinked views and are accessible from the initial view. By linking allthese views to the timeslider interface, a user can switch betweenviews for the currently selected time interval. Here we describeeach of these views in detail and how they are linked to each other.
Main Screen: The main screen shown in Figure 4(a) shows theAPs (represented as blue dots placed at their approximate physicallocations relative to the stadium). Four of the APs (the rightmostcolumn) represent the ones that are mounted outside the pavilion,and the row of four APs at the bottom of the screen are the ones in-side the south score board. The remaining 12 APs are inside the sta-dium pavilion on the third, fourth, fifth and sixth floors. To differ-entiate these 12 APs, we draw a semi-transparent rectangle aroundthem. The layout of these APs in the stadium can be seen in Figure1. Two of the APs on the third and fifth floors aren’t shown in thisfigure, because they aren’t typically used. We have a time slider atthe bottom of the screen which can be moved in either direction. Itenables a user to scroll through continuous time intervals and seethe visualization corresponding to the time interval between its cur-rent and previous positions. The time range for the slider is set tothe minimum and maximum time-stamps from the log files. Thereare eight screen modes for displaying different information and allof them are synchronized with the time slider. The synchronizationhelps a user or an analyst have situational awareness with respectto various aspects of the game such as network access, video ac-cess and important events in the game at the same time. Buttons atthe top of the screen help a user switch between the screen modes.These screen modes of our system are as follows:
Network Event Screen: This screen shown in Figure 4(b) dis-plays sets of association/disassociation events of devices in the sta-dium. For each selected event per device (event selected as men-tioned in the previous section) we draw a curve with random curva-ture from the source (AP to which the device was previously con-nected) to the destination (AP to which the device reconnected).The direction is indicated by the changing opacity, with the opacityvalue increasing from the source to the destination. Colors for thecurves were chosen to distinguish them from other visualizationaspects, and will be used for attribute visualization in the future.Events from the prior time interval are drawn as semitransparent torepresent past events while also retaining the context. To reducevisual clutter, we draw curves with thickness proportional to theamount of activity in a particular direction between a set of APsDevices actively associated with an AP during a time interval arerepresented by transparent squares in a circular distribution aroundthe corresponding AP.
Video Event Screen: The video event screen in Figure 4(c)shows how many videos have been accessed from each AP. At eachAP location, circles are drawn with size based on the quantity ofvideos accessed. A user can then examine an exploded view (inthe subscreen labeled as “Video Event Subscreen” in Figure 4(c)on the left) of individual video accesses. It is divided into fourportions (one for each quarter, starting from the top), with eachportion representing videos uploaded for a particular quarter. Thequadrant corresponding to the current game quarter is highlightedas the user moves across time periods. For example, we can see thehighlighted second quadrant in Figure 4(c). Each interior square in-dicates a unique video associated with that particular quarter. Theopacity value of each square is proportional to the number of down-
(a) (b) (c) (d)
(e) (f) (g) (h)
Figure 4: Different screen modes of our visualization showing (a) Main Screen: Main screen with APs, time slider and screen buttons. Therow of four APs at the bottom are the south score board APs, the rightmost column represents the APs mounted outside the pavilion and theremaining are the ones mounted inside the pavilion. (b) Network Event Screen: Association/Disassociation events of the current (blue) andprevious time interval (grey). If there are multiple movements in the same direction between two APs, its exploded view is shown in a blue screeninset into the main screen. (c) Video Event Screen: Video Access per AP and Individual video access details. Inset, is the text describing theevent corresponding to a selected video from the Video Event SubScreen. (d) Hybrid Screen: Hybrid mode showing both (b) and (c). (e) VideoStatistics Screen: Video download statistics in the form of a stacked bar graph, and text description corresponding to a selected video from thegraph. Color legend is displayed on the left, with abbreviated names for each play type. (f) Popular Video Screen: Three most popular videosfrom the current time interval, along with their number of accesses are displayed. Video link plays the associated video and the text descriptioncorresponding to the game event is displayed below the video link. (g) Game Text Screen: Game play-by-play events as text. (h) Play by PlayVisualization Screen: Visualization of play-by-play events in the current time interval, shown as drives for each team.
loads of that particular video. The highest opacity is mapped to thevideo with the most downloads. The square color is based on theclass of game event to which the corresponding video is related.The classes include touchdowns, interceptions, rushes, and passes,to name a few. This will help an analyst effortlessly correlate videodownload patterns to the type of game event.
Hybrid Network and Video Event Screen: This screen dis-plays the combined information from both the views mentionedabove and can be seen in Figure 4(d)
Video Statistics Screen: In this screen (shown in Figure 4(e)),we display the statistics of video downloads incrementally for eachtime interval (as the user steps through the time axis), as a stackedbar graph. The graph is drawn vertically for lack of screen space.The graph axis is marked with two types of tick marks. Smallerticks on the axis represent individual time intervals and the largerticks represent game quarter marks. On this graph, in a given timeinterval, there is space for four bars, one for each quarter. Eachbar by itself consists of multiple stacked rectangles one over theother, with their individual sizes representing the number of videos
downloaded in that time interval and color coded based on the typeof game event. Clicking on any of these rectangles will display thenumber of accesses to the video and the corresponding game eventas text within a small window. We also display a color legend, forthe colors used in the bar graph. The play type corresponding toeach color is displayed as text in abbreviated form.
Popular Video Screen: This screen (as shown in Figure 4(f))displays the list of top three videos downloaded by fans in the cur-rent time interval. For each video, it displays a “video” link whichplays it in Windows Media Player. The number of downloads of thevideo is displayed beside the video link. The text description of thecorresponding game event appears below the video link.
Game Text Screen: This is a text display showing the importantevents in the game logged by the eStadium team in the selected timeinterval. This view can be seen in Figure 4(g). It shows a subset ofevents from the current time interval.
Play by Play Visualization Screen: This is a functionality thatwe added to improve fans’ game experience. As shown in Fig-ure 4(h), it displays important play by play events in the game

using various visualization entities. Each play is displayed basedon the type of action such as interception, field goal, pass, etc. A“Rush” action is displayed using an arrow in the direction of therush. “Pass”, “Kick” and “Punt” actions are displayed using curvesand appropriate icons for each event. Similarly, we have icons torepresent events like “Penalty”, “Incomplete Pass”, etc. where theball isn’t moved by the player. We represent the play events inthe current time interval as continuous drives starting from the leftmoving to the right for each drive. A user can click on any of theicons or arrows to view the selected game event screen displayingthe text description of the corresponding play.
Exploded Network Event Screen: This is a subscreen insetinto the main screen. As mentioned before, each network associ-ation/disassociation event is drawn as a single curve with thicknessproportional to the amount of activity. So, each curve with numberof events greater than one, is drawn with a small square on it. Auser can click this square to view the detailed view. This screenshows the exploded view on the right side of the screen as can beseen in Figure 4(b). Within this screen, the specific APs are drawnmaintaining their relative orientation and position with respect toeach other so that it is easy for the user to correlate between thisscreen and the main screen. The screen can be closed by clickingon the top right corner.
Selected Game Event Screen: A user can see the game eventcorresponding to a video by clicking on such an item and pop up ascreen at the bottom of the screen (just above the time slider) as canbe seen in Figure 4(c) and (e).
5 VISUAL ANALYTICS ISSUES
Visual analytics typically deals with multi-modal data which re-quire specific visualization techniques for each modality. This sec-tion explains some of these issues and their solutions in our visual-ization system.
Temporal Visualization: Data for visual analytics is usuallytime varying. Specifically, in our case, network data is collectedover the entire duration of the football game, and can be streamedduring the game. Our system includes a time slider, which allowsa user to move back and forth in time and view the visualizationrelated to that time interval. All modes of data (syslog, video andtext data) are synchronized with the time slider. In order not to losecontinuity between subsequent time intervals, we also “ghost” theevents from the previous time interval in a faded color.
Additionally, as stated earlier, time synchronization and corre-lation issues must be considered with multi-modal datasets. Withrespect to this work, only two of the three data sources have globalclock information, while the other dataset only has time-stamps rel-ative to the game clock. Subsequently, efforts must be made to linkthese events to the datasets ordered in global time. This introducessome measure of uncertainty, which we must be aware of in theanalytical process.
Information Clustering: As mentioned before, a big challengefor mobile visual analytics is the limited screen space. To over-come this limitation, information has to be visualized selectivelyand related information has to be grouped together. A user shouldbe able to then view details at multiple resolutions when desired(detail on demand). In our system, we employ information filteringas mentioned in 4.2.1. Multiple events between a set of APs in aparticular direction are grouped together using a single curve withproportional thickness. A user can then see its exploded or detailedview in the Exploded Network Event screen (shown in Figure 4(b)).Similarly, all video access events per AP are shown as a single cir-cle. A user can then view the detailed video access information forany selected AP. A user can view even more detailed informationabout the game event corresponding to any particular video in theSelected Game Event Screen (shown in Figure 4(c) and (e)).
Multi-modal Data Visualization: Analysts usually have to
work with data from multiple sources in various formats and corre-late them. Using our system, the user can visualize syslog, videoand text data linked with each other while keeping the context ofthe current time interval constant. Since all these modes of data areinterlinked, a user can switch between any of these from any screen.
Analytic Tasks: The eStadium team plans to use our prototypesystem during Fall 2006 football games for various analytic tasks.One of the main issues at hand is with respect to load balancing.Our system will be used to identify network bottlenecks for theAPs, as well as for streaming video. The usage patterns of associ-ation and disassociation can help coverage/capacity planning, QoSprovisioning and support location-based services. Power level set-tings of the APs will also be adjusted based on these in-field obser-vations. The power level settings for the APs in the stadium are im-portant parameters that should be tuned to maximize the availablechannel capacity. When many APs are operating in the same area,there is a tradeoff between coverage and interference. Determiningthe power settings that yield the best combination of coverage andquality of service is a significant challenge. Moreover, though net-work load balancing is adjusted automatically, an analyst needs tobe able to determine if the load balancing algorithm is performingcorrectly on site.
Also, from the video log visualization, one can immediately esti-mate the source location for the video requests and also the type ofevents for these videos based on the color coding (touchdown, inter-ception, etc.). Recognizing such patterns can help the network ad-ministrators decide to preemptively broadcast or multicast to theselocations when certain events happen. The popular video displayalso helps a game fan go back and effortlessly look at the most pop-ular video replays in case he missed a part of the game.
6 IMPLEMENTATION AND RESULTS
We have implemented and tested the system on a Dell Axim x51vPDA with a screen resolution of 240 x 320, but it will run on anyPDA or a smartphone with sufficient graphics and processing ca-pabilities. Photos of our system running on a PDA are shown inFigure 6. We use the OpenGL ES API for development. It is alow-level, lightweight API for advanced embedded graphics and isa subset of the traditional desktop version of OpenGL API. A sig-nificant change in OpenGL ES is that all the drawing calls are doneusing vertex arrays and color arrays, since glBegin() and glEnd()calls are absent. We also use GLES common lite profile which usesfixed arithmetic instead of floating point computation, since floatingpoint arithmetic is emulated on the PDA.
The data for visualization is obtained from the eStadium, LODSand streaming video databases. Currently, we do not have real timedata since it is off season for football. We query the previously men-tioned database to obtain historical data from last year’s Purdue-Illinois game on November 12, 2005.
The graphics environment is set up as a 2D orthographic pro-jection since the visualization entities are all 2D. All of the but-tons used to switch between various screen modes are drawn us-ing graphics calls and the text is rendered using texture-mappedbitmap fonts. Stylus input is handled by the mouse function of theGLUTES library. Video playback functionality is handled simplywith a call to the external Windows media player.
Using the visualization, we are able to do a simultaneous obser-vation of which were the APs with heavy video requests (from thevideo event screen), which individual videos among them had thehighest hits (detailed video event sub screen), number of hits andwhat was the related game event (from the Selected Game Eventscreen).
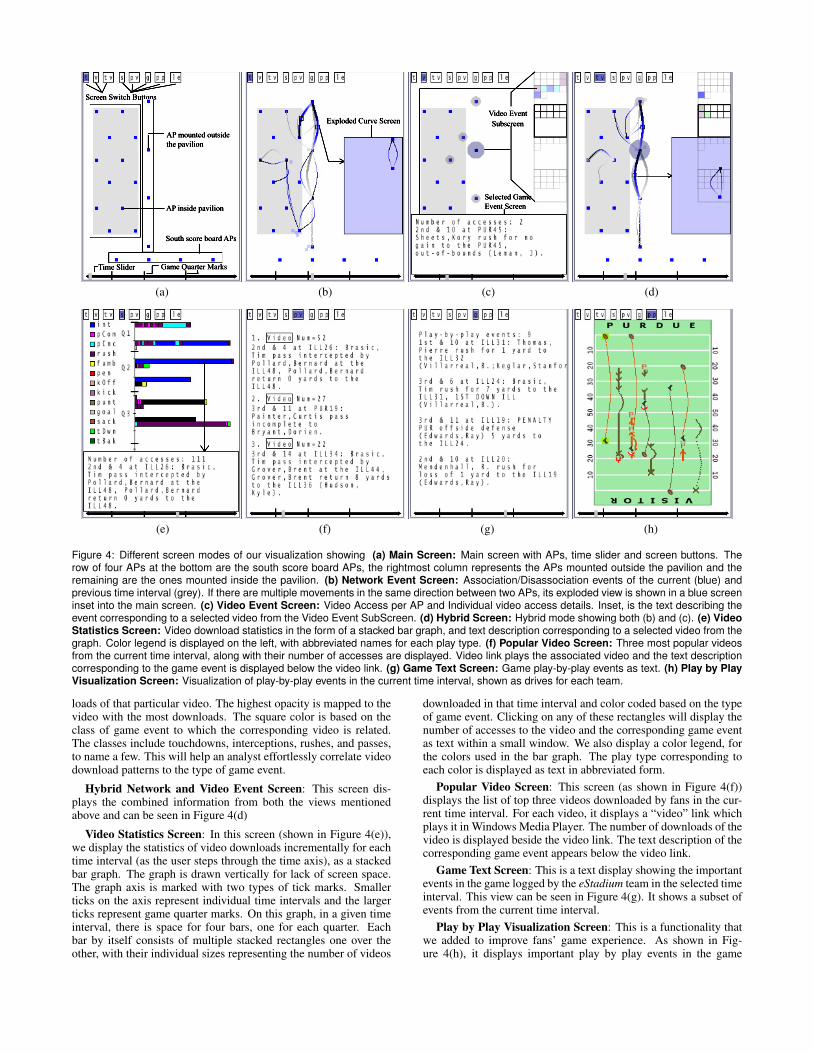
The results from our system can be seen in Figure 4 for differ-ent timesteps and visualization screen modes. Based on an overallanalysis for this game data, we observe that there are many associa-tion/disassociation events, as well as video downloads from the four

(a) (b) (c) (d)
Figure 5: Visualization at different time intervals for the 11/12/2005 Purdue-Illinois game. All of these show a high activity around the four APsoutside the pavilion and the third floor APs. (a) also displays the text description of the play-by-play event corresponding to the video shown asa dark blue square. This interception video has been the most often downloaded video during this game. (b) shows that even though the timeslider is in third quarter, at that time, people are downloading video from the first quarter (shown as blue square). (c) shows another populardownloaded video shown as dark purple square with its text description. (d) also shows how people are still downloading popular videos fromprevious quarters.
APs outside the pavilion and none to or from the four APs near thesouth score board (Figure 5(a), (b), (c) and (d)). The circle aroundthe AP which is currently selected to view the detailed video accessscreen is highlighted in blue to differentiate it from the others. InFigure 5(b) and (d), we can also observe that fans typically tend toaccess important play videos from previous quarters as the gameprogresses.
Based on a more specific analysis, we observe the following be-havior:
The Network Event Screen (Figure 4(b)) shows that most switch-ing between APs seems to be “tit-for-tat” in that it is likely the samemobile device is associating back and forth between APs. This isgenerally caused by a poorly designed driver on the client device,indicating that we need to perform some further analysis to deter-mine if the jumping is occuring from our set of PDA’s or from out-side user devices.
The Video Event Screen (Figure 4(c)) shows that the vast ma-jority of video accesses are coming from the northern, third-floorregion of the pavilion. This is an indication that the power levelsettings of the APs should be reduced in that area while at the sametime restricting the client association rates in order to serve moreclients with the desired quality of service.
The Hybrid Network and Video Event screen (Figure 4(d))shows that most of the AP hopping is occurring in the regions ofthe network where the highest number of video downloads are oc-curring. It is unclear at this point how much of this phenomena isrelated directly to the amount of traffic at an AP, and how muchis caused by the tautological fact that usually the only APs withdevices connected are the ones that are downloading video.
Also, the visual analytics of the syslog data made it clear thatsimply matching each association with a disassociation is inade-quate to estimate session count and length. This is because the as-sociations and disassociations are out of order and not quantifiablymatched. This spurred research into the cause of these errors:
• the syslog messages are sent using UDP, meaning that mes-sages will arrive at the syslog out-of-order, and some could belost
• reassociations after a timeout period seem to cause the major-ity of the discrepancies between the number of associationsand disassociations
We are currently investigating a more complex method of analysisto better understand the syslog events.
The Video Statistics Screen (Figure 4(e)) makes it clear that thevast majority of video download requests are for a very small sub-set of videos (in this case, interceptions and touchdowns), althoughthe time of the request is not always predictable. This indicates thatmulti-casting these heavily-accessed videos should significantly in-crease the number of clients we are able to serve simultaneously.
7 CONCLUSION AND FUTURE WORK
We have shown in this paper how we can develop an interactivevisualization system for analysis of network data. Our system dis-plays time-varying multi-modal data in a synchronized fashion. Ithelps an analyst process data simultaneously without losing con-text while switching between visualization of different modes ofdata. Moreover, since it’s developed for a mobile device, a user canuse it in real time on a football stadium or anywhere else in field forimmediate analysis and respond if necessary.
For example, we discovered that some APs were totally free ofany association/disassociation, while during certain time intervalsthere was marked activity between a particular set of APs. Ob-servations such as these will be of use to our network analysts indetermining usage patterns and parameter settings of APs.
User and network statistics are generally very useful in networktroubleshooting. Plans to integrate specific network characteristics,such as link quality/packet loss, users per AP details, and through-put information, are in progress. Also, additional exploratory abil-ities within our current visualization of AP data would be of ser-vice in determining link outages and identifying wireless accesspatterns.
As future work, the integration of temperature, acoustic, andvideo sensor data in the Fall 2006 will allow us to detect severalcharacteristics that are currently unavailable. Using such data, wecan provide estimates on where crowds tend to populate in the sta-dium and provide location-specific services based on crowd density.Also the integration of emergency response data based on sensor in-formation will be added. By using crowd density measurements, wecould provide crowd guidance information to emergency responsepersonnel, such as optimal exit paths. Moreover, we can extend oursystem to identify fire hot spots using temperature sensors within

(a)
(b)
Figure 6: Photos of our system running on PDA
the stadium and prepare fire-fighters appropriately based on thatdata.
ACKNOWLEDGEMENTS
We wish to thank the reviewers for their suggestions and helpfulcomments. We also thank the National Visualization and AnalyticsCenter (NVAC) for their support. This work has been supportedby the US National Science Foundation under grants NSF ACI-0328984, NSF ACI-0081581, and NSF ACI-0121288, by the AirForce Research Lab under grant FA8650-05-2-6648, by the Mo-torola Foundation, and by Cisco.
REFERENCES
[1] [Synthetic Environment for Analysis and Simulation] http://
www.mgmt.purdue.edu/centers/perc/html/.
[2] [Visrt is the worlds leading provider of real-time 2D and 3D broadcast
graphics] http://www.vizrt.com.
[3] [e-Stadium - the Wireless Football Experience] http:
//estadium.purdue.edu/.
[4] [e-Stadium: A Vertically Integrated Project] http://dynamo.
ecn.purdue.edu/vip/∼estadium.
[5] Benjamin B. Bederson, Aaron Clamage, Mary P. Czerwinski, and
George G. Robertson. A fisheye calendar interface for pdas: providing
overviews for small displays. In CHI ’03: CHI ’03 extended abstracts
on Human factors in computing systems, pages 618–619. ACM Press,
2003.
[6] Danah Boyd. Social network fragments: An interactive tool for ex-
ploring digital social connections. In SIGGRAPH Sketches 2003,
2003.
[7] Edward J. Coyle, Jan P. Allebach, and J. Garton Krueger. The
vertically-integrated projects VIP program in ECE at Purdue: Fully
integrating undergraduate education and graduate research. In Pro-
ceedings of the 2006 ASEE Annual Conference and Exposition, 2006.
[8] Pingali G.S., Opalach A., Jean Y., and Carlbom I. Visualization of
sports using motion trajectories: Providing insights into performance,
style, and strategy. In IEEE Visualization 2001. IEEE Computer Soci-
ety, 2001.
[9] Pingali G.S., Jean Y., and Carlbom I. Lucent vision: A system for
enhanced sports viewing. In Third International Conference in Visual
Information Systems, 1999.
[10] Thomas J. and Cook K., editors. Illuminating the Path: The Research
and Development Agenda for Visual Analytics. IEEE Press, 2005.
[11] Goodall J.R., Lutters W.G., Rheingans P., and Komlodi A. Preserving
the big picture: Visual network traffic analysis with tnv. In InfoVIS
’05: Proceedings of the 2005 IEEE Visualization for Computer Secu-
rity. IEEE Computer Society, 2005.
[12] Thomas Kapler and William Wright. Geotime information visualiza-
tion. In IEEE Symposium on Information Visualization, 2004. IEEE
Computer Society, 2004.
[13] Chittaro L. Visualizing information on mobile devices. IEEE Com-
puter, 39(3).
[14] Masood Masoodian and Daryl Budd. Visualization of travel itinerary
information on pdas. In CRPIT ’04: Proceedings of the fifth confer-
ence on Australasian user interface, pages 65–71. Australian Com-
puter Society, Inc., 2004.
[15] Chris Muelder, Kwan-Liu Ma, and Tony Bartoletti. A visualization
methodology for characterization of network scans. In VizSEC, page 4,
2005.
[16] Gloor P., Laubacher R., Zhao Y., and S. Dynes. Temporal visual-
ization and analysis of social networks. In Proceedings of the North
American Association for Computational, Social and Organizational
Science Conference, 2004.
[17] Weng P., Cai R., and Yang S. Contextual browsing for highlights in
sports video. In 2004 IEEE International Conference on Multimedia
and Expo (ICME 2004), 2004.
[18] Arthur Pope, Rakesh Kumar, Harpreet Sawhney, and Charles Wan.
Video abstraction: Summarizing video content for retrieval and vi-
sualization. In Proc. Thirty-Second Asilomar Conference on Signals,
Systems and Computers, 1998.
[19] Havre S., Hetzler E., Whitney P., and Nowell L. Themeriver: Visual-
izing thematic changes in large document collections. IEEE Transac-
tions on Visualization and Computer Graphics, 8(1), 2002.
[20] Antonio Sanfilippo, Richard May, Gary Danielson, Bob Baddeley,
Rick Riensche, Skip Kirby, Sharon Collins, Susan Thornton, Kenneth
Washington, Matt Schrager, Jamie Van Randwyk, Bob Borchers, and
Doug Gatchell. An adaptive visual analytics platform for mobile de-
vices. In SC ’05: Proceedings of the 2005 ACM/IEEE conference on
Supercomputing, page 74. IEEE Computer Society, 2005.
[21] Jim Thomas. Visual Analytics Challenges and Future Research Areas.
In Workshop on Visual Analytics.
[22] Brandes U., Fleischer D., and Lerner J. Highlighting conflict dynam-
ics in event data. In IEEE Symposium on Information Visualization,
2005. IEEE Computer Society, 2005.
[23] Pak Chung Wong, Wendy Cowley, Harlan Foote, Elizabeth Jurrus,
and Jim Thomas. Visualizing sequential patterns for text mining. In
IEEE Symposium on Information Visualization, 2000. IEEE Computer
Society, 2000.
[24] Pak Chung Wong, Patrick Mackey, Ken Perrine, James Eagan, Har-
lan Foote, and Jim Thomas. Dynamic visualization of graphs with
extended labels. In Proceedings of the 2005 IEEE Symposium on In-
formation Visualization (INFOVIS05). IEEE Computer Society, 2005.
[25] Xuan Zhong, Hoi-Ho Chan, Timothy J. Rogers, Catherine P. Rosen-
berg, and Edward J. Coyle. The development and eStadium testbeds
for research and development of wireless services for large-scale
sports venues. In Proceedings of TridentCom 2006, 2006.
[26] Xuan Zhong, Hoi-Ho Chan, Timothy J. Rogers, Catherine P. Rosen-
berg, and Edward J. Coyle. eStadium - the ”Living Lab”. In Proceed-
ings of Infocom 2006, 2006.