Embed Size (px)
Citation preview

Interactive Visual Profiling of Musicians
Stefan Janicke, Josef Focht, and Gerik Scheuermann, Member, IEEE
Fig. 1. The Column Explorer of our profiling system compares the activity time (Wirkungszeit) of musicians and shows correlationsamong various biographical information about musical professions (Musikalische Berufe), further professions (Weitere Berufe), divi-sions (Sparten) and denomination (Konfession). The profiling scenario for the Jewish cantor Maier Kohn using a mandatory Jewish(judisch) denomination detects other Jewish cantors as similar musicians with multifaceted interpretations of the cantor profession.
Abstract— Determining similar objects based upon the features of an object of interest is a common task for visual analytics systems.This process is called profiling, if the object of interest is a person with individual attributes. The profiling of musicians similar to amusician of interest with the aid of visual means became an interesting research question for musicologists working with the BavarianMusicians Encyclopedia Online. This paper illustrates the development of a visual analytics profiling system that is used to addresssuch research questions. Taking musicological knowledge into account, we outline various steps of our collaborative digital humanitiesproject, priority (1) the definition of various measures to determine the similarity of musicians’ attributes, and (2) the design of aninteractive profiling system that supports musicologists in iteratively determining similar musicians. The utility of the profiling systemis emphasized by various usage scenarios illustrating current research questions in musicology.
Index Terms—visual analytics, profiling system, musicians database visualization, digital humanities, musicology
1 INTRODUCTION
The digitization age changed strategies and methods to gain knowl-edge in the humanities essentially. In terms of philology, humanitiesapproaches were traditionally oriented primarily on language and text.As retrieval strategies in printed encyclopedias were mostly based onthe alphabetical order of contained names, the now available accessto large relational databases provides the opportunity for humanitiesscholars to filter groups of entities not only based on names, but alsoon various other data facets. But the pure access to a database contain-ing a multitude of information also reveals limitations when it comesto investigating concrete research questions beyond only showing listsof entries that match a given database query. Especially for humanities
• Stefan Janicke and Gerik Scheuermann are with Image and SignalProcessing Group, Institute for Computer Science, Leipzig University,Germany. E-mail: {stjaenicke,scheuermann}@informatik.uni-leipzig.de.
• Josef Focht is with Museum of Musical Instruments, Institute forMusicology, Leipzig University, Germany. E-mail:[email protected].
Manuscript received 31 Mar. 2015; accepted 1 Aug. 2015; date ofpublication xx Aug. 2015; date of current version 25 Oct. 2015.For information on obtaining reprints of this article, please sende-mail to: [email protected].
scholars who are not used to exploit the cardinality of query languages,it becomes hard to navigate large databases and filter results accord-ingly [25]. Also, with experiences of the so-called visualistic turn [45]in the early 1990’s, humanities scholars more and more wished to ex-plore complex issues not only based on texts, but also based on images.
An example of this process is given by the Bavarian Musicians En-cyclopedia Online (German: “Bayerisches Musiker-Lexikon Online(BMLO)”) [1], a powerful web-based interface for musicologists, asit provides access to information about around 30,000 musicians, ex-tracted from various digitized printed media. Being an invaluable toolin the daily work of musicologists, this innovative access to music his-tory heritage raised new research questions in musicology. Besidesthe visualization of a musician’s profile and profile comparison, themajor desire was the ability to find similar musicians based upon theattributes of a musician of interest, in short: profiling.
In order to develop a valuable visual analytics system capable ofdetermining similar musicians interactively, we closely collaboratedwith those musicologists who originally raised the profiling researchquestion. Initially, we discussed possible profiling tasks and variousaspects of how the musicologists imagined profiling workflows. Wetransformed the provided data for profiling purposes, mapped requiredmusicians’ attributes to visual features, and defined similarity mea-sures to be used as the basis for profiling similar musicians. In sum-mary, our contributions to the visualization community are:

• The similarity of person attributes: For various attributes ofmusicians, we designed similarity measures in accordance tomusicological conceptions.
• Profiling system: Based upon eight similarity measures and asemi-automatic weighting of attribute dimensions, we designeda visual analytics system that is used by musicologists to itera-tively search for musicians similar to a musician of interest.
• Column Explorer: For the comparison of temporal and textualmetadata of musicians, we provide a column based representa-tion that borrows ideas from Jigsaw’s list view and Parallel TagClouds in order to explore correlations among various attributes.
• Temporal uncertainty: We consider existent temporal uncer-tainties when fixing a musician’s activity time and provide a de-sign that communicates these uncertainties to the musicologists.
We emphasize the utility of our visual analytics profiling system formusicologists by providing various usage scenarios. In a storytellingstyle, each scenario exemplifies how the profiling system can be usedto discover unexpected insights. Additionally, we report experiencesgained during our digital humanities project. This includes the itera-tive evaluation of our profiling system with musicologists, limitationsdue to the nature of humanities data and future prospects.
2 RELATED WORK
Our work on a profiling system for musicians is related to three differ-ent aspects of research. As the usual method of profiling is based uponsimilarities to a given subject, we first take a look at recommenda-tion systems, where recommendations are determined in dependencyon an object of interest. The second paragraph lists visual analyticsand information visualization papers that (1) are motivated by similarresearch questions to ours without a digital humanities background,or (2) present similar visualization techniques to the ones our profil-ing system is composed of. Finally, we illustrate related visualizationsmotivated from research questions in digital humanities.
2.1 Recommendation SystemsTapestry, the first recommender system developed in 1992, was basedon collaborative filtering [26]. The system aggregates recommenda-tions provided by users, and directs them to appropriate recipients. Inthe last two decades, many different recommendation algorithms havebeen developed [39]. Basically, the initial step of our profiling ap-proach imitates recommendation based on item similarity [40]. In ourcase, the item is a musician, and the system determines similar musi-cians as recommendations. The further profiling steps of our systemsare rather comparable to content-based recommendation systems [42].An item is recommended based upon description and the “profile of theuser’s interests”, which are user-defined similarity weights and manda-tory musician attributes in our case. The benefit of using weightsto reflect the importance of certain attributes for users has alreadybeen shown for discovering related movies [18]. Other applicationareas include the development of recommender systems for YouTubevideos [17], music files [11], or related people in social networks [12].The recommendation of social media data proposed by Guy et al. [28]is based on relationship information among people. Our system usesthis idea and determines a relationship similarity between musicians.
2.2 Related Visual Analytics & InfoVis TechniquesThe visualization of relational, geospatial, temporal and nominal tex-tual data is a common task for researchers in visual analytics and in-formation visualization. In accordance to the features of our profilingsystem, we outline the most related works under various aspects.
Visualizing recommendations Many works provide visualiza-tions for recommendations of different type. Choo et al. present arecommendation system for a vast collection of academic papers [13].Recommended documents can be explored in a scatterplot. Overviewis a system that also supports the systematic analysis of large documentcollections to be used by investigative journalists [8]. Documents are
hierarchically clustered based on content similarity, thus, can be rec-ommended during investigation. A recommendation of notes frompast analysis tasks when operating a visual analytics system is ex-plained by Shrinivasan et al. [47]. For the visualization of recom-mended movies, Vlachos uses a radial layout [50]. Gansner offersgeographic maps that use the metaphor of neighborhoods and clustersto group related recommendations [23]. The latter approach commu-nicates relations among recommendations. That a recommendationsystem is not seen as a black box from the user’s point of view [49],we provide visual and textual cues for the collaborating musicologiststo explain the existence of a recommendation.
Social network visualizations In our profiling system, relation-ship graphs visualize the social networks of musicians under inspec-tion. Especially interesting are unknown musicians that connect unac-quainted musicians. Applied to the relationships of characters in lit-erary works, Euler diagrams can be used to visualize groups of socialnetworks in clusters while also showing relations among clusters [44].Weaver embeds an attribute relationship graph in his visual analyticsenvironment to visualize the relationships between movie actors [54].Quite often, visualizations attend to the matter of visualizing large so-cial networks and their navigation by various interaction means [43].The design of such visualizations is especially important for the ex-ploration of online social networks [27, 31].
Multiple views Our system consists of multiple views that visu-alize the musician’s metadata information, e.g., we provide visual rep-resentations of temporal, geospatial, and nominal textual data. Themultiple views concept is often used to communicate various data as-pects. An overview of various visual analytics approaches to dynami-cally explore spatio-temporal data with the help of maps and timelinesis given by Andrienko et al. [4]. The purpose of such visual analyt-ics environments ranges from the analysis of crime incidents [33] tothe extraction and characterization of significant places from mobilitydata [3], the visualization of semantic web data [10], and the com-parative analysis of geospatial-temporal data [36]. Also popular isthe additional visualization of contextual keywords – next to map andtimeline – in the form of tag clouds, for instance, to visualize topicalmetadata [20] or to support the discovery of meaningful events in newsand social media data [22]. Many approaches are based on textualdata sources. The cross-filtered views for multidimensional data setsas proposed by Weaver include various interfaces to be used as filtersto determine potentially interesting events in newspaper article collec-tions [53]. Heimerl et al.’s visual analytics system is also composed ofmany views with the purpose of interactively training classifiers to beused for document retrieval on large text collections [32].
Layered Textual Metadata One of the major components ofour system is the Column Explorer (see Section 5.2) with a columnper data facet showing textual attributes of musicians. Jigsaw’s listview [48] provides the basic idea for such a visualization. The usercan select an arbitrary entry and correlations to other attributes areshown. Related data entries in adjacent columns are linked. Similarly,this is done in Parallel Tag Clouds [14]. Each column lists tags of acertain time slice, and equal tags are linked on selection. PivotPaths isa yet similar approach to ours [21]. After selecting a research paper,links are drawn to related authors and paper keywords. The relatedattributes in our Column Explorer are connected with colored streams.Often, streams express a temporal evolution of events [9, 16]. Tags atcertain positions in streams can be used to illustrate contextual infor-mation [46].
2.3 Visualizations for the Digital HumanitiesThe database of our visual profiling approach is based upon the textualcontents of numerous digitized documents about music history. Manyvisualization techniques with a motivation from the humanities alsoprovide abstract views on digital text editions. Most often, the focusof interest is a specific literary text.
Keim et al. present fingerprint matrices that visualize extracted fea-tures, which characterize a given text [37]. The purpose is to supportthe analysis of the behavior of feature values across the text. Another

approach concerns the visualization of poem features. Proposed byAbdul-Rahman et al. [2], the Poem Viewer uses visual attributes toencode phonetic units as well as phonetic and semantic relationships.VarifocalReader facilitates the work with individual, potentially largedigital texts by providing visualizations on various text hierarchy lev-els [38]: an overview of the text structure, tag cloud summaries, and aclose reading view. Applied machine learning techniques and searchmechanisms support the user to extract entities, concepts and other ar-tifacts from the examined text. Correll et al. provide a text analysisenvironment for a whole corpus [15]. It aims to allow the detectionof corpus-wide statistical patterns, and texts can be displayed the waythat text passages reflect the relevance according to the user’s pref-erences. Vuillemot et al. provide a flexible system for the dynamicexploration of a single literary text [51]: The Making of Americans byGertrude Stein. Various interfaces like tag clouds and self-organizinggraphs support to review vocabulary, to filter by part of speech, and toexplore character networks. In GeneaQuilts [7], the genealogy of ex-tracted characters from a literary text such as the Bible are visualized.
The purpose of our work is to visualize the similarity between mu-sicians. Some related works on issues in literary criticism visualizethe similarity between various text passages. The Word Tree showsall sentences of a given text that share the same beginning in the formof a tree [52]. Other approaches highlight differences and similari-ties among various editions of a text, e.g., various German translationsof Shakespeare’s Othello [24] or various English translations of theBible [35].
3 DIGITAL HUMANITIES BACKGROUND
This research bears on musicology, a field of the humanities that ob-serves musicians and their achievements. This includes not only com-posers, although a composition is seen as the fruit of a musical pro-cess. Moreover, many other musical professions are in the focus ofinterest of musicological research, e.g., instrument makers, conduc-tors, singers, instrumentalists, music publishers, etc.
Motivation The Bavarian Musicians Encyclopedia Online(BMLO) project was initiated in 2004 with the goal to create adatabase that combines a multitude of biographical informationabout musicians of various professions. In cooperation with theBavarian State Library and the Society for Bavarian Music History,musicologists of the Ludwig Maximilian University of Munichsearched, collected and digitized related documents on music history.They combined biographical information about musicians extractedfrom various sources such as encyclopedias, periodicals, and seriesconcerning musicology as well as research papers from musicology,history and science of art. A web-based platform [1] providesaccess to the database, which contains musicians who are part ofthe Bavarian music history; musicians with an active lifetime periodliving in Bavaria as well as musicians with a considerable influenceon the Bavarian music history are included. Despite the prior focuson Bavaria, the BMLO is a valuable tool for many musicologists as itprovides information about 28,137 musicians from all musical eras,spanning a time range from 4AD to the present. Working with theBMLO, the main interests are not examinations of the musicians’achievements – musicologists rather explore the features of musicalprofessions or analyze the biographies of musicians. This includesgeneric research questions concerning the geographical or temporalevolution of musical professions as well as precise research questionsthat focus on an individual musician. One such research question– the profiling of musicians with similar careers to a musician ofinterest – is interesting for musicologists for a long time. Traditionallyapproaching an answer to this type of question, musicologists solelyrefer to musicological editions and monographs. But musicologyprimarily focuses on fifty musicians – mostly composers – andtheir main works. Due to this inhomogeneous state of research(what we call the popularity of musicians), a traditional similarityanalysis usually starts and ends within this limited set of musicians.Although the BMLO provides an immense diversity of informationabout a large number of musicians, the profiling of musicians isnot supported. Maybe the database could be used to address some
research questions, but for musicologists complex database queriesare hard to formulate [25] and the musicians’ attributes in the queryresult are hard to analyze and to compare. Therefore, musicologistsdesired a system that allows to approach a profiling task interactivelywith the aid of visual interfaces that pictorially illustrate the providedinformation.
Digital Humanities Project In close collaboration with musicol-ogists using the BMLO, we developed a visual analytics system thatsupports the profiling of similar musicians based on a selected musi-cian of interest. For the implementation of this project, we adoptedseveral suggestions made by Munzner [41] to ensure designing abeneficial, powerful tool that supports answering the posed researchquestions. We furthermore took collaboration experiences [34] fromother visualization researchers who worked together with humanitiesscholars into account to avoid typical pitfalls of such interdisciplinaryprojects. Additionally, we worked through related works in the digi-tal humanities, which provide valuable suggestions and guidelines fordesigning interfaces for humanities scholars, e.g., outlined in [25]. Toavoid making assumptions for the design of a profiling system that ishard to comprehend and does not solve the concerned musicologicalresearch questions, we initially discussed the needs of the musicolo-gists, their workflows and challenges in the targeted domain in severalmeetings. Furthermore, we presented and discussed related visualiza-tion techniques to convey an impression of the capabilities and chal-lenges within our research field. The musicologists explained howthey use the BMLO for their workflows and communicated their fasci-nation about this unique type of encyclopedia invaluable for their dailywork. This get together turned out to be important to understand eachothers mindsets. A major outcome was a set of research questions onthe profiling of musicians and the analysis of musician profiles.
Project Data The provided database and aspects of data trans-formation were also discussed with the musicologists. This includedoccurring data anomalies, the conversion of the temporal metadata toa uniform scheme while considering occurring uncertainties as wellas defining popularity values by counting a musician’s references. Indiscussions about the provided musician attributes we could separateattributes worth to integrate into the profiling process – a musician’ssex, lifetime data, places of activity, musical and further professions,relationships, divisions and denomination – from irrelevant ones. Forinstance, the potentially interesting attribute nationality is only pro-vided for 416 musicians (1.5%) as most musicians lived in a time whenthe assignment of a nationality to a person did not exist. Therefore,we decided to exclude nationalities from the profiling process. Themusicologists argued that most research interests concern musicianswithout nationality attributes. We also asked for the relevance of eachattribute dimension for a profiling task and the comparative analysisof musicians in order to push the development of the profiling systemthe way that predominant attributes receive more attention. Addition-ally, we gained information how musicologists imagined to operatewith the musicians’ attributes. For example, they wanted to see howattributes of different facets correlate, and they wanted to detect thelinks between unrelated musicians.
Project Challenges To solve the profiling task, we faced twomain challenges. On the basis of relevant musician attributes, we firstneeded to define various similarity measures that determine the simi-larity of musicians (see Section 4). Second, we needed to design visualinterfaces that communicate these similarities intuitively. In prepara-tion, we looked at related visualizations and collected possible repre-sentations to map relevant attributes of musicians to visual attributes.In meetings with the musicologists, we argued on opportunities anddrawbacks when applying various visualization techniques. The re-sultant visualization design is explained in Section 5. Finally, vari-ous usage scenarios illustrate the utility of the profiling system for thecollaborating musicologists (see Section 6), now capable of detectingsimilar musicians without the bias of popularity. As further demandsincluded the visual exploration of individual musician profiles and thecomparative analysis of multiple profiles, we also provide an examplebesides profiling.

uncertainty dating year differencebefore/after ≤ 1700 −/+30 years
1701−1800 −/+25 years1801−1900 −/+10 years
> 1900 −/+5 yearsaround ≤ 1500 ±20 years
1501−1600 ±15 years1601−1700 ±8 years1701−1800 ±5 years1801−1900 ±3 years
> 1900 ±2 years
Table 1. Mapping of uncertain datings.
4 THE SIMILARITY OF MUSICIANS
Based on various biographical information, the similarity S(mi,m j)between the musician of interest mi and a similarity candidate m j isdetermined as
S(mi,m j) = wp ·P(m j)+8
∑k=1
wk ·Sk.
wk is a weight for the relevance of the corresponding similarity Sk. Tomimic the traditional profiling approach by referring to musicologicaleditions and monographs, we insert the popularity P(m j) of m j as afurther component into the similarity equation. The collaborating mu-sicologists define P(m j) in dependency on the number of publications(articles, editions and media) from and about m j. Thus, the popu-larity reflects the current state of research on a musician. Accordingto this heuristic, Wolfgang Amadeus Mozart is the most popular musi-cian with around 150,000 publications. Taking the musicologists’ sug-gestions into account, we group all musicians with the same numberof publications into groups g1, . . . ,gn sorted by ascending publicationcount. The popularity P(m j) is then defined in dependency on m j’spopularity group gk as
P(m j) =kn.
wp can be used to adjust the influence of popularity during the profil-ing process. Using wp = 0 disregards popularities and wp = 1 mimicsthe traditional profiling approach. All weight values are defined inter-actively during the profiling process. In the following, we outline thecalculation for each of the eight contributing similarities. Some of thesimilarity measures are defined by the Jaccard index like
Si(mi,m j) = J(
f (mi), f (m j))=| f (mi)∩ f (m j)|| f (mi)∪ f (m j)|
.
4.1 Sex Similarity Ssex1
For some research questions of the collaborating musicologists, thesex of a musician plays an important role when determining similarmusicians. Such an information in the form of male or female is pro-vided for nearly all musicians (27,403 = 97.4%). If the sexes of miand m j are equal, we define Ssex
1 (mi,m j) = 1. For unequal sexes or ifthe sex of one musician is unknown, we use Ssex
1 (mi,m j) = 0.
4.2 Activity Time Similarity Stem2
The activity time of a musician is defined in dependency on the tempo-ral metadata provided for nearly all musicians of the database (27,681= 98.4%). Three various datings may be given for a musician: a dat-ing of birth B (provided for 27,357 musicians = 97.2%), a first men-tioned dating F (25,592 = 91%), and/or a dating of death D (18,610= 66.1%)
The musicologists exploited the underlying textual sources of thedatabase the way that the first mentioned dating is always an evidencefor an active phase of a musician, thus, always ranges between birthand death. The granularity of the given datings ranges from date toyear. Due to uncertain information in the textual sources, the givendatings are often imprecise. Three types of uncertainty occur: beforedatings (e.g., before 1745), around datings (e.g., around March, 1745),and after datings (e.g., after September 22, 1745).
In order to process uncertain datings for the purpose of defining andvisualizing the activity time for each musician, the collaborating musi-cologists provided a taxonomy – based on state-of-the-art knowledgein musicology – to map uncertainties to years as approximate datings.Table 1 lists how various uncertain datings are resolved in dependencyon centuries. For all before and after datings we add or subtract thegiven difference value. For datings with an around uncertainty, wesubtract the difference value for births, add the difference for deaths,and for first mentioned datings we define Fmin by subtracting and Fmaxby adding the difference value. In few cases, irregularities occur afterresolving uncertain datings. In case of Fmin < B (or F < B) we setFmin = B (or F = B), and if Fmax > D (or F > D) we set Fmax = D (orF = D).
The activity time t(m) = {tmin(m), tmax(m)} of a musician m is de-termined based upon the given dates as follows:
• if F or Fmin and D are defined and unequal, we set tmin(m) = For tmin(m) = Fmin and tmax(m) = D
• else if Fmin and Fmax are defined, we set tmin(m) = Fmin andtmax(m) = Fmax
• else if F is provided, we define Fmax by applying the after uncer-tainty to F and use tmin(m) = F and tmax(m) = Fmax
• else if B and D are provided, we use tmin(m) = B+20 years andtmax(m) = D
In the rare cases if only B or only D are provided, the definition of anactivity time range is too hypothetical according to the musicologists.In such cases, the corresponding similarity is always Stem
2 (mi,m j) = 0.In case of two valid activity time ranges, we define Stem
2 (mi,m j) usingthe Jaccard index as Stem
2 (mi,m j) = J(t(mi), t(m j)
).
4.3 Activity Region Similarity Sreg3
The database contains places of activity, where musicians lived orworked for a certain period of time. At least one such place is pro-vided for 26,101 musicians (92.8%) in the database. For the mostoften occurring 1,661 places of activity, geographical coordinates aslongitude/latitude pairs and hierarchical place IDs for the contempo-rary political belonging of a place are given.
The activity region of a musician consists of all places of activity.The similarity Sreg
3 (mi,m j) between the activity regions of mi and m jis determined taking the political belongings as well as the geographi-cal positions of the musicians associated places into account. For this
place id hierarchy levels 1. 2. 3. 4.1. Bonn XA–DE–05–3–14 Europe–Germany–North Rhine-Westphalia–Cologne (county)–Bonn 1.0 0.4 0.4 0.42. Munich XA–DE–09–1–62 Europe–Germany–Bavaria–Upper Bavaria–Munich 0.4 1.0 0.6 0.83. Nuremberg XA–DE–09–5–64 Europe–Germany–Bavaria–Middle Franconia–Nuremberg 0.4 0.6 1.0 0.64. Erding XA–DE–09–1–77–117 Europe–Germany–Bavaria–Upper Bavaria–Erding (county)–Erding 0.4 0.8 0.6 1.0
Table 2. Political identifiers of four German cities and their political distances.
purpose, we define the two measures Political Distance Dpol and Ge-ographical Distance Dgeo.
Political Distance Dpol The (contemporary) political distanceDpol(p1, p2) between two places p1 and p2 is defined in dependencyon hierarchical place identifiers provided for each place. The level ofdetail of such an identifier varies from one (only continent) to seven.Examples are listed in Table 2. For most places, at least five hierarchylevels are given. Therefore, we define Dpol(p1, p2) dependent on kfirst equal hierarchy levels as
Dpol(p1, p2) =k5.
Geographical Distance Dgeo To determine the geographical dis-tance Dgeo(p1, p2) between two places p1 = {x1,y1} and p2 = {x2,y2}in kilometers, we use the great circle distance G, taken from [30]:
G = 6378 ·arccos(
sin(y1) · sin(y2)+cos(y1) ·cos(y2) ·cos(x1−x2)).
Dgeo(p1, p2) is then defined as
Dgeo(p1, p2) =dmax−G
dmax.
Specified by the musicologists, dmax is the maximum distance allowedfor two places to be geographically related in former times. For the ex-amples in this paper, we used dmax = 500km – empirically determinedby the musicologists. In case of G > dmax, we define Dgeo = 0.
Given two sets Pi and Pj of places of activity for mi and m j , weuse the iterative closest point algorithm [6] to calculate the activityregion similarity Sreg
3 (mi,m j). For each place pki in Pi, we determine
the distance d(pki ) to the “closest place” in Pj, which we define as
d(pki ) = max
plj∈Pj
(Dpol(pk
i , plj) ·Dgeo(pk
i , plj)).
Likewise, we determine the distance d(plj) to the “closest place” in Pi
for each place p j ∈ Pj. Finally, Sreg3 (mi,m j) is defined as
Sreg3 (mi,m j) =
∑|Pi|k=0 d(pk
i )+∑|Pj |l=0 d(pl
j)
|Pi|+ |Pj|.
4.4 Musical Profession Similarity Smus4
For 26,695 musicians (94.9%), the database contains informationabout their musical professions such as composer, conductor or pi-anist. Musical professions are of special importance for the musicolo-gists as they substantially define the emphasis of a musician’s activity.They are given as lists mus(m) for each musician m, and the similaritySmus
4 (mi,m j) between the musical professions of mi and m j is definedby the Jaccard index as Smus
4 (mi,m j) = J(mus(mi),mus(m j)
). In case
of |mus(mi)|= |mus(m j)|= 0, we define Smus4 (mi,m j) = 0.
4.5 Further Profession Similarity Spro5
The database also provides information about professions unrelatedto music (e.g., philosopher, teacher, soldier) for 7,920 musicians(28.1%). As above, the Jaccard index is used to determine the sim-ilarity Spro
5 (mi,m j) for the further professions pro(mi) and pro(m j)
of mi and m j as Spro5 (mi,m j) = J
(pro(mi), pro(m j)
). In case of
|pro(mi)|= |pro(m j)|= 0, we define Spro5 (mi,m j) = 0.
4.6 Relationship Similarity Srel6
One of the key features of the database are the inherent social re-lationships. For the collaborating musicologists, these informationgenerate an invaluable social network that reflects interpersonal re-lationships of the most important musicians in the musical landscape,although relationships are only provided for 9,739 musicians at the
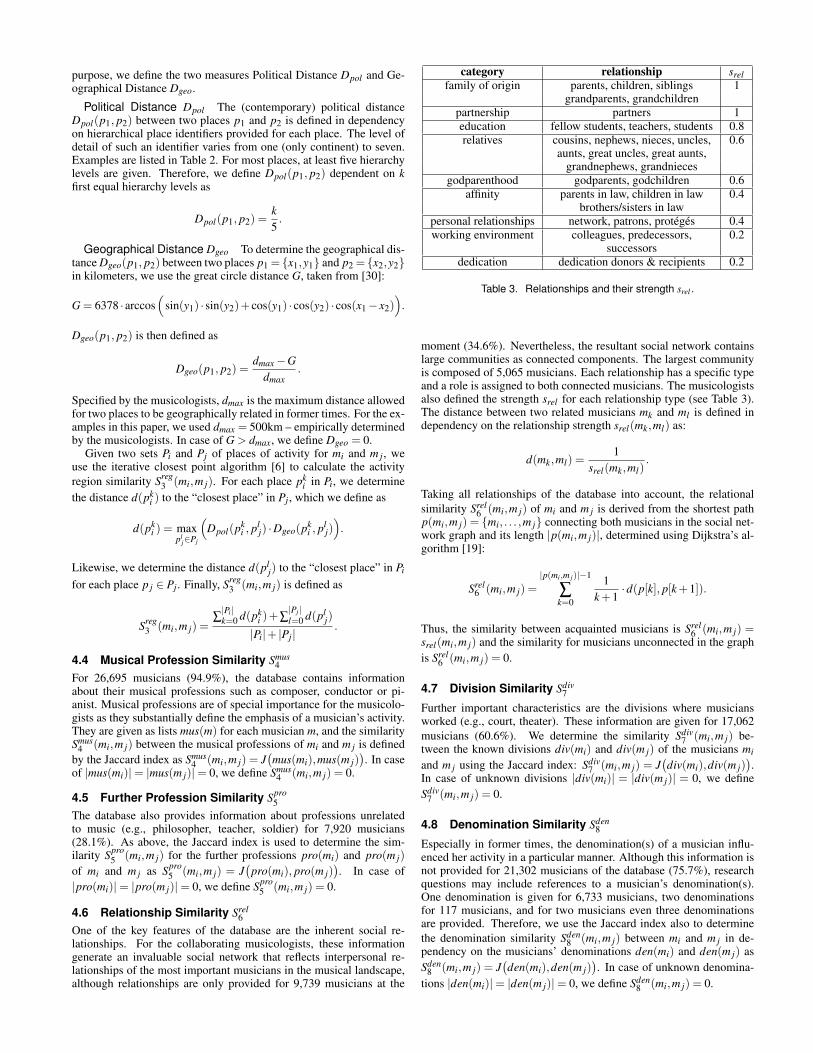
category relationship srelfamily of origin parents, children, siblings 1
grandparents, grandchildrenpartnership partners 1education fellow students, teachers, students 0.8relatives cousins, nephews, nieces, uncles, 0.6
aunts, great uncles, great aunts,grandnephews, grandnieces
godparenthood godparents, godchildren 0.6affinity parents in law, children in law 0.4
brothers/sisters in lawpersonal relationships network, patrons, proteges 0.4working environment colleagues, predecessors, 0.2
successorsdedication dedication donors & recipients 0.2
Table 3. Relationships and their strength srel .
moment (34.6%). Nevertheless, the resultant social network containslarge communities as connected components. The largest communityis composed of 5,065 musicians. Each relationship has a specific typeand a role is assigned to both connected musicians. The musicologistsalso defined the strength srel for each relationship type (see Table 3).The distance between two related musicians mk and ml is defined independency on the relationship strength srel(mk,ml) as:
d(mk,ml) =1
srel(mk,ml).
Taking all relationships of the database into account, the relationalsimilarity Srel
6 (mi,m j) of mi and m j is derived from the shortest pathp(mi,m j) = {mi, . . . ,m j} connecting both musicians in the social net-work graph and its length |p(mi,m j)|, determined using Dijkstra’s al-gorithm [19]:
Srel6 (mi,m j) =
|p(mi,m j)|−1
∑k=0
1k+1
·d(p[k], p[k+1]).
Thus, the similarity between acquainted musicians is Srel6 (mi,m j) =
srel(mi,m j) and the similarity for musicians unconnected in the graphis Srel
6 (mi,m j) = 0.
4.7 Division Similarity Sdiv7
Further important characteristics are the divisions where musiciansworked (e.g., court, theater). These information are given for 17,062musicians (60.6%). We determine the similarity Sdiv
7 (mi,m j) be-tween the known divisions div(mi) and div(m j) of the musicians mi
and m j using the Jaccard index: Sdiv7 (mi,m j) = J
(div(mi),div(m j)
).
In case of unknown divisions |div(mi)| = |div(m j)| = 0, we defineSdiv
7 (mi,m j) = 0.
4.8 Denomination Similarity Sden8
Especially in former times, the denomination(s) of a musician influ-enced her activity in a particular manner. Although this information isnot provided for 21,302 musicians of the database (75.7%), researchquestions may include references to a musician’s denomination(s).One denomination is given for 6,733 musicians, two denominationsfor 117 musicians, and for two musicians even three denominationsare provided. Therefore, we use the Jaccard index also to determinethe denomination similarity Sden
8 (mi,m j) between mi and m j in de-pendency on the musicians’ denominations den(mi) and den(m j) asSden
8 (mi,m j) = J(den(mi),den(m j)
). In case of unknown denomina-
tions |den(mi)|= |den(m j)|= 0, we define Sden8 (mi,m j) = 0.

5 THE PROFILING OF MUSICIANS
The idea of musician profiling is to detect a user-defined number Nof similar musicians s1, . . . ,sN , who shared similar attributes with agiven musician m of interest. The profiles of all observed musiciansare visualized in three different views: Column Explorer, RelationshipGraph and Map.
5.1 Profiling WorkflowInitially, the musicologist enters the musician m of interest for whomthe profile is visualized in the previously mentioned visual interfaces.Observing the various attributes of m, the scholar is able to definemandatory profiling attributes. A similar musician s then requires toshare this attribute. Possible mandatory attributes are:
• Musical & further professions, divisions, denomination(s): sshares all mandatory attributes of m in these categories.
• Activity time: The intersection of the activity time ranges of mand s is not empty.
• Place(s) of Activity: All mandatory places of activity of m werealso places of activity of s.
The selection of mandatory attributes supports specific research ques-tions like “Find the most similar musicians to Wolfgang AmadeusMozart with the musical profession concertmaster who worked at acourt and who had Salzburg as place of activity!” Mozart worked asa concertmaster at the court of Salzburg between 1772 and 1777. Al-though the database does not contain information if a musician workedat a specific place in a certain profession, the system is capable of pro-viding hints to investigate such questions.
After selecting mandatory attributes, the musicologist performs thefirst profiling iteration based on all similarity measures defined in theprevious section. The weight wi of a similarity measure Si is auto-matically determined in dependency on the diversity of available at-tributes in relation to the attributes of m in the corresponding dimen-sion. With the number n of musicians m1, . . . ,mn with the given at-tribute (m /∈ m1, . . . ,mn), we define wi as
wi = 1− ∑nk=1 Si(m,mk)
n.
An example is given by the weight w1 for sex similarity Ssex1 . The
database contains 23,865 male musicians (84.8%), 3,538 female mu-sicians (12.6%) and 751 musicians (2.7%) without a sex information.When profiling similar musicians for Wolfgang Amadeus Mozart, theinitial weight for sex similarity is w1 = 0.13 as the database containsmostly male musicians. An initial profiling on Wolfgang AmadeusMozart’s wife Constanze Mozart would use w1 = 0.87 due to the com-paratively small number of female musicians.
The result of the first profiling iteration are N similar musicianss1, . . . ,sN . As outlined above, the profiles of s1, . . . ,sN are visualizedalongside the profile of m. That individual attributes are easy to track, acertain color is assigned to each musician. As N is usually small – lessthan ten similar musicians –, we use the ColorBrewer [29] to generatea qualitative color map that provides solely saturated colors to be usedon the bright website background. In further iterations of the profilingprocess, the musicologist can gradually modify mandatory attributesand similarity weights as desired in order to receive similar musicianswith certain attributes relevant to the posed research question. In Sec-tion 6, we illustrate several usage scenarios with interesting findings toemphasize the benefit of this interactive visual analytics approach forthe collaborating musicologists.
5.2 Column ExplorerInspired by Jigsaw’s list view [48] and Parallel Tag Clouds [14], wedesigned an interface that allows for the exploration of various meta-data information provided. The Column Explorer consists of variouscolumns that serve various purposes.
Fig. 2. Lifetime data examples: various shapes encode uncertain birth,death and first mentioned datings.
Legend All observed musicians are shown in the form of a legendin the leftmost column. m is positioned at the top, and s1, . . . ,sN arelisted below, ordered by descending similarity to m. The backgroundof a musician’s name is drawn in the musician’s assigned color. Hover-ing a musician lists the following attributes in a popup: sex, popularityrank, nationalities and BMLO identifier.
Lifetime Data In a vertical timeline, the temporal metadata of allobserved musicians is visualized in vertical slots. If provided, we putmarks for the date of birth (additionally highlighted with a star symbolH), the first mentioned date (slightly larger mark), and the date ofdeath (additionally highlighted with a cross symbol =). The shapesused as marks reflect the precision of the provided dating. A smallhorizontal line � is used for precise datings, and circles l highlightaround datings. Triangles s mark before datings as they point to thestart of the vertical timeline, thus, upside down triangles t illustrateafter datings. The lifetime of a musician is shown with a vertical line inthe corresponding color that connects dates of birth and death. Variousexamples are shown in Figure 2.
Nominal Textual Metadata Four columns list the occurring mu-sical and further professions, divisions and denomination(s) of m ands1, . . . ,sN . In each column, the attributes of m are listed first in alpha-betical order. By descending similarity, further attributes of the deter-mined similar musicians are listed. Being the most powerful metaphorof tag clouds [5], we use variable font size of labels to encode the num-ber of attribute occurrences. If a musician does not have an attribute ina certain column, we put a “no information” label to communicate thisinformation – an often mentioned demand of the musicologists of ourproject. Clicking an attribute label toggles its mandatory selection forthe profiling process. Only attribute labels (except “no information”labels) belonging to m can be selected.
In Jigsaw’s list view, attributes from different columns are con-nected if they belong to the same data entity. Also, in Parallel TagClouds various tags are connected after selection. We use these ideasand display the coherence of the attributes of each musician as coloredstreams passing all columns of the Column Explorer. Starting from thelegend, a stream marks the activity time of the corresponding musicianin the timeline. Thereby, the occlusion of streams illustrates similaractivity times. After passing the timeline, a stream runs through allrelated attributes of a musician. In case of multiple attributes, a streamsplits and passes the corresponding attributes. This metaphor aims tovisualize occurring correlations among various attributes of musiciansand to further facilitate the visual comparison of different profiles.
5.3 Relationship GraphThe relationship graph of our profiling system is invaluable for thecollaborating musicologists as it provides the view on a musician’s so-cial network for the first time visually. Furthermore, musicians thatconnect two observed musicians of interest become visible. For manymusicians, a list of relationships to other musicians in the database

Fig. 3. A profiling for musicians similar to court composer Georg Friedrich Handel. The musical profession composer (Komponist) and the divisioncourt (Hof) are marked as mandatory. The results are shown disregarding popularity (wp = 0) and taking popularity into account (wp = 1).
is provided. Possible relation types between two musicians and thestrength of each relationship are shown in Table 3. Taking all relation-ships of m and s1, . . . ,sN forms a social network graph with verticesrepresenting musicians and edges connecting related musicians. Inorder to facilitate an easy exploration of the graph, we only take thedirect relationships of each musician into account. Furthermore, weadd the relationships between related musicians /∈ {m,s1, . . . ,sN} toreceive a closed social network. We use a force-directed algorithm togenerate the network graph. We thereby map the strengths of relation-ships to intended ideal edge lengths when computing the layout. Anexample social network is shown in Figure 4. The observed musicianvertices for m and s1, . . . ,sN are drawn in the corresponding color, andtheir full name is shown next to it. To keep the social network ex-plorable, all additional musicians are drawn as gray vertices, and onlythe first four letters of their names are shown. The latter design deci-sion reduces the occurrences of occluding labels to a minimum whilealongside providing an “adequate information” for the musicologist,who is usually aware of the social relations of the observed musi-cian(s). More detailed information can be shown using mouseoverinteraction. Hovering a gray vertex pops up the full name of the corre-sponding musician, whereas hovering an edge provides the roles of thetwo connected musicians in their relationship. Unobserved, but poten-tially interesting musicians shown in the social network graph can beadded to the profile visualization via mouse click. A mouse click ontothe vertices representing m and s1, . . . ,sN visualizes the shortest pathsto all other musicians under investigation. This feature supports themusicologists in examining the channels through which informationwas most probably transferred in former times.
5.4 Map
The map of the profiling system visualizes all places of activity pro-vided for m and s1, . . . ,sN . The focus of interest is to facilitate thevisual interpretation of a certain activity region and to support thecomparison of different activity regions. A location that was only theactivity place of one of the musicians under inspection is displayedas a single circle with a radius rc drawn in the corresponding color.Quite often, musicians shared the same places of activity. For example,Munich was a place of activity for 10,558 musicians of the database(37.5%). To forestall the misinterpretation of activity regions throughoccluding individual circles, we draw a pie chart for each shared place.We scale the radius rp of a pie chart dependent on the number of asso-ciated musicians to avoid visual distortion. To receive pie slices with
the same area as an individual circle, we define rp as
rp =√
N · rc.
All shapes are drawn slightly transparent to avoid losing the geograph-ical context in dense regions. An example is given in Figure 5. Hov-ering a shape displays a popup that shows the place name and a list ofrelated musicians.
6 USAGE SCENARIOS
The traditional approach of searching for similarities between musi-cians is biased due to the inhomogeneous state of research (popular-ity). Rather observing the similarities among the other musician’s at-tributes, the usage of the profiling system revealed substantial anoma-lies in contrast to this traditional approach. The first out of four scenar-ios provided by musicologists using our system exemplifies this issue.
Profiling Georg Friedrich Handel Handel is one of the mostpopular court composers. A musicologist used the profiling sys-tem to iteratively discover court composers of the same era (manda-tory activity time, division court and musical profession composer)with similar careers. The initial profiling result shows similar mu-sicians from different generations with first mentioned datings rang-ing from 1691 to 1731. Now increasing the weight for activity time(wtem
2 = 1) and ignoring activity regions (wgeo3 = 0) better models the
musicologists imagination of a ”same era” by narrowing this timerange (1691-1708). Then, the musicologist tests various combina-tions of weights for popularity and denomination disregarding rela-tions (wrel
4 = 0) with interesting insights (in all combinations the erarange remains small). The set of similar musicians for various popu-larity settings and wden
8 = 1 changes only slightly and always containspopular Evangelical-Lutheran musicians like Johann Sebastian Bachand Georg Philipp Telemann. By further applying varying denomina-tional significance and using wp = 0, the musicologist discovers un-expected, very similar profiles to Handel in terms of musical profes-sions and divisions for rather unknown musicians with activity placesin southern European regions; especially, two Italian musicians are inthe result set. With Venice, Rome and Naples, Handel had an activeperiod in three Italian cities. As wgeo
3 = 0 was used, this correlation hy-pothesizes mutual influences between Handel and the musicians foundas well as an Italian influence on Handel’s work. Now mimickingthe traditional profiling approach based upon print media by applying

Fig. 4. The social network shows potential pathways how Bach’s scorewas transferred to Mozart (related links are highlighted for illustration).
wp = 1, most of the rather unknown musicians are replaced by pop-ular ones with a lesser similarity regarding musical professions anddivisions (see Figure 3). Especially the similarity between Handel andAntonio Vivaldi – both sharing only few characteristics – seemed ac-cidental to the musicologist. Thus, this use case exemplifies the biasedinfluence of popularity. But the tool opens new research perspectivesby focusing rather unknown but more similar musicians as opposed tofocusing popular musicians.
Profiling Meinrad Spieß Starting a profiling for musicians simi-lar to monastery composer Spieß, a musicologist would predominantlyrefer to musicological editions and monographs. According to them,the results of this traditional approach would be again biased due to theinhomogeneous state of research (popularity). Our profiling systemwas used to search for musicians similar to Spieß disregarding popu-larity (wp = 0). The initial profiling step shows a list of other southernGerman Catholic church musicians of the early modern era. To fur-ther specify the profile scheme, the musicologist increases the weightfor activity region, activity time, division and denomination similar-ity, whereas the weight for relationship similarity is lowered. As theresult differs only slightly, the weights for denomination and activityregion are set to 0. Then, middle German Protestant contemporariesoccur – a comprehensible fact as Spieß (1) was an active member ofLorenz Mizler’s musical circle in Leipzig, and (2) corresponded fre-quently with academy colleagues outside his denominational boundsand activity region. A particular observation is an obvious similarityto musicians belonging to a generation that essentially characterizedthe bandmaster profession. Similarities are discovered to the knownmusicians Johann Sebastian Bach and Georg Friedrich Handel, andother representatives of this first bandmaster generation – a fact hardlyrecognized in previous music research. Approaching insights this wayis a novel technique in musicology. An also known, but never visual-ized phenomenon in musicology are homogeneous subcultures of theearly modern era. By only regarding relational similarities for Spieß,the musicologist detects a closed Benedictine network composed ofSpieß’ students and the relatives of his own teacher Bernabei.
Profiling Maier Kohn The cantor is one of the most multifari-ous musical professions in cultural history. The characteristics of thisprofession equally depend on chronology, cultural area and denomi-nation. Consequently, the responsibilities of a cantor are widespreadand the term cantor is impractical to be used as musical vocabulary.
Fig. 5. The map shows places of activity from Mozart, Bach, andrelationships who connect both musicians in the social network to ana-lyze potential places where related musicians met each other or workedtogether. The city Bologna marks a shared place of activity on one pos-sible transfer path of Bach’s score to Mozart.
Subsequently, cantors cannot be easily retrieved using the BavarianMusicians Encyclopedia Online. The musicologist requires an analy-sis in dependency on the various duties of the cantor profession. Usingthe profiling system, this multifacetedness can be visualized and ana-lyzed in individual cases. The Jewish cantor Maier Kohn had manymusical responsibilities in clerical music and in school, as a singer,organist, composer and choirmaster. Similar profiles regarding mu-sical professions that compose the cantor profession can be found invarious contexts for musicians of different generations, with differentactivity regions and denominations. Limiting the profiling to Jewishmusicians with similar profiles provides a list of Jewish cantors (e.g.,Salomon Sulzer and Joseph Freudenthal) with many varying musicalprofessions (see Figure 1). This brief meta-analytic test reveals a con-tradiction to the anti-Semitic influenced state of research of the early20th century. At that time, musicologists claimed a monotonous in-terpretation of the cantor profession for Jewish musicians. But themultifaceted musical professions of all cantors in the result suggest adiversity similar to known Christian cantors. According to the anti-Semitic research, Maier Kohn was therefore not a “typical Jew”. Hisstrong similarity to Christian cantors when disregarding Jewish de-nomination in the profiling underpins this fact. This example outlinesthe utility of the profiling system to transform a musicological issue –the multifacetedness of the musical profession cantor –, which is notexistent in the database, into a representation visualized as the ColumnExplorer.
The missing link between Johann Sebastian Bach & Wolf-gang Amadeus Mozart This example illustrates the usage of thesystem without its profiling capacity. Mozart was born few years af-ter Bach’s death, but Mozart played Bach’s music. Mozart primar-ily worked at southern German Catholic residences where the tradewith music supplies was unincisive. An interesting research questionfor the musicologist arose: “What was the connection through whichBach’s score was transferred to Mozart?” First, the musicologist vi-sualizes the profile of both musicians. Second, the relationship graphis explored and candidates on probable pathways between Bach andMozart are added to the profile visualization (see Figure 4). Takingall visualized attributes into account, the musicologist is now able tomeasure possible pathways, especially by observing shared places ofactivity (see Figure 5). Although the musicologist requires additionalliterature to examine this question more precisely, the system providesvaluable evidence to narrow the number of possibilities.

7 DISCUSSION
The proposed profiling system was designed to support answering anovel type of research question in musicology. Some aspects of thecollaborative work are outlined below.
Evaluation When developing the profiling system, we closelycollaborated with four musicologists – a professor, a PhD student andtwo M.Sc. students –, who iteratively evaluated current prototypes.One of the key features of the profiling system was the design of sim-ilarity measures for relevant musician attributes included in the pro-filing process. Some of the similarity measures were refined step-by-step to incorporate musicological knowledge in order to gain resultsthat meet the expectations of the musicologists. For example, whendesigning the activity region similarity, we always provided a list ofplace tuples with their calculated similarities to the musicologists toensure an appropriate representation of musicological imagination ofspace. When determining relationship similarity – first defined fortwo musicians only by their distance in the social network graph – wemapped relationship strengths, provided by the musicologists, to edgelengths. As a result, familial relationships form clusters, which was animportant requirement of the musicologists. Activity time similarity– first defined as lifetime similarity by birth and death of musicians –was also iteratively modified. Here, the inclusion of first mentioneddates and the mapping of uncertainties allowed us to define this sim-ilarity measure more precisely. The visualization of the profiling sys-tem was also iteratively improved and evaluated by the musicologiststo meet their needs. This included both aspects of visual representa-tion and interaction design. We could communicate our own concernsas well. For instance, we thought that overlapping streams in the ver-tical timeline are too confusing. But the musicologists prevented usfrom changing this representation arguing that it perfectly reflects theirimagination of activity time similarity. As there is no ground truth re-garding the profiling of musicians, the accuracy of our approach isnot easy to measure. Sometimes, surprising and unexpected resultsoccur. Being involved in all development stages, the musicologists as-sess individual similarity measures as well as entire profiling results asreasonable, which underpins the benefit of our method for musicology.
Limitations Being a challenge for developing the visual analyticssystem on the one hand, the existence of uncertain temporal metadataslightly affects the reliability of a profiling result. As the BMLO getsupdated gradually, the removal of uncertainties requires future effortfor musicologists using the database. A further limitation concerns themissing consideration of historical circumstances when calculating ac-tivity region similarities. First, the meaning of a geographical distancevaries for different ages. Whereas a travel between European cities re-quired several weeks in the Renaissance era, such a trip takes only fewhours nowadays. Second, the usage of contemporary political condi-tions cannot be applied appropriately to historical contexts, althoughour collaborative solution turned out to be heuristically valuable formusicologists. But the elaboration of historical place identifiers couldfurther improve the profiling result. As the provided textual meta-data is not linked, e.g., the existence of “London” as activity place,“bandmaster” as musical profession and “church” as division does notimply that a musician indeed was a bandmaster at a church in London.The interpretation of such information still requires a musicologist’sknowledge or the usage of further sources. In terms of scalability, ourproposed system is designed to compare the profiles of a rather smallnumber of musicians – distinguishable through various colors –, usu-ally less than ten. Therefore, general research interests like analyzingand comparing all court composers is not supported.
Future Work The BMLO is an ongoing digital humanities projectunder crowdsourcing aspects. Next to potential future data transfor-mation and data representation challenges, the collaborating musicol-ogists suggested several improvement prospects to determine similarmusicians more precisely. First, the inclusion of hierarchical informa-tion into the profiling process was an often discussed issue. At themoment, a hierarchy is only given for musical professions. Accordingto the musicologists, hierarchical representations for other text-based
metadata dimensions (further professions, divisions), hierarchical re-lationship strengths or the calculation of activity region similaritiestaking historical circumstances into account could further strengthenthe result of a profiling process. Consequently, we would need to adaptsimilarity measures and the visualization, especially the Column Ex-plorer. Another future work is the profiling for coupled musicians – anovel type of research question stimulated through our profiling sys-tem. For instance, the profiling result for musicians similar to Wolf-gang Amadeus Mozart and Johann Sebastian Bach in a single requestcould answer the question if a found musician would be more similarto Mozart or to Bach. As a straightforward adaption of the similar-ity measures does not anticipate adequate results, we require furtherinterdisciplinary sessions to discuss required implementation steps.
8 CONCLUSION
As of the late 19th century, musicology focuses primarily on fifty mu-sicians and their main works in a traditional philological manner. Theachievements of other musicians only obtain less attention. The pro-posed profiling system aims to change this imbalance by rather throw-ing the spotlight on less popular musicians. Based upon a musician ofinterest – potentially one of the popular ones – musicologists are nowcapable of discovering less popular musicians with similar careers.
During the development, we closely collaborated with musicolo-gists, who state that the resultant profiling system is a valuable analysisinstrument that serves a novel type of research interest and provokesnew research questions. Thereby, we designed the profiling system theway that it can easily be adapted to other historical groups of people.
Our presented approach facilitates comparative methods and re-search questions concerning musicians – for the first time with theaid of visual means. As the visualization indicates historical circum-stances and cultural contexts, it gets possible to review time-dependentideological opinions about individual musicians. Usage scenariosshowcasing Handel’s, Spieß’ and Kohn’s careers demonstrate this ca-pability of the profiling system.
REFERENCES
[1] Bayerisches Musiker-Lexikon Online, 2015. ed. Josef Focht. http://www.bmlo.lmu.de/ (Accessed 2015-03-31).
[2] A. Abdul-Rahman, J. Lein, K. Coles, E. Maguire, M. Meyer, M. Wynne,C. R. Johnson, A. Trefethen, and M. Chen. Rule-based Visual Mappings–with a Case Study on Poetry Visualization. In Computer Graphics Forum,volume 32, pages 381–390. Wiley Online Library, 2013.
[3] G. Andrienko, N. Andrienko, C. Hurter, S. Rinzivillo, and S. Wrobel.From Movement Tracks through Events to Places: Extracting and Char-acterizing Significant Places from Mobility Data. In Visual Analytics Sci-ence and Technology (VAST), 2011 IEEE Conference on, pages 161–170.IEEE, 2011.
[4] N. Andrienko and G. Andrienko. Exploratory Analysis of Spatial andTemporal Data: A Systematic Approach. Springer-Verlag New York, Inc.,Secaucus, NJ, USA, 2005.
[5] S. Bateman, C. Gutwin, and M. Nacenta. Seeing Things in the Clouds:The Effect of Visual Features on Tag Cloud Selections. In Proceedings ofthe Nineteenth ACM Conference on Hypertext and Hypermedia, HT ’08,pages 193–202. ACM, 2008.
[6] P. J. Besl and N. D. McKay. Method for Registration of 3-D Shapes. InRobotics-DL tentative, pages 586–606. International Society for Opticsand Photonics, 1992.
[7] A. Bezerianos, P. Dragicevic, J. Fekete, J. Bae, and B. Watson. Ge-neaQuilts: A System for Exploring Large Genealogies. Visualization andComputer Graphics, IEEE Transactions on, 16(6):1073–1081, Nov 2010.
[8] M. Brehmer, S. Ingram, J. Stray, and T. Munzner. Overview: The Design,Adoption, and Analysis of a Visual Document Mining Tool for Investiga-tive Journalists. Visualization and Computer Graphics, IEEE Transac-tions on, 20(12):2271–2280, Dec 2014.
[9] L. Byron and M. Wattenberg. Stacked Graphs – Geometry & Aes-thetics. Visualization and Computer Graphics, IEEE Transactions on,14(6):1245–1252, Nov 2008.
[10] M. Cammarano, X. Dong, B. Chan, J. Klingner, J. Talbot, A. Halevy,and P. Hanrahan. Visualization of Heterogeneous Data. Visualizationand Computer Graphics, IEEE Transactions on, 13(6):1200–1207, Nov2007.

[11] H.-C. Chen and A. L. Chen. A music recommendation system based onmusic data grouping and user interests. In Proceedings of the tenth inter-national conference on Information and knowledge management, pages231–238. ACM, 2001.
[12] J. Chen, W. Geyer, C. Dugan, M. Muller, and I. Guy. ”Make New Friends,but Keep the Old” – Recommending People on Social Networking Sites.In Proceedings of the SIGCHI Conference on Human Factors in Comput-ing Systems, pages 201–210. ACM, 2009.
[13] J. Choo, C. Lee, H. Kim, H. Lee, Z. Liu, R. Kannan, C. Stolper, J. Stasko,B. Drake, and H. Park. VisIRR: Visual Analytics for Information Re-trieval and Recommendation with Large-Scale Document Data. In VisualAnalytics Science and Technology (VAST), 2014 IEEE Conference on,pages 243–244, Oct 2014.
[14] C. Collins, F. Viegas, and M. Wattenberg. Parallel Tag Clouds to Ex-plore and Analyze Faceted Text Corpora. In Visual Analytics Science andTechnology, (VAST), 2009 IEEE Symposium on, pages 91–98, Oct 2009.
[15] M. Correll, M. Witmore, and M. Gleicher. Exploring Collectionsof Tagged Text for Literary Scholarship. Computer Graphics Forum,30(3):731–740, 2011.
[16] W. Cui, S. Liu, Z. Wu, and H. Wei. How Hierarchical Topics Evolve inLarge Text Corpora. Visualization and Computer Graphics, IEEE Trans-actions on, 20(12):2281–2290, Dec 2014.
[17] J. Davidson, B. Liebald, J. Liu, P. Nandy, T. Van Vleet, U. Gargi,S. Gupta, Y. He, M. Lambert, B. Livingston, et al. The YouTube videorecommendation system. In Proceedings of the fourth ACM conferenceon Recommender systems, pages 293–296. ACM, 2010.
[18] S. Debnath, N. Ganguly, and P. Mitra. Feature Weighting in ContentBased Recommendation System Using Social Network Analysis. In Pro-ceedings of the 17th international conference on World Wide Web, pages1041–1042. ACM, 2008.
[19] E. W. Dijkstra. A Note on Two Problems in Connexion with Graphs.Numerische Mathematik, 1(1):269–271, 1959.
[20] M. Dork, S. Carpendale, C. Collins, and C. Williamson. VisGets: Coor-dinated Visualizations for Web-based Information Exploration and Dis-covery. Visualization and Computer Graphics, IEEE Transactions on,14(6):1205–1212, Nov 2008.
[21] M. Dork, N. Riche, G. Ramos, and S. Dumais. PivotPaths: Strollingthrough Faceted Information Spaces. Visualization and Computer Graph-ics, IEEE Transactions on, 18(12):2709–2718, Dec 2012.
[22] W. Dou, X. Wang, D. Skau, W. Ribarsky, and M. Zhou. LeadLine: In-teractive Visual Analysis of Text Data through Event Identification andExploration. In Visual Analytics Science and Technology (VAST), 2012IEEE Conference on, pages 93–102, Oct 2012.
[23] E. Gansner, Y. Hu, S. Kobourov, and C. Volinsky. Putting Recommenda-tions on the Map: Visualizing Clusters and Relations. In Proceedings ofthe Third ACM Conference on Recommender Systems, RecSys ’09, pages345–348, New York, NY, USA, 2009. ACM.
[24] Z. Geng, T. Cheesman, R. S. Laramee, K. Flanagan, and S. Thiel.ShakerVis: Visual analysis of segment variation of German trans-lations of Shakespeare’s Othello. Information Visualization, page1473871613495845, 2013.
[25] F. Gibbs and T. Owens. Building Better Digital Humanities Tools: To-ward broader audiences and user-centered designs. Digital HumanitiesQuarterly, 6(2), 2012.
[26] D. Goldberg, D. Nichols, B. M. Oki, and D. Terry. Using Collabora-tive Filtering to Weave an Information Tapestry. Communications of theACM, 35(12):61–70, 1992.
[27] B. Gretarsson, J. O’Donovan, S. Bostandjiev, C. Hall, and T. Hollererk.SmallWorlds: Visualizing Social Recommendations. In Proceedings ofthe 12th Eurographics / IEEE - VGTC Conference on Visualization, Eu-roVis’10, pages 833–842, Aire-la-Ville, Switzerland, Switzerland, 2010.Eurographics Association.
[28] I. Guy, N. Zwerdling, I. Ronen, D. Carmel, and E. Uziel. Social MediaRecommendation Based on People and Tags. In Proceedings of the 33rdInternational ACM SIGIR Conference on Research and Development inInformation Retrieval, SIGIR ’10, pages 194–201, New York, NY, USA,2010. ACM.
[29] M. Harrower and C. A. Brewer. ColorBrewer.org: An Online Tool for Se-lecting Colour Schemes for Maps. The Cartographic Journal, 40(1):27–37, 2003.
[30] K. Head. Gravity for Beginners. University of British Columbia, 2003.[31] J. Heer and D. Boyd. Vizster: Visualizing Online Social Networks. In
Information Visualization, 2005. INFOVIS 2005. IEEE Symposium on,
pages 32–39, Oct 2005.[32] F. Heimerl, S. Koch, H. Bosch, and T. Ertl. Visual Classifier Training for
Text Document Retrieval. Visualization and Computer Graphics, IEEETransactions on, 18(12):2839–2848, Dec 2012.
[33] Y. Jang, A. Malik, D. S. Ebert, R. Maciejewski, W. Huang, andN. Elmqvist. A Correlative Analysis Process in a Visual Analytics Envi-ronment. In Proceedings of the 2012 IEEE Conference on Visual Analyt-ics Science and Technology (VAST), VAST ’12, pages 33–42, Washing-ton, DC, USA, 2012. IEEE Computer Society.
[34] S. Janicke, G. Franzini, M. F. Cheema, and G. Scheuermann. On Closeand Distant Reading in Digital Humanities: A Survey and Future Chal-lenges. In R. Borgo, F. Ganovelli, and I. Viola, editors, EurographicsConference on Visualization (EuroVis) - STARs. The Eurographics Asso-ciation, 2015.
[35] S. Janicke, A. Geßner, M. Buchler, and G. Scheuermann. Visualizationsfor Text Re-use. GRAPP/IVAPP, pages 59–70, 2014.
[36] S. Janicke, C. Heine, R. Stockmann, and G. Scheuermann. Compara-tive Visualization of Geospatial-temporal Data. In GRAPP/IVAPP, pages613–625, 2012.
[37] D. Keim and D. Oelke. Literature Fingerprinting: A New Method forVisual Literary Analysis. In Visual Analytics Science and Technology,2007. VAST 2007. IEEE Symposium on, pages 115–122, Oct 2007.
[38] S. Koch, M. John, M. Worner, A. Muller, and T. Ertl. VarifocalReader– In-Depth Visual Analysis of Large Text Documents. Visualizationand Computer Graphics, IEEE Transactions on, 20(12):1723–1732, Dec2014.
[39] J. A. Konstan and J. Riedl. Recommender systems: from algorithms touser experience. User Modeling and User-Adapted Interaction, 22(1-2):101–123, 2012.
[40] L. Lu, M. Medo, C. H. Yeung, Y.-C. Zhang, Z.-K. Zhang, and T. Zhou.Recommender Systems. Physics Reports, 519(1):1–49, 2012.
[41] T. Munzner. A Nested Model for Visualization Design and Validation.Visualization and Computer Graphics, IEEE Transactions on, 15(6):921–928, 2009.
[42] M. J. Pazzani and D. Billsus. Content-Based Recommendation Systems.In The adaptive web, pages 325–341. Springer, 2007.
[43] A. Perer and B. Shneiderman. Balancing Systematic and Flexible Ex-ploration of Social Networks. IEEE Transactions on Visualization andComputer Graphics, 12(5):693–700, Sept. 2006.
[44] N. Riche and T. Dwyer. Untangling Euler Diagrams. Visualization andComputer Graphics, IEEE Transactions on, 16(6):1090–1099, Nov 2010.
[45] K. Sachs-Hombach. Das Bild als kommunikatives Medium. Elementeeiner allgemeinen Bildwissenschaft, 1993.
[46] L. Shi, F. Wei, S. Liu, L. Tan, X. Lian, and M. Zhou. Understanding TextCorpora with Multiple Facets. In Visual Analytics Science and Technol-ogy (VAST), 2010 IEEE Symposium on, pages 99–106, Oct 2010.
[47] Y. Shrinivasan, D. Gotz, and J. Lu. Connecting the Dots in Visual Analy-sis. In Visual Analytics Science and Technology, 2009. VAST 2009. IEEESymposium on, pages 123–130, Oct 2009.
[48] J. Stasko, C. Gorg, Z. Liu, and K. Singhal. Jigsaw: Supporting Inves-tigative Analysis through Interactive Visualization. In Visual AnalyticsScience and Technology, 2007. VAST 2007. IEEE Symposium on, pages131–138, Oct 2007.
[49] K. Verbert, D. Parra, P. Brusilovsky, and E. Duval. Visualizing Recom-mendations to Support Exploration, Transparency and Controllability. InProceedings of the 2013 International Conference on Intelligent User In-terfaces, IUI ’13, pages 351–362, New York, NY, USA, 2013. ACM.
[50] M. Vlachos and D. Svonava. Recommendation and visualization of sim-ilar movies using minimum spanning dendrograms. Information Visual-ization, page 1473871612439644, 2012.
[51] R. Vuillemot, T. Clement, C. Plaisant, and A. Kumar. What’s being saidnear ”Martha”? Exploring name entities in literary text collections. InVisual Analytics Science and Technology, 2009. VAST 2009. IEEE Sym-posium on, pages 107–114, Oct 2009.
[52] M. Wattenberg and F. Viegas. The Word Tree, an Interactive Visual Con-cordance. Visualization and Computer Graphics, IEEE Transactions on,14(6):1221–1228, Nov 2008.
[53] C. Weaver. Multidimensional Visual Analysis Using Cross-FilteredViews. In Visual Analytics Science and Technology, 2008. VAST ’08.IEEE Symposium on, pages 163–170, Oct 2008.
[54] C. Weaver. Multidimensional Data Dissection Using Attribute Relation-ship Graphs. In Visual Analytics Science and Technology (VAST), 2010IEEE Symposium on, pages 75–82, Oct 2010.


![Proteasome Activity Imaging and Profiling Characterizes · PDF fileProteasome Activity Imaging and Profiling Characterizes Bacterial Effector Syringolin A1[W] Izabella Kolodziejek2,](https://img.dokumen.tips/doc/110x75/5a79e7cc7f8b9a5c3a8de66d/proteasome-activity-imaging-and-proling-characterizes-activity-imaging-and-proling.jpg)


