Embed Size (px)
Citation preview
Interactive modelling of buildings in Google Earth: A 3D tool for Urban Planning
Umit Isikdag and Sisi Zlatanova
Abstract
Urban planning and renewal is a very complex process consisting of tasks that require joint decision making. In such tasks, the communication tools to present and convey design ideas are of critical importance. Appropriate visual tools are needed to establish a common language between profes-sionals, and between professionals and citizens. However, there are indica-tions that particular representations and tools may create different percep-tions with respect to the background of the actors. Therefore it is important to develop simple tools which will allow specialists and non-specialists to demonstrate their ideas during the discussions. New emerging technologies offer a large variety of visualisation tools that may solve this problem and greatly enrich visualisation and communication possibilities.
This paper presents an approach to draw and visualise simple geometric representation of buildings directly in the Google Earth environment. Us-ing this tool the urban planners and citizens can introduce proposed build-ings into the existing 3D environments in a commonly used application such as Google Earth. Several alternatives for the proposed buildings can be easily created, examined and evaluated (in the virtual environment). Us-ing the proposed tool the citizens can generate their own solutions for a de-sign evaluation scenario at home or during a joint decision making session at a municipality and present them to the specialists. The developed tool is Java-based and uses newly released API of Google Earth.
Introduction
Urban planning and renewal is practically a complex decision-making process, which involves many actors, who perform different tasks and have diverse points of view. In such projects, the actors have often-conflicting expectations, background and foci. The steps to approve a planning (or design) proposal or a renewal project are many, as the ap-proach varies per municipality and country. For example, in Netherlands six phases can be distinguished starting from a very general vision for de-velopment and finishing with a detailed architectural plan of each building in the area (Zlatanova et al 2008, Kibria et al 2009). Actors involved in those phases are quite different. As the phases become specific the actors change from urban planners and local authorities to architects and citizens (especially in the last three phases when the volumetric design is pre-sented). Recently completed studies (e.g. Kibria, 2008) have clearly shown that these phases also require the use of 3D representations and visualisa-tions to support the joint decision making process during the evaluation of design / renewal proposals. As the current state of the art municipalities use 3D physical (wooden, plastic or carton) models to discuss the projects. The representations of the buildings are very often schematic (i.e. in form of simple boxes) and the citizens are encouraged to play with them and de-velop new volumetric compositions (by using these physical models), to develop and convey an agreed point of view.
Traditionally, during evaluation of design / renewal proposals munici-palities use 2D paper maps, CAD drawings, graphical images, textual/oral information and 3D physical models to present ideas and discuss alterna-tives to citizens. Most municipalities have websites for dissemination of spatial plans, but they are in 2D and in most cases offer only static visuali-sation. Only recently large municipalities may employ systems allowing for presenting interactive digital maps for the public in Web Map Services (WMS) (Knap and Coors, 2008). In the last several years, advances of geo-information technology such as 3D virtual environments, 3D analytical visualisation and 3D formats for sharing of data, offer large spectrum of new possibilities for communication of ideas and discussion of design al-ternatives. Virtual environments like Google Earth, Virtual Earth have made 3D visualisation of urban fabric known and accessible for everyone.
Many municipalities and urban designers are in the process of discover-ing these new functionalities. However, there are indications from practi-tioners that this visual information is not necessarily equally perceived. A given representation may be misunderstood by the receiver, due to a wrong presented message or due to different concepts of the actors. Therefore,
municipalities are looking for new tools that allow actors to actively inter-act with the design to enable them express their own understanding about size and height of a building, location and direction. Despite recent devel-oped tools and systems to support 3D visualisation for municipalities (e.g. Kolar et al 2008, Reitz et al 2009) and virtual exploration of cities (e.g. www.cebra.eu), the interest in virtual globes (3D Geospatial Browsers) as Google Earth is increasing. Being freely available, citizens are largely fa-miliar with the navigation and interaction options in these tools and can participate relatively easily in the discussions. A growing number of mu-nicipalities use Google Earth to announce events, renewal projects or just to provide a 3D view of the city.
All these developments encouraged us to look for tools that will allow for a level of communication and interaction between citizens and local governments, which suits exchange of ideas in virtual worlds. The aim of the ongoing research presented in this chapter is: “providing an easily accessible visualisation tool to support the joint deci-sion making process (by facilitating the user interaction in modeling) dur-ing the evaluation of a design/renewal proposal”
The research mainly concentrates on facilitating the interactivity in gen-
eration of 3D visualisation of buildings. Although this tool will facilitate the joint decision making process during a design evaluation session held in municipalities, the authors would like to clarify that this research is uniquely focused on the enabling and facilitating interactive visualisation (of buildings). In addition, it should be taken into account that the pre-sented research is not focusing on developing a software (or a tool) that would support the overall public participation process.
The research and literature on developing tools for enabling and facili-tating planning support and public participation is extensive. The follow-ing provides only a few notable examples of the research (and develop-ment) from the literature in the field, which the reader can refer. As an experienced researcher in the area, Al-Kodmany (2002) reviewed both tra-ditional and computerized visualization tools for public participation and provided a general map for planners as they navigate through the multitude of options that exist for visualization in public participation planning. Hudson-Smith et al. (2002) presented a UCL CASA working paper based on a UK case study which is focused on the impact of digital communica-tion and online participation, where the users also made use of 3D visual representation of the urban elements. For several years, Environmental Simulation Center has been carrying out studies on 3D visualisation and participation in projects such as Baltimore Vision 2030, Lower Manhattan,
Santa Fe (ESC,2009). A recent EU project VEPS, -Virtual Environment Planning- (Knapp and Coors, 2008) was focused on developing tools for facilitating the communication in the planning process with 3D visualisa-tion and efficient use of the web technologies. There is also commercial software such as CommunityViz (CommunityViz, 2009) which support the public participation process by 3D visualisation. In general terms, ongoing research on facilitating the public participation by the use of ICTs and software tools developed for this purpose focus on a number of issues in-cluding: • Visualisation of the urban environment • Visualisation of design proposals • Online communication of users • Gathering user feedback • Analysing the social and environmental impact of proposals
Conversely, the tool that is being developed during this research can not be classified as one of these tools (i.e., a public participation enabler or a facilitator) as it only focuses on a single aspect of the overall process, but it can only be regarded as a medium for facilitating the rapid 3D visualisa-tion of design proposals (by user interaction) in joint decision making ses-sions (held physically or virtually).As the tool is intended for quickly pre-senting ideas in a well recognised 3D Geospatial Browser (Google Earth) it can be used as a communication/visualisation facilitator for different ac-tors in urban development and renewal process.
The chapter is organised as follows: following the introduction section which covers the aim of the research, the second section briefly outlines the role of Google Earth as the new geospatial medium of visualisation and communication, and summarises the representation methods of building models within Google Earth. The third section illustrates the approach for preparing digital models of existing buildings (which will act as the back-ground data for the design proposal evaluation process). The fourth section introduces a new method for generation of building geometries based on the user interactions on Google Earth, and provides the details of the proto-type implementation realized by using this method. The chapter finalizes with the conclusion section, which also provides the future research direc-tions.
Google Earth as tool for visualisation and communication
3D Geospatial Browser is a new term for defining browsers that are capa-ble of retrieving geospatial data over the web and visualising it over a vir-
tual globe (in form of raster and vector representations). Most known 3D Geospatial Browsers are Google Earth, Microsoft Virtual Earth and NASA World Wind. The data that forms the base layer of the virtual globe is sat-ellite images with varying resolution where the resolution of the images change depending on the user interaction with the browser. In most 3D Geospatial Browsers it is possible to search for an address, a point of inter-est, as well as a coordinate pair. In addition, it is also possible to navigate (pan, zoom, rotate etc.) by using simple and user-friendly mouse functions or appropriate toolbars.
Google Earth is the most popular 3D Geospatial Browser. In Google Earth, for most parts of the world the terrain data is available in form of the Digital Elevation Model (DEM), and the terrain can be visualised in 3D, although for many areas not that accurate. The user input is a very im-portant resource of data, and there are many map layers created by the user input. Users can create their own points and areas of interest (i.e. place-marks), define their geometries and associate semantic information with these points and areas of interest.
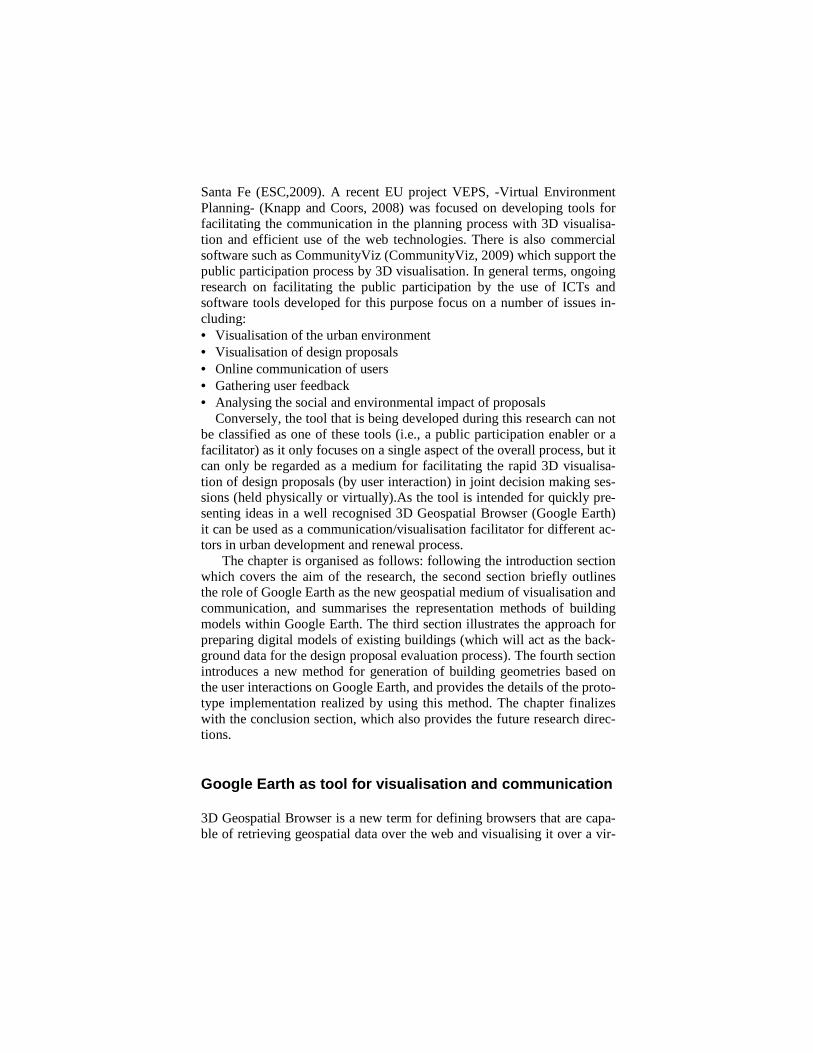
Fig. 1. Visualisation of two 3D building models in Google Earth
Google Earth has the ability to visualise the 3D representations (models) of the buildings which are created by the user input. These models can then be viewed by all the users of the software. The buildings visualised in Google Earth, are usually created through a 3D modelling software such as SketchUp or other 3D modelling software and imported as KML/KMZ file
formats. Figure 1 shows 3D visualisations of two buildings within Google Earth.
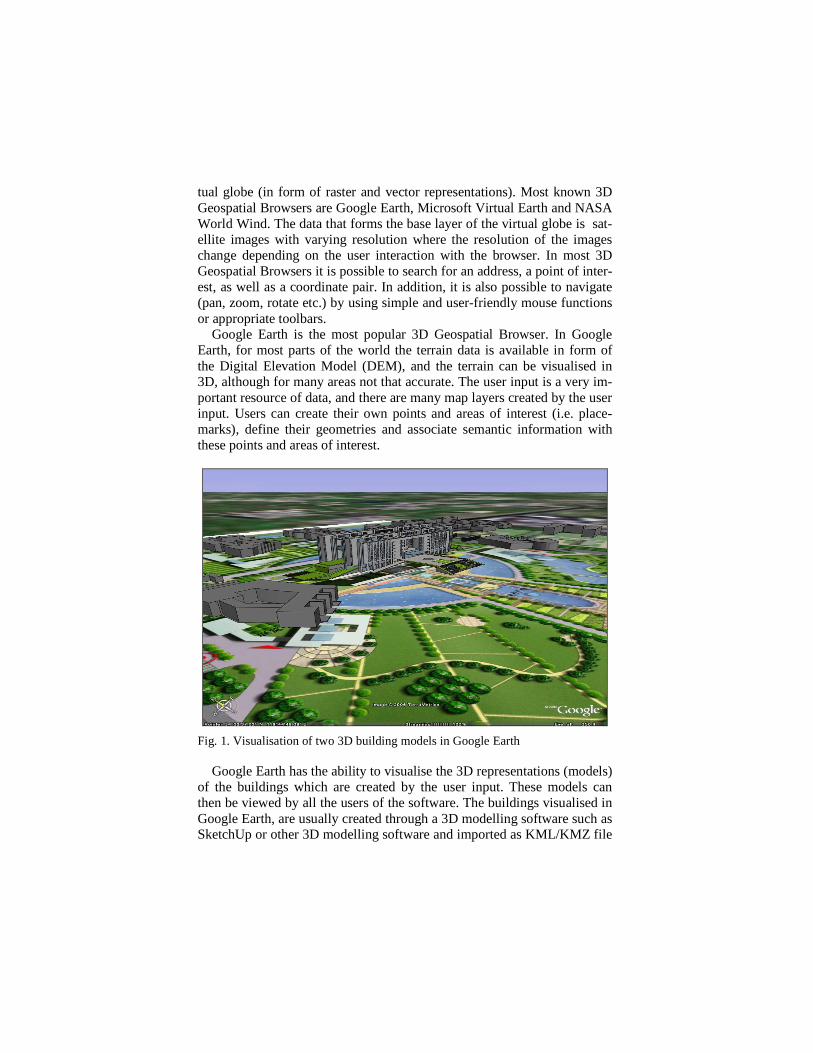
The representation of the building in Google Earth is a BRep (Boundary Representation) model, in addition, these models can also have textures as-sociated with them. Google Earth was originated from the software called Earth Viewer, created by Keyhole Inc. Thus, the mark-up language (used to represent the geometric models in Google Earth) is known as Keyhole Markup Language (KML). KML supports representation of objects by us-ing the BRep method. The language is based on the XML standard and uses a tag-based structure with nested elements and attributes. In KML, the building geometries are represented with polygons. Two distinct methods exist to represent the building geometries. First one is, defining a base polygon that corresponds to the floor plan of the building and extruding this base polygon to the height of the building. Figure 2 illustrates 4 build-ings represented by this method.
Fig. 2. Representation of 4 buildings within base polygon extrusion (Google Code, 2009)
The figure above presents the visual representation of 4 buildings of the Google Campus. Their representation method is explained in the KML documentation (Google Code, 2009). The building located top-right of the illustration is named as Building 40, and represented by a set of semi-transparent red polygons. The polygons representing the walls and the roof of the building are generated on-the-fly (i.e. at run time) by Google Earth, based on the coordinates of the base-surface and the extrusion parameter.
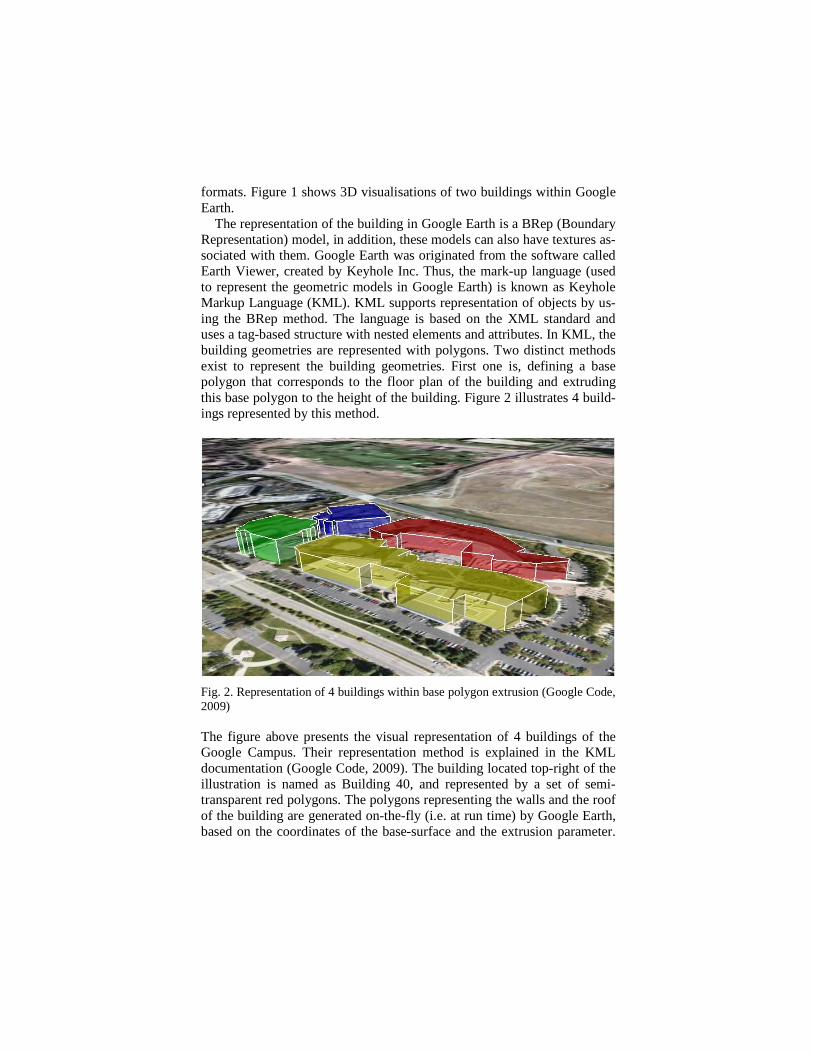
The KML code to represent Building 40 in Google Earth is provided in Table 1.We refer this type of representation as Base Polygon Extrusion.
Table 1: The KML code used to represent the Building 40 (Base Polygon Extrusion ) <Placemark> <name>Building 40</name> <visibility>0</visibility> <styleUrl>#transRedPoly</styleUrl> <Polygon> <extrude>1</extrude> <altitudeMode>relativeToGround</altitudeMode> <outerBoundaryIs> <LinearRing> <coordinates> -122.0848938459612,37.42257124044786,17 ... -122.0848938459612,37.42257124044786,17 </coordinates> </LinearRing> </outerBoundaryIs> </Polygon> </Placemark>
The second method for representing the building’s geometry is, using
multiple polygons. This method enables more detailed geometrical repre-sentation of the building elements and is currently used by several different applications that acquire/transfer information from digital building models into Google Earth. In this case, the 3D Geospatial Browser will visualise every face of the building -one-by-one, based on the parameters provided in the KML code. We refer this type of representation as Multi Polygon Representation. An extract from the KML code for representing the same building with multiple-polygons is provided in Table 2.
The users will not notice the difference between both representations, when a building’s geometry is represented in a low level of detail (i.e. Fig-ure 2, in LODs similar to CityGML LOD1, www.citygml.org). The first representation is beneficial for large data sets, where whole cities have to be visualised. For example, tests performed with all the buildings of the city of Delft have shown drastic reduction of the time needed to load KML file when the buildings are represented using the base extrusion approach. However, it would become impossible to represent the geometry of build-ing elements by using the first method, if a detailed representation / visu-alisation of, the building façade and indoor building elements is required (i.e. in LODs similar to CityGML LOD 3, LOD 4), and, in that situation the Multi Polygon Representation becomes an inevitable need.
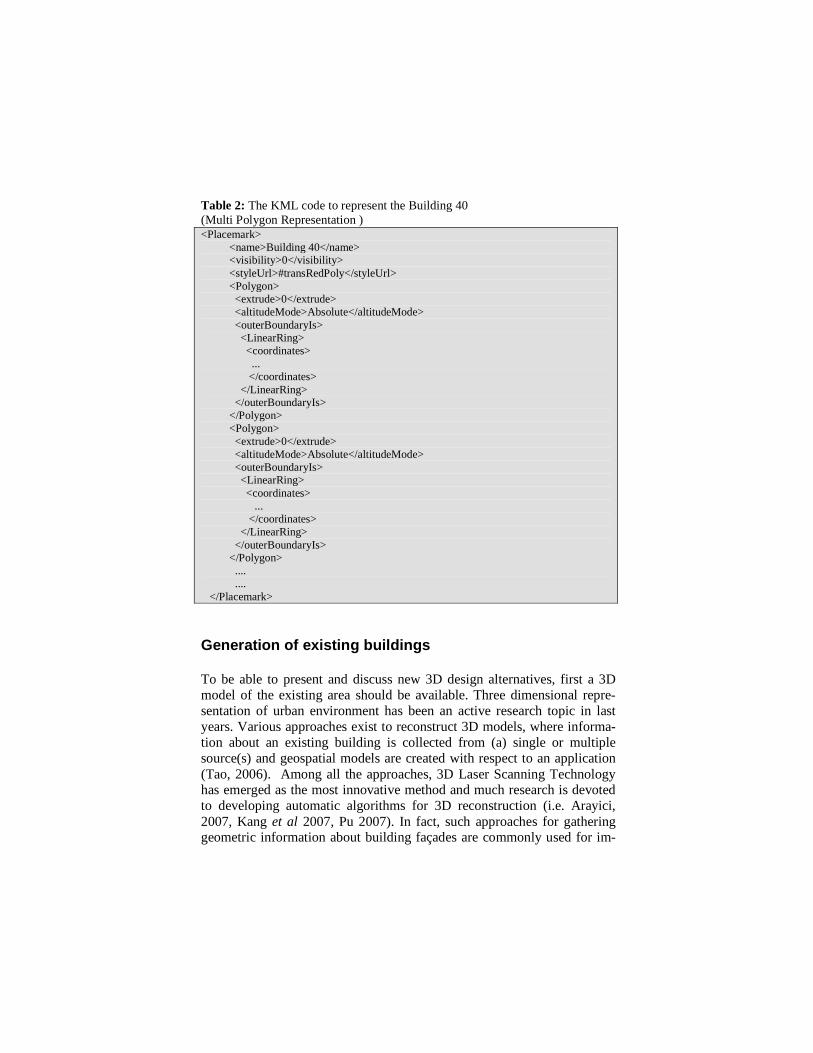
Table 2: The KML code to represent the Building 40 (Multi Polygon Representation ) <Placemark> <name>Building 40</name> <visibility>0</visibility> <styleUrl>#transRedPoly</styleUrl> <Polygon> <extrude>0</extrude> <altitudeMode>Absolute</altitudeMode> <outerBoundaryIs> <LinearRing> <coordinates> ... </coordinates> </LinearRing> </outerBoundaryIs> </Polygon> <Polygon> <extrude>0</extrude> <altitudeMode>Absolute</altitudeMode> <outerBoundaryIs> <LinearRing> <coordinates> ... </coordinates> </LinearRing> </outerBoundaryIs> </Polygon> .... .... </Placemark>
Generation of existing buildings
To be able to present and discuss new 3D design alternatives, first a 3D model of the existing area should be available. Three dimensional repre-sentation of urban environment has been an active research topic in last years. Various approaches exist to reconstruct 3D models, where informa-tion about an existing building is collected from (a) single or multiple source(s) and geospatial models are created with respect to an application (Tao, 2006). Among all the approaches, 3D Laser Scanning Technology has emerged as the most innovative method and much research is devoted to developing automatic algorithms for 3D reconstruction (i.e. Arayici, 2007, Kang et al 2007, Pu 2007). In fact, such approaches for gathering geometric information about building façades are commonly used for im-
portant public or historical buildings. However, in many cases urban plan-ners do not require such detailed 3D models for all buildings. The existing situation is mostly used as background information to demonstrate new ideas. Therefore the 3D models used in urban planning can be relatively simple.
In this respect, a very appropriate 3D re-construction approach for a municipality considers a combination of existing 2D digital maps and LiDAR data. The 2D digital maps provide the outlines of the buildings and the LiDAR data are used to derive height information per building. The buildings are then extruded to the derived height. Depending on the pur-pose, these 3D blocks can be further decorated with actual textures (pho-tos) to increase the realism, but texturing is not applied in most of the cases. Municipalities usually have such data at their disposal and the sim-ple buildings can be created in an automatic manner. Almost all commer-cial packages allow the generation of 3D extrusion (from given polygons and a height value per polygon).
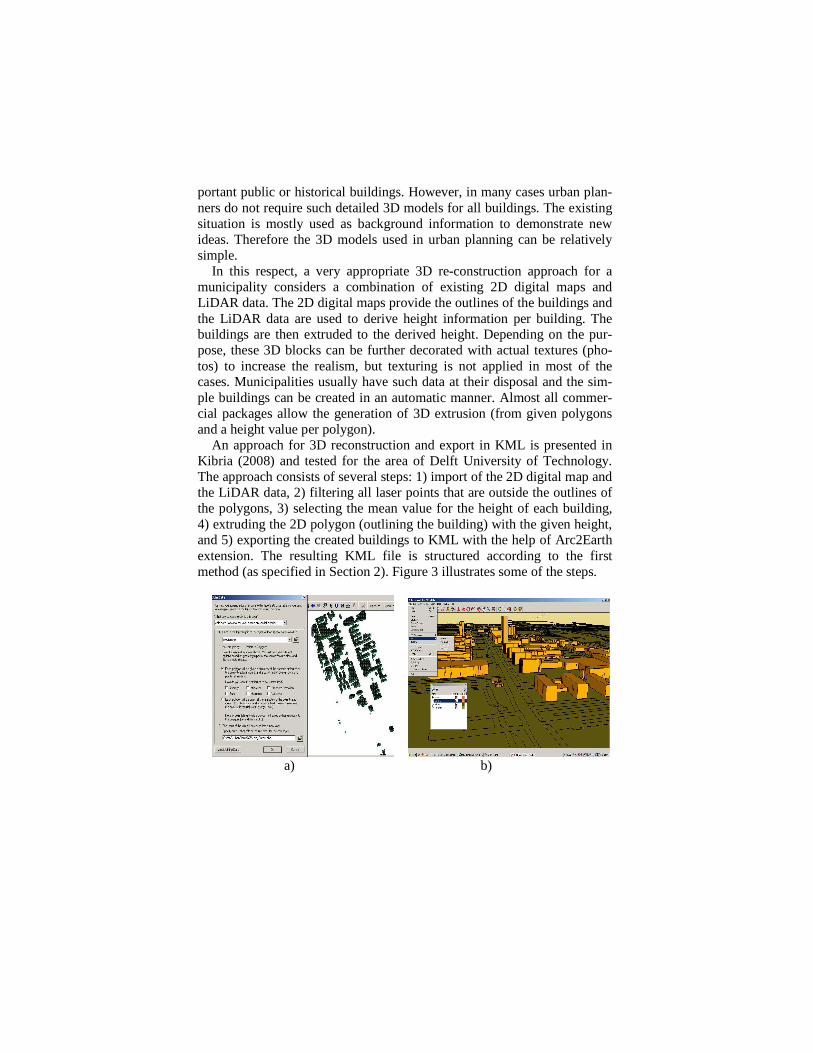
An approach for 3D reconstruction and export in KML is presented in Kibria (2008) and tested for the area of Delft University of Technology. The approach consists of several steps: 1) import of the 2D digital map and the LiDAR data, 2) filtering all laser points that are outside the outlines of the polygons, 3) selecting the mean value for the height of each building, 4) extruding the 2D polygon (outlining the building) with the given height, and 5) exporting the created buildings to KML with the help of Arc2Earth extension. The resulting KML file is structured according to the first method (as specified in Section 2). Figure 3 illustrates some of the steps.
a) b)
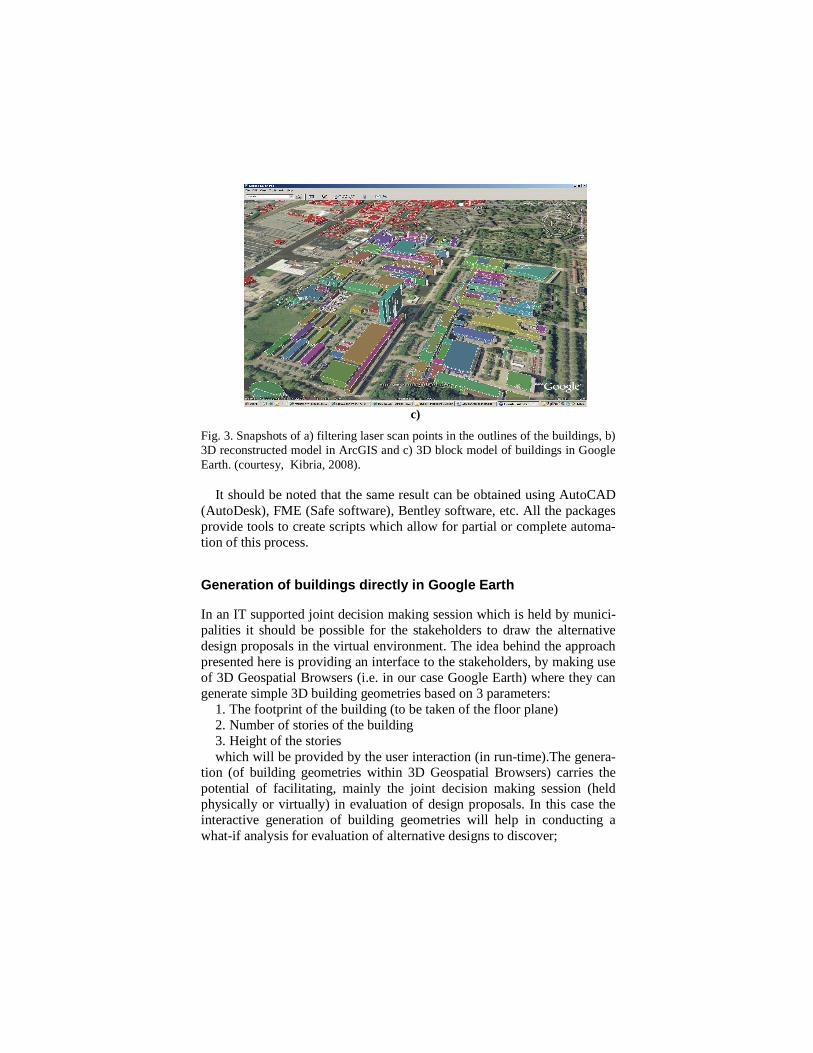
c)
Fig. 3. Snapshots of a) filtering laser scan points in the outlines of the buildings, b) 3D reconstructed model in ArcGIS and c) 3D block model of buildings in Google Earth. (courtesy, Kibria, 2008).
It should be noted that the same result can be obtained using AutoCAD (AutoDesk), FME (Safe software), Bentley software, etc. All the packages provide tools to create scripts which allow for partial or complete automa-tion of this process.
Generation of buildings directly in Google Earth
In an IT supported joint decision making session which is held by munici-palities it should be possible for the stakeholders to draw the alternative design proposals in the virtual environment. The idea behind the approach presented here is providing an interface to the stakeholders, by making use of 3D Geospatial Browsers (i.e. in our case Google Earth) where they can generate simple 3D building geometries based on 3 parameters:
1. The footprint of the building (to be taken of the floor plane) 2. Number of stories of the building 3. Height of the stories which will be provided by the user interaction (in run-time).The genera-
tion (of building geometries within 3D Geospatial Browsers) carries the potential of facilitating, mainly the joint decision making session (held physically or virtually) in evaluation of design proposals. In this case the interactive generation of building geometries will help in conducting a what-if analysis for evaluation of alternative designs to discover;

“How a design proposal would affect an urban scene” and “How the urban fabric would affect the detailed design of the building” The digital city model containing geometrical representation of the cur-
rent buildings in the scene (see the Section 3), will also act as a very im-portant background data source for these analysis.
Methodology of the Implementation
In technical terms, there are two alternative routes for implementation, and they both share the same starting stage i.e. deciding on i) location for gen-erating the geometry of the footprint, ii) number of stories and storey height. Then the building geometries can either be; • Generated and visualised on-the-fly and stored later. • Generated and stored in the first stage and visualised later.
These two alternative routes are illustrated in Figure 4.
Fig. 4. Routes for generation of Building Models based on user interactions
The method chosen for implementation will not cause any technical dif-ference, i.e. both implementations will provide the same output, in fact, generating the geometries on-the-fly and storing them in a later stage might bring performance efficiency for (the time behaviour of) the soft-ware.
In terms of municipality-citizens communication, the first option can be applied for interactive discussions, while the second one could be used by the citizens to prepare their ideas prior the discussions. In this primary de-velopment effort, the first method is chosen for the implementation. The implementation started with a prototyping effort to produce an early proto-type for testing and validating the (technical dimension of the) implemen-tation. The following section explains the details of this prototyping effort.
The Prototype
The prototyping effort includes three stages, the first stage was about the development of the (interaction) interface -for getting the user input-, the second stage involved the development of the component that generates the building geometry on the fly, and final stage is on development of the component for storing the generated building geometry. As the prototype is still in development at the time this chapter is prepared, the following sections will provide details of the first two stages that have completed un-til today.
The User Interface
A Windows Form, created in the Visual Basic.NET ® environment is used as the main user interface component of the prototype. A WebBrowser Control® of Visual Basic.NET is used, to embed a Web Browser within the user form. Then on the initialisation of the prototype application, a web page where an instance of Google Earth is embedded is called, and loaded within WebBrowser Control that is embedded within Windows Form. The Google Earth within the web page is populated by the use of Google Earth API, an API which provides Java Script and AJAX functions to populate the Google Earth within a web page and interact with it.
The Google Code Earth API documentation (Google Earth API, 2009) describes this API as a JavaScript API that lets one embed Google Earth, a true 3D digital globe, into his web pages. Using the API one can draw markers and lines, drape images over the terrain, add 3D models, or load KML files. The Google Earth API allows building sophisticated 3D map applications that are working within web pages.
Sample Applications using the Google Earth API are provided at the Google Code Playground (Google Code Playground, 2009) which is an in-structive resource for the developers. The application uses the ‘Event Lis-teners’ provided by the API to get the coordinates of the points -that the
user clicks- on the Google Earth application. Once the user clicks on the Google Earth window, • the data is first handled by the Event Listener (of the Google Earth API) • then it is transferred to a dynamic attribute of the web page (that the API
is embedded in) • finally when the Listener of the WebBrowser Control (in Windows
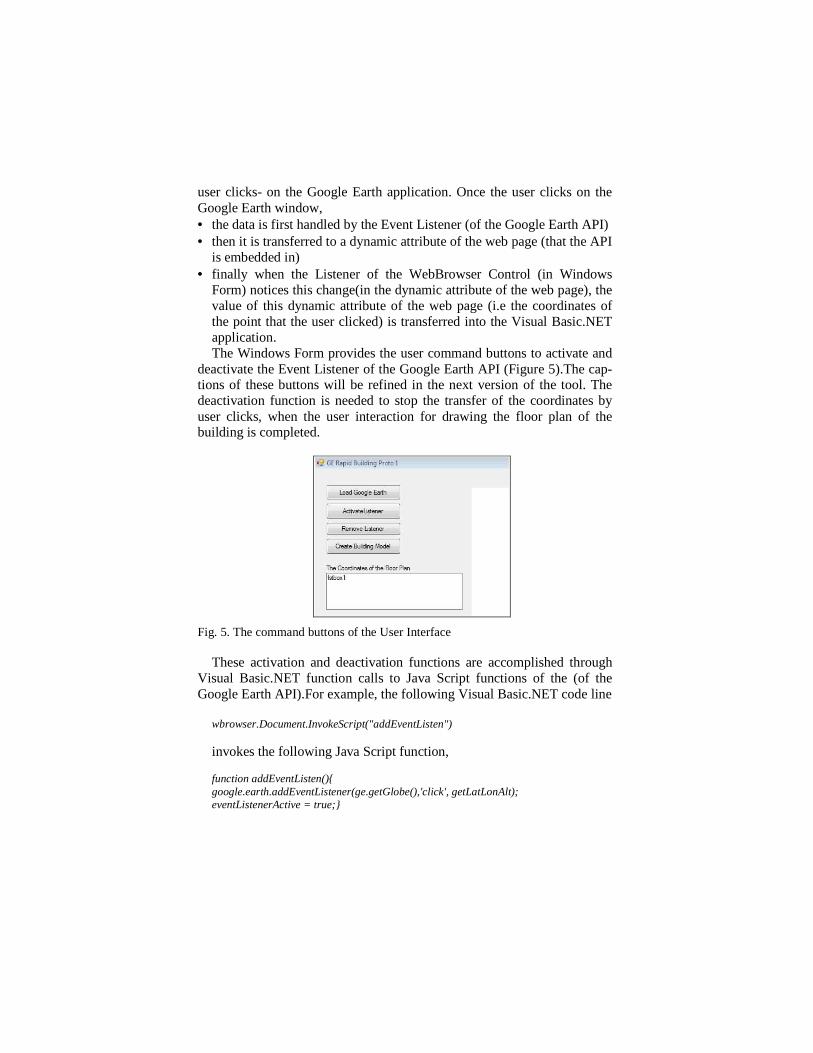
Form) notices this change(in the dynamic attribute of the web page), the value of this dynamic attribute of the web page (i.e the coordinates of the point that the user clicked) is transferred into the Visual Basic.NET application. The Windows Form provides the user command buttons to activate and
deactivate the Event Listener of the Google Earth API (Figure 5).The cap-tions of these buttons will be refined in the next version of the tool. The deactivation function is needed to stop the transfer of the coordinates by user clicks, when the user interaction for drawing the floor plan of the building is completed.
Fig. 5. The command buttons of the User Interface
These activation and deactivation functions are accomplished through Visual Basic.NET function calls to Java Script functions of the (of the Google Earth API).For example, the following Visual Basic.NET code line
wbrowser.Document.InvokeScript("addEventListen") invokes the following Java Script function, function addEventListen(){ google.earth.addEventListener(ge.getGlobe(),'click', getLatLonAlt); eventListenerActive = true;}

in the web page, where the Google Earth is populated. By this way, the Google Earth API adds an Event Listener to the populated Google Earth instance. Following this, when the user clicks on the Google Earth instance the following function handles the event and transfers the values of the co-ordinates(of the location that the users clicks) into a dynamic attribute of the web page with the function below. function getLatLonAlt(event) { lat= event.getLatitude(); document.getElementById("mylat").value=lat;}
These, i) call of functions from Visual Basic.NET to Java Script and
ii)passing values from the Java Script to the Visual Basic.NET application made it possible to acquire the user input (i.e. the coordinates of the floor plan) by user interaction in order to generate the building geometry.
The state of the User Interface after the user input is acquired is depicted in Figure 6. The List Box in the Windows Form now shows the coordi-nates of the (points that depict the) floor plan which are acquired by the user interaction with the Google Earth instance.
Fig. 6. The state of the User Interface (i.e. showing the coordinates of the points determined by the user interaction).
Generating the buildings
The building model generation functions are triggered by the “Create Building Model” command in the Windows Form (Figure 6). In the first
stage (i.e. when the button is clicked) the user is asked to input the number of stories in the building and the storey height.
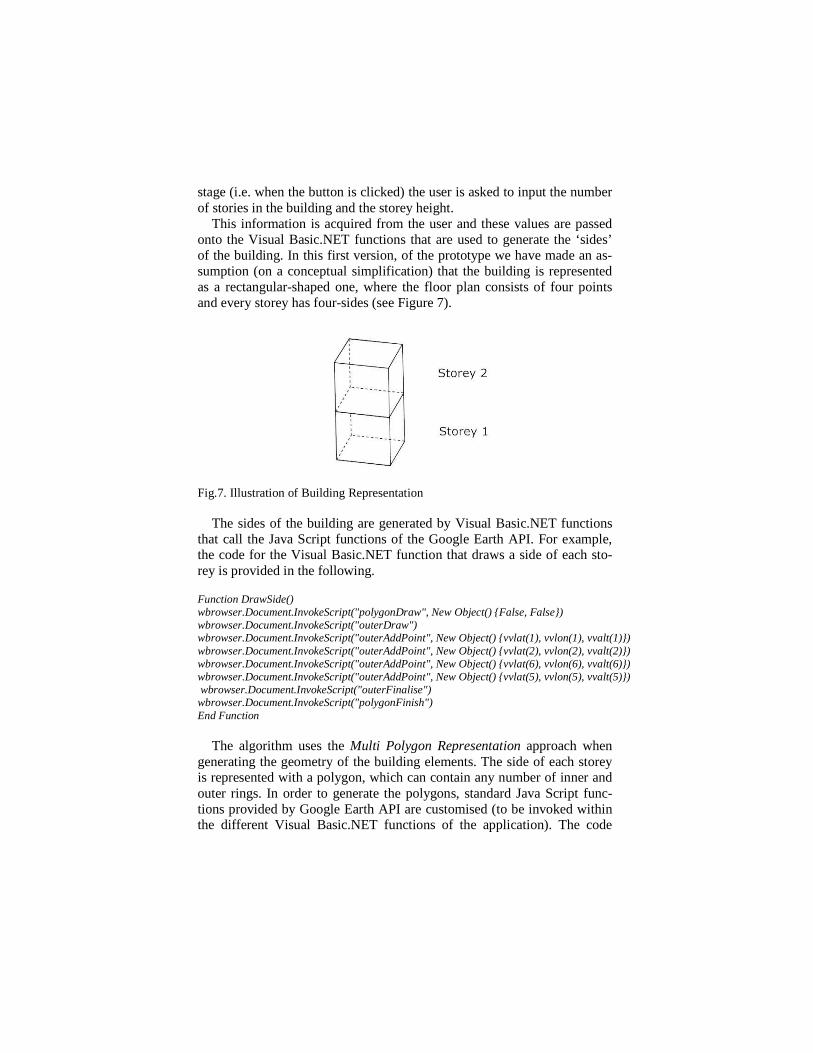
This information is acquired from the user and these values are passed onto the Visual Basic.NET functions that are used to generate the ‘sides’ of the building. In this first version, of the prototype we have made an as-sumption (on a conceptual simplification) that the building is represented as a rectangular-shaped one, where the floor plan consists of four points and every storey has four-sides (see Figure 7).
Fig.7. Illustration of Building Representation
The sides of the building are generated by Visual Basic.NET functions that call the Java Script functions of the Google Earth API. For example, the code for the Visual Basic.NET function that draws a side of each sto-rey is provided in the following. Function DrawSide() wbrowser.Document.InvokeScript("polygonDraw", New Object() {False, False}) wbrowser.Document.InvokeScript("outerDraw") wbrowser.Document.InvokeScript("outerAddPoint", New Object() {vvlat(1), vvlon(1), vvalt(1)}) wbrowser.Document.InvokeScript("outerAddPoint", New Object() {vvlat(2), vvlon(2), vvalt(2)}) wbrowser.Document.InvokeScript("outerAddPoint", New Object() {vvlat(6), vvlon(6), vvalt(6)}) wbrowser.Document.InvokeScript("outerAddPoint", New Object() {vvlat(5), vvlon(5), vvalt(5)}) wbrowser.Document.InvokeScript("outerFinalise") wbrowser.Document.InvokeScript("polygonFinish") End Function
The algorithm uses the Multi Polygon Representation approach when generating the geometry of the building elements. The side of each storey is represented with a polygon, which can contain any number of inner and outer rings. In order to generate the polygons, standard Java Script func-tions provided by Google Earth API are customised (to be invoked within the different Visual Basic.NET functions of the application). The code

below demonstrates some of the Java Script functions that are called within Visual Basic.NET functions when generating the polygons. function outerDraw() { outer = ge.createLinearRing('');} function outerAddPoint(lat,lon,z ){ outer.getCoordinates().pushLatLngAlt(lat,lon,z);} function outerFinalise(){ polygon.setOuterBoundary(outer);}
Fig. 8. A building model generated as a result of user interaction.
In this early prototype, the geometry of the generated buildings is very simple (i.e. every storey of the building is represented with a rectangular prism), but the implementation (even in this early form) provides the tech-nical proof-of-concept that it is possible to rapidly generate building ge-ometries within Geospatial Browsers based on the user input. Figure 8 shows an example of building models generated by the prototype applica-tion.
Conclusion
This paper presented a rapid visualisation tool for supporting the joint de-cision making in evaluation of design/renewal proposals. As discussed, the
process involve participation of the citizens and experts. These parties have mostly different point of view and conflicting expectations from a development. The visualisation of the geospatial environment, the urban fabric and the proposed building/facility is the key to facilitating the joint decision making during the design evaluation process. The prototype pre-sented in this chapter also technically proves the idea of using 3D Geospa-tial Browsers for enabling a user interaction. The developed prototype demonstrates that the simple 3D models of the buildings can be generated by user interaction with Google Earth. These (generated) models can then be used in evaluating design proposals (i.e. to determine how the proposed building will affect the urban fabric and also to determine how the sur-rounding environment will shape the final design of the building.). Plan-ners and citizens can jointly examine the proposed designs or suggest their own in a physical or a virtual meeting. In this respect, the tool can be seen as a candidate to replace the simple 3D physical (wooden, plastic) models. As the tool enables the generation of simple 3D geometries only by using a well known Geospatial Browser it eliminates the need for learning to use a third part software (such as SketchUp or 3D Studio Max) to produce build-ing models, which would require a reasonable time and effort especially for the citizens.
The prototyping effort will continue with the development of the com-ponent that will allow for generating more complicated geometries and storing these geometries as KML files. The prototype will then be tested with users in beta stage, of the development and feedback obtained from the validation studies will be used in developing the next version of the prototype. Another important step will be the integration of 3D models (of the existing buildings) with the (proposed) design models. Then the users will be able to create the new buildings directly in the environment con-taining 3D models of existing buildings.
References
Al-Kodmany, K. 2002, Visualization Tools and Methods in Community Planning: From Freehand Sketches to Virtual Reality, Journal of Planning Literature
17(2):189-211 Arayici, Y. 2007 An approach for real world data modelling with the 3D terrestrial
laser scanner for built environment, Automation in Construction 16 (6): 816-829
CommunityViz 2009. The Web Site of CommunityViz Public Participation Soft-ware (available at http://www.placeways.com)
ESC. 2009 The Web Site of Environmental Simulation Center (available at http://www.simcenter.org)
Google Code. 2009 KML Tutorial, (available at http://code.google.com/intl/tr-TR/apis/kml/documentation/kml_tut.html)
Google Earth API. 2009 Google Earth API Documentation in Google Code, (available at http://code.google.com/intl/tr-TR/apis/earth )
Google Code Playground. 2009 (available at http://code.google.com/apis/ajax/ playground/?exp=earth)
Hudson-Smith, A., Evans,S., Batty,M. and S.Batty, 2002, Casa Working Paper 60, Online Participation: The Woodberry Down Experiment, http://www.casa.ucl.ac.uk/publications/workingPaperDetail.asp?ID=60
Isikdag, U. 2006. Towards the Implementation of Building Information Models in Geospatial Context, PhD Thesis, University of Salford, UK.
Kang, Z., Z. Zhang, J. Zhang and S. Zlatanova, 2007, Rapidly realizing 3D visu-alisation for urban street based on multi-source data integration, in: Li, Zla-tanova&Fabbri (Eds.) Geomatics Solutions for Disaster Management, Lecture Notes in Geoinformation and Cartography, Springer-Verlag Berlin, Heidel-berg, pp. 149-163
Kibria, M.S. 2008, Functionalities of geo-virtual environments to visualize urban projects, Master’s Thesis GIMA (Utrecht Univ., TU Delft, Wageningen Univ., ITC), 2008, 124 p (available at www.gdmc.nl/publications).
Kibria, M.S., S. Zlatanova, L. Itard and M. van Dorst, 2009, GeoVEs as tools to communicate in Urban Projects: requirements for functionality and visualiza-tion, In: J. Lee and S. Zlatanova (Eds.); 3D Geo-Information Sciences, Springer, 2009, pp. 379-395
Knapp, S. and V. Coors, 2008, The use of eParticipation systems in public partici-pation: The Veps example,in: Coors, Rumor, Fendel&Zlatanova (eds.) Urban and Regional Data Management, UDMS Annual 2007,Taylor & Francis, Lei-den, The Netherlands, pp. 93-104
Kolar, J., T. Bayer and S. Grill, 2008, Open source GRIFINOR platform for 3D spatial data presentation. In: Remote Sensing for a Changing Europe: Pro-ceedings of the 28th Symposium of the European Association of Remote Sensing Laboratories, Istanbul, Turkey, 2-5 June 2008
Pu, S. 2007. Automatic Building modelling from terrestrial laser scanning, In P.Van Oosterom, S. Zlatanova, F.Penninga, E. Fendel (eds). Advances in 3D Geoinformation Systems, LNG&C,Springer, pp.147-160.
Reitz,T.,Kramer,M., and S.Thum, 2009, A Processing Pipeline for X3D Earth-based Spatial Data View Services, In Proceedings of the 14th International Conference on 3D Web Technology ,ACM, pp.137-145
Tao, V. 2006. 3D Data Acquisition and object reconstruction for AEC/CAD, in Zlatanova & Prosperi ( eds.) Large-scale 3D data integration- Challenges and Opportunities, Taylor & Francis Group, CRCpress, Boca Raton, pp.39-56
Zlatanova, S., L. Itard and M. Van Dorst, 2008, User requirements for virtual en-vironments used to model buildings at the urban scale, in proceedings of IBSA-NVL 2008 Event, 9 October, 2008 (CD)


![Grid-interactive Efficient Buildings Technical Report Series · Adam Hirsch, Torque Interactive Media (previously at the National Renewable Energy Laboratory [NREL]) Janet Reyna,](https://img.dokumen.tips/doc/110x75/5f40b9c5e5196218473a0e5c/grid-interactive-efficient-buildings-technical-report-series-adam-hirsch-torque.jpg)