Embed Size (px)
Citation preview
J. K. Apple, C. V. Maxwell, D. L. Galloway, C. R. Hamilton and J. W. S. Yancey
swine: II. Fatty acid composition of subcutaneous fatInteractive effects of dietary fat source and slaughter weight in growing-finishing
doi: 10.2527/jas.2008-1454 originally published online Dec 9, 2008; 2009.87:1423-1440. J Anim Sci
http://jas.fass.org/cgi/content/full/87/4/1423the World Wide Web at:
The online version of this article, along with updated information and services, is located on
www.asas.org
at Serials/Acq. Dept., Library on May 1, 2009. jas.fass.orgDownloaded from

ABSTRACT: Crossbred pigs (n = 288) were used to test the interactive effects of dietary fat source and slaughter weight on the fatty acid composition of subcu-taneous fat. Pigs were blocked by initial BW (28.1 kg), and, within blocks, pens (8 pigs/pen) were randomly assigned to either grower and finisher diets devoid of added fat (Ctrl) or diets formulated with 5% beef tal-low (BT), poultry fat (PF), or soybean oil (SBO). Im-mediately after treatment allotment, as well as at mean block BW of 45.5, 68.1, 90.9, and 113.6 kg, 1 pig was randomly selected from each pen, slaughtered, and, within 1 h postmortem, samples of backfat were re-moved from each carcass between the 4th and 8th tho-racic vertebra and separated into the inner, middle, and outer layers for fatty acid composition analysis. During the first 17.4 kg of BW gain, percentages of all SFA increased by more than 4% in subcutaneous fat of pigs fed the Ctrl and BT diets, but decreased by 4.4 and 7.7% in pigs fed the PF and SBO diets, respectively (fat source × slaughter weight, P < 0.001). Proportions of all MUFA in subcutaneous fat from BT-fed pigs in-creased by 6.1% during the first 17.4 kg of BW gain, but MUFA percentages in SBO-fed pigs decreased by 9.1% between 28.1 and 45.5 kg (fat source × slaughter weight, P < 0.001). Conversely, percentages of all PUFA
from SBO-fed pigs increased by 39.9%, whereas PUFA concentrations in BT-fed pigs decreased by 12.6% as slaughter weight increased from 28.1 to 45.5 kg (fat source × slaughter weight, P < 0.001). Resultant io-dine values (IV) of subcutaneous fat from SBO-fed pigs increased (P < 0.05) from 73.5 to 85.2 within the first 17.4 kg of BW gain, and remained elevated above those of their contemporaries fed the Ctrl, BT, or PF diets at each subsequent slaughter weight (fat source × slaugh-ter weight, P < 0.001). The inner backfat layer had the greatest (P < 0.05) proportions of all SFA and the least (P < 0.05) proportions of all PUFA, whereas the outer layer had the least (P < 0.05) percentages of all SFA but the greatest (P < 0.05) percentages of all MUFA. Even though the middle and outer subcutaneous fat layers had similar (P > 0.05) PUFA percentages, the greatest (P < 0.05) and least (P < 0.05) IV were in the outer and middle layers, respectively. As expected, the fat source included in swine diets was responsible for the fatty acid compositional changes in subcutaneous fat, yet the results of this study indicate that feeding 5% SBO dramatically increased the polyunsaturation of subcutaneous fat within the first 17.4 kg of BW gain, with backfat IV exceeding 80 thereafter.
Key words: dietary fat source, fatty acid composition, pig, slaughter weight, subcutaneous fat
©2009 American Society of Animal Science. All rights reserved. J. Anim. Sci. 2009. 87:1423–1440 doi:10.2527/jas.2008-1454
INTRODUCTION
It is generally accepted that the fatty acid composi-tion of pork subcutaneous fat is largely a reflection of the fatty acid composition of swine diets; however, only a small number of studies have used biopsy or serial slaughter to measure changes in fatty acid composition during the grower and finisher phases (Irie and Sakim-oto, 1992; Fontanillas et al., 1998; Pascual et al., 2006). Evidence suggests that 50 to 60% of the change in fatty acid composition of porcine adipose tissue associated with manipulating dietary fat concentration, fat source, or both occurs during the first 14 to 35 d on the par-
Interactive effects of dietary fat source and slaughter weight in growing-finishing swine: II. Fatty acid composition
of subcutaneous fat1
J. K. Apple,*2 C. V. Maxwell,* D. L. Galloway,* C. R. Hamilton,† and J. W. S. Yancey*
*Department of Animal Science, University of Arkansas, Fayetteville, 72701; and †Darling International Inc., Irving, TX 75038
1 The authors express their appreciation to Darling International (Irving, TX) for financial support of this experiment and for the donation of beef tallow, and to Tyson Foods Inc. (Springdale, AR) for the donation of poultry fat. Additionally, the authors gratefully acknowledge the assistance of A. Hays (University of Arkansas) for animal care and performance data collection; J. Stephenson, I. Mel-lin, and G. Singleton (University of Arkansas) for assistance with pig slaughter; and L. K. Rakes, W. A. Wallis-Phelps, D. Elkins, and E. Turrentine (University of Arkansas) for assistance with backfat layer separation and fatty acid analysis.
2 Corresponding author: [email protected] September 3, 2008.Accepted November 17, 2008.
1423
at Serials/Acq. Dept., Library on May 1, 2009. jas.fass.orgDownloaded from

ticular diet, and diminishes with a longer time on feed (Koch et al., 1968; Wood et al., 1994; Wiseman and Agunbiade, 1998). Irie and Sakimoto (1992) observed dramatic increases in PUFA concentrations in porcine subcutaneous fat biopsies after only 14 d of consuming a diet formulated with sardine oil, whereas Warnants et al. (1999) noted that more than 60% of the change in MUFA and PUFA concentrations in pork backfat occurred within 28 d of replacing full-fat soybeans with beef tallow. It is plausible that the rate at which fatty acid composition of pork adipose changes may be re-lated to the saturation of the dietary fat source, the dietary inclusion amount of a particular fat source, or both.
The subcutaneous fat of pigs has 3 individual lay-ers, with the outer layer developing the earliest and consistently having a greater proportion of unsaturated fatty acids than the other 2 layers (Koch et al., 1968; McDonald and Hamilton, 1976; Malmfors et al., 1978). Conversely, depths of the middle (Moody and Zobriski, 1966; Fortin, 1986; Leymaster and Mersmann, 1991) and inner (Newcom et al., 2005) backfat layers increase at a faster rate than the outer layer, and the middle subcutaneous layer has greater lipogenic activity (An-derson et al., 1972b; Camara et al., 1996; Warnants et al., 1999), resulting in greater deposition of SFA (Chris-tie et al., 1972; Villegas et al., 1973; Whittington et al., 1986) and smaller iodine values (IV; Irie and Sakimoto, 1992) than the outer subcutaneous layer. However, pre-vious research has not reported any interactive effect of dietary fat or oil and time on feed on fatty acid compositional changes; therefore, the objective of this experiment was to test the interactive effects, if any, of dietary fat sources incorporated into diets at 5% and slaughter weight on the fatty acid composition of the subcutaneous fat from growing-finishing pigs.
MATERIALS AND METHODS
Before beginning this research trial, animal care and experimental protocols were approved by the Univer-sity of Arkansas Interdepartmental Animal Care and Use Committee.
Animals and Diets
Crossbred barrows and gilts (n = 288) from the mat-ing of EB boars to line 348 dams (Monsanto Choice Genetics, St. Louis, MO), with an average initial BW of 28.1 kg, were blocked by BW into 9 blocks of 32 pigs/block. Pigs within blocks were allotted randomly to pens (8 pigs/pen) and stratified across sex and litter origin. Within each block, pens were randomly assigned to 1 of 4 dietary treatments, including control (Ctrl), corn-soybean meal grower and finisher diets with no added fat, or grower and finisher diets supplemented with 5% of either beef tallow (BT), poultry fat (PF), or soybean oil (SBO). Pigs were fed a 4-phase diet with transition from grower-I to grower-II, grower-II to
finisher-I, and finisher-I to finisher-II when the mean BW of each block was 45.5, 68.1, and 90.9 kg, respec-tively. All diets were formulated to meet or exceed NRC (1998) AA, energy, and other nutrient requirements of growing-finishing swine [refer to Apple et al. (2009) for feedstuff, calculated nutrient, and fatty acid com-positions of the grower and finisher diets]. Addition-ally, the calculated IV product (Madsen et al., 1992) ranged from 33.9 to 38.5, 57.1 to 61.8, 72.5 to 77.1, and 100.0 to 104.7 for the Ctrl, BT, PF, and SBO diets, re-spectively. Pigs were housed in a curtain-sided building with 1.5 × 3 m pens on totally slatted concrete floors. Each pen was equipped with a single-opening feeder and cup waterers, allowing pigs ad libitum access to feed and water.
Pig Slaughter and Carcass Dissection
Immediately after treatment allotment (and before penning), 1 pig from each pen was randomly selected for slaughter at the University of Arkansas Red Meat Research Abattoir for initial carcass composition. Ad-ditionally, 1 pig was chosen at random from each pen when block BW averaged 45.5, 68.1, 90.9, and 113.6 kg. Pigs were electrically stunned and slaughtered accord-ing to industry standards, weighed, and chilled for 48 h at 1°C. Within 1 h postmortem, a 5.0 × 5.0 cm section of backfat was removed from the left sides between the 4th and 8th thoracic vertebra, and subsequently sepa-rated into the inner, middle, and outer fat layers. Each layer was placed in Whirl-Pak bags identified with the identification number and backfat layer of the pig and immediately frozen at −20°C.
Fatty Acid Sample Collection and Analysis
Approximately 5 g of frozen subcutaneous fat from each backfat layer was weighed and placed in 30-mL beakers, and beakers were then placed into vacuum flasks attached to the manifold of a Labconco freeze-dryer (model 4.5, Labconco Corp., Kansas City, MO) with a temperature setting of –50°C and a vacuum of less than 10 mmHg. Dissected backfat layers were freeze-dried for 60 h before duplicate 30-mg freeze-dried samples were subjected to direct transesterification by incubating in 2.0 mL of 0.2 M methanolic potassium hydroxide in 16 × 125-mm screw-capped tubes at 50°C for 30 min with vortex mixing 2 to 3 times/min until tissues were dissolved (Murrieta et al., 2003). Tubes were allowed to cool to room temperature, and 1 mL of saturated sodium chloride was added to each tube. A 1-mL quantity of a hexane solution containing an inter-nal standard [glyceryl tridecanoic acid (13:0)] was then added to each tube, and the hexane was evaporated be-fore tubes were vortexed and subsequently centrifuged for 5 min at 1,100 × g and 20°C to separate phases.
A portion of the hexane layer containing the fatty acid methyl esters was transferred to GLC vials that contained a 1.0-mm bed of anhydrous sodium sulfate.
Apple et al.1424
at Serials/Acq. Dept., Library on May 1, 2009. jas.fass.orgDownloaded from

Separation of fatty acid methyl esters was achieved by GLC (Model HP 5890 Series II GC, with an HP-7673 automatic injector and HP-3365 software; Hewlett-Packard, Avondale, PA) equipped with a 100-m cap-illary column (0.25-mm i.d.; Model 2560 fused-silica capillary column; Supelco Inc., Bellefonte, PA) and helium as the carrier gas at 0.5 mL/min (1:50 split ra-tio). Oven temperature was maintained at 175°C for 35 min, increased at 5°C/min to 215°C, and then increased at 10°C/min to 235°C, whereas injector and detector temperatures were maintained at 250°C. Identification of peaks was accomplished by using purified standards obtained from Nu-Chek Prep (Elysian, MN), Matreya (Pleasant Gap, PA), and Supelco.
The total proportion of SFA included palmitic (16:0) and stearic (18:0) acids, as well as the minor SFA [ca-pric (10:0), lauric (12:0), myristic (14:0), pentadecano-ic (15:0), margaric (17:0) and arachidic (20:0) acids], whereas the total proportion of MUFA was calculat-ed by summing the weight percentages of palmitoleic acid (16:1c, where c = cis), oleic acid (18:1c9) and cis-vaccenic acid (18:1c11), as well as the minor MUFA [myristoleic (14:1), palmitelaidic (16:1t, where t = trans), 10-trans-heptadecenoic (17:1t), all 18:1t fatty acids, and gadoleic (20:1c11) acids]. Additionally, the total percentage of PUFA included linoleic acid (18:2n-6) and α-linolenic acid (18:3n-3), along with the minor PUFA [CLA (18:2c9t11), γ-linolenic (18:3n-6), eicosadi-enoic (20:2), dihomo-γ-linolenic (20:3n-6), eicosatrieno-ic (20:3n-3), arachidonic (20:4n-6), docosapentaenoic (22:5n-3), and docosahexaenoic (22:6n-3) acids]. Iodine values were calculated according to the AOCS (1998) equation (0.95 × [∑ 16:1]) + (0.86 × [∑ 18:1]) + (1.732 × [∑ 18:2]) + (2.616 × [∑ 18:3]) + (0.785 × [20:1c11]), where the brackets in the equation indicate the concen-tration of the specific fatty acid.
Statistical Analyses
Data were analyzed as a randomized complete block design, with pen as the experimental unit and blocks based on initial pig BW. Analysis of variance was gen-erated by using the mixed-model procedure (SAS Inst. Inc., Cary, NC). Fatty acid composition data were an-alyzed as repeated measures, with the initial models including backfat layer, dietary fat source, slaughter weight (repeated measure), and all 2- and 3-way in-teractions as fixed effects, and block included in the model as a random effect. However, because there were no (P ≥ 0.96) 3-way interactions, fatty acid data were reanalyzed within backfat layers as repeated measures, with fat source, slaughter weight, and the fat source × slaughter weight interaction as the fixed effects in-cluded in the statistical model. Least squares means were computed for all 2-way interactive effects and were separated statistically by using the PDIFF option (SAS Inst. Inc.) when a significant (P ≤ 0.05) F-test was detected.
RESULTS
SFA
During the first 17.4 kg of BW gain, percentages of all SFA increased in backfat from pigs fed the Ctrl and BT diets but decreased in backfat from pigs fed the PF and SBO diets (fat source × slaughter weight, P < 0.001; Figure 1). Even though total SFA percentages increased as slaughter weight increased from 45.5 to 113.6 kg, subcutaneous fat from SBO-fed pigs had the least (P < 0.05) proportions of all SFA when slaugh-tered at 45.5, 90.9 and 113.6 kg, whereas subcutaneous fat from pigs fed the Ctrl diets had the greatest (P < 0.05) proportions of SFA at slaughter weights of 68.1 and 113.6 kg. Interestingly, backfat from BT-fed pigs had greater (P < 0.05) percentages of SFA than that from PF- and SBO-fed pigs when slaughtered at 45.5, 68.1, 90.9, and 113.6 kg.
Even though the proportions of palmitic acid (16:0) did not (P > 0.05) differ between 28.1 and 45.5 kg in subcutaneous fat from pigs fed the Ctrl, BT and PF diets, the proportion of 16:0 decreased (P < 0.05) by 1.7 percentage units in SBO-fed pigs during the first 17.4 kg of BW gain (fat source × slaughter weight, P < 0.001; Figure 2A). When slaughtered at BW between 45.5 and 113.6 kg, subcutaneous fat from Ctrl-fed pigs had the greatest (P < 0.05) and subcutaneous fat from SBO-fed pigs had the least (P < 0.05), percentages of 16:0, whereas 16:0 concentrations in backfat were simi-lar (P > 0.05) between pigs fed the BT and PF diets and slaughtered at 45.5, 90.9, and 113.6 kg.
Approximately 68.8, 77.4, 32.4, and 95.5% of the to-tal increase (P < 0.05) in stearic acid (18:0) in pigs fed the Ctrl, BT, PF, and SBO diets occurred between 28.1 and 68.1 kg, respectively, whereas percentages of 18:0 were greater (P < 0.05) in subcutaneous fat from pigs fed the Ctrl and BT diets than in PF- and SBO-fed pigs slaughtered at 45.5, 68.1, and 90.9 kg (fat source × slaughter weight, P < 0.001; Figure 2B). Additionally, when pigs were slaughtered at 113.6 kg, the proportion of 18:0 was greatest (P < 0.05) in Ctrl-fed pigs and least (P < 0.05) in SBO-fed pigs, with subcutaneous fat from BT- and PF-fed pigs having similar (P > 0.05) percentages of 18:0.
SFA Differences Among Backfat Layers
In general, the inner backfat layer had the greatest (P < 0.05) proportions of all SFA as well as 16:0 and 18:0, whereas the outer backfat layer had the least (P < 0.05) percentages of 16:0, 18:0, and all SFA (Table 1). Additionally, interactive effects (P ≤ 0.051) of fat source and slaughter weight on percentages of all SFA, 16:0, and 18:0 were observed in the inner (P ≤ 0.051), middle (P ≤ 0.028), and outer (P ≤ 0.015) backfat lay-ers (Table 2).
Between 28.1 and 45.5 kg, total SFA and 18:0 in-creased (P < 0.05) in the inner backfat layer of Ctrl-fed
Fat × slaughter weight on subcutaneous fat composition 1425
at Serials/Acq. Dept., Library on May 1, 2009. jas.fass.orgDownloaded from

pigs, but only 18:0 was increased (P < 0.05) in the inner layer of BT-fed pigs during the first 17.4 kg of BW gain (Table 2). However, approximately 29.1 to 79.8% of the increase (P < 0.05) in all SFA as well as 41.8 to 89.1% of the increase (P < 0.05) in 18:0 occurred between 28.1 and 68.1 kg in pigs fed diets formulated without fat (Ctrl) or with BT and PF. Furthermore, in com-parison with the other dietary treatments, Ctrl-fed pigs had the greatest (P < 0.05) proportions of 16:0 when slaughtered at 45.5, 68.1, 90.9, and 113.6 kg, whereas concentrations of all SFA and 18:0 were greatest (P < 0.05) in pigs fed the Ctrl diets when slaughtered at 68.1 and 113.6 kg. Percentages of 18:0 and all SFA in BT-fed pigs were greater (P < 0.05) than in PF- and SBO-fed pigs between 45.5 and 113.6 kg, but percentages of 16:0 in pigs fed the BT diets did not (P > 0.05) differ from those fed the PF diets, regardless of slaughter weight, or from SBO-fed pigs slaughtered at 68.1 and 113.6 kg. When compared with the other dietary treatments, proportions of all SFA in the inner backfat layer were least (P < 0.05) in SBO-fed pigs slaughtered at 90.9 and 113.6 kg, but the least (P < 0.05) percentages of 16:0 and 18:0 were observed when SBO-fed pigs were slaughtered at 90.9 kg.
Within the middle backfat layer, percentages of all SFA and 16:0 in SBO-fed pigs decreased (P < 0.05) by approximately 7.6 and 8.6%, respectively, whereas percentages of 18:0 increased (P < 0.05) by approxi-mately 13.6 and 12.8% in the middle layer of Ctrl- and BT-fed pigs, respectively, as slaughter weight increased
from 28.1 to 45.5 kg (Table 2). When compared with the other dietary treatments, pigs fed the Ctrl diets had greater (P < 0.05) proportions of all SFA at 68.1 and 113.6 kg, 16:0 at 68.1 and 90.9 kg, and 18:0 at only 113.6 kg. Even though concentrations of 16:0 did not (P > 0.05) differ between BT- and PF-fed pigs, regard-less of slaughter weight, the middle layer from pigs fed the BT diets had greater (P < 0.05) proportions of all SFA and 18:0 than the middle layer from pigs fed the PF or SBO diets when slaughtered at 68.1 and 90.9 kg. Furthermore, when pigs were slaughtered at 113.6 kg, percentages of all SFA, 16:0, and 18:0 in SBO-fed pigs were 9.1 to 16:9%, 7.4 to 12.6%, and 13.2 to 24.8% less (P < 0.05) than Ctrl-, BT-, or PF-fed pigs, respec-tively.
Approximately 60.0, 75.1, and 50.8% of the increases (P < 0.05) in the proportions of all SFA, 16:0, and 18:0 in the outer backfat layer of Ctrl-fed pigs, respectively, occurred between 28.1 and 68.1 kg (Table 2). Converse-ly, percentages of all SFA and 16:0 in SBO-fed pigs were reduced (P < 0.05) by 10.1 and 9.8%, respectively, dur-ing the first 17.4 kg of BW gain, whereas percentages of all SFA and 16:0 were 5.8 and 5.2% less (P < 0.05) in PF-fed pigs between 28.1 and 45.5 kg, respectively. Pigs fed the Ctrl diets had greater (P < 0.05) propor-tions of 16:0 than pigs from all other dietary treatments when slaughtered at 68.1, 90.9, and 113.6 kg, but pro-portions of all SFA and 18:0 were greater (P < 0.05) in Ctrl- and BT-fed pigs than in PF- and SBO-fed pigs when slaughtered at 68.1 and 90.9 kg. Additionally,
Figure 1. Interactive effect of dietary fat source (Ctrl = control diets with no added fat; BT = 5% beef tallow; PF = 5% poultry fat; and SBO = 5% soybean oil) and slaughter weight (P < 0.001) on percentages of all SFA in subcutaneous fat. a–kLeast squares means lacking common letters differ, P < 0.05.
Apple et al.1426
at Serials/Acq. Dept., Library on May 1, 2009. jas.fass.orgDownloaded from

PF-fed pigs had greater (P < 0.05) percentages of all SFA at 45.5, 90.9, and 113.6 kg, and greater (P < 0.05) percentages of 16:0 at each slaughter weight between 45.5 and 113.6 kg; however, the percentage of 18:0 was greater (P < 0.05) only in the outer backfat layer of pigs fed the PF diets compared with pigs fed the SBO diets when slaughtered at 113.6 kg.
MUFA
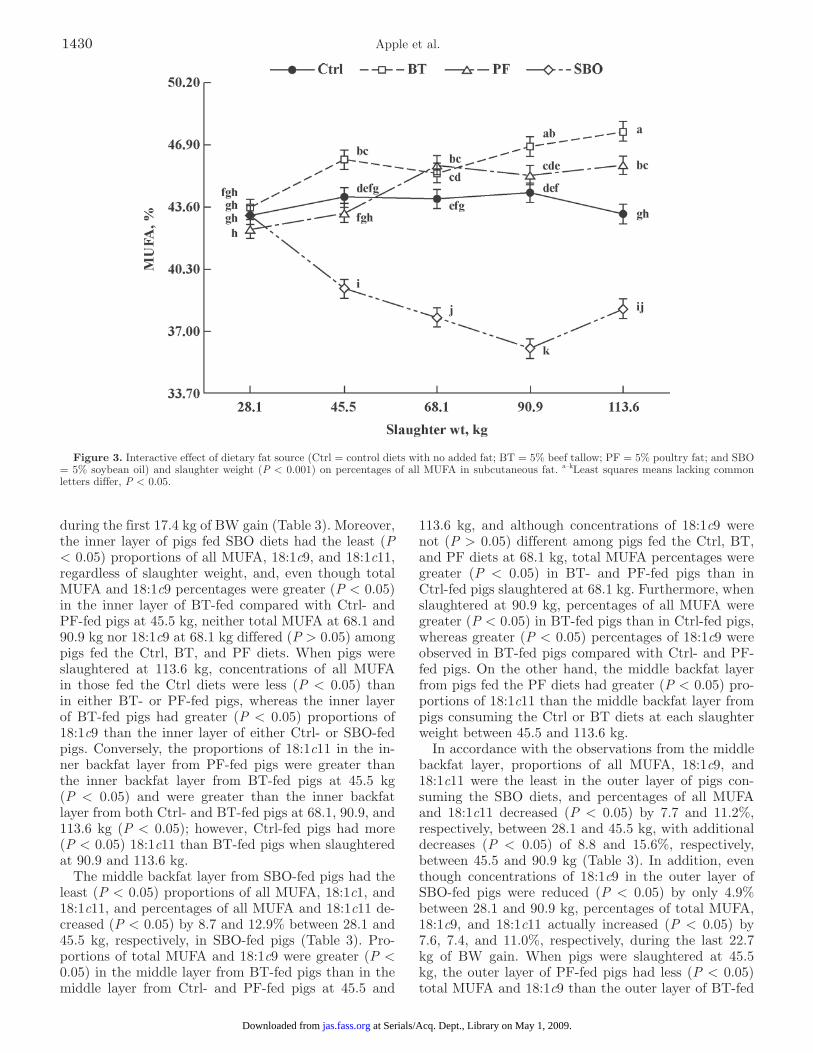
The proportions of all MUFA in subcutaneous fat from BT-fed pigs increased (P < 0.05) by 6.1% during the first 17.4 kg of BW gain, with an additional 3.0% increase between 68.1 and 90.9 kg, yet MUFA percent-ages in SBO-fed pigs decreased (P < 0.05) by 9.1% be-
Figure 2. Interactive effect of dietary fat source (Ctrl = control diets with no added fat; BT = 5% beef tallow; PF = 5% poultry fat; and SBO = 5% soybean oil) and slaughter weight (P < 0.001) on percentages of A) palmitic (16:0) and B) stearic (18:0) acids in subcutaneous fat. a–iLeast squares means lacking common letters differ, P < 0.05.
Fat × slaughter weight on subcutaneous fat composition 1427
at Serials/Acq. Dept., Library on May 1, 2009. jas.fass.orgDownloaded from

tween 28.1 and 45.5 kg, by 3.8% between 45.5 and 68.1 kg, and by 4.4% between 68.1 and 90.9 kg (fat source × slaughter weight, P < 0.001; Figure 3). As expect-ed, subcutaneous fat from pigs fed BT diets therefore had the greatest (P < 0.05) percentages of all MUFA when slaughtered at 45.5, 90.9, and 113.6 kg, whereas subcutaneous fat from pigs fed the SBO diets had the least (P < 0.05) MUFA percentages at every slaughter weight between 45.5 and 113.6 kg. Moreover, percent-ages of all MUFA were greater (P < 0.05) in PF- than Ctrl-fed pigs when slaughtered at 68.1 and 113.6 kg.
Almost 65.3, 61.2, and 41.6% of the increase (P < 0.05) in oleic acid (18:1c9) occurred during the first 17.4 kg of BW gain in subcutaneous fat from pigs fed the Ctrl, BT, and PF diets, respectively, whereas 91.2 and 87.8% of the increase (P < 0.05) in 18:1c9 was observed between 28.1 and 68.1 kg in subcutaneous fat from pigs fed the BT and PF diets, respectively (fat source × slaughter weight, P < 0.001; Figure 4A). Moreover, subcutaneous fat from BT-fed pigs had greater (P < 0.05) proportions of 18:1c9 than subcutaneous fat from Ctrl- and PF-fed pigs slaughtered at 45.5, 90.9, and 113.6 kg, and although subcutaneous fat from PF-fed pigs had greater (P < 0.05) proportions of 18:1c9 than Ctrl-fed pigs at 45.5 kg, concentrations of 18:1c9 did not (P > 0.05) differ between PF- and Ctrl-fed pigs when slaughtered at heavier BW. Interestingly, when compared with the other dietary treatments, percent-ages of 18:1c9 were least (P < 0.05) in SBO-fed pigs at 45.5, 68.1, 90.9, and 113.6 kg.
The proportions of cis-vaccenic acid (18:1c11) de-creased (P < 0.05) by 9.8 and 13.8% between 28.1 and 45.5 kg in BT- and SBO-fed pigs, respectively, whereas between 28.1 and 68.1 kg, percentages of 18:1c11 de-
creased (P < 0.05) in Ctrl-fed pigs but increased (P < 0.05) by 16.0% in PF-fed pigs (fat source × slaughter weight, P < 0.001; Figure 2B). When slaughtered at 45.5 kg, subcutaneous fat from PF- and Ctrl-fed pigs had greater (P < 0.05) proportions of 18:1c11 than subcutaneous fat from BT-fed pigs; however, subcuta-neous fat from pigs fed PF had the greatest (P < 0.05) proportions of 18:1c11 at 68.1, 90.9, and 113.6 kg, and subcutaneous fat from pigs fed SBO had the least (P < 0.05) proportions of 18:1c11 from 45.5 to 113.6 kg. In addition, even though 18:1c11 concentrations were similar (P > 0.05) in subcutaneous fat from Ctrl- and BT-fed pigs slaughtered at 68.1 kg, Ctrl-fed pigs had greater (P < 0.05) proportions of 18:1c11 than BT-fed pigs slaughtered at 90.9, but had smaller (P < 0.05) proportions when slaughtered at 113.6 kg.
MUFA Differences Among Backfat Layers
Percentages of all MUFA, 18:1c9, and 18:1c11 were greatest (P < 0.05) in the outer backfat layer, whereas the inner layer had greater (P < 0.05) proportions of all MUFA, 18:1c9, and 18:1c11 than the middle lay-er (Table 1). Moreover, dietary fat source × slaugh-ter weight interactions (P < 0.001) were noted for the MUFA within the inner, middle, and outer backfat lay-ers (Table 3).
Between 28.1 and 45.5 kg, more than 96 and 73% of the total increases (P < 0.05) in all MUFA and 18:1c9, respectively, as well as 54.8% of the total decrease (P < 0.05) in 18:1c11, were observed in the inner backfat layer of BT-fed pigs, yet 76.1 and 60.8% of the total decreases (P < 0.05) in concentrations of all MUFA and 18:1c11 in the inner layer of SBO-fed pigs also occurred
Table 1. Comparison of fatty acid composition (reported as weight percentages) among the individual backfat layers
Fatty acid, %
Backfat layer
SEMInner Middle Outer
All SFA1 34.29x 33.49y 30.60z 0.213 Palmitic acid (16:0) 21.19x 20.81y 20.12z 0.155 Stearic acid (18:0) 11.14x 10.71y 8.46z 0.109All MUFA2 43.06y 42.35z 44.41x 0.240 Oleic acid (18:1c9) 36.33y 35.68z 36.86x 0.176 Cis-vaccenic acid (18:1c11) 2.44y 2.34z 2.64x 0.024All PUFA3 20.35y 21.77x 22.33x 0.333 Linoleic acid (18:2n-6) 17.86y 19.17x 19.54x 0.287 Linolenic acid (18:3n-3) 1.02y 1.09xy 1.14x 0.037Iodine value4 71.2z 73.1y 75.8x 0.45
x–zWithin a row, least squares means lacking common superscript letters differ, P < 0.05.1Includes the weight percentages of capric (10:0), lauric (12:0), myristic (14:0), pentadecanoic (15:0), marga-
ric (17:0), and arachidic (20:0) acids, as well as 16:0 and 18:0.2Includes the weight percentages of myristoleic (14:1), palmitoleic (16:1c), palmitelaidic (16:1t), heptade-
cenoic (17:1t), all 18:1t fatty acids, and gadoleic (20:1c11) acids, as well as 18:1c9 and 18:1c11 (where c = cis and t = trans).
3Includes the weight percentages of CLA (18:2c9t11), γ-linolenic (18:3n-6), eicosadienoic (20:2), eicosa-trienoic (20:3n-3), dihomo-γ-linolenic (20:3n-6), arachidonic (20:4n-6), docosapentaenoic (22:5n-3), and doco-sahexaenoic (22:6n-3) acids, as well as 18:2n-6 and 18:3n-3.
4Iodine value = (0.95 × [∑ 16:1]) + (0.86 × [∑ 18:1]) + (1.732 × [∑ 18:2]) + (2.616 × [∑ 18:3]) + (0.785 × [20:1c11]), where brackets indicate concentrations of fatty acids (AOCS, 1998).
Apple et al.1428
at Serials/Acq. Dept., Library on May 1, 2009. jas.fass.orgDownloaded from

Tab
le 2
. In
tera
ctiv
e ef
fect
s of
die
tary
fat
sou
rce1
and
slau
ghte
r w
eigh
t on
the
SFA
com
posi
tion
(re
port
ed a
s w
eigh
t pe
rcen
tage
s) o
f th
e in
divi
dual
bac
kfat
la
yers
Slau
ghte
r w
t, k
g
Inne
r ba
ckfa
t la
yer
Mid
dle
back
fat
laye
rO
uter
bac
kfat
lay
er
Ctr
lB
TP
FSB
OC
trl
BT
PF
SBO
Ctr
lB
TP
FSB
O
All
SFA
P =
0.0
02 a
nd S
EM
= 0
.662
2P
= 0
.003
and
SE
M =
0.7
532
P =
0.0
01 a
nd S
EM
= 0
.594
2
28.
132
.27hi
j31
.58ij
31.8
5ij31
.15jk
31.7
0ef31
.19f
31.9
1ef30
.85f
30.0
5efgh
29.6
2efgh
i30
.28de
fg29
.57ef
ghi
45.
534
.16ef
g33
.00gh
i30
.83jk
29.4
9k33
.60de
32.6
0ef30
.55f
28.4
9g30
.35de
fg30
.91cd
e28
.53hi
26.5
7j
68.
138
.47ab
36.0
1cd33
.00gh
i32
.57gh
ij37
.55ab
35.4
5cd32
.29ef
31.3
9f32
.50bc
31.8
2bcd
29.3
2efgh
i28
.03ij
90.
938
.67ab
37.8
0b34
.88de
f32
.54gh
ij37
.90ab
36.4
2bc33
.48de
31.6
5ef34
.14a
33.1
5ab30
.71de
f28
.76gh
i
113
.640
.04a
37.7
2bc35
.80de
33.9
6fgh
38.7
3a36
.48bc
35.4
0cd32
.18ef
34.1
3a32
.52ab
31.7
4bcd
29.2
6fghi
16:0
3P
= 0
.051
and
SE
M =
0.3
622
P =
0.0
28 a
nd S
EM
= 0
.405
2P
= 0
.015
and
SE
M =
0.3
392
28.
120
.82ef
g20
.34gh
i20
.57fg
hi20
.05gh
i20
.50ef
gh20
.14fg
h20
.60de
fgh
19.8
5gh20
.27de
f19
.82ef
gh20
.35de
f19
.74fg
h
45.
521
.57cd
e20
.51gh
i19
.85hi
18.5
3j21
.25cd
ef20
.31ef
gh19
.57h
18.1
4i20
.33de
f20
.00de
fg19
.29gh
17.8
1j
68.
123
.26ab
21.6
0cde
20.7
9efgh
i19
.71i
22.8
4ab21
.33cd
e20
.35ef
gh19
.11hi
21.3
8abc
20.4
1def
19.8
1efgh
18.3
3ij
90.
923
.55a
22.2
8bc21
.55cd
ef20
.30gh
i23
.21a
21.7
3c20
.95cd
efg
19.6
1h22
.12a
20.8
5bcd
20.2
9def
18.9
1hi
113
.623
.58a
22.3
4bc21
.81cd
20.8
7defg
23.0
0ab21
.92bc
21.7
1cd20
.11gh
21.7
5ab20
.71cd
e20
.75cd
19.4
9fgh
18:0
4P
< 0
.001
and
SE
M =
0.3
572
P =
0.0
05 a
nd S
EM
= 0
.394
2P
= 0
.002
and
SE
M =
0.3
032
28.
19.
25h
9.02
h9.
09h
8.82
h8.
99gh
8.84
h9.
08gh
8.72
h7.
54gh
7.55
gh7.
65gh
7.51
gh
45.
510
.44g
10.2
2g9.
14h
9.23
h10
.21ef
9.97
efg
9.17
fg8.
61i
7.82
fg8.
55de
f7.
35gh
6.97
h
68.
113
.23bc
12.2
0d10
.45g
11.1
8efg
12.6
8bc11
.87cd
10.2
4e10
.59e
9.05
cd9.
15cd
7.69
gh7.
96ef
g
90.
913
.18bc
13.2
7bc11
.62de
10.5
7fg12
.72b
12.3
7bc10
.84de
10.4
1e9.
96ab
9.96
ab8.
67de
8.15
efg
113
.614
.70a
13.3
3b12
.34cd
11.4
7def
13.9
1a12
.46bc
12.0
5bc10
.46e
10.5
1a9.
70ab
c9.
31bc
d8.
08ef
g
a–k W
ithi
n a
spec
ific
fatt
y ac
id a
nd b
ackf
at lay
er, le
ast
squa
res
mea
ns lac
king
com
mon
sup
ersc
ript
let
ters
diff
er, P
< 0
.05.
1 Ctr
l =
con
trol
die
ts w
ith
no a
dded
fat
; B
T =
5%
bee
f ta
llow
; P
F =
5%
pou
ltry
fat
; an
d SB
O =
5%
soy
bean
oil.
2 The
pro
babi
lity
valu
e an
d SE
M for
the
spe
cific
die
tary
fat
sou
rce
× s
laug
hter
wei
ght
inte
ract
ion.
3 Pal
mitic
aci
d.4 S
tear
ic a
cid.
Fat × slaughter weight on subcutaneous fat composition 1429
at Serials/Acq. Dept., Library on May 1, 2009. jas.fass.orgDownloaded from
during the first 17.4 kg of BW gain (Table 3). Moreover, the inner layer of pigs fed SBO diets had the least (P < 0.05) proportions of all MUFA, 18:1c9, and 18:1c11, regardless of slaughter weight, and, even though total MUFA and 18:1c9 percentages were greater (P < 0.05) in the inner layer of BT-fed compared with Ctrl- and PF-fed pigs at 45.5 kg, neither total MUFA at 68.1 and 90.9 kg nor 18:1c9 at 68.1 kg differed (P > 0.05) among pigs fed the Ctrl, BT, and PF diets. When pigs were slaughtered at 113.6 kg, concentrations of all MUFA in those fed the Ctrl diets were less (P < 0.05) than in either BT- or PF-fed pigs, whereas the inner layer of BT-fed pigs had greater (P < 0.05) proportions of 18:1c9 than the inner layer of either Ctrl- or SBO-fed pigs. Conversely, the proportions of 18:1c11 in the in-ner backfat layer from PF-fed pigs were greater than the inner backfat layer from BT-fed pigs at 45.5 kg (P < 0.05) and were greater than the inner backfat layer from both Ctrl- and BT-fed pigs at 68.1, 90.9, and 113.6 kg (P < 0.05); however, Ctrl-fed pigs had more (P < 0.05) 18:1c11 than BT-fed pigs when slaughtered at 90.9 and 113.6 kg.
The middle backfat layer from SBO-fed pigs had the least (P < 0.05) proportions of all MUFA, 18:1c1, and 18:1c11, and percentages of all MUFA and 18:1c11 de-creased (P < 0.05) by 8.7 and 12.9% between 28.1 and 45.5 kg, respectively, in SBO-fed pigs (Table 3). Pro-portions of total MUFA and 18:1c9 were greater (P < 0.05) in the middle layer from BT-fed pigs than in the middle layer from Ctrl- and PF-fed pigs at 45.5 and
113.6 kg, and although concentrations of 18:1c9 were not (P > 0.05) different among pigs fed the Ctrl, BT, and PF diets at 68.1 kg, total MUFA percentages were greater (P < 0.05) in BT- and PF-fed pigs than in Ctrl-fed pigs slaughtered at 68.1 kg. Furthermore, when slaughtered at 90.9 kg, percentages of all MUFA were greater (P < 0.05) in BT-fed pigs than in Ctrl-fed pigs, whereas greater (P < 0.05) percentages of 18:1c9 were observed in BT-fed pigs compared with Ctrl- and PF-fed pigs. On the other hand, the middle backfat layer from pigs fed the PF diets had greater (P < 0.05) pro-portions of 18:1c11 than the middle backfat layer from pigs consuming the Ctrl or BT diets at each slaughter weight between 45.5 and 113.6 kg.
In accordance with the observations from the middle backfat layer, proportions of all MUFA, 18:1c9, and 18:1c11 were the least in the outer layer of pigs con-suming the SBO diets, and percentages of all MUFA and 18:1c11 decreased (P < 0.05) by 7.7 and 11.2%, respectively, between 28.1 and 45.5 kg, with additional decreases (P < 0.05) of 8.8 and 15.6%, respectively, between 45.5 and 90.9 kg (Table 3). In addition, even though concentrations of 18:1c9 in the outer layer of SBO-fed pigs were reduced (P < 0.05) by only 4.9% between 28.1 and 90.9 kg, percentages of total MUFA, 18:1c9, and 18:1c11 actually increased (P < 0.05) by 7.6, 7.4, and 11.0%, respectively, during the last 22.7 kg of BW gain. When pigs were slaughtered at 45.5 kg, the outer layer of PF-fed pigs had less (P < 0.05) total MUFA and 18:1c9 than the outer layer of BT-fed
Figure 3. Interactive effect of dietary fat source (Ctrl = control diets with no added fat; BT = 5% beef tallow; PF = 5% poultry fat; and SBO = 5% soybean oil) and slaughter weight (P < 0.001) on percentages of all MUFA in subcutaneous fat. a–kLeast squares means lacking common letters differ, P < 0.05.
Apple et al.1430
at Serials/Acq. Dept., Library on May 1, 2009. jas.fass.orgDownloaded from

pigs, whereas the proportion of 18:1c11 in the outer layer of BT-fed pigs was considerably less (P < 0.05) than in either Ctrl- or PF-fed pigs. Moreover, percent-ages of all MUFA and 18:1c9 did not (P > 0.05) differ among pigs consuming the Ctrl, BT, and PF diets at 68.1 kg, but proportions of all MUFA were less (P < 0.05) in Ctrl-fed pigs than in BT-fed pigs slaughtered at 90.9 kg and were less than in BT- and PF-fed pigs
at 113.6 kg. Concentrations of 18:1c9 were greater (P < 0.05) in the outer layer of pigs consuming the BT diets than in those consuming the Ctrl and PF diets at 90.9 and 113.6 kg; however, the outer layer of PF-fed pigs had greater (P < 0.05) proportions of 18:1c11 than the outer layer of pigs fed the Ctrl or BT diets at 68.1, 90.9, and 113.6 kg. Pigs fed the Ctrl diets had greater (P < 0.05) percentages of 18:1c11 than did BT-fed pigs
Figure 4. Interactive effect of dietary fat source (Ctrl = control diets with no added fat; BT = 5% beef tallow; PF = 5% poultry fat; and SBO = 5% soybean oil) and slaughter weight (P < 0.001) on percentages of A) oleic (18:1c9) and B) cis-vaccenic (18:1c11) acids in subcutaneous fat. a–iLeast squares means lacking common letters differ, P < 0.05.
Fat × slaughter weight on subcutaneous fat composition 1431
at Serials/Acq. Dept., Library on May 1, 2009. jas.fass.orgDownloaded from

Tab
le 3
. Int
erac
tive
effec
ts o
f die
tary
fat
sour
ce1 an
d sl
augh
ter
wei
ght
on t
he M
UFA
com
posi
tion
(re
port
ed a
s w
eigh
t pe
rcen
tage
s) o
f the
indi
vidu
al b
ackf
at
laye
rs
Slau
ghte
r w
t, k
g
Inne
r ba
ckfa
t la
yer
Mid
dle
back
fat
laye
rO
uter
bac
kfat
lay
er
Ctr
lB
TP
FSB
OC
trl
BT
PF
SBO
Ctr
lB
TP
FSB
O
All
MU
FAP
< 0
.001
and
SE
M =
0.7
512
P <
0.0
01 a
nd S
EM
= 0
.705
2P
< 0
.001
and
SE
M =
0.7
112
28.
142
.88de
43.4
2bcde
42.3
2e43
.15de
42.6
7de42
.97cd
e41
.87e
42.6
8de44
.00gh
i44
.16gh
i43
.13i
43.7
2hi
45.
543
.98bc
de46
.24a
43.3
5cde
38.4
3f43
.08cd
e45
.64ab
42.2
2e38
.96f
45.2
6defg
h46
.52bc
de44
.25gh
i40
.35j
68.
144
.04bc
de44
.74ab
cd45
.55ab
37.7
7f42
.37e
44.4
0bcd
44.7
0bc36
.21gh
45.6
7cdef
g47
.11bc
d47
.18bc
d39
.31j
90.
944
.84ab
cd46
.06a
44.7
5abcd
36.9
5f43
.13cd
46.2
2ab44
.68bc
34.5
7h45
.16ef
gh48
.07ab
46.4
6bcde
f36
.78k
113
.643
.24de
46.3
4a45
.32ab
c37
.97f
41.9
1e47
.03a
44.5
2bcd
37.1
0fg44
.58fg
hi49
.41a
47.5
8abc
39.5
7j
18:1
c93
P <
0.0
01 a
nd S
EM
= 0
.607
2P
< 0
.001
and
SE
M =
0.5
722
P <
0.0
01 a
nd S
EM
= 0
.557
2
28.
133
.40f
33.9
5f32
.84f
33.6
4f33
.16ef
g33
.52ef
32.3
7fg33
.18ef
g33
.85hi
34.1
4hi32
.97ij
33.7
2hi
45.
536
.80de
38.5
7bc35
.56e
32.3
4f36
.09cd
37.9
9b34
.63de
32.7
7fg37
.05ef
38.3
1de35
.86fg
33.4
4hij
68.
138
.32bc
d38
.25cd
38.4
0bcd
33.3
8f36
.83bc
37.9
5b37
.50bc
31.8
3gh38
.58d
39.7
5bcd
38.9
2cd33
.82hi
90.
939
.26ab
c39
.88ab
38.0
2cd32
.57f
37.8
0b39
.94a
37.8
6b30
.74h
38.7
9cd40
.95ab
38.8
3cd32
.16j
113
.638
.57bc
40.2
6a38
.83ab
c33
.82f
37.4
2bc40
.83a
38.0
8b33
.06fg
39.0
2cd42
.28a
40.2
1bc34
.54gh
18:1
c114
P <
0.0
01 a
nd S
EM
= 0
.074
2P
< 0
.001
and
SE
M =
0.0
662
P <
0.0
01 a
nd S
EM
= 0
.079
2
28.
12.
67bc
2.68
bc2.
63cd
2.62
cd2.
60cd
2.59
cd2.
58cd
2.55
cd2.
74bc
2.72
bcd
2.69
bcd
2.67
bcd
45.
52.
58cd
2.45
def
2.76
bc2.
17gh
2.43
de2.
32ef
2.61
c2.
22f
2.80
b2.
44e
2.82
b2.
37ef
g
68.
12.
44de
f2.
35ef
g3.
01a
1.92
i2.
25f
2.24
f2.
91a
1.84
gh2.
82b
2.58
cde
3.24
a2.
20gh
90.
92.
46de
2.26
fg2.
86ab
1.97
i2.
27ef
2.22
f2.
84ab
1.71
h2.
69bc
d2.
51de
3.09
a2.
00h
113
.62.
05hi
2.29
efg
2.76
bc1.
88i
1.93
g2.
29ef
2.69
b1.
81gh
2.43
ef2.
66bc
d3.
10a
2.22
fg
a–k W
ithi
n a
spec
ific
fatt
y ac
id a
nd b
ackf
at lay
er, le
ast
squa
res
mea
ns lac
king
com
mon
sup
ersc
ript
let
ters
diff
er, P
< 0
.05.
1 Ctr
l =
con
trol
die
ts w
ith
no a
dded
fat
; B
T =
5%
bee
f ta
llow
; P
F =
5%
pou
ltry
fat
; an
d SB
O =
5%
soy
bean
oil.
2 The
pro
babi
lity
valu
e an
d SE
M for
the
spe
cific
die
tary
fat
sou
rce
× s
laug
hter
wei
ght
inte
ract
ion.
3 Ole
ic a
cid.
4 Cis
-vac
ceni
c ac
id.
Apple et al.1432
at Serials/Acq. Dept., Library on May 1, 2009. jas.fass.orgDownloaded from

slaughtered at 68.1 but had smaller (P < 0.05) percent-ages than BT-fed pigs slaughtered at 113.6 kg.
PUFA
Although percentages of all PUFA in the subcuta-neous fat from SBO-fed pigs increased (P < 0.05) by 39.9% between 28.1 and 45.5 kg and by 5.8% between 68.1 and 90.9 kg, total PUFA percentages in subcuta-neous fat from BT-fed pigs decreased (P < 0.05) by 12.6 and 14.6% as slaughter weight increased from 28.1 to 45.5 kg and 68.1 to 90.9 kg, respectively (fat source × slaughter weight, P < 0.001; Figure 5). More impor-tantly, regardless of slaughter weight, the proportions of all PUFA were greatest (P < 0.05) in pigs fed the SBO diets and were least (P < 0.05) in pigs fed the BT diets. After an initial 10.5% increase (P < 0.05) in PUFA percentages in PF-fed pigs, the proportions of all PUFA decreased (P < 0.05) by 13.7% between 45.5 and 68.1 kg, with an additional 8.6% decrease (P < 0.05) between 90.9 and 113.6 kg, and, even though PUFA concentrations were reduced (P < 0.05) between 45.5 and 68.1 kg only in pigs fed the Ctrl diets, subcutane-ous fat from PF-fed pigs had greater (P < 0.05) total PUFA percentages than subcutaneous fat from Ctrl-fed pigs when slaughtered at 45.5, 68.1, and 90.9 kg.
During the first 17.4 kg of BW gain, percentages of linoleic acid (18:2n-6) increased (P < 0.05) by 38.6% in subcutaneous fat from pigs fed SBO diets, and as slaughter weights increased from 45.5 to 113.6 kg, per-centages of 18:2n-6 in fat from SBO-fed pigs were 22.9
to 54.3% greater (P < 0.05) than in fat from PF-fed pigs, were 44 to 76.8% greater (P < 0.05) than in fat from Ctrl-fed pigs, and were 61.6 to 108.5% greater (P < 0.05) than in fat from BT-fed pigs (fat source × slaughter weight, P < 0.001; Figure 6A). On the other hand, proportions of 18:2n-6 in BT-fed pigs decreased (P < 0.05) by 12.2% between 28.1 and 45.5 kg, with an-other reduction (P < 0.05) of 14.1% between 68.1 and 90.9 kg, and subcutaneous fat from BT-fed pigs pos-sessed the smallest (P < 0.05) proportions of 18:2n-6 when slaughtered at 45.5, 90.9, and 113.6 kg. Moreover, the subcutaneous fat from pigs consuming the PF diets had greater (P < 0.05) concentrations of 18:2n-6 than the subcutaneous fat from pigs fed the Ctrl diets when slaughtered at 45.5, 68.1, and 90.9 kg.
Percentages of linolenic acid (18:3n-3) were elevated (P < 0.05) by 115.2% during the first 17.4 kg of BW gain in subcutaneous fat from SBO-fed pigs, with sub-sequent increases (P < 0.05) of 9.4 and 9.9% when pigs were slaughtered at 68.1 and 90.9 kg, respectively (fat source × slaughter weight, P < 0.001; Figure 6B). More importantly, the subcutaneous fat from SBO-fed pigs had considerably greater (P < 0.05) proportions of 18:3n-3 than the subcutaneous fat from pigs fed the other dietary treatments, and, with the exception that 18:3n-3 concentrations were greater (P < 0.05) in the subcutaneous fat from PF-fed pigs compared with Ctrl- and BT-fed pigs at 45.5 kg, proportions of 18:3n-3 were similar (P > 0.05) among pigs consuming the Ctrl, BT and PF diets when slaughtered at 68.1, 90.9, and 113.6 kg.
Figure 5. Interactive effect of dietary fat source (Ctrl = control diets with no added fat; BT = 5% beef tallow; PF = 5% poultry fat; and SBO = 5% soybean oil) and slaughter weight (P < 0.001) on percentages of all PUFA in subcutaneous fat. a–hLeast squares means lacking common letters differ, P < 0.05.
Fat × slaughter weight on subcutaneous fat composition 1433
at Serials/Acq. Dept., Library on May 1, 2009. jas.fass.orgDownloaded from

PUFA Differences Among Backfat Layers
Even though the middle and outer backfat layers had greater (P < 0.05) percentages of all PUFA and 18:2n-6 than the inner layer, the outer backfat layer had greater (P < 0.05) proportions of 18:3n-3 than the inner layer, with the middle layer possessing intermediate propor-tions of 18:3n-3 (Table 1). In addition, data analysis
indicated interactive effects of dietary fat source and slaughter weight (P < 0.001) on the percentages of all PUFA, 18:2n-6, and 18:3n-3 within the inner, middle, and outer backfat layers (Table 4).
Proportions of all PUFA, especially 18:2n-6 and 18:3n-3, were robustly increased (P < 0.05) in the in-ner backfat layer from SBO-fed pigs between 28.1 and 45.5 kg, and percentages of the PUFA were greater (P
Figure 6. Interactive effect of dietary fat source (Ctrl = control diets with no added fat; BT = 5% beef tallow; PF = 5% poultry fat; and SBO = 5% soybean oil) and slaughter weight (P < 0.001) on percentages of A) linoleic (18:2n-6) and B) linolenic (18:3n-3) acids in subcutaneous fat. a–jLeast squares means lacking common letters differ, P < 0.05.
Apple et al.1434
at Serials/Acq. Dept., Library on May 1, 2009. jas.fass.orgDownloaded from

< 0.05) than in pigs fed all other dietary treatments between 45.5 and 113.6 kg (Table 4). Furthermore, de-spite reductions (P < 0.05) in the percentages of the PUFA in the inner layer from PF-fed pigs between 45.5 and 68.1 kg, proportions of all PUFA, 18:2n-6, and 18:3n-3 were greater (P < 0.05) in PF-fed pigs than in Ctrl- and BT-fed pigs when slaughtered at 45.5 to 113.6 kg. Even though percentages of PUFA did not (P > 0.05) differ between pigs fed the Ctrl and BT diets, 18:2n-6 from the inner fat layer declined (P < 0.05) by 17.5% between 45.5 and 68.1 kg in Ctrl-fed pigs and by more than 18.0 and 16.5% in BT-fed pigs at slaughter weights of 28.1 to 68.1 kg and 68.1 to 90.9 kg, respec-tively. Conversely, percentages of 18:3n-3 in the inner fat layer of Ctrl-fed pigs decreased (P < 0.05) by 37.5 to 43.2% as slaughter weights increased from 28.1 to 68.1 and 90.9 kg, respectively, whereas 18:3n-3 concen-trations in the inner layer of BT-fed pigs were reduced (P < 0.05) by 40.4 and 44.9% as slaughter weights in-creased from 28.1 to 90.9 and 113.6 kg, respectively.
Percentages of all PUFA, 18:2n-6, and 18:3n-3 were increased (P < 0.05) by 39.2, 37.5, and 119.4%, respec-tively, during the first 17.4 kg of BW gain in the middle backfat layer from SBO-fed pigs, and proportions of PUFA were the greatest (P < 0.05) at slaughter weights heavier than 28.1 kg; however, across the last 22.7 kg of BW gain, the 9.1% reduction (P < 0.05) in concentra-tions of all PUFA within the middle layer of SBO-fed pigs was a reflection of the 13.7% decrease (P < 0.05) in 18:3n-3 percentages (Table 4). Similar to the inner fat layer results, percentages of all PUFA and 18:2n-6 were greater (P < 0.05) in the middle fat layer of PF-fed pigs compared with BT-fed pigs between 45.5 and 113.6 kg, but with the exception of pigs slaughtered at 45.5 kg, concentrations of 18:3n-3 in the middle layer did not (P > 0.05) differ among pigs fed the Ctrl, BT, and PF diets. In addition, concentrations of all PUFA and 18:2n-6 in the middle layer of Ctrl-fed pigs declined (P < 0.05) by 16.4 and 14.4%, respectively, as slaugh-ter weight increased from 28.1 to 90.9 kg. Although percentages of 18:3n-3 were similar (P > 0.05) between Ctrl- and BT-fed pigs, the proportion of all PUFA in the middle fat layer from BT-fed pigs was 21.6% less (P < 0.05) than in Ctrl-fed pigs at 113.6 kg, whereas the proportions of 18:2n-6 in BT-fed pigs were 16.8 and 22.5% less (P < 0.05) than in Ctrl-fed pigs slaughtered at 90.9 and 113.6 kg, respectively.
In the outer backfat layer, 75.0, 74.7, and 68.5% of the total increase (P < 0.05) in the proportions of all PUFA, 18:2n-6, and 18:3n-3, respectively, occurred be-tween 28.1 and 45.5 kg in pigs fed the SBO diets, and even though percentages of PUFA in the outer layer of SBO-fed pigs were greater (P < 0.05) than in the other dietary treatments, percentages of total PUFA, 18:2n-6, and 18:3n-3 declined (P < 0.05) by 9.5, 9.3, and 13.4%, respectively, during the last 22.7 kg of BW gain (Table 4). Percentages of all PUFA and, in particular, 18:2n-6 in the outer fat layer of PF-fed pigs were less (P < 0.05)
at 113.6 than at 28.1 kg and were less (P < 0.05) at 68.1, 90.9, and 113.6 than at 45.5 kg, whereas the outer layer from BT-fed pigs had smaller (P < 0.05) percent-ages of total PUFA and 18:2n-6 at 68.1, 90.9, and 113.6 than at 28.1 kg, and again at 90.9 and 113.6 kg when compared with 45.5 kg. Moreover, concentrations of all PUFA and 18:2n-6 in the outer layer of Ctrl-fed pigs did not (P > 0.05) change with increasing slaughter weight, yet proportions of these PUFA were greater (P < 0.05) in PF- and Ctrl-fed pigs than in BT-fed pigs when slaughtered at 90.9 and 113.6 kg. Interestingly, percentages of 18:3n-3 were similar (P > 0.05) in the outer fat layer of pigs consuming the Ctrl, BT, and PF diets, regardless of slaughter weight, in spite of the reductions (P < 0.05) in 18:3n-3 between 28.1 and 90.9 to 113.6 kg in BT-fed pigs and between 45.5 and 90.9 to 113.6 kg in PF-fed pigs.
IV
Across the first 17.4 kg of BW gain, IV in the sub-cutaneous fat from SBO-fed pigs increased (P < 0.05) from a mean IV of 73.5 at 28.1 kg to 85.2 at 45.5 kg, and subcutaneous fat IV of pigs fed SBO remained el-evated (P < 0.05) in comparison with their contempo-raries fed the Ctrl, BT or PF diets at each subsequent slaughter weight (fat source × slaughter weight, P < 0.001; Figure 7). Additionally, IV for the subcutaneous fat from Ctrl- and BT-fed pigs decreased (P < 0.05) between 28.1 and 113.6 kg, whereas after an initial in-crease (P < 0.05) in IV of subcutaneous fat from PF-fed pigs, IV decreased (P < 0.05) as slaughter weight increased from 45.5 to 113.6 kg (Table 5).
The greatest (P < 0.05) IV were noted in the outer backfat layer, whereas the least (P < 0.05) IV were observed in the inner backfat layer (Table 1), and there were fat source × slaughter weight interactions (P < 0.001) on IV in each backfat layer (Table 5). Iodine values increased (P < 0.05) by 15.5, 16.0, and 16.4% in the inner, middle, and outer fat layers of SBO-fed pigs, respectively, between 28.1 and 45.5 kg and remained relatively unchanged thereafter, yet the IV values of SBO-fed pigs were dramatically greater (P < 0.05) than the IV values of pigs fed other dietary treatments, independent of slaughter weight or backfat layer. More-over, after increases (P < 0.05) of 5.0 (inner layer) to 6.8% (middle layer) in IV of PF-fed pigs during the first 17.4 kg of BW gain, IV of the inner, middle, and outer fat layers decreased (P < 0.05) by 11.0, 10.9, and 8.3%, respectively, with increasing slaughter weights between 45.5 and 113.6 kg. In addition, IV remained greater (P < 0.05) in pigs fed PF diets than in those fed BT diets, regardless of slaughter weight, and in pigs fed Ctrl diets between 45.5 and 90.9 kg. Even though IV of the in-ner, middle, and outer layers did not (P > 0.05) differ between Ctrl- and BT-fed pigs, IV were reduced (P < 0.05) in the inner and middle fat layers of Ctrl-fed pigs by 11.1 and 7.8%, respectively, and in the inner, mid-
Fat × slaughter weight on subcutaneous fat composition 1435
at Serials/Acq. Dept., Library on May 1, 2009. jas.fass.orgDownloaded from

Tab
le 4
. In
tera
ctiv
e ef
fect
s of
die
tary
fat
sour
ce1 an
d sl
augh
ter
wei
ght
on t
he P
UFA
com
posi
tion
(re
port
ed a
s w
eigh
t pe
rcen
tage
s) o
f the
indi
vidu
al b
ackf
at
laye
rs
Slau
ghte
r w
t, k
g
Inne
r ba
ckfa
t la
yer
Mid
dle
back
fat
laye
rO
uter
bac
kfat
lay
er
Ctr
lB
TP
FSB
OC
trl
BT
PF
SBO
Ctr
lB
TP
FSB
O
All
PU
FAP
< 0
.001
and
SE
M =
1.0
022
P <
0.0
01 a
nd S
EM
= 1
.093
2P
< 0
.001
and
SE
M =
1.0
062
28.
120
.62bc
20.5
3bcd
21.5
3bc21
.13bc
21.2
1de21
.17de
21.8
3cd21
.74cd
21.3
9def
21.3
4def
21.9
8cd21
.81cd
e
45.
519
.32cd
e17
.63de
f23
.25b
29.8
1a20
.67de
f18
.48ef
g24
.29c
30.2
6ab21
.36de
f19
.06ef
g24
.34c
30.4
4b
68.
116
.02fg
16.7
8ef19
.71cd
28.4
3a18
.48ef
g17
.64gh
21.1
9de31
.04ab
19.7
8defg
18.2
9gh21
.43de
f30
.97ab
90.
915
.34fg
13.9
4g18
.90cd
e29
.56a
17.7
4fgh
15.0
0hi20
.29de
fg32
.84a
19.1
5efg
16.0
8h21
.07de
f33
.32a
113
.615
.83fg
13.9
5g17
.42ef
27.2
7a18
.40ef
g14
.42i
18.6
3efg
29.8
6b20
.03de
fg15
.61h
19.0
2fg30
.16b
18:2
n-63
P <
0.0
01 a
nd S
EM
= 0
.863
2P
< 0
.001
and
SE
M =
0.9
462
P <
0.0
01 a
nd S
EM
= 0
.870
2
28.
118
.04c
17.9
3cd18
.96bc
18.4
4bc18
.62cd
ef18
.54cd
ef19
.28bc
19.0
5cd18
.63de
18.5
7de19
.29cd
19.0
0de
45.
517
.12cd
15.4
7def
20.4
8b25
.85a
18.3
9cdef
g16
.28fg
h21
.79b
26.1
9a18
.84de
16.6
7ef21
.42c
26.2
5b
68.
114
.25fg
14.7
1ef17
.55cd
24.4
8a16
.54de
fgh
15.4
9hi18
.92cd
e26
.82a
17.5
3def
15.9
2fg18
.98de
26.6
2ab
90.
913
.72fg
12.2
8g16
.89cd
e25
.48a
15.9
4gh13
.26ij
18.1
5cdef
g28
.43a
17.1
0def
14.0
8g18
.75de
28.7
1a
13.
614
.08fg
12.3
2g15
.47de
f23
.59a
16.4
3efgh
12.7
7j16
.64de
fgh
25.9
1a17
.82de
f13
.67g
16.8
5ef26
.04b
18:3
n-34
P <
0.0
01 a
nd S
EM
= 0
.112
2P
< 0
.001
and
SE
M =
0.1
192
P <
0.0
01 a
nd S
EM
= 0
.115
2
28.
10.
88bc
de0.
89bc
de0.
93bc
d0.
96bc
0.91
cde
0.92
cde
0.92
cde
0.98
cd0.
94cd
e0.
96cd
e0.
96cd
e1.
01cd
45.
50.
75bc
def
0.72
cdef
1.05
b2.
10a
0.81
cdef
0.77
def
1.11
c2.
15b
0.86
cdef
0.82
cdef
1.12
c2.
16b
68.
10.
55f
0.77
bcde
f0.
73cd
ef2.
20a
0.64
ef0.
81cd
ef0.
78cd
ef2.
38ab
0.72
def
0.87
cdef
0.82
cdef
2.40
ab
90.
90.
50f
0.53
f0.
65de
f2.
36a
0.58
f0.
56f
0.70
def
2.62
a0.
65ef
0.63
f0.
75de
f2.
69a
113
.60.
66de
f0.
49f
0.60
ef2.
08a
0.74
def
0.50
f0.
62ef
2.26
b0.
81cd
ef0.
56f
0.65
ef2.
33b
a–j W
ithi
n a
spec
ific
fatt
y ac
id a
nd b
ackf
at lay
er, le
ast
squa
res
mea
ns lac
king
com
mon
sup
ersc
ript
let
ters
diff
er, P
< 0
.05.
1 Ctr
l =
con
trol
die
ts w
ith
no a
dded
fat
; B
T =
5%
bee
f ta
llow
; P
F =
5%
pou
ltry
fat
; an
d SB
O =
5%
soy
bean
oil.
2 The
pro
babi
lity
valu
e an
d SE
M for
the
spe
cific
die
tary
fat
sou
rce
× s
laug
hter
wei
ght
inte
ract
ion.
3 Lin
olei
c ac
id.
4 α-L
inol
enic
aci
d.
Apple et al.1436
at Serials/Acq. Dept., Library on May 1, 2009. jas.fass.orgDownloaded from

dle, and outer fat layers of BT-fed pigs by 12.3, 11.2, and 7.5%, respectively, as slaughter weight increased from 45.5 to 113.6 kg.
DISCUSSION
The largest changes in the fatty acid composition of pork subcutaneous fat in response to dietary fat sources, inclusion amounts, or both occurred soon af-ter introduction of the diet. Warnants et al. (1999) re-ported that more than 50% of the total increase in 18:2n-6 and all PUFA of pork subcutaneous fat was produced within the first 2 wk after replacing 2.5% BT with 15% full-fat soybeans; however, it took 60 d to increase the proportion of 18:0 by almost 60% in pork backfat when full-fat soybeans were replaced with 2.3% BT. Furthermore, approximately two-thirds of the total change in the PUFA composition of subcutaneous fat associated with the dietary inclusion of a polyunsatu-rated fat source occurred rapidly, between 14 d (Irie and Sakimoto, 1992; Wiseman and Agunbiade, 1998) and 17 d (Fontanillas et al., 1998). However, the rate at which the fatty acid composition of porcine adipose tissue was altered may be a response to the satura-tion of the dietary fat source, dietary inclusion amount of a particular fat source, or both. For example, more than 75% of the total changes in SFA of backfat from Ctrl- and BT-fed pigs occurred within the first 40 kg of BW gain, whereas less than 12% of the total change in SFA had occurred within the subcutaneous fat of
pigs fed the PF and SBO diets. Likewise, slightly less than 25% of the total change in all MUFA occurred in backfat from PF-fed pigs during the first 17.4 kg of BW gain, whereas more than 55% of the total change in all MUFA occurred between 28.1 and 45.5 kg in pigs fed the Ctrl, BT and SBO diets in the present study. In addition, more than 66% of the total change in PUFA was observed in subcutaneous fat from PF- and SBO-fed pigs between 28.1 and 45.5 kg, but between 20 and 45% of the total change in PUFA was noted in backfat from pigs fed the Ctrl and BT diets and slaughtered at 45.5 kg.
Results of the present study also demonstrated that the IV of pork subcutaneous fat was increased by al-most 12 points during the first 17.4 kg of BW in pigs fed the SBO diets, and, more importantly, that value decreased by only 2.6 points between 45.5 and 113.6 kg. It has been hypothesized that replacing high con-centrations of a polyunsaturated fat source with BT or withdrawing any added fat would substantially re-duce the IV of subcutaneous fat. However, across the entire trial, feeding BT reduced IV by only 7.5 points, whereas feeding a diet devoid of added fat reduced IV by only 5.2 points between 28.1 and 113.6 kg. Given these results, coupled with the knowledge that the half-life of 18:3n-3 in subcutaneous fat is approximately 300 d (Anderson et al., 1972a), it seems unlikely that re-moving all added fat or replacing fat with a saturated source during the last 30 d on feed or the last 25 kg of BW gain could reduce the IV of subcutaneous fat by more than 1 or 2 points.
Figure 7. Interactive effect of dietary fat source (Ctrl = control diets with no added fat; BT = 5% beef tallow; PF = 5% poultry fat; and SBO = 5% soybean oil) and slaughter weight (P < 0.001) on iodine values of subcutaneous fat. a–jLeast squares means lacking common letters differ, P < 0.05.
Fat × slaughter weight on subcutaneous fat composition 1437
at Serials/Acq. Dept., Library on May 1, 2009. jas.fass.orgDownloaded from

In agreement with several published studies, the in-ner backfat layer was the most saturated, having the greatest proportions of all SFA, 16:0 and 18:0 (Sink et al., 1964; McDonald and Hamilton, 1976; Wiseman and Agunbiade, 1998), whereas the outer subcutaneous fat layer was the least saturated of the individual fat lay-ers (Koch et al., 1968; Christie et al., 1972; Malmfors et al., 1978). In addition, the outer backfat layer had the greatest proportions of MUFA, whereas the middle layer contained the least amount of MUFA (Irie and Sakimoto, 1992). As expected, the proportion of 18:3n-3 was greater in the outer than inner backfat layers (Villegas et al., 1973; Wiseman and Agunbiade, 1998); however, the fatty acid composition of the inner subcu-taneous fat layer was composed of less PUFA, particu-larly, 18:2n-6, than either the outer or middle backfat layers (Villegas et al., 1973; Wood et al., 1978; Whit-tington et al., 1986), which had similar compositions of PUFA. Moreover, Irie and Sakimoto (1992) reported that the IV of the the outer subcutaneous fat layer was greater than the IV of the inner layer (72.4 vs. 66.3), which concurs with the results of this study, in which the IV of the outer layer was greater than the IV of either the middle or inner subcutaneous fat layer (75.8 vs. 73.1 or 71.2).
Koch et al. (1968) noted a faster change in the fatty acid composition in the inner layer than in the outer layer, whereas Mersmann and Leymaster (1984) and Fortin (1986) observed that the depths of the inner and middle backfat layers increased at a faster rate than the outer layer, suggesting a more rapid rate of fatty acid deposition in the inner and middle layers. Moreover, Newcom et al. (2005) indicated that the middle and inner backfat layers grew at approximately the same rate, but Fortin (1986) reported that the middle layer deposited lipid at a faster rate than the inner back-fat layer, which might explain the differences in the SFA and MUFA observed between these 2 layers in the present study. Furthermore, the inner and middle backfat layers have the greatest lipogenic activity when compared with the outer layer (Anderson et al., 1972b, Anderson and Kauffman, 1973; Warnants et al., 1999); thus, the more saturated composition of the inner and middle subcutaneous fat layers would be a response to enhanced de novo synthetic enzyme activity (Anderson et al., 1972b; Camara et al., 1996) associated with these backfat layers, whereas the more unsaturated composi-tion of the outer backfat layer may be a response to preferential deposition of 18:1 and 18:2n-6 from the diet (Dahl and Persson, 1965; Koch et al., 1968; Brooks, 1971).
Feeding BT has been shown to reduced the propor-tions of 16:0 (Weber et al., 2006), 18:0 (McDonald and Hamilton, 1976), total SFA (McDonald and Hamilton, 1976), 18:1c9 (Brooks, 1971), 18:2n-6 (Brooks, 1971), and 18:3n-3 (McDonald and Hamilton, 1976) in porcine subcutaneous fat. Conversely, others have reported no effect of BT on proportions of SFA and 18:1c9 in the outer backfat layer (McDonald and Hamilton, 1976; Tab
le 5
. In
tera
ctiv
e ef
fect
s of
die
tary
fat
sou
rce1
and
slau
ghte
r w
eigh
t on
the
iod
ine
valu
e2 of
the
ind
ivid
ual ba
ckfa
t la
yers
Slau
ghte
r w
t, k
g
Inne
r ba
ckfa
t la
yer
Mid
dle
back
fat
laye
rO
uter
bac
kfat
lay
er
Ctr
lB
TP
FSB
OC
trl
BT
PF
SBO
Ctr
lB
TP
FSB
O
P <
0.0
01 a
nd S
EM
= 1
.313
3P
< 0
.001
and
SE
M =
1.5
063
P <
0.0
01 a
nd S
EM
= 1
.300
3
28.1
71.4
4de71
.86d
72.6
1d72
.66d
72.3
7cd72
.59cd
72.7
5cd73
.36c
73.8
2cdef
73.9
3cdef
74.1
6cdef
74.3
9cde
45.5
70.0
4def
69.2
2def
76.2
6c83
.89a
71.6
5cde
70.2
2cdef
77.6
9b85
.11a
74.6
7cde
71.9
8def
78.9
6b86
.58a
68.1
64.3
8ghi
66.5
3fgh
72.0
6d80
.92ab
67.1
6fg67
.73ef
g73
.86bc
84.1
5a72
.13de
f71
.12ef
gh76
.35bc
86.6
7a
90.9
63.9
4hi62
.83i
69.9
7def
82.3
7ab66
.53fg
64.7
6g72
.24cd
86.0
6a70
.65fg
h68
.12h
75.0
6cd88
.73a
113.
663
.52hi
63.0
4hi67
.88ef
g79
.20bc
66.7
1fg64
.43g
69.2
3def
82.9
3a71
.68de
fg68
.36gh
72.3
9def
85.5
7a
a–i W
ithi
n a
back
fat
laye
r, lea
st s
quar
es m
eans
lac
king
com
mon
sup
ersc
ript
let
ters
diff
er, P
< 0
.05.
1 Ctr
l =
con
trol
die
ts w
ith
no a
dded
fat
; B
T =
5%
bee
f ta
llow
; 5%
PF =
pou
ltry
fat
; an
d SB
O =
5%
soy
bean
oil.
2 Iod
ine
valu
e =
(0.
95 ×
[∑ 1
6:1]
) +
(0.
86 ×
[∑ 1
8:1]
) +
(1.
732
× [∑
18:
2])
+ (
2.61
6 ×
[∑ 1
8:3]
) +
(0.
785
× [2
0:1c
11])
, whe
re b
rack
ets
indi
cate
con
cent
ration
s of
fat
ty a
cids
(A
OC
S, 1
998)
. 20:
1c11
=
gad
olei
c ac
id (
c =
cis
).3 T
he p
roba
bilit
y va
lue
and
SEM
for
the
spe
cific
die
tary
fat
sou
rce
× s
laug
hter
wei
ght
inte
ract
ion.
Apple et al.1438
at Serials/Acq. Dept., Library on May 1, 2009. jas.fass.orgDownloaded from

Weber et al., 2006), all MUFA in any backfat layer (Eggert et al., 1998b), 18:2n-6 in the inner and outer layers (McDonald and Hamilton, 1976; Weber et al., 2006), and all PUFA found in each backfat layer (Egg-ert et al., 1998b; Weber et al., 2006). Furthermore, even though percentages of 16:0 and all SFA were reduced in subcutaneous fat from pigs fed PF (Eggert et al., 1998a; Engel et al., 2001), Engel et al. (2001) failed to detect differences in 18:2n-6 or 18:3n-3 in subcutaneous fat from pigs consuming diets formulated without added fat or including 2 to 6% PF or choice white grease. On the other hand, Eggert et al. (1998a) observed increases of 38 to 46% in the percentage of all PUFA composing the outer and inner backfat layers, and, as expected, feeding swine diets formulated with SBO greatly in-creased the proportions of 18:2n-6 (74 to 148%) and 18:3n-3 (115 to 390%), as well as total PUFA (Brooks, 1971; Gläser et al., 2002), in backfat when compared with subcutaneous fat from pigs consuming diets free of added fat.
When comparing the effects of diets formulated with BT or SBO on fatty acid composition, subcutaneous fat from pigs fed BT had greater proportions of 16:0, 18:0, and all SFA (Monahan et al., 1992; Pfalzgraf et al., 1995), as well as 18:1c9 (Monahan et al., 1992; Pfalzgraf et al., 1995; Morel et al., 2006) and all MUFA (Morel et al., 2006). More specifically, the inner and outer backfat layers of pigs fed 5% BT were composed of greater percentages of 16:0, 18:0, 18:1c9, 18:1c11, and all MUFA than the inner and outer backfat layers of pigs fed 5% SBO (Morgan et al., 1992; Bee et al., 1999, 2002). Conversely, feeding pigs diets containing SBO elevated 18:2n-6 and 18:3n-3 percentages between 93 to 164% and 104 to 205% in the inner backfat layer, respectively, and between 143 to 200% and 139 to 187% in the outer layer, respectively, when compared with pigs fed BT (Morgan et al., 1992; Bee et al., 1999, 2002). Although Engel et al. (2001) found that the LM from pigs fed choice white grease had greater propor-tions of 18:1c9 than the LM of PF-fed pigs, fatty acid profiles of subcutaneous fat did not differ between pigs fed PF or choice white grease. Thus, results of the pres-ent study are the first to compare fatty acid composi-tions of the 3 individual backfat layers from PF-fed pigs to pigs consuming diets formulated without added fat or with SBO or BT.
When feeding swine finishing diets formulated with 0 to 8% of a tallow-soybean oil blend, Pascual et al. (2006) noted a continuous increase in the proportion of 18:0 during the 76 d of treatment, whereas Camoes et al. (1995) observed that the 18:2n-6 content of sub-cutaneous fat increased at a constant rate between 70 and 115 kg. Interestingly, 16:0 and 18:0 percentages appeared to increase steadily in pigs fed the Ctrl and BT diets between 28.1 and 113.6 kg, as well as in sub-cutaneous fat from PF- and SBO-fed pigs between 45.5 and 113.6 kg; however, PUFA concentrations in subcu-taneous fat from SBO-fed pigs increased by more than
41% during the first 17.4 kg of BW gain before leveling off between 45.5 and 113.6 kg, whereas the percentages of 18:2n-6 and 18:3n-3 remained relatively unchanged between 45.5 and 113.6 kg. The pattern of observed changes in PUFA, as well as all MUFA and 18:1c9, are consistent with the exponential asymptotic responses to manipulation of PUFA and MUFA with SBO in pigs between 55 and 93 kg (Wiseman and Agunbiade, 1998) and canola oil or SBO in pigs between 26 and 95 kg (Fontanillas et al., 1998).
In summary, the fatty acid composition of the each backfat layer can be altered rather quickly depending on the polyunsaturation of the fat source incorporated into diets of growing-finishing swine. Although increas-ing the PUFA content of the porcine adipose tissue may provide nutritional benefits to consumers (Mattson and Grundy, 1985; Li et al., 1998; Wood et al., 2003), pro-portions of 18:2n-6 in each backfat layer of SBO-fed pigs exceeded 15%, the concentration of 18:2n-6 typi-cally associated with soft pork fat (Whittington et al., 1986; Wood et al., 1986). Moreover, increased concen-trations of polyunsaturation in porcine adipose tissue may negatively affect fresh pork shelf life (Pfalzgraf et al., 1995; Morel et al., 2006) and cooked pork palatabil-ity (Wood and Enser, 1997; Wiseman et al., 2000).
LITERATURE CITED
Anderson, D. B., and R. G. Kauffman. 1973. Cellular and enzymatic changes in porcine adipose tissue during growth. J. Lipid Res. 14:160–168.
Anderson, D. B., R. G. Kauffman, and N. J. Benevenga. 1972a. Es-timate of fatty acid turnover in porcine adipose tissue. Lipids 7:488–489.
Anderson, D. B., R. G. Kauffman, and L. L. Kastenschmidt. 1972b. Lipogenic enzyme activities and cellularity of porcine adipose tissue from various anatomical locations. J. Lipid Res. 13:593–599.
AOCS. 1998. Recommended practice Cd 1c-85. In Official Methods and Recommended Practices of the AOCS. 5th ed. Am. Oil Chem. Soc., Champaign, IL.
Apple, J. K., C. V. Maxwell, D. L. Galloway, S. Hutchison, and C. R. Hamilton. 2009. Interactive effects of dietary fat source and slaughter weight in growing-finishing swine: I. Growth perfor-mance and longissimus muscle fatty acid composition. J. Anim. Sci. 87:1407–1422.
Bee, G., S. Gebert, and R. Messikommer. 2002. Effect of dietary energy supply and fat source on the fatty acid pattern of adi-pose and lean tissues and lipogenesis in the pig. J. Anim. Sci. 80:1564–1574.
Bee, G., R. Messikommer, and S. Gebert. 1999. Dietary fats and energy levels differently affect tissue lipogenic enzyme activity in finishing pigs. Fett-Lipid 101:336–342.
Brooks, C. C. 1971. Fatty acid composition of pork lipids as af-fected by basal diet, fat source, and fat level. J. Anim. Sci. 33:1224–1231.
Camara, M., J. Mourot, and C. Février. 1996. Influence of two dairy fats on lipid synthesis in the pig: Comparative study of liver, muscle and the two backfat layers. Ann. Nutr. Metab. 40:287–295.
Camoes, J., J. Mourot, M. Kouba, P. Cherot, and A. Mounier. 1995. Effets de régimes à teneurs variables en acide linoléique sur les caractéristiques des tissues adipeux. J. Rech. Porcine France 27:291–296.
Fat × slaughter weight on subcutaneous fat composition 1439
at Serials/Acq. Dept., Library on May 1, 2009. jas.fass.orgDownloaded from
Christie, W. W., D. M. Jenkinson, and J. H. Moore. 1972. Variation in lipid composition through the skin and subcutaneous adipose tissue of pigs. J. Sci. Food Agric. 23:1125–1129.
Dahl, O., and A.-K. Persson. 1965. Properties of animal depot fat in relation to dietary fat. J. Sci. Food Agric. 16:452–455.
Eggert, J. M., E. J. Farrand, S. E. Mills, A. P. Schinckel, J. C. For-rest, A. L. Grant, and B. A. Watkins. 1998a. Effects of feeding poultry fat and finishing with supplemental beef tallow on pork quality and carcass composition. Purdue Univ. Swine Day Re-port. Purdue Univ., West Lafayette, IN. www.ansc.purdue.edu/swine/swineday/sday98/index.htm Accessed Feb. 3, 2007.
Eggert, J. M., E. J. Farrand, S. E. Mills, A. P. Schinckel, J. C. For-rest, A. L. Grant, and B. A. Watkins. 1998b. Effects of supple-menting with soybean oil and finishing with beef tallow on pork quality and carcass composition. Purdue Univ. Swine Day Re-port. Purdue Univ., West Lafayette, IN. www.ansc.purdue.edu/swine/swineday/sday98/index.htm Accessed Feb. 3, 2007.
Engel, J. J., J. W. Smith II, J. A. Unruh, R. D. Goodband, P. R. O’Quinn, M. D. Tokach, and J. L. Nelssen. 2001. Effects of choice white grease or poultry fat on growth performance, carcass leanness, and meat quality characteristics of growing-finishing pigs. J. Anim. Sci. 79:1491–1501.
Fontanillas, R., A. Barroeta, M. D. Baucells, and F. Guardiola. 1998. Backfat fatty acid evolution in swine fed diets high in either cis-monosaturated, trans, or (n-3) fats. J. Anim. Sci. 76:1045–1055.
Fortin, A. 1986. Development of backfat and individual fat layers in the pigs and its relationship with carcass lean. Meat Sci. 18:255–270.
Gläser, K. R., C. Wenk, and M. R. L. Scheeder. 2002. Effect of dietary mono- and polyunsaturated fatty acids on the fatty acid composition of pigs’ adipose tissues. Arch. Anim. Nutr. 56:51–65.
Irie, M., and M. Sakimoto. 1992. Fat characteristics of pigs fed fish oil containing eicosapentaenoic and docosahexaenoic acids. J. Anim. Sci. 70:470–477.
Koch, D. E., A. M. Pearson, W. T. Magee, J. A. Hoefer, and B. S. Schweigert. 1968. Effect of diet on the fatty acid composition of pork fat. J. Anim. Sci. 27:360–365.
Leymaster, K. A., and H. J. Mersmann. 1991. Effect of limited feed intake on growth of subcutaneous adipose tissue layers and on carcass composition in swine. J. Anim. Sci. 69:2837–2843.
Li, D., A. Ng, N. J. Mann, and A. J. Sinclair. 1998. Contribution of meat fat to dietary arachidonic acid. Lipids 33:437–440.
Madsen, A., K. Jakobsen, and H. P. Mortensen. 1992. Influence of dietary fat on carcass fat quality in swine. A review. Acta Ag-ric. Scand., Sect. A., Anim. Sci. 42:220–225.
Malmfors, B., K. Lundsrom, and I. Hansson. 1978. Fatty acid com-position of porcine backfat and muscle lipids as affected by sex, weight and anatomical location. Swedish J. Agric. Res. 8:25–38.
Mattson, F. H., and S. M. Grundy. 1985. Comparison of effects of dietary saturated, monounsaturated, and polyunsaturated fatty acids on plasma lipids and lipoproteins in man. J. Lipid Res. 26:194–202.
McDonald, B. E., and R. M. G. Hamilton. 1976. Growth and car-cass composition of pigs fed diets that contained rapeseed oil, soybean oil or tallow during the growing period. Can. J. Anim. Sci. 56:671–680.
Mersmann, H. J., and K. A. Leymaster. 1984. Differential deposition and utilization of backfat layers in swine. Growth 48:321–330.
Monahan, F. J., D. J. Buckley, P. A. Morrissey, P. B. Lynch, and J. I. Gray. 1992. Influence of dietary fat and α-tocopherol supple-mentation on lipid oxidation in pork. Meat Sci. 31:229–241.
Moody, W. G., and S. E. Zobriski. 1966. Study of backfat layers of swine. J. Anim. Sci. 25:809–813.
Morel, P. C., J. C. McIntosh, and J. A. M. Janz. 2006. Alteration of the fatty acid profile of pork by dietary manipulation. Asian-australas. J. Anim. Sci. 19:431–437.
Morgan, C. A., R. C. Noble, M. Cocchi, and R. McCartney. 1992. Manipulation of the fatty acid composition of pig meat lipids by dietary means. J. Sci. Food Agric. 58:357–368.
Murrieta, C. M., B. W. Hess, and D. C. Rule. 2003. Comparison of acidic and alkaline catalysts for preparation of fatty acid methyl esters from ovine muscle with emphasis on conjugated linoleic acid. Meat Sci. 65:523–529.
Newcom, D. W., T. J. Baas, C. R. Schwab, and K. J. Stalder. 2005. Genetic and phenotypic relationships between individual sub-cutaneous backfat layers and percentage of longissimus intra-muscular fat in Duroc swine. J. Anim. Sci. 83:316–323.
NRC. 1998. Nutrient Requirements of Swine. 10th ed. Natl. Acad. Press, Washington, DC.
Pascual, J. V., M. Rafecas, M. A. Canela, J. Boatella, R. Bou, M. D. Baucells, and R. Codony. 2006. Effect of increasing amounts of a linoleic-rich dietary fat on the fat composition of four pig breeds. Part I: Backfat fatty acid evolution. Food Chem. 96:538–548.
Pfalzgraf, A., M. Frigg, H. Steinhart, M. Kirchgeßner, and F. X. Roth. 1995. Influence of dietary fat and vitamin E on the lipids in pork meat. Fett-Lipid 97:13–20.
Sink, J. D., J. L. Watkins, J. H. Ziegler, and R. C. Miller. 1964. Analysis of fat deposition in swine by gas-liquid chromatogra-phy. J. Anim. Sci. 23:121–125.
Villegas, F. J., H. B. Hedrick, T. L. Veum, K. L. McFate, and M. E. Bailey. 1973. Effect of diet and breed on fatty acid composition of porcine adipose tissue. J. Anim. Sci. 36:663–668.
Warnants, N., M. J. Van Oeckel, and C. V. Boucqué. 1999. Incor-poration of dietary polyunsaturated fatty acids into pork fatty tissues. J. Anim. Sci. 77:2478–2490.
Weber, T. E., B. T. Richert, M. A. Belury, Y. Gu, K. Enright, and A. P. Schinckel. 2006. Evaluation of the effects of dietary fat, conjugated linoleic acid, and ractopamine on growth perfor-mance, pork quality, and fatty acid profiles in genetically lean gilts. J. Anim. Sci. 84:720–732.
Whittington, F. M., N. J. Prescott, J. D. Wood, and M. Enser. 1986. The effect of dietary linoleic acid on the firmness of backfat in pigs of 85 kg live weight. J. Sci. Food Agric. 37:753–761.
Wiseman, J., and J. A. Agunbiade. 1998. The influence of changes in dietary fat and oils on fatty acid profiles of carcass fat in finishing pigs. Livest. Prod. Sci. 54:217–227.
Wiseman, J., M. S. Redshaw, S. Jagger, G. R. Nute, and J. D. Wood. 2000. Influence of type and dietary rate of inclusion of oil on meat quality of finishing pigs. Anim. Sci. 70:307–315.
Wood, J. D., P. J. Buxton, F. M. Whittington, and M. Enser. 1986. The chemical composition of fat tissues in the pig: Effects of castration and feeding treatment. Livest. Prod. Sci. 15:73–82.
Wood, J. D., and M. Enser. 1997. Factors influencing fatty acids in meat and the role of antioxidants in improving meat quality. Br. J. Nutr. 78(Suppl. 1):S49–S60.
Wood, J. D., M. B. Enser, H. J. H. MacFie, W. C. Smith, J. P. Chadwick, M. Ellis, and R. Laird. 1978. Fatty acid composition of backfat in Large White pigs selected for low backfat thick-ness. Meat Sci. 2:289–300.
Wood, J. D., R. I. Richardson, G. R. Nute, A. V. Fisher, M. M. Cam-po, E. Kasapidou, P. R. Sheard, and M. Enser. 2003. Effects of fatty acids on meat quality: A review. Meat Sci. 66:21–32.
Wood, J. D., J. Wiseman, and D. J. A. Cole. 1994. Control and manipulation of meat quality. Pages 433–456 in Principles of Pig Science. D. J. A. Cole, J. Wiseman, and M. A. Varley, ed. Nottingham Univ. Press, London, UK.
Apple et al.1440
at Serials/Acq. Dept., Library on May 1, 2009. jas.fass.orgDownloaded from

References http://jas.fass.org/cgi/content/full/87/4/1423#BIBL
This article cites 43 articles, 16 of which you can access for free at:
at Serials/Acq. Dept., Library on May 1, 2009. jas.fass.orgDownloaded from