Embed Size (px)
Citation preview

INTERACTIVE DECISION SUPPORT TOOL FOR LEACHATE MANAGEMENT
First Draft: August 31, 2009 Final Draft: December 1, 2010
Daniel E. Meeroff
Department of Civil, Environmental & Geomatics Engineering Florida Atlantic University
And
Ramesh Teegavarapu
Daniel E. Meeroff Department of Civil, Environmental & Geomatics Engineering
Florida Atlantic University
State University System of Florida Hinkley Center for Solid and Hazardous Waste Management
University of Florida 4635 NW 53rd Avenue, Suite 205
Gainesville, FL 32653 www.hinkleycenter.org
Report # 0832028 FINAL REPORT
ACKNOWLEDGEMENTS The research was sponsored in part by the William W. “Bill” Hinkley Center for Solid and Hazardous Waste Management and Florida Atlantic University. The researchers would like to thank Jeff Roccapriore, Joe Lurix, Art Torvela, Sermin Unsal, Ravi Kadambala, Frederick Bloetscher, Amede Dimonnay, Allan Choate, Juan Quiroz, Dan Schauer, Tom Peel, Lee Martin, Lee Casey, Chad Fettrow, James Leavor, Marshall Seymore, Charles Emery, Dan Morrical, John Booth, Ray Schauer, Richard Meyers, Manuel Hernandez, Marc Bruner, Matt Zuccaro for sharing their input as members of the Technical Advisory Group. The following individuals are thanked for their contributions to the research: Tim Vinson, John Schert, Kevin Vann, Kevin Leo, David Gregory, Dan Rodriguez, Darryl Smith, William Edwards, Gary Debo, Scott Trainor, Thomas Boatman, Patrick Cosme, Hala Sfeir, Richard Tedder, Teresa Blannkenship, Charles Emery, Marshall Seymore, Dawn Templin, Alex Hubbard, Tony Bishop, Deng Yang, William Koseldt, Swapnil Jain, Hatsuko Hashimoto, Jim Englehardt, Andre McBarnette, Anthony Ruffini, and Richard Reichenbach. The researchers would also like to thank all of the TAG members who provided invaluable input and peer review of the information contained herein.

iii
TABLE OF CONTENTS
1. INTRODUCTION......................................................................................................... 1
1.1 DECISION SUPPORT TOOLS ............................................................................................... 1 1.2 RATIONALE............................................................................................................................. 4
1.2.1 Practical/specific benefits for end users................................................................................ 6 1.3 MUNICIPAL SOLID WASTE MANAGEMENT .................................................................. 6
1.3.1 Generation and disposal ........................................................................................................ 8 1.3.2 Landfills ................................................................................................................................. 8
1.4 LANDFILL LEACHATE ....................................................................................................... 11 1.4.1 Definitions............................................................................................................................ 11 1.4.2 Typical leachate volumes generated.................................................................................... 12 1.4.3 Typical leachate composition .............................................................................................. 14 1.4.4 Constituents of concern, health risks, and environmental impacts ................................... 17
1.5 LEACHATE MANAGEMENT OPTIONS ........................................................................... 21 1.5.1 Leachate recirculation (bioreactor landfills) ...................................................................... 21 1.5.2 Leachate evaporation........................................................................................................... 22 1.5.3 Leachate natural attenuation .............................................................................................. 23
1.5.3.1 Deep well injection ................................................................................................................... 23 1.5.3.2 Treatment wetlands and reed beds ......................................................................................... 23 1.5.3.3 Spray Irrigation ....................................................................................................................... 25
1.5.4 Hauling off-site .................................................................................................................... 26 1.5.5 Municipal sewer discharge .................................................................................................. 27 1.5.6 On-site pretreatment ............................................................................................................ 28
1.5.6.1 Conventional biological and physical-chemical processes .................................................... 28 1.5.6.1.1 Biological processes............................................................................................................. 28 1.5.6.1.2 Physical-chemical processes ............................................................................................... 30 1.5.6.1.3 Summary of conventional processes.................................................................................. 39
1.5.6.2 Chemical oxidation processes.................................................................................................. 41 1.5.6.2.1 Hydrogen peroxide (H2O2) ................................................................................................. 43 1.5.6.2.2 Fenton (H2O2/Fe2+).............................................................................................................. 44 1.5.6.2.3 Ozone (O3) ........................................................................................................................... 47 1.5.6.2.4 Ozone and hydrogen peroxide (O3/H2O2) ......................................................................... 48 1.5.6.2.5 Ultraviolet light (UV).......................................................................................................... 50 1.5.6.2.6 Photo-Fenton / Fenton-like systems................................................................................... 51 1.5.6.2.7 Ultraviolet light and hydrogen peroxide (UV/H2O2) ........................................................ 52 1.5.6.2.8 Ultraviolet light and ozone (UV/O3) .................................................................................. 53 1.5.6.2.9 Ultraviolet light, ozone and hydrogen peroxide (UV/O3/H2O2)....................................... 54 1.5.6.2.10 Electrochemical oxidation .................................................................................................. 55 1.5.6.2.11 Photocatalytic oxidation ..................................................................................................... 56 1.5.6.2.12 Iron-Mediated Aeration (IMA).......................................................................................... 61 1.5.6.2.13 Photochemical Iron-Mediated Aeration (PIMA) ............................................................. 62 1.5.6.2.14 Summary of chemical oxidation processes........................................................................ 63
1.6 PROBLEM STATEMENT ..................................................................................................... 65 1.7 OBJECTIVES.......................................................................................................................... 65
2. METHODOLOGY ................................................................................................... 67
2.1 INFORMATION COMPILATION................................................................................................ 67 2.2 IDENTIFY HOST INSTITUTION NEEDS................................................................................... 68 2.3 DEVELOPMENT OF DATABASE OF ALTERNATIVES ......................................................... 68
2.4.1 Ranking of treatment options................................................................................................ 69 2.4.2 Information collection tool ................................................................................................... 71
2.4 DESIGN OF THE DECISION TREE............................................................................................. 75 2.4.1 Decision tree development process....................................................................................... 75

iv
2.4.2 Prototype web-based decision support system ..................................................................... 78 2.5 DEVELOP USER INTERFACE..................................................................................................... 80 2.6 TOOL TESTING ............................................................................................................................. 80
3. RESULTS .................................................................................................................... 82
3.1 CURRENT LEACHATE STRATEGIES ................................................................................... 82 3.1.1 Bin development of user specific information .................................................................... 86 3.1.2 POTW discharge limits ........................................................................................................ 89
3.2 ALTERNATIVE SELECTION PROCESS ................................................................................... 91 3.3 MAPPING OF ALTERNATIVES TO USER SPECIFIC INFORMATION ............................ 106 3.4 USER INTERFACE....................................................................................................................... 107
3.4.1 Sample interactive session with the decision support system ........................................... 107 3.5 TOOL TESTING ........................................................................................................................... 111 3.6 USER MANUAL ............................................................................................................................ 111
3.6.1 Web-based decision support tool ....................................................................................... 112 3.6.2 Tool execution and system requirements .......................................................................... 112 3.6.3 Online help......................................................................................................................... 113 3.6.4 User consultation session .................................................................................................. 113 3.6.5 Consultation progress ........................................................................................................ 115 3.6.6 Summary ............................................................................................................................ 118
4. CONCLUSIONS AND RECOMMENDATIONS.................................................. 119
5. REFERENCES.......................................................................................................... 121
v
LIST OF FIGURES Figure 1. Screenshots of STREAMS decision support system (Teegavarapu et al. 2003b)2 Figure 2. Screenshots of MIST decision support system (Teegavarapu et al. 2003b)........ 3 Figure 3. Architecture of the decision support tool ............................................................ 4 Figure 4. Waste composition of materials generated in the United States in 2007 (USEPA 2007). .................................................................................................................................. 7 Figure 5. Role of phases in the leachate composition (adapted from Tchobanoglous and Kreith 2002) ...................................................................................................................... 15 Figure 6. Location of each of the 52 landfills investigated in the survey (locations are shown as dots on the map). ............................................................................................... 72 Figure 7. Screenshot of the decision support tool survey for landfill managers............... 74 Figure 8. Constituents and responses linked in a simple decision tree............................. 75 Figure 9. Main key for one of the decision trees developed in the current study. ............ 76 Figure 10. Constituents and processes defined for one of the decision trees developed in the current study................................................................................................................ 76 Figure 11. Management options for one of the decision trees developed in the current study.................................................................................................................................. 77 Figure 12. Idealized example decision support system (DSS) development process....... 77 Figure 13. Screen shot of a typical web-based expert system/decision support system... 78 Figure 14. Location of wastewater treatment facilities (little dots) and landfill sites in Florida (larger dots). ......................................................................................................... 91 Figure 15. Screenshot of the alternative analysis comparison results. ........................... 105 Figure 16. Interactive session with web-based expert system/decision support system. 108 Figure 17. Final interactive session and decision (option/alternative) provided by DSS.......................................................................................................................................... 109 Figure 18. Explanation and firing of rules by the decision support system provided to the user upon request. ........................................................................................................... 110 Figure 19. Opening screenshot of the decision support tool........................................... 112 Figure 20. Initial consultation screen.............................................................................. 113 Figure 21. Example of certainty factors for questions.................................................... 114 Figure 22. Response of the system to the “Why ask” option.......................................... 115 Figure 23. Progress of consultations (a,b,c,d,e) with user supplied answers.................. 117 Figure 24. Final consultation screen with option of explanation for different rules....... 117

vi
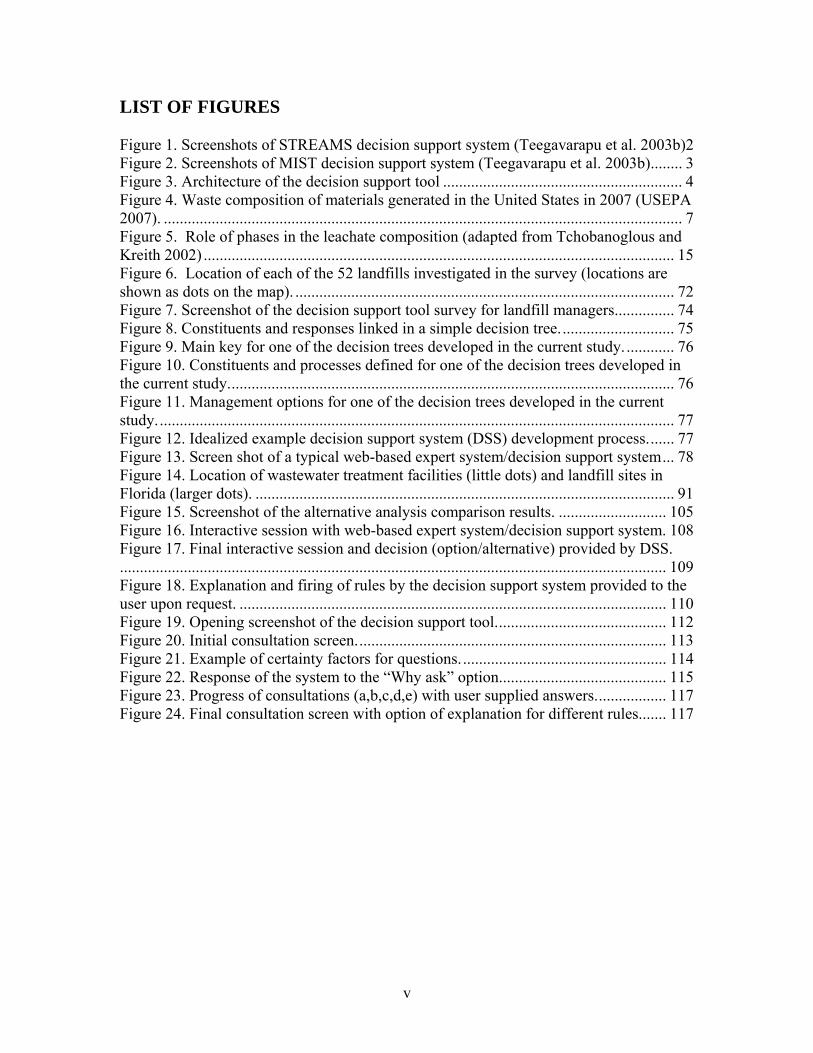
LIST OF TABLES Table 1. Average tons per year of Florida ash monofills from 1993-2003 (FDEP 2004).11 Table 2. Leachate generation (in gallons per day per acre) from Florida double-lined landfills, adapted from Tedder (1997) .............................................................................. 14 Table 3. Leachate classification, adapted from Amokrane et al. (1997) ......................... 16 Table 4. Typical leachate water quality data from young and mature landfills (Tchobanoglous, Theisen, and Vigil 1993)....................................................................... 16 Table 5. Extreme values for the composition of leachate developed through review of technical literature............................................................................................................. 19 Table 6. Comparison of the composition of untreated domestic wastewater and leachate........................................................................................................................................... 19 Table 7. Summary of performance tests conducted with constructed wetlands for wastewater treatment. ....................................................................................................... 25 Table 8. Scale of relative haul distances for comparison purposes. ................................. 26 Table 9. Summary of COD removal performance tests conducted with cogulation/flocculation technologies on landfill leachates. .............................................. 33 Table 10. Summary of performance tests conducted with adsorption technologies on landfill leachates. .............................................................................................................. 35 Table 11. Summary of performance tests conducted with membrane technologies on landfill leachates. .............................................................................................................. 38 Table 12. Relative effectiveness of conventional biological and physical-chemical treatment processes for leachate. ...................................................................................... 40 Table 13. Relative oxidation power of selected oxidizing species (Munter et al. 2001).42 Table 14. Summary of COD removal performance tests conducted with Fenton technologies on landfill leachates. .................................................................................... 46 Table 15. Summary of COD removal performance tests conducted with ozone technologies on landfill leachates. .................................................................................... 48 Table 16. Summary of COD removal performance tests conducted with O3/H2O2
technologies on landfill leachates. .................................................................................... 49 Table 17. Summary of COD removal performance tests conducted with UV/Fe(II)/ H2O2
technologies on landfill leachates. .................................................................................... 52 Table 18. Summary of COD removal performance tests conducted with UV/H2O2
technologies on landfill leachates. .................................................................................... 53 Table 19. Summary of COD removal performance tests conducted with UV/O3
technologies on landfill leachates. .................................................................................... 53 Table 20. Summary of COD removal performance tests conducted with UV/O3/H2O2
technologies on landfill leachates. .................................................................................... 55 Table 21. Relative effectiveness of chemical oxidation treatment processes for landfill leachate. ............................................................................................................................ 64 Table 22. Example of alternative analysis selection matrix for municipal sewer discharge without pre-treatment........................................................................................................ 70 Table 23. List of 52 representative landfill facilities in Florida, randomly chosen for the user profile survey............................................................................................................. 71 Table 24. Distribution of existing landfill leachate management strategies for the 52 representative landfills surveyed....................................................................................... 83

vii
Table 25. Distribution of landfill facility class in the 52 representative Florida landfills surveyed. ........................................................................................................................... 86 Table 26. Distribution of landfill facility class in the 52 representative Florida landfills surveyed. ........................................................................................................................... 86 Table 27. Distribution of landfill leachate production in gallons per day per acre for the 52 representative Florida landfills surveyed. .................................................................... 87 Table 28. Distribution of landfill leachate age in the 52 representative Florida landfills surveyed. ........................................................................................................................... 88 Table 29. Distribution of landfill leachate composition in the 52 representative Florida landfills surveyed. ............................................................................................................. 89 Table 30. Summary of sewer discharge limits by district for key constituents of concern in Florida landfill leachate. ............................................................................................... 90 Table 31. Example of allowable public sewer discharge concentrations for the City of Boca Raton, FL (FAU EHS 2006).................................................................................... 92 Table 32. Summary of advantages and disadvantages of selected leachate management strategies. .......................................................................................................................... 93 Table 33. Summary of alternative analysis comparison results after revision ............... 104

viii
LIST OF ABBREVIATIONS, ACRONYMS & UNITS OF MEASUREMENT AOP: Advanced Oxidation Process APO: Aerated Photochemical Oxidation BDL: Below Detection Limits BMP: Best Management Practice BOD5: Biological Oxygen Demand in mg/L BTEX: Benzene, Toluene, Ethylbenzene, and Total Xylenes C&D: Construction and Demolition Waste CB: Conduction Band CCA: Copper, Chromium, and Arsenic CFR: Code of Federal Regulations Co: initial concentration in mg/L or M COD: Chemical Oxygen Demand in mg/L DC: Direct Current DO: Dissolved Oxygen in mg/L as O2 DSS: Decision Support System DST: Decision Support Tool ED: Electrodialysis EDCs: Endocrine Disrupting Compounds EDTA: Ethylenediamine Tetraacetic Acid EP: Energized Process FAC: Florida Administrative Code FDEP: Florida Department of Environmental Protection FGDL: Florida Geographical Data Library Flux: in units of gpd/ft2 FTIR: Fourier Transform Infrared Spectroscopy GAC: Granular Activated Carbon GUI: Graphical User Interface HCSHWM: Hinkley Center for Solid and Hazardous Waste Management HRT: Hydraulic Retention Time IACUC: Institutional Animal Care and Use Committee IMA: Iron Mediated Aeration KHP: Potassium Hydrogen Phthalate orPotassium Acid Phthalate Leachate Production: in units of gallons per day per acre MAP: Magnesium Ammonium Phosphate MBR: Membrane Bio-Reactor MF: Microfiltration MGD: Million Gallons per Day MIEX: Magnetic Ion Exchange MINCF: Minimum Confidence Factor MSW: Municipal Solid Waste MWCO: Molecular Weight Cut-Off n/a: not available NF: Nanofiltration

ix
nm: wavelength in nanometers nr: not recorded OCUCLUS: FDEP Division of Waste Management Document Management System PAC: Powdered Activated Carbon pBOD5: Particulate Biological Oxygen Demand in mg/L pCOD: Particulate Chemical Oxygen Demand in mg/L pH: -log[H+] in standard units PIMA: Photochemical Iron-Mediated Aeration POTWs: Publicly Owned Treatment Works Q: flowrate in m3/s RCRA: Resource Conservation and Recovery Act Redox: oxidation-reduction reaction RO: Reverse Osmosis SBR: Sequencing Batch Reactor SC: Specific Conductivity in S/m SWANA: Solid Waste Association of North America t1/2: half life in minutes TAG: Technical Advisory Group TCLP: Toxicity Characteristic Leaching Procedure Test TDS: Total Dissolved Solids in mg/L TKN: Total Kjeldahl Nitrogen in mg/L as N TN: Total Nitrogen in mg/L as N TSS: Total Suspended Solids in mg/L UF: Ultrafiltration UIC: Underground Injection Control US: ultrasound USEPA: United State Environmental Protection Agency UV: ultraviolet VB: Valence Band VOCs: Volatile Organic Compounds W: Watts ZVI: Zero-Valent Iron λ: Wavelength

x
INTERACTIVE DECISION SUPPORT TOOL FOR LEACHATE MANAGEMENT
Daniel E. Meeroff Department of Civil, Environmental & Geomatics Engineering
Florida Atlantic University Boca Raton, FL 33431
Telephone #(561) 297-2658
And
Ramesh Teegavarapu Department of Civil, Environmental & Geomatics Engineering
Florida Atlantic University Telephone #(561) 297-3444
State University System of Florida Hinkley Center for Solid and Hazardous Waste Management
University of Florida 4635 NW 53rd Avenue, Suite 205
Gainesville, FL 32653 www.hinkleycenter.org

xi
FINAL REPORT 09/01/2008 – 05/31/2010
PROJECT TITLE: INTERACTIVE DECISION SUPPORT TOOL
FOR LEACHATE MANAGEMENT
PRINCIPAL INVESTIGATOR(S):
Daniel E. Meeroff, E.I. and Ramesh Teegavarapu
AFFILIATION:
Florida Atlantic University
COMPLETION DATE:
05/31/2010 PHONE NUMBER: (561) 297-2658
TAG MEMBERS: Jeff Roccapriore, Joe Lurix, Art Torvela, Sermin Unsal, Ravi Kadambala, Frederick Bloetscher, Amede Dimonnay, Allan Choate, Juan Quiroz, Dan Schauer, Tom Peel, Lee Martin, Lee Casey, Chad Fettrow, James Leavor, Marshall Seymore, Charles Emery, Dan Morrical, John Booth, Ray Schauer, Richard Meyers, Manuel Hernandez, Marc Bruner, Matt Zuccaro KEY WORDS:
Landfills, leachate, advanced oxidation, wastewater, solid waste management, COD, BOD, ammonia, lead, conductivity, TDS, advanced oxidation, titanium dioxide, iron-mediated aeration, sustainability
ABSTRACT (1 page only) According to Nabil Muhaisen (Florida Water Environment Association) and Patrick Victor (American Water Resource Association), today’s need for technological innovation has sparked a technical information revolution of continuouschange and discovery, encompassing all aspects of our lives. To remain at the leading edge of socially and environmentally responsible management of solid waste, tools to evaluate the changes are requied. This report describes the development of web-based, internet-accessible municipal solid waste leachate management decision support tool for solid waste managers, consultants, and regulators. The tool will address the need for: 1) improving the measurement and evaluation of current leachate management practices, 2) improving the design and implementation of new or upgraded systems, 3) improving the regulatory framework to adequately deal with changing technologies and lessons learned, and 4) enhancing access to vital information on leachate management strategies and applications. The key component of the decision support tool will be the online database application that will house a Best Management Practice (BMP) guide. This guide will be constantly updated with information collected from the user profiles entered into the web-based decision support interface, allowing access to the latest information on the performance of new innovative technologies or new applications.

xii
EXECUTIVE SUMMARY 09/01/2008 – 05/31/2010
PROJECT TITLE: INTERACTIVE DECISION SUPPORT TOOL
FOR LEACHATE MANAGEMENT
PRINCIPAL INVESTIGATOR(S):
Daniel E. Meeroff and Ramesh Teegavarapu
AFFILIATION:
Florida Atlantic University
PROJECT WEB ADDRESS:
http://labees.civil.fau.edu
PROJECT TAG MEMBERS: Jeff Roccapriore, Joe Lurix, Art Torvela, Sermin Unsal, Ravi Kadambala, Frederick Bloetscher, Amede Dimonnay, Allan Choate, Juan Quiroz, Dan Schauer, Tom Peel, Lee Martin, Lee Casey, Chad Fettrow, James Leavor, Marshall Seymore, Charles Emery, Dan Morrical, John Booth, Ray Schauer, Richard Meyers, Manuel Hernandez, Marc Bruner, Matt Zuccaro COMPLETION DATE:
05/31/2010
OBJECTIVES The objective of the proposed research is to identify viable options for leachate management and rank them according to sustainability, performance, risk, and preliminary cost criteria. The assessment will not be limited to current practices. Futuristic technologies, such as photocatalytic oxidation using iron-mediated aeration or TiO2-coated magnetite (under development at FAU), as well as technologies not yet developed, must also be able to be evaluated to forecast which alternatives should be employed by the solid waste community in the years to come. Knowledge gained from these studies will also be included in the best management practices (BMP) database for the decision support tool (DST). The assembled matrix of engineering alternatives is innovative, practical, and environmentally-sound. An interactive, web-based decision support tool was developed as a part of the project to aid solid waste managers in long-term decision-making. RATIONALE A major limitation to management of landfill leachate has been the lack of effective methods to guarantee safe long-term discharge back into the natural environment. The extremely variable water quality and generation rates, along with the ever-changing regulatory environment, often complicate conventional treatment technologies and disposal planning. Furthermore, the continual introduction of new chemicals from industry and the ubiquitous detection of pharmaceuticals and endocrine disruptors in natural waters make matters worse. Many times, hazardous pollutants are not known to

xiii
be problematic until ecological damage, often irreversible, has already taken place. The solid waste industry must be proactive in addressing these issues. A common approach for leachate management is discharge to a municipal sewage treatment plant. However, studies have shown that hydraulic loading rates greater than 2% can disrupt plant operations due to high BOD and ammonia content (Booth et al. 1996; Çeçen and Çakıroglu 2001). Site-specific characteristics such as type of waste, amount of waste, age of landfill, local precipitation, local geology, etc., the eventual discharge of the leachate will impact decision-making as to long-term capital investments in treatment. The inherent variability in strength and volume of the waste stream only complicates this issue. From our previous work funded by the HCSHWM, our research team evaluated 23 different engineering alternatives for long-term leachate management. The results of the previous study indicated that the most effective and sustainable strategies involve technologies that can destroy different classes of harmful contaminants all at once, without producing adverse byproducts. One such emerging technology being developed at FAU is aerated photochemical oxidation (APO). This new and innovative process works by using ultraviolet light (energy from sunlight) to activate the surface of a semi-conductor (i.e. titanium dioxide or metallic iron) to produce highly reactive substances derived from water. These reactive radicals rapidly destroy man-made organic chemicals, breaking them down into carbon dioxide, water, and innocuous salts. In addition, it has been discovered recently by a UM-FAU partnership (funded by HCSHWM) that these processes can also remove heavy metals and reduce nitrogen-containing constituents. Thus it may now be possible to eliminate impurities in water all at once using a single process. Great strides are being made in treatment technologies that are capable of turning water into clean-burning fuels using photocatalytic oxidation (Max Planck Institutes for Bioinorganic Chemistry and Coal Research 2007). A byproduct of this process is the purification of the water by destroying organic contaminants and oxidizing inorganics. The potential is for development of a process that can transform a high strength wastewater into a renewable energy source by utilizing the power of the sun and a handful of nano-photocatalyst particles. Florida’s solid waste industry needs better tools the emerging technologies available to address their needs for long-term management of leachate. For example, energized technologies are overlooked due to perceived economic concerns; however, many are becoming economically viable because of more stringent disposal limitations. Solid waste managers must be able to access the existing knowledge base regarding leachate management strategies and expertise gained from their applications and case studies. To have this information in a form that is readily accessible, a comprehensive guidance system that is both vibrant and timely is needed. In a recent survey of tools available for environmental systems analysis, Huang and Chang (2003) highlight the need for the use of emerging tools and decision support systems for modeling and managing environmental systems. This proposal tackles the major technological need for addressing the communication gap in bringing sustainable, economical options for routine leachate management into the hands of the end users in the solid waste management industry.

xiv
METHODOLOGY The first step in this project was to compile the available information and update the technical literature review to develop an extensive list of available and experimental alternatives for dealing with landfill leachate in the long-term. The engineering alternatives were ranked according to selection criteria based on environmental sustainability, efficiency, risk, feasibility, and economic factors. This work also attempted to identify potential issues such as legal, policy, or social barriers to implementation, with input from the project’s technical advisory group (TAG). This stakeholder group was comprised of members from regulatory agencies, water managers, consulting engineers, private industry, as well as other individuals and organizations. Using this information, a database of alternatives (BMP guide) was developed. The intent is to provide a central source of reliable information, reported performance criteria, and technical expertise that can be accessed electronically. First, a set of practical objectives for long-term leachate management were developed with input from the TAG. These included environmental sustainability, efficiency, risk, feasibility, and economic factors. Next, descriptions of processes, data, summary tables, preliminary cost estimates, risk characterizations, feasibility options, and alternative selection criteria matrices for the BMP guide were created and presented for peer-review. Results of the peer review and TAG input resulted in a revised alternative selection matrix that forms the basis of the database component of the decision support tool. The next step was to design the decision tree. To accomplish this task, a user questionnaire was developed and implemented to gather important user characteristics and current solid waste management approaches and information from a representative selection of Florida landfills. Data was discretized into bins (i.e. small, medium, large) constructed using a statistical approach to define categories for the user profile. The adaptive user profile provides a mechanism to develop goal-based objectives and helps the software tool to select BMPs from the database of all disposal options to achieve those goals. The decision tree is dynamic and incorporates a closed-loop adaptive feedback mechanism. It also allows for adjustment of site-specific costs, regulatory, and environmental risk issues (as well as professional judgment), as necessary. The next step was to develop the user interface. This tool is an on-line web-based application with an easily accessible graphical user interface (GUI). To facilitate end user and host management, separate component modules were developed. These include: user login (with necessary security functions), user profile (with site specific queries and adaptable performance measures tracking), BMP module (main content developed in Task 3 with interactive and goal-based functionality), and reporting module (customizable). Finally, the web-based decision support tool requires a host and a manager for launch, so the next step was to identify the host institution needs. Operational aspects such as a reliable environment, support services, server requirements, security issues, database

xv
updates, client information storage, and ownership rights were specified according to the host institution’s needs. After launch, the next step was to identify a user for beta testing and refining of the tool. RESULTS The tool is a knowledge-assisted assessment system and is based on the knowledge acquired from the technical literature, specific documents from existing landfills, surveys of landfill operators, regulators, and consultants, input from technical advisory group meetings, and in-house laboratory experiences. Numerical scores were assigned to each management option analyzed so that they could be ranked according to criteria such as treatment efficiency, footprint, residuals, etc. Next, bins were set up to categorize important user-specific variables such as size of facility, type of leachate, etc. The alternatives were then mapped to the bins, and a set of rules for the knowledge base was created. A user profile interface was created, and the tool was launched privately for initial testing. In the current state, the decision support system tool is sufficient to guide the user to obtain an appropriate management option. However, more guidance is required for the user to assess the site-specific conditions, which may fall in the mid range of two assessment elements used in the DSS. The tool will be continuously updated as more and more knowledge becomes available, and the web-based system will provide the mechanism for user feedback after consulting with the DSS. CONCLUSIONS After evaluating 52 landfills in the State of Florida and evaluating more than 35 engineering alternatives, the research team has developed a decision support tool that will aid solid waste managers in Florida in becoming better informed about the emerging technologies that are becoming available to address their needs for long-term management of leachate.

xvi
INTERACTIVE DECISION SUPPORT TOOL FOR LEACHATE MANAGEMENT
Daniel E. Meeroff Department of Civil, Environmental, and Geomatics Engineering
Florida Atlantic University Boca Raton, FL 33431
Telephone (561) 297-2658
And
Ramesh Teegavarapu Department of Civil, Environmental, and Geomatics Engineering
Florida Atlantic University Telephone (561) 297-3444
State University System of Florida Hinkley Center for Solid and Hazardous Waste Management
University of Florida 4635 NW 53rd Avenue, Suite 205
Gainesville, FL 32653 www.hinkleycenter.org

1
1. INTRODUCTION In Florida alone, over 100 sanitary landfills currently exist, and as of 2004, 64 of those are required to have liners and leachate collection systems to prevent leachate migration into drinking water supplies. This number is expected to continue to grow. A survey of Class 1 landfills in Florida (Tedder 1997; FDEP 2002) found that approximately 750 gallons per acre of variable quality high strength leachate is collected daily. As a consequence of collecting these concentrated volumes of leachate, which contain synthetic organic compounds and heavy metals, the material must be treated and eventually discharged back into the environment. A major limitation to the sustainable management of landfill leachate has been the lack of effective methods to guarantee safe long-term protection of the natural environment once these wastes are released. Further complicating the issue is the extremely variable water quality and waste generation rates, along with the ever-changing regulatory environment, which has caused many conventional technologies to fail in this goal. Current leachate management options include on-site treatment, municipal sewer discharge, natural attenuation, deep well injection, and multi-barrier approaches. Limited studies have indicated that leachate recirculation may also be viable (Reinhart 1996). Regardless of the disposal option, the nature of the leachate waste stream is such that some form of aerobic treatment is required. However, biological treatment is not well-suited for removal of bio-toxics from water. Thus post-treatment, such as activated carbon adsorption, membrane processing, air stripping, or chemical addition may be necessary. Unfortunately, activated carbon and certain advanced treatment processes (i.e. O3) do not adequately address inorganics, and membrane systems or air stripping merely transfer organics to another phase. Furthermore, multiple barrier systems are complicated to operate, costly, and generally inefficient. Clearly, the “one size fits all” approach of the past must be abandoned. What is needed is a groundbreaking new methodology that will allow both regulators and solid waste professionals to keep up to date with the latest practices and operational experiences, at their finger tips, with a web-based decision support tool. 1.1 DECISION SUPPORT TOOLS Currently, too little information is known about emerging treatment technologies and even less is known about the performance of existing systems. A comprehensive survey of innovative decision support and knowledge based systems provided by Fedra (2003) is an excellent source for review of applications of these tools for environmental monitoring and assessment. In the field of water quality assessment for surface water and ground water environments, a number of decision support and expert systems are currently available. For instance, GAIA is a multi-media tool for natural resources management and environmental education (Fedra 1998). SEDSS (Sandia Environment Decision Support System) is a tool for decision makers and provides a basis for quantitative

2
analysis in support of qualitative questions in water quality management. WATERSHEDSS is an expert interface to a database, thus providing decision support in water quality management issues. DESERT (Ivanov et al. 1995) is a decision support system for water quality management in river streams. EXPRES is an Expert System for Assessing the Potential for Groundwater Contamination by Pesticides. CORMIX (Rodriguez et al. 1995) is a water quality modeling and decision support system designed for environmental impact assessment of mixing zones resulting from wastewater discharge from point sources. Fedra and Winkelbauer (2002) discuss the development of a hybrid expert system for environmental and technological risk management. In the field of water conservation, Conserve Florida Water acts a web-based decision support tool for water managers to develop effective and efficient water conservation programs that are site-specific and goal-based (http://www.conservefloridawater.org). A recent decision support assessment system for surface water stream health evaluation, STREAMS (Stream Environment Assessment and Monitoring System) and a knowledge-based systems for identification of modeling tools for watershed modeling, MIST (Model Identification and Selection Tool) (Teegavarapu et al. 2003a, 2003b) were developed by the Co-PI of this project. Screenshots of the decision support systems, STREAMS and MIST are shown in Figure 1 and Figure 2, respectively.
STREAMS
Figure 1. Screenshots of STREAMS decision support system (Teegavarapu et al. 2003b)

3
MIST MIST
Figure 2. Screenshots of MIST decision support system (Teegavarapu et al. 2003b) An exhaustive survey of existing decision support systems revealed that no system exists for identification of best management strategies and solutions for the solid waste industry. The strong motivation for the decision support tool is based on the need to meet two main objectives: 1) the solid waste industry must become better informed about the new technologies and strategies that are becoming available to address their long-term needs and 2) the tool will provide a methodology to design, implement, evaluate, and modify user-specific leachate management programs. The goal is to collect, analyze, and make available technical data for use in developing effective and sustainable long-term solutions for the solid waste management industry. At the heart of the system will be the four module components described in Figure 3.

4
UserInterface
ProfileModule
User Input Profile
UserID
ContactInfo
LandfillType
LandfillAge
WasteGenRate
CurrentTechnology
TrtCapacity
ClimateData
BMPModule
ReportModule
InteractiveGoal-based
Figure 3. Architecture of the decision support tool The tool will be accessed through a user login screen. The solid waste manager will be asked to input a user profile. The user will be prompted to answer detailed questions about critical characteristics needed to assess alternatives. These will include climate conditions, generation rates, waste characteristics, customer characteristics, age of facilities, size, type of landfill, regulatory requirements, costs of operation, and current disposal practices. It will also ask for subjective inputs such as desired range of costs and technologies to exclude. During the consultation phase, the tool elicits the user’s objectives, resources, preferences, constraints, etc. that must be factored into the selection of the appropriate strategies for a particular application. As a knowledge-based system, the tool balances the multiple criteria that need to be weighted and prioritized to choose the best strategies from the BMP guide. The user profile will interface with the BMP database and match the best fit technologies to generate a recommended set of alternatives. Once the appropriate technology has been selected by the user and implemented, its performance must be tracked against the initial goals set by the user profile. The user will continue to update the profile with specific measures to provide the feedback necessary to keep the BMP database and ranking system current, thus closing the loop. Performance measures can then be assessed against other participating facilities, which will allow the database to be continually refined and adjusted to be as realistic and as useful as possible. 1.2 RATIONALE A major limitation to management of landfill leachate has been the lack of effective methods to guarantee safe long-term discharge back into the natural environment. The extremely variable water quality and generation rates, along with the ever-changing

5
regulatory environment, often complicate conventional treatment technologies and disposal planning. Furthermore, the continual introduction of new chemicals from industry and the ubiquitous detection of pharmaceuticals and endocrine disruptors in natural waters further complicate the issue. Many times, hazardous pollutants are not known to be problematic until ecological damage, often irreversible, has already taken place. The solid waste industry must be proactive in addressing these issues. A common approach for leachate management is discharge to a municipal sewage treatment plant. However, studies have shown that hydraulic loading rates greater than 2% can disrupt plant operations due to high BOD and ammonia content (Booth et al. 1996; Çeçen and Çakıroglu 2001). Depending upon site-specific characteristics such as type of waste, amount of waste, age of landfill, local precipitation, local geology, etc., the eventual discharge of the leachate and the strategies for long-term management will be affected. From our previous work funded by the HCSHWM, our research team evaluated 23 different engineering alternatives for long-term leachate management. The results of the previous study indicated that the most effective and sustainable strategies involve technologies that can destroy different classes of harmful contaminants all at once, without producing adverse byproducts. One such emerging technology being developed at FAU is aerated photochemical oxidation (APO). This new and innovative process works by using ultraviolet light (energy from sunlight) to activate the surface of a semi-conductor (i.e. titanium dioxide or metallic iron) to produce highly reactive substances derived from water. These reactive radicals rapidly destroy man-made organic chemicals, breaking them down into carbon dioxide, water, and innocuous salts. In addition, it has been discovered recently by a UM-FAU partnership (funded by HCSHWM) that these processes can also remove heavy metals and reduce nitrogen-containing constituents. Great strides are also being made in treatment technologies that are capable of turning water into clean-burning fuels using photocatalytic oxidation (Max Planck Institutes for Bioinorganic Chemistry and Coal Research 2007). A byproduct of this process is the purification of the water by destroying organic contaminants and oxidizing inorganics. Florida’s solid waste industry needs better tools that are becoming available to address long-term management of leachate. For example, too little information is known about emerging energized treatment technologies. Often energized technologies are overlooked due to perceived economic concerns; however, many are becoming economically viable because of more stringent disposal limitations. For instance, in 2004, Polk County was hauling its 70,000 gpd of leachate 270 miles at $0.13-0.22/gallon bringing the cost of leachate disposal to at least $3.3 million per year for the County, while the price tag for other on-site treatment technologies can be one order of magnitude less in many instances. Solid waste managers must be able to access the existing knowledge base regarding leachate management strategies and expertise gained from their applications and case studies. To have this information in a form that is readily accessible, a comprehensive guidance system that is both vibrant and timely is needed. In a recent survey of tools

6
available for environmental systems analysis, Huang and Chang (2003) highlight the need for the use of emerging tools and decision support systems for modeling and managing environmental systems. 1.2.1 Practical/specific benefits for end users In the field of water conservation, managers have the Conserve Florida program for technical support. However, in the field of solid waste management, no such comprehensive knowledge and data-based clearinghouse exists. Drawing upon the experience of the William H. “Bill” Hinckley Center for Solid and Hazardous Waste Management, the regulatory agencies, the State university system, and other sources, the integrated State-wide decision-support tool developed here will become the premier resource in the country for the collection, evaluation, and dissemination of information on leachate management practices and their effectiveness. It will be a means to obtain technical assistance for selecting and implementing the most effective management practices to meet applicable regulatory requirements. It will also provide waste management professionals with the analytical tools necessary to increase the access to technical information on the operation and effectiveness of the latest, state-of-the-art technologies for long-term management of solid waste. Outreach activities will be conducted to make facilities, regulators, and other interested parties aware of the service, and training can be conducted through web-casting and online seminars. The final product will be useful in teaching/training both inside and outside the university environment. The establishment of a technical information center, which can be accessed electronically, that contains an up-to-date database on leachate management practices and their effectiveness, will be a valuable tool for waste management agencies, industry, academia, and users from all over the country to help reduce the long-term threat to human health and the environment from leachate. Finally, the proposed project is an excellent opportunity to engage students, engineers, consultants, members of the community, and other stakeholders in working together on important solid waste management issues. Through development of the database application, solid waste managers and stakeholder groups will be defining and refining the research agenda and outlining the path to future breakthroughs in the solid waste management field. 1.3 MUNICIPAL SOLID WASTE MANAGEMENT October 21, 1976, the Resource Conservation and Recovery Act (RCRA) defined solid waste as:
“Any garbage, or refuse, sludge from a wastewater treatment plant, water supply treatment plant, or air pollution control facility, and other discarded material, including solid, liquid, semi-solid, or contained gaseous material resulting from industrial, commercial, mining, and agricultural operations, and from community activities.” (40 CFR Part 257)
Municipal solid waste may be defined as waste gathered by, or on behalf of,

7
municipalities. These generally originate from households and institutions such as schools, hospitals, and government buildings. However, comparative data are often difficult to interpret since different types of wastes are collected from different types of generators. The main compositional categories of municipal solid waste are paper and cardboard, organic wastes such as food and garden waste, plastics, metals, glass, textiles and other miscellaneous fractions of material (Williams 2005). Every two years, the United States Environmental Protection Agency (USEPA) updates information pertaining to the benefits of recycling, as well as data on waste generation, recycling, and disposal. According to the USEPA, the United States generated approximately 254 million tons of municipal solid waste, before recycling, in 2007 (USEPA 2007). Figure 4 illustrates the composition of waste materials generated in 2007.
Figure 4. Waste composition of materials generated in the United States in 2007 (USEPA 2007). In terms of municipal solid waste management, the priority is to reduce the amount of waste landfilled or more generally to reduce the amount of waste generated. To do so, waste should be managed in the following order of preference:
1. Source reduction 2. Reuse

8
3. Recycling and composting 4. Energy recovery 5. Treatment 6. Containment 7. Disposal in sanitary landfills
At this time, landfill disposal remains the most common approach. 1.3.1 Generation and disposal Florida must deal with 35 million tons of municipal solid waste each year, or about 10.5 pounds per person per day. Approximately 65% of this material ends up in landfills. 1.3.2 Landfills Ultimately something must be done with the solid waste fraction that can not be recycled or separated at a materials recovery facility and the residual fraction that remains after resource recovery and waste to energy facilities. This remaining material must be disposed of on land, which may be the least desirable means of dealing with solid waste. The disposal of waste on land has been an important method of waste disposal ever since the volume of waste generated has been sufficiently large enough to warrant specific consideration. Since the late 19th century, the volume of waste generated has increased considerably and has led to the allocation of property specifically allocated for the purposes of solid waste disposal. Landfilling describes the controlled disposal of solid waste on land. Sanitary landfills refer to engineered facilities designed for the safe, reliable, long-term disposal of municipal solid wastes, which are operated in accordance with federal regulations (RCRA Subtitle D and 40 CFR 258) to minimize public health and environmental impacts. The USEPA classifies landfills into two different types according to the kind of wastes they contain:
1. Solid Waste Management (MSW) Landfills: These include municipal solid waste, industrial waste, construction and demolition (C&D) debris, and bioreactors. Typically, MSW consists of food and garden wastes, paper products, plastics and rubber, textiles, wood, ash (in the case of a co-disposal landfill), and the soils used as daily cover material.
2. Hazardous Waste Land Disposal Units (secure landfills): These include
surface impoundments, waste piles, injection wells, and other geologic repositories specifically designed to handle hazardous materials that are corrosive, reactive, toxic, or flammable.
Rule 62-701.340(3) of the Florida Administrative Code adds another classification of MSW landfills (FDEP 2002):

9
1. Class I landfills, which receive an average of 20 tons or more of solid waste (non-hazardous household, commercial, industrial and agricultural wastes) per day.
2. Class II landfills, which receive an average of less than 20 tons of solid waste
(non-hazardous household, commercial, industrial and agricultural wastes) per day.
3. Class III landfills, which receive only wastes designated as Class III. They
contain only construction and demolition debris, yard trash, processed tires, asbestos, carpet, cardboard, paper, glass, plastic, furniture other than appliances, or other materials approved by the FDEP, which are not expected to produce leachate but pose a threat to public health or to the environment. These wastes do not contain putriscible household solid waste.
4. Ash monofills, which receive ash from waste-to-energy facilities exclusively.
Three construction methods are typically utilized:
1. Excavated cell/trench method. Soil is excavated and used as daily and final cover. Wastes are placed in the trench or cell and when they are full, a new cell is constructed.
2. Area method. Where the terrain is not suitable for excavation (ground water table
very high like in many parts of coastal Florida), the soil is not excavated and waste is piled above the ground on top of a soil liner. The waste is piled to a prescribed height, and when that level is reached, a new cell is constructed.
3. Canyon/depression method. For this method, canyons, ravines, dry pits, and
quarries are filled with wastes. Federal and state regulations govern where a modern sanitary landfill can be sited and how it should be constructed and operated to protect human health and the environment. Sanitary landfills are required to be constructed with a number of safeguards, including liners, leachate collection systems, odor control systems, gas monitoring equipment, as well as methane recovery systems, ground water monitoring systems, and other equipment depending on the type of waste being managed. For instance, the FDEP began requiring liners for Class I and II landfills (the classification of landfills is given in the next paragraph) in 1985. Today, Rule 3 of Section 62-701.400 - Landfill Construction Requirements of the Florida Administrative Code, requires that sanitary landfills shall be constructed with composite or double liners and a leachate collection and removal system without distinguishing the class of the landfill. Nevertheless, the FDEP shall exempt Class III landfills from some or all of the requirements for liners, leachate controls, and water quality monitoring if the applicant demonstrates that no significant threat to the environment will result from the exemption based upon the types of waste received, methods for controlling the types of waste disposed of, and the results of mandated

10
hydrogeological and geotechnical investigations. Once a landfill reaches its permitted capacity, it may be expanded if a new permit can be obtained or it is closed and capped. Closed landfills are then monitored to be sure that the aging process and long term performance are managed properly. Research in this field is ongoing to better define the necessary timeframe of long term monitoring. Even after closure, contamination of soil and ground water is still a potential issue. When no potential hazard is detectable from ground water monitoring programs, a sanitary landfill can eventually become a new resource for the community (e.g., golf courses or recreation parks). For all types of sanitary landfills, complying with the regulations, whether designing a new unit or monitoring an old facility requires several equally important steps. The Decision Maker’s Guide to Solid Waste Management – Vol. II (O’Leary et al. 1995) reports a set of nine critical steps for proper management of solid waste:
1. Establish a leachate management plan
2. Institute a groundwater monitoring program
3. Set up a gas management plan
4. Prepare landfill final cover specifications
5. Obtain closure plan approval
6. Establish financial assurance for closure and post-closure care
7. Operate and construct the landfill
8. Close the landfill
9. Provide long term post-closure care
Regulations are regularly updated according to new science, which enhances our understanding of the long term impacts of solid waste management and the introduction of new technologies, which allow greater control of long term management. In 2002, the State of Florida had 60 Class I landfills, no Class II landfills, 34 Class III landfills, and 11 ash monofills (FDEP 2003). As of 2008, in Florida there are now a total of 96 active landfills of which 52 are Class I and the remaining 44 are Class III. At this time Florida does not have any active Class II landfills. There are also 12 active ash monofills in Florida (Table 1).

11
Table 1. Average tons per year of Florida ash monofills from 1993-2003 (FDEP 2004). Facility Name Average (tons per year) 1993‐2003
Bay County Resource Facility 64,030 Dade County Resources 136,694 Hillsborough County Solid waste 89,315 Lake County Solid Waste 41,238 Lee County Solid Waste 87,941 McKay Bay Refuse to Energy 84,302 North Broward County 232,389 North County Regional 122,547 Pasco County Solid Waste 82,465 Pinellas County Resource 214,253 South Broward County 236,799 Southernmost Waste to Energy 13,077
The major concerns arising from landfilling of municipal solid waste are related to: 1) uncontrolled releases from landfill gases that might cause odor or other potentially health-threatening conditions, 2) climate change impacts of landfill gases as greenhouse gas emissions, 3) breeding and harboring disease vectors, and 4) uncontrolled releases of leachate that might migrate to contaminate downstream ground or surface waters. 1.4 LANDFILL LEACHATE 1.4.1 Definitions According to 40 CFR Part 257, leachate is defined as any liquid that has passed through or emerged from solid waste and contains soluble, suspended or miscible materials removed from such wastes. Leachate is the liquid that percolates through the landfill and is captured by the leachate collection system in the case of modern sanitary landfills or directly transmitted to the ground beneath the bottom of a landfill in the case of older landfills and dumps. Leachate consists of: 1) primary leachate, which is the liquid content of the waste placed in the landfill that percolates through the waste by the force of gravity, 2) secondary leachate, which is formed when water entering the landfill (principally from precipitation) percolates through the portions of the landfill that are not capped and becomes contaminated via contact with the contents of the landfill, and 3) metabolic water, which is created by the microbial degradation of waste materials over the active life of the landfill. Regardless of the source of the water, basically landfill leachate is a high strength wastewater characterized by high levels of organic constituents and ammonia. The composition of municipal landfill leachate exhibits noticeable temporal and site-specific

12
variation in chemical and microbiological characteristics, attributable to a combination of factors including landfill age, type of waste, moisture availability, temperature, pH, depth of fill, and compaction (USEPA 1995; Viraraghavan and Singh 1997). A waste stream also potentially contains toxic contaminants such as arsenic or lead. Untreated leachates can permeate into the ground water or mix with surface waters and contribute to the pollution of soil, ground water, and surface water. Additionally, leachate may be malodorous. The leachate will contain dissolved and suspended materials (organic or inorganic compounds, such as heavy metals, ammonia, dissolved and suspended solids, COD and BOD, etc) simultaneous and interrelated physical, chemical and microbial reactions in the decomposing MSW layers within the landfill. More details of the composition of leachate will be described later. 1.4.2 Typical leachate volumes generated The quantity of leachate that is formed is a direct function of the amount of external water entering the landfill. The volume of leachate generated is also linked to the type of landfill construction (degree of compaction), its age (degree of decomposition), size (physical area), waste composition (type of waste disposed and moisture content), inflows (surface runoff, infiltration, and ground water intrusion), and climatic conditions (rainfall, humidity, temperature, evaporation, evapotranspiration) (Lema et al. 1988; Méndez-Novelo et al. 2005; Renou et al. 2008). For example, a large operating landfill site will produce a greater amount of leachate than a small closed site. The South Dade landfill in Miami-Dade County, with an area of 142 acres (of which 46 acres are closed, 46 acres are at final elevation and are undergoing closure, and 50 acres are actively receiving solid waste), generates an average flow of approximately 25,000 gpd with a range of 0 to 40,000 gpd during the dry season. However, during the wet season, the average flow is approximately 150,000 gpd per day with a range of 75,000 to 320,000 gpd, and up to 1.0 million gallons per day (MGD) of leachate during extraordinary rain events. The Class I landfill of the Solid Waste Authority of Palm Beach County has a surface area of approximately 2260 acres. During the period from October 2004 to August 2005, the average volume of leachate produce per day was 214,500 gallons. Leachate generation varied from 130,900 gpd in December 2004, up to 323,000 gpd in July 2005. However, for the period from October 2006 to April 2007, the average volume of leachate produced per day was only 179,500 gallons with a variation from 89,500 gpd in January 2007, up to 244,300 gpd in October 2006. A landfill in Brazil (Gramacho Municipal Landfill in Duque de Caxias, a city in the Rio de Janeiro state) located in a tropical climate region similar to South Florida reportedly produces 800 m3 (210,000 gallons) of leachate per day (Bila et al. 2005).
Leachate generation data is generally not routinely recorded (Winthelser 1998); therefore, quantity data are extremely difficult to collect. As a result, leachate quantity is difficult to predict, and volumes are highly variable (Méndez-Novelo et al. 2005). The major issue with leachate management is the contamination of both ground water and eventually surface water (contamination of surface water is less likely to occur because

13
the main flow direction of leachate is vertical and South Florida has very little elevation difference). With new sanitary landfills, risks of contamination are limited by multiple engineered liners (clay and/or geosynthetic liners are commonly used). But historically, most landfills (or open dumps) were built without liners or leachate collection systems, and leachate still continues to be discharged directly into the ground from those older facilities. The liner system is an important part of the leachate collection system. The role of the collection system is to collect and remove the leachate from the base of the landfill. It should also prevent the contamination of the surrounding environment. Holding and treatment facilities are also an important part of the leachate collection system. Great care must be taken to connect these elements to an enclosed system to prevent any seepage from contaminating the ground water or soil beneath the liner. Tedder (1997) obtained leachate flow data from 9 active double-lined sanitary landfills in Florida (24 active cells). These cells ranged in size from 4.5 – 20 acres. A summary of the leachate measured on top of the primary liner system (leachate collection system) and the leachate measured between the primary and the secondary liner for each cell (leachate detection system) is shown in Table 2. The amount of rainfall recorded over the period correlates well with the observed average leachate generation. Averaging the primary and secondary liner values provides 770 gpd/acre of leachate. A portion of the contaminants may remain in the soils because of their physical-chemical properties. Eventually, leachate leaks can also be responsible for the generation of landfill gas outside of the perimeter of the landfill (Robinson et al. 1992). Clearly, leachate management is dependent upon the nature and concentration of specific constituents. If leachate reaches a water body, impacts can range from rapid oxygen depletion, changes in the fauna and flora, and aquifer or soil strata contamination with potential migration of the pollutant plume offsite (Bruner et al. 2002).

14
Table 2. Leachate generation (in gallons per day per acre) from Florida double-lined landfills, adapted from Tedder (1997) Rainfall Leachate Collection
System (1° liner) Leachate Detection System (2° liner)
Characteristic (inches) Range Average Range Average
Central Disposal Stage 1 34.5 910 – 4876 2155 9.5 – 276 77.0 Central Disposal Stage 2 34.5 683 –1313 958 32 – 130 90.0 Central Disposal Stage 3 34.5 604 – 6462 2634 22 – 340 127.0 Broward Interim cont. – Cell 1‐A 313.5 ‐‐ ‐‐ 0 – 75 7.7 Broward Interim cont. – Cell 1‐B 313.5 ‐‐ ‐‐ 0 – 66 11.0 Broward Interim cont. – Cell 3‐A+B 92.4 ‐‐ ‐‐ 12 – 82 28.6 Winfield Landfill – Cell 1 109.2 112 – 11,875 9712 0 – 39 1.5 Medley Expansion – Cell 1 83.0 707 – 1421 812 133 – 677 458.0 Medley Expansion – Cell 2 83.0 179 – 440 259 53 – 96 76.5 Medley Expansion – Cell 3 83.0 306 – 539 355 58 – 151 113.4 Trail Ridge Landfill – Cell A 71.4 55 – 224 118 0 – 4.7 2.2 Trail Ridge Landfill – Cell B 71.4 107 – 1126 429 0.4 – 130 18.2 Trail Ridge Landfill – Cell C 12.6 230 – 450 314 55 – 82 66.3 Baseline Landfill – Cell III‐A 124.5 59 – 1882 201 1.1 – 38 14.0 Baseline Landfill – Cell III‐B 124.5 107 – 778 378 0.3 – 113 24.5 Berman Road Landfill – Cell 3 NR 864 – 3429 1838 0 – 19 3.4 Berman Road Landfill – Cell 7 NR 373 – 1926 789 0 – 5.7 0.6 Site 7 Landfill – Cell A‐A 96.0 NR NR 1.7 – 8.2 3.8 Site 7 Landfill – Cell A‐B 96.0 NR NR 2.7 – 3.6 3.1 Site 7 Landfill – Cell A‐C 96.0 NR NR 3.8 – 6.2 4.9 Site 7 Landfill – Cell A‐D 96.0 NR NR 6.0 – 10.7 7.8 Site 7 Landfill – Cell A‐E 96.0 NR NR 3.3 – 34 10.5 West Pasco Landfill – Cell A‐1 132.8 NR NR 1.6 – 12.3 6.3 West Pasco Landfill – Cell SW‐1 132.8 NR NR 2.1 – 11.1 5.7
TOTALS Avg=107 s=82
Min=55 Max=11,875
Avg=1497 s=2493
0 – 677 Avg=48 s=95
1.4.3 Typical leachate composition While in operation, a landfill is constructed during several decades in a series of cells. Consequently, it contains wastes of completely different ages and different stages of decomposition. In general, landfill maturity can be classified into different phases. Pohland and Harper (1986) divided the life cycle of a landfill into five successive stages:
1. Initial adjustment phase (I). During this phase, which takes place just after the placement of the refuse in the landfill, the aerobic biodegradation of organic compounds occurs. The daily soil cover is the main provider of the organisms responsible for this decomposition.
2. Transition phase (II). The air trapped inside the landfill is depleted and
anaerobic conditions develop rapidly. If leachate is produced, the pH decreases due to the production of organic acids and CO2 within the decomposing waste, as a result of anaerobic microbial activity.

15
3. Acid phase (III). This phase is the continuation of the previous transition phase
along with the production of organic acids. As a result, the pH is rapidly reduced, H2 gas is generated, and both biochemical and chemical oxygen demand (BOD and COD) increase during this phase. The low pH also dissolves inorganic constituents such as metals, which increases the conductivity and total dissolved solids (TDS).
4. Methane fermentation phase (IV). During this phase, certain microorganisms
convert the organic acids into CH4 and CO2. As the organic acids are consumed, the pH rises to a more neutral value, and BOD, COD, conductivity, and metals content decreases.
5. Maturation phase (V). This phase begins when all the available biodegradable
materials have been converted into CH4 and CO2. The leachate produced is weaker in terms of contaminant concentrations, and the BOD5/COD ratio is very low.
Figure 5 shows the typical composition of leachate according to the different phases. The duration of the phases described above varies because of the construction process of the landfill. For example, a new cell can be placed on top of one which is already in the third phase. The resulting leachate will be a mixture of the characteristics of the two phases.
I II III IV V
Phases
Time
Lea
chat
e C
har
acte
rist
ics
COD
Metals
pH
Figure 5. Role of phases in the leachate composition (adapted from Tchobanoglous and Kreith 2002) A classification scheme has been proposed by Amokrane et al. (1997). They compared various types of landfills according to their age and leachate water quality. This

16
classification is worth mentioning because they also specified the efficiency of different treatment techniques according to the types of landfill generating the leachate in their study. Table 3 summarizes their findings. The pH of leachate is typically in the range of 5.8–8.5, which is due to the ongoing biological activity. The ratio of BOD/COD, from 0.70 to 0.04, decreases rapidly with landfill age. This is due to the release of large recalcitrant organic molecules from the solid wastes. Consequently, older landfill leachate is characterized by its low BOD/COD ratio and relatively high NH3-N (Renou et al. 2008; Englehardt et al. 2006).
Table 3. Leachate classification, adapted from Amokrane et al. (1997) Characteristic Young Leachate Medium Leachate Mature Leachate
Landfill age (years) < 5 yrs 5 – 10 yrs >10 yrs Landfill type Biodegradable Intermediate Stabilized pH < 6.5 6.5 – 7.5 > 7.5 COD (mg/L) >10,000 5000 – 10,000 < 5000 BOD5/COD ratio > 0.5 0.1 – 0.5 < 0.1
When liquid water percolates through MSW that is undergoing decomposition, both biological and chemical constituents are leached into solution. Several reviews have been conducted with the goal of collecting information regarding leachate composition according to the location (i.e. the climate and especially the precipitation rate), the age of the landfill, or the type of wastes. Different data sets are available from different parts of the world (Akesson and Nilsson 1997, Al-Yaqout et al. 2005, Amokrane et al. 1997, Bekbölet et al. 1996, Bernard et al. 1997, Bila et al. 2005, Calli et al. 2005, Geenens et al. 2000, Gonze et al. 2003, Hickman 2003, Imai et al. 1998, Ince 1998, Kim et al. 1997, Kjeldsen et al. 2002, Lin et al. 2000, Mohammad et al. 2004, Moraes and Bertazzoli 2005, de Morais and Zamora 2005, O’Leary and Walsh 1995, Oweis and Kehra 1998, Tammemagi 1999, Tatsi et al. 2003, Tchobanoglous and Kreith 2002, Reinhart and Grosh 1998, Reinhart and Townsend 1998, Silva et al. 2003, Silva et al. 2004, Statom et al. 2004, Steensen 1997, Ward et al. 2002, Westlake and Phil 1995, Wichitsathian et al. 2004, Wu et al. 2004, Youcai et al. 2002) and are summarized in Table 4. Table 4. Typical leachate water quality data from young and mature landfills (Tchobanoglous, Theisen, and Vigil 1993) Constituent Units Young Mature
Ammonia‐nitrogen mg/L as NH3‐N 10 – 800 20 – 40 BOD5 mg/L as O2 2000 – 30,000 100 – 200 COD mg/L as O2 3000 – 60,000 100 – 500 Iron (Fe) mg/L 50 – 1200 20 – 200 pH pH units 4.5 – 7.5 6.6 – 7.5 Alkalinity mg/L as CaCO3 1000 – 10,000 200 – 1000 TSS mg/L 200 – 2000 100 – 400

17
Other important constituents include: i) dissolved organic matter from methane (CH4) to volatile fatty acids (VFA) to more refractory humics and fulvics; ii) inorganic constituents, such as calcium (Ca2+), magnesium (Mg2+), sodium (Na+), potassium (K+), ammonium (NH4
+), iron (Fe2+), manganese (Mn2+), chloride (Cl−), sulfates (SO42-) and
bicarbonates (HCO3-) with heavy metals (arsenic, cadmium, chromium, cobalt, copper,
lead, mercury, nickel and zinc), in the microgram per liter range; iii) xenobiotic organic compounds from domestic and industrial sources, comprised of a broad variety of aromatic hydrocarbons, phenols, endocrine disrupting compounds (EDCs), pharmaceuticals, personal care products, pesticides, and chlorinated aliphatics among others. 1.4.4 Constituents of concern, health risks, and environmental impacts The available leachate quality data sets all lead to the same conclusion: the composition of leachate is highly variable and site specific. Differences can be as high as several orders of magnitude. According to 40CFR Part 258 – Criteria for Municipal Solid Waste Landfills, typical constituents of concern for monitoring programs include: pH, conductivity, dissolved oxygen, dissolved solids, biochemical oxygen demand, chemical oxygen demand, organic carbon, nutrients (ammonia, total kjeldahl nitrogen, total phosphorus), common ions, heavy metals, and organic priority pollutants. In this study, emphasis is placed on the following environmentally significant parameters of leachate quality: ammonia, BOD5, COD, TDS, and heavy metals concentration, as described in more detail below:
1. Ammonia (NH3) is a gas at standard temperature and pressure. It is mainly used
to produce fertilizer and is generated during the anaerobic digestion of organic material. As it has a high solubility in water, ammonia gas readily transfers to leachate and forms soluble ionized ammonium (NH4
+). According to the USEPA (1986), levels of ammonia in the environment as low as 0.0017 mg/L are acutely toxic to freshwater fish. In leachate, it is thought that high levels of ammonia can originate from nitrogen-containing wastes mainly via the decomposition of protein. The majority of the total Kjeldahl nitrogen (TKN) found in leachate is typically in the form of ammonia, which can range from 0.2 to 13,000 mg N/L (Renou et al. 2008). Average ammonia-nitrogen in leachate may be present in concentrations on the order of 2000 mg/L (Englehardt et al. 2006). Levels this high are lethal to certain organisms. Furthermore, ammonia concentrations may persist in the leachate with time. This is why ammonia has been regarded as one of the most problematic constituents in leachate (Kjeldsen et al. 2002).
2. Biochemical Oxygen Demand (BOD5) is a test used to measure the
concentration of biodegradable organic matter present in a sample of water. It is the amount of oxygen that would be consumed if all the biodegradable organics were oxidized by microorganisms.
3. Chemical Oxygen Demand (COD) is a test used to indirectly measure the
amount of organic compounds (both recalcitrant and biodegradable). It is the

18
amount of oxygen that would be consumed if all the organics were oxidized by a strong chemical oxidant such as dichromate (Cr2O7
2-). Specific organics such as phthalate esters, volatile aromatics, aromatic sulphonates, chlorinated volatile hydrocarbons, phenols, cresols, and numerous other organic pollutants have been identified in various concentrations in landfill leachate (Jimenez et al. 2002).
4. Total Dissolved Solids (TDS) are the total amount of charged ions, including
minerals, salts, or metals dissolved in water. TDS is directly related to the purity of water and its electrical conductivity. Excess dissolved solids are objectionable in drinking water because of possible physiological effects, unpalatable mineral tastes, and higher costs because of corrosion or the necessity for additional treatment.
5. Heavy metals include some of the trace metals such as cobalt, copper,
manganese, vanadium, or zinc, which are required as micronutrients to sustain microbial populations, but excessive levels can be detrimental. Other heavy metals such as mercury, lead, or cadmium have no known vital or beneficial effect on microorganisms, and their accumulation over time are biotoxic and can cause serious illness in human populations. Heavy metals can be a significant concern in leachate, although Kjeldsen et al. (2002) reported that metals in leachate were found at concentrations at or below drinking waster standards due to adsorption, precipitation and complexation processes occurring in the landfill. For example, chemically treated wood makes up about 6% of the wood waste stream in Florida, and this fraction is projected to increase to 25-30% by 2020 due to disposal of aging structures (Englehardt et al. 2006). Ash from the combustion of a wood solid waste containing as little as 6% CCA treated wood will fail the toxicity characteristic leaching procedure test (TCLP) according to Hinkley (2003), indicating that ash monofill leachate contains copper, chromium, and arsenic (CCA), and this material will also generate arsenic-contaminated leachate. Another source of toxic metals is electronic waste, potentially contributing lead, nickel, cadmium, and others to the leachate.
Taken together, these key constituents represent the potential for multiple chemical toxicity with synergistic, carcinogenic, and acutely toxic and genotoxic consequences (Park and Batchelor 2002). More than 100 hazardous chemicals have been isolated and identified in landfill leachate including aromatics, halogenated organics, phenols, pesticides, heavy metals, endocrine-disrupting compounds, pharmaceuticals, personal care products, and ammonium (Foo and Hameed 2009). Many of those on the list are capable of bioaccumulation, persistence, and reactivity in the environment. Toxicity studies confirmed the presence of 133 different chemicals, of which 24% were carcinogenic, 16% were mutagenic, and 8% were teratogenic (cited in Foo and Hameed 2009). However, toxicity tests conducted with Daphnia (Atwater 1983), freshwater fish (Wong 1989), luminescent bacteria (Devare and Bahadir 1994) and other organisms found that ammonia-nitrogen is the dominant constituent with regards to toxicity. Table 5 summarizes the variability of constituents found in leachate. Specific conditions

19
are not indicated in the table, as the summary serves point out the wide variety of leachate water quality that can be found. Table 5. Extreme values for the composition of leachate developed through review of technical literature Concentration Parameters Units Range Average Median
Ammonia mg/L as NH3‐N BDL* ‐ 8750 830 750BOD5 mg/L as O2 BDL* ‐ 80,800 4000 190COD mg/L as O2 0.4 – 152,000 10,300 4200Conductivity μS/cm 5.2 – 95,000 13,100 8,600 Lead (Pb) mg/L BDL* ‐ 5.0 0.1 0.1pH pH units 2.0 – 11.3 7.5 7.5TDS mg/L 0.1 – 88,000 11,000 7600TSS mg/L 10 – 45,000 840 950BDL* = below detection limit. Source: Adapted from Akesson and Nilsson (1997), Al‐Yaqout et al. (2005), Amokrane et al. (1997), Bekbölet et al. (1996), Bernard et al. (1997), Bila et al. (2005), Calli et al. (2005), Geenens et al. (2000), Gonze et al. (2003), Hickman (2003), Imai et al. (1998), Ince (1998), Kim et al. (1997), Kjeldsen et al. (2002), Lin et al. (2000), Mohammad et al. (2004), Moraes et Bertazzoli (2005), Morais and Zamora (2005), O’Leary and Walsh (1995), Oweis and Kehra (1998), Tammemagi (1999), Tatsi et al. (2003), Tchobanoglous and Kreith (2002), Reinhart and Grosh (1998), Reinhart and Townsend (1998), Silva et al. (2003), Silva et al. (2004), Solid Waste Authority of Palm Beach County (2006), Statom et al. (2004), Steensen (1997), Ward et al. (2002), Westlake and Phil (1995), Wichitsathian et al. (2004), Wu et al. (2004), Youcai et al. (2002).
For comparison purposes, Table 6 shows the concentrations of the same constituents in a typical medium-strength untreated domestic wastewater and average concentrations of leachate. Table 6. Comparison of the composition of untreated domestic wastewater and leachate Concentration Parameters Units Medium
Strength Typical Leachate
Florida Leachate
Wastewater** (from Table 5) Average Range
Ammonia mg/L as NH3‐N 25 830 500 BDL* – 1350BOD5 mg/L as O2 190 4000 150 BDL* – 445COD mg/L as O2 430 10,300 3000 55 – 14,000Conductivity μS/cm Not reported 13,100 11,600 1000 – 95,000Lead (Pb) mg/L Not reported 0.1 0.03 BDL* – 0.1pH pH units 7.0 7.5 7.5 2.0 – 11.3TDS mg/L 500 11,000 9300 900 – 88,000TSS mg/L 210 840 ‐‐ ‐‐BDL* = below detection limit. ** Adapted from Metcalf and Eddy 2003

20
It is clear that leachate is a highly concentrated waste stream. Compared to typical medium strength domestic wastewater, leachates contain similar constituents but at 1-2 orders of magnitude higher. The average TDS and TSS concentrations in leachate are respectively 22 and 4 times larger than medium strength wastewater, ammonia is 33 times more concentrated in leachate, and BOD5 and COD are about 24 and 21 times larger in leachate than in the medium strength wastewater. The data collected emphasize the site specificity and the wide variability of leachate composition already outlined. This simple comparison demonstrates the obvious necessity of leachate treatment, when compared to raw sewage. It is suggested that that management of leachate will require treatment prior to safe discharge to the environment. However due to the elevated concentrations of certain constituents, the efficiency of the currently available treatment processes may not be sufficient to achieve the regulated (or target) effluent quality. As this research addresses leachate specifically from Florida, the literature review was particularly focused on collecting data from Florida landfills. Previous research conducted by Ward et al. (2002) and Statom et al. (2004) among others were considered. In addition, data was collected from the Solid Waste Authority of Palm Beach County (leachate samples from 2004 to 2005). Several record reviews were conducted with Andrell Maxie at the FDEP Regional Office in West Palm Beach, FL, in addition to online searches using the OCULUS system. Furthermore, several reports were made available to FAU to extract laboratory results of leachate composition from landfills in St. Lucie, Okeechobee, Broward, and Miami-Dade counties, for instance. The results of this literature review are summarized in the Florida averages and ranges for leachate quality in Table 6. The variability in both quality and quantity and the continual generation of leachate over a long period of time are the main issues in determining an effective management approach that includes adequate treatment. The composition of landfill leachate at a particular point in time depends heavily upon the nature of the waste characteristics, including (Kjeldsen et al. 2002; Foo and Hameed 2009):
Degree of contouring and compacting of solid wastes Landfill operation and management (presorting, co-disposal with sludge or ash,
ash monofill, type of daily cover material) Moisture content, temperature, pH, and oxygen level Microbial activity Flowrate of groundwater influx, surface water runoff, leachate recirculation,
washdown water, and landfill irrigation Local precipitation patterns Chemical equilibrium and solubility of key constituents Internal processes such as hydrolysis, adsorption, biodegradation, dissolution,
redox, gas generation, and fate and transport mechanisms Hydro-geological variations Age, maturity, design (size, depth and lining system), and operation of landfill Topography, vegetation, and spatial distribution of sampling points

21
1.5 LEACHATE MANAGEMENT OPTIONS The management of leachate is critically important to eliminating pollution of groundwaters, which may be a source of drinking water for the local population. A number of alternatives have been proposed to manage the leachate that is collected from sanitary landfills. These include: 1) leachate recirculation (bioreactor landfill), 2) evaporation, 3) natural attenuation (e.g., deep well injection, treatment wetlands, reed beds, etc.), 4) hauling off-site, 5) municipal sewer discharge, and 6) on-site pre-treatment prior to discharge. 1.5.1 Leachate recirculation (bioreactor landfills) An effective method for managing leachate is to collect and recirculate the material through the landfill. During the early stages of landfill operation, the leachate will contain important quantities of TDS, COD, nutrients, and heavy metals. When the leachate is recirculated, the constituents are attenuated by the biological activity and by physical-chemical interactions occurring within the young landfill. Leachate recirculation was pioneered in the 1970s. Since then, laboratory, pilot, and full scale studies have been conducted with the goal of converting the landfill into an aerobic bioreactor. Such leachate recirculation has the potential to decrease the stabilization time of landfill leachate from several decades to 2 –3 years, increase methane gas production rates (Tchobanoglous, Theisen, and Vigil 1993), accelerate landfill settlement before final closure, partially treat the leachate, and reduce leachate volumes by evaporation or adsorption in refuse (Diamadopolous 1994; Reinhart and Al-Yousfi 1996). This innovative option consists of the re-injection of the collected leachate back into the landfill so that it percolates again through the waste. By recycling the leachate, the organic load may be reduced by the microorganisms present in the waste. Morris et al. (2003) reported that with the exception of ammonia, it was found that the concentrations of the BOD, heavy metals, chlorinated VOCs, and benzene, toluene, ethylbenzene, and total xylenes (BTEX) were reduced to below drinking water standards after 5 years of closure and following 7 years of leachate recirculation in a MSW landfill facility (located at the Central Solid Waste Management Center in Sandtown, Delaware). Conductivity was reduced from 12,000 to 8,400 μSm/cm2, ammonia was reduced from 600 to 400 mg/L as N, and BOD was reduced by 99% from an initial value of 40,000 mg/L. Pohland et al. (1990) found that when leachate was continuously collected and reapplied to an experimental landfill column, the organic loading decreased to a small fraction of its peak value (i.e. from 20,000 mg/L of COD to less than 1,000 mg/L) in a period of just over a year (cited by Qasim and Chiang 1994). This reduction in leachate strength and quantity has the advantage of lowering the cost of post-treatment. By increasing the moisture content, leachate recirculation enhances the gas generation and improves the rate of landfill stabilization by re-distributing and dissolving food, nutrients, and enzymes for the methanogens; thereby; shortening the waste stabilization time from decades to years (Chan et al. 2002). Recycling leachate is one of the least expensive options (Lema et al. 1988). However, its advantages cannot hide the fact that a recirculation system

22
represents a substantial investment, and depending on the local requirements for post-treatment of leachate may still be necessary if the recirculated leachate does not reach the allowable discharge limits (Lema et al. 1988; Winthelser 1998). Also as long as the bioreactor is in operation, the volume of leachate contained inside the landfill is not reduced since some active cells are still open (not yet capped) and additional precipitation will percolate through those layers of refuse. Furthermore, leachate ponding and surface seeps have been operational challenges, particularly with respect to methanogen inhibition (San and Onay 2001). Moreover, insufficient liquid availability limits applicability of leachate recirculation in dry areas. However, most importantly, recirculation alone does not provide sufficient attenuation of leachate constituents to allow, in many cases, direct discharge of leachate to municipal wastewater treatment facilities within short recirculation times (Wintheiser 1998). 1.5.2 Leachate evaporation Where leachate discharge is not permissible, one of the simplest leachate management systems involves the use of shallow lined lagoons (evaporation ponds). In this approach, natural pond systems are used to concentrate the constituents of the leachate, while reducing the liquid volume through evaporation. The process occurs in lined impervious basins and is highly dependent on climate conditions conducive to promoting rapid evaporation. Temperature, precipitation, wind, and humidity will affect the rate of evaporation. If these conditions are optimal, the process may be a viable solution for separating the water from the leachate contaminants, but it presents several inconveniences. First, the residues have to be properly disposed of because the leachate pollutants are in higher concentration (Di Palma et al. 2002) or in a solid form, but they are not treated and may be considered hazardous. Therefore, post treatment is required. Secondly, natural evaporation ponds are more efficient in arid regions and are not easily applied in Florida due to the tropical weather patterns. In areas with high rainfall, the lined leachate storage facility can be covered with a geomembrane to exclude rain water. However, odorous gases can accumulate underneath this temporary cover and must be vented (e.g. to a compost facility, biofilter, or biogas generator facility). When the pond is uncovered, aeration may be necessary to mitigate odors. Soil beds are typically 2 – 3 ft deep, with organic loading rates of 0.1 – 0.25 lb/ft3 of soil (Tchobanoglous, Theisen, and Vigil 1993). Evaporation can also be executed in a closed reactor, but similar problems would be encountered. Nevertheless, in laboratory testing, distillates containing 99% less COD and 85% less ammonia, along with complete removal of heavy metals can be achieved (Di Palma et al. 2002). In return, the concentrations of the same constituents were much higher in the residue, which is expected since evaporation concentrates the constituents. For instance, COD and Pb were 4 times higher in the evaporation residue than in the initial leachate (Di Palma et al. 2002). Little information is found in the technical literature on leachate evaporation assisted by using heat from landfill-generated methane burners. Leachate evaporation has not been widely implemented historically in Florida, due to weather conditions, operational problems related to gas collection, odor, and process operation and maintenance (Reinhart 2005).

23
1.5.3 Leachate natural attenuation 1.5.3.1 Deep well injection Underground Injection Control (UIC), or deep well injection, is a popular way to rapidly dispose of a waste stream without treatment and without further surface and human contact, if the appropriate geology is present (Saripalli et al. 2000). Little or no treatment may be performed on leachate disposed of in this manner, and therefore the pollution problem is not truly addressed. Costs are on the order of $6 million per well, but the well can dispose of millions of gallons of water each day. Co-location with other entitites needing waste disposal mechanisms (i.e. treated wastewater, membrane concentrate, etc.) would be more efficient. Using this disposal method, constituents of leachate are transferred to the injection horizon, usually with minimal treatment, if at all. All injection programs must meet underground injection control regulations as set forth in CFR 144 and 146. Nearly all states, including Florida, have delegation of the UIC program. The remainder relies directly on federal regulation by the USEPA. Not all places have an available injection horizon – for example, north of the I-4 corridor in Florida, an acceptable horizon is not available. The UIC rules are designed to permit wells only where it can be demonstrated that the injected water will not migrate to an aquifer designated as a potential source of drinking water. In addition, the well must be located close to the disposal source to limit the potential for pipeline leakage. According to the Groundwater Protection Council (2005), in 2004, there were “approximately 190,000 injection wells in the United States that store or dispose of fluids in underground rock formations, keeping the fluids away from underground sources of drinking water.” The number of active deep injection wells for industrial applications included only 819 sites (including industrial, municipal and nuclear sectors) in the US (1986 data). Of those, only 485 were still in operation by 1991. Saripalli et al. (2000) suggested that injection well performance may be subject to a rapid decline in performance if TSS exceeds 50 mg/L in the receiving water of the injection horizon. This is not a problem in southeast Florida where the transmissivity of the formation is almost infinity. One of the landfills selected for this report (Solid Waste Authority of Palm Beach County) disposes of its leachate with a deep injection well. At this facility, leachate is generated from three landfills: 1) closed Class I (Dyer Park), 2) operating Class I, and 3) operating Class III. All three leachates are mixed together (and sometimes diluted with city water or condensate from the waste to energy plant) and sent underground to a formation called the Boulder zone, below all sources of drinking water (the Biscayne aquifer and the upper Floridan aquifer). 1.5.3.2 Treatment wetlands and reed beds Wetlands and aquatic treatment systems are those that use aquatic plants and animals for the treatment or polishing of water. Aquatic treatment covers a broad range of systems including constructed wetlands, subsurface flow systems, floating aquatic plant systems,

24
and a combination of these approaches. In terms of landfill leachate, these types of systems generally target organic matter and suspended solids, although nutrients and metals could theoretically be treated as well. The soluble organics are removed by biological activity and adsorption on plant material and detritus on surfaces and in the water column. Particulate BOD can be trapped by the low velocities and emerging plant vegetation to facilitate sedimentation and filtration. Suspended solids are removed similarly to particulate BOD, and nutrients and metals are removed by plant uptake, adsorption, chemical precipitation, and sedimentation processes. Constructed wetlands have been used for wastewater treatment applications in the past, and Table 7 has a summary of treatment performance characteristics. Reed bed systems are a specialized application of submerged constructed wetlands for wastewater treatment. The reed bed system takes a traditional sand drying bed for wastewater sludge, and instead of removing the dewatered sludge from the drying beds after each application, reeds (Phragmites communis) are planted in the sand. The primary function of the reeds is to create a rich microflora in the root zone to feed on the organic material in the waste. Phragmites reeds have nodes along the stems for secondary root growth and are resistant to contaminants. The roots extend into the sand and pea gravel, but do not penetrate through larger stones, so drainage is unimpaired. Waste may be applied to phragmites reed beds all year round, as long as the reeds are harvested in the fall, leaving their root system intact. The plant material may be composted, landfilled or burned, depending on contaminant concentrations. After about 7 to 10 years, the reed bed is spent and can no longer be loaded. It is then taken out of service for about 6 months so the top layer can stabilize before the bed is emptied. The resulting solid product is dry, friable material similar to compost or topsoil. It is suitable for land application, provided that the contaminant concentrations are within acceptable limits (Outwater 2000). The process has not been put into practice with landfill leachates in Florida, and it is not clear if current rules would allow such a practice. A summary of the currently available performance data based on pilot and full scale systems in place elsewhere is provided in Table 7; however, it is important to note, that these systems are treating wastewater of low to medium strength, not leachate.

25
Table 7. Summary of performance tests conducted with constructed wetlands for wastewater treatment. Wetland Type Location Contaminant Co
(mg/L) Removal (%)
Reference
Free water surface constructed wetlands
Arcata, CA BOD TSS NH4‐N Fecal coliform
26 30 13 3.0x10³
54 53 22 79‐95
Gearheart et al. 1989
Free water surface constructed wetlands
Gustin, CA BOD TSS
75 102
75 70
Crites 1996
Free water surface constructed wetlands
Iselin, PA BOD TSS NH4‐N Fecal coliform
140 380 30 1.5x10⁶
88 86 57 3‐log
Watson et al. 1979
Free water surface constructed wetlands
West Jackson County, MS
BOD TSS
26 40
71 65
USEPA 1993
Free water surface constructed wetlands
Ft. Deposit, AL BOD TSS
33 91
79 86
USEPA 1993
Free water surface constructed wetlands
Sacramento County, CA
BOD TSS NH3‐N Pb
24 9 14 0.85
73 ‐37 49 71
Nolte and Associates 1997
Free water surface constructed wetlands
Mobile County, AL
COD TSS TDS Pb
456 1008 1078 0.08
90 97 63 94
Johnson et al. 1998
Subsurface flow constructed wetlands
Santee, CA BOD 118 88 Gersberg et al. 1985
Subsurface flow constructed wetlands
Mesquite, NV BOD 78 68 Watson et al. 1989
Floating aquatic plant systems (water hyacinth)
San Diego, CA BOD TSS NH3‐N Pb
148 131 21 0.008
91 93 55 93
WCPH 1996
Combination system (living machine)
Frederick, MD BOD 100 95 Living Technologies, Inc. 1997
1.5.3.3 Spray Irrigation The irrigation of landfill leachate by spray or pipe flow systems onto grasslands, woodlands, or peat slopes has been employed in areas where high rainfall leads to the production of large volumes of dilute leachate or where there are appropriate lands suitable for irrigation. The practice has been regarded as a suitable technology for dilute,

26
high volume leachate, and for the polishing of pre-treated leachate. However, applicability is limited by the availability of large vegetated areas near the landfill, generation of aerosols and subsequent exposure of workers and others to hazardous constituents, and by other negative impacts such as leaf damage, premature leaf senescence, and plant attrition (Mensar et al. 1983; Ettala 1988; Wong and Leung 1989; Cureton et al. 1991; Gray et al. 2005). Furthermore, spray irrigation has limited capacity for the removal of recalcitrant organics, relying on a combination of physicochemical and biological processes to provide polishing of biodegradable organics, ammonia, and heavy metals (Maehlum 1995; Martin and Johnson 1995). Most regulatory agencies do not permit this type of disposal, particularly if the underground source of drinking water is located near to the land surface. 1.5.4 Hauling off-site Off-site hauling does not directly address the pollution problem either. The leachate is just moved to another location (generally to a wastewater treatment plant). The option presents a high transportation risk and can be a potentially expensive solution, depending upon the distance, cost, and treatment performance of the facility accepting the material. If the travel distance is relatively short, the costs can be very competitive, and this can be a viable option. But if the site is located at great distances, the costs can be potentially limiting. Therefore, it is important to define a distance scale for comparison of alternatives on equal footing. Trailer trucks can achieve typically 8 miles per gallon fuel efficiency and carry between 150-400 gallons of fuel. Therefore, they can travel long distances on one tank of fuel, but the cost of fuel may be passed on to the landfill manager in the form of a fuel surcharge based on distance traveled from the site of generation to the final disposal site. Henry and Heinke (1989) reported that long-haul trailer units are more economical than smaller trucks, if the average round-trip haul distance is more than 50 km (30 miles). However if the trip is longer than 160 km (100 miles), then it is more cost-effective to use rail. For many of the owner-specified characteristics necessary to permit selection of alternatives, we need to define classification bins. These bins include: 1) short distance, 2) medium distance, 3, long distance, and sometimes 4) super distance. For this report, we are considering the following scales for comparison purposes, depending upon the number of bins desired (Table 8): Table 8. Scale of relative haul distances for comparison purposes.
Category 1‐Short 2‐Medium 3‐Long 4‐Super
3 bin approach < 30 mi (< 48 km)
30 – 100 mi (48 – 160 km)
> 100 mi (> 160 km)
n/a
4 bin approach < 30 mi (< 48 km)
30 – 75 mi (48 – 120 km)
75 – 150 mi (120 – 240 km)
> 150 mi (> 240 km)
In 2005, Polk County, FL reported a cost of $110 per 1,000 gallons for transportation and pre-treatment prior to discharge into a wastewater treatment system that would accept

27
their leachate. Besides the transportation risk and fuel cost volatility, the most problematic issue is if the contractor at the facility accepting the leachate suddenly decided that the material is not profitable to handle, treat, and dispose of safely, and terminated the agreement to accept the leachate. This will become particularly problematic if regulations governing wastewater disposal were to become more stringent with respect to ammonia-nitrogen, toxic trace metals, and/or inhibitory organic compounds with low biodegradability. The facility accepting the waste may find that leachate volumes are too high (Çeçen and Çakıroglu 2001) compromising the treatment plant’s ability to meet permitted discharge water quality levels. In this case, the treatment facility would likely consider no longer accepting the material. Note the risks of a spill from an accident involving the transport vehicle are not considered in any cost:benefit scenarios. 1.5.5 Municipal sewer discharge A common solution for leachate management is to treat the leachate together with raw wastewater in the municipal sewage treatment plant, such as in Miami-Dade County. Boyle and Ham (1974), stated that high strength leachate with COD exceeding 10,000 mg/L can be treated at a level of 5-10% by volume without seriously impairing the treatment process or the effluent quality of an activated sludge municipal wastewater treatment plant (cited by Qasim and Chiang 1994 and Lema et al. 1988). It was suggested that the presence of heavy metals, ammonia, other toxins, and extremely high organic loading in leachate may cause severe upsets in the biological treatment systems due to biotoxicity. Qasim and Chiang (1994) and Chian and DeWalle (1977) also reported to have found that leachate flowrates greater than 5% by volume reduced the wastewater treatment plant efficiency. Other researchers (Lema et al. 1988; Booth et al. 1996; Çeçen and Çakıroglu 2001) studied co-treatment of leachate and sewage and showed similar results. The technical literature reports many uncertainties about treatment efficiency and volume percentages regarding municipal sewer discharge of landfill leachate. Beyond the 5-10% level, leachate results in substantial solids production (from increased waste activated sludge), increased oxygen uptake rates, and poorer settling of biomass. Leachate should be diluted prior to discharge, and the detention time in the activated sludge process train must be increased for leachates. However, Diamadopoulos et al. (1997) showed successful results when leachate comprised less than 10% of the total treated flow, at laboratory scale. Raina and Mavinic (1985) have successfully treated laboratory-scale combinations of 20 to 40% leachate by volume with municipal wastewater in aerobic batch (fill and draw) reactors with sludge residence times of 5, 10, and 20 days. However, this type of treatment process train is not common in large scale practice. Zachopoulos et al. (1990) studied co-disposal of leachate in Publicly Owned Treatment Works (POTWs) and concluded that leachate can be treated without any adverse effects to plant performance, although no details on leachate composition or treatment conditions were provided. Pohland and Harper (1985) also reported success treating combined leachate in conventional wastewater treatment plants. In their investigation, BOD5 and COD removal efficiency (over 90%) and complete nitrification (over 80%) was obtained with

28
10-day mean cell residence times. Although BOD5, COD, and also heavy metals removal at the treatment plant after combining the leachate with domestic sewage have been demonstrated, the results are highly variable and site specific. A case-by-case analysis is needed in order to determine the most cost effective and efficient treatment flow-path for domestic wastewater containing landfill leachates. Poorly clarified effluent, sludge bulking, corrosion of plant equipment and increases in effluent COD and TSS are potential operational issues at conventional domestic wastewater treatment facilities that accept landfill leachate. Co-treatment of domestic sewage with landfill leachate is certainly feasible although careful operation is required, and the approach may be problematic for small treatment plants. In locations where sewers are not available and evaporation or spray irrigation is not feasible, complete on-site pretreatment followed by surface discharge may be required. This is likely the least desirable option for solid waste managers because they would need to employ full-time operations staff to handle the wastewater treatment facility on-site. 1.5.6 On-site pretreatment On-site systems used to attenuate constituent concentrations in leachate can be designed using many different unit processes. They are deployed as pretreatment steps prior to discharging the effluent to a wastewater treatment facility, or to the environment if it meets the permit requirements. On-site treatment systems can be separated into two categories: biological and physicochemical processes. Laboratory studies of biological and chemical leachate treatment processes have been reported since the early 1970s (Boyle and Ham 1974; Ho et al. 1974), and some specific examples are reported in the following sections in which a wide variety of treatment processes currently employed for management of leachate are reviewed in terms of performance data on process efficiency, as well as advantages and limitations with respect to sustainable long term management of leachate. 1.5.6.1 Conventional biological and physical-chemical processes 1.5.6.1.1 Biological processes Biological processes rely on the action of a mixed culture of microorganisms in an aerobic or anaerobic environment. Treatment can be accomplished using a wide variety of methods, including: suspended growth systems (i.e. activated sludge, waste equalization ponds, aerated lagoons, membrane bioreactors, etc.) and attached growth systems (i.e. trickling filters, rotating biological contactors, etc.). These methods are equivalent to discharging to an off-site wastewater treatment plant and as a result have the same disadvantages, namely: 1) they do not address bio-toxic constituents, 2) their efficiency is highly dependent on the effluent composition and strength, which is highly variable in leachate, and 3) they require that the solid waste managers have wastewater treatment plant experience to operate these complex biological treatment systems. Since landfill leachate generation and composition has been demonstrated to be highly variable, biological processes may not operate as efficiently as expected with regards to treated leachate quality and should be considered more as a first step of a broader, more

29
comprehensive process (for instance: the pretreatment of leachate prior to discharge into the sewer system). In general, aerobic processes transform soluble organic matter to CO2 and biomass. They are considered more rapid than anaerobic processes but produce large amounts of sludge (cell biomass) and require large amounts of energy in the form of oxygen or air for respiration and mixing. On the other hand, anaerobic treatment processes transform organic matter to CO2, CH4, ammonia, H2S, and a minor part into biomass (Lema et al. 1988). Anaerobic processes are generally slower, requiring larger vessels, but do not need additional oxygen, so they use less energy. They can be self-sufficient in terms of generating energy through methane biogas production to power the heating and mixing systems. Sludge production, in anaerobic systems which digest the biomass, is typically much less of an issue compared to aerobic treatment, which produces appreciable amounts of biomass residuals resulting in a subsequent problem of disposal, particularly if there is residual heavy metals present. However, anaerobic systems suffer from objectionable odor generation, whereas the aerobic systems generally emit an earthy smell, which is much less of an issue. Biological processes may be effective for young leachate with a high BOD5/COD ratio (Ehrig and Stegmann, 1992). Using acclimated sludge in an activated sludge treatment unit, Anagiotou et al. (1993) removed 97% of ammonia, 93% of BOD5, and 45% of COD in 14 days with initial concentrations of 920 mg N/L, 6765 mg/L, and 3300 mg/L, respectively. The removal percentage is considerable for ammonia and BOD5, but for recalcitrant COD, in particular, the removal is generally inadequate for safe municipal sewer discharge when relying solely on one-stage microbiological degradation. In practice, the required residence time will take up available space, which is extremely valuable at a sanitary landfill site. This large footprint would represent an effective loss of capacity for the landfill opertions. For example, if this technique was applied at the South Dade Landfill in Miami-Dade County, the aeration basins would have a volume of 280,000 – 1,200,000 ft3 if designed to handle the peak wet season flow at typical BOD loading rates (Metcalf and Eddy 2003). At a depth of 15 ft, for the aeration basins alone this represents an area of up to 80,000 ft2 (1.9 acres). In this case, with redundancy for back-up, this would result in a reduction of the effective available surface area from 50 to just over 42 acres (8%). Lema et al. (1988) reported results of suspended growth processes using a variety of detention times, temperatures, and nutrient ratios and found that they were not always efficient for leachate treatment, but more importantly, the major issue was that the reported efficiency was not always reproducible. This means that treatment performance was erratic. By far, the most common suspended growth process is activated sludge, which performs most effectively when the influent flow rate and composition is relatively constant. Leachate quality and quantity are simply too variable to maintain a constant and predictable influent and treated effluent quality. Thus specific treatment conditions are necessary for each type of leachate (young vs. old, highly diluted vs. concentrated). At full scale, Baumgarten and Seyfried (1996) tested biological pretreatment of leachate with a COD loading rate of 3200 mg/L and recorded 60% removal of COD.

30
Similar results were reported with regard to anaerobic biological processes. Calli et al. (2005) used anaerobic reactors to treat young landfill leachate with a detention time of 3 days, achieving 90% removal of COD (Co = 20,700 mg/L). But excessive ammonia loading (greater than 3250 mg/L) can considerably reduce the performance of biological unit processes due to ammonia toxicity. Li et al. (1999) found that the performance of conventional activated sludge could be significantly affected by high concentrations of ammonia-nitrogen. The COD removal was adversely effected from 95 to 79%, when ammonia-nitrogen levels increased from 50 to 800 mg/L. Recall that ammonia levels in leachate have been reported as high as 1350-8750 mg/L (refer to Table 6). Even though, biological treatment (either aerobic or anaerobic) may be cost effective in certain scenarios for the removal of soluble BOD, nutrients, and ammonia (Morais and Zamora 2005). This is largely due to the variation in composition of leachate. However, biological treatment may not be a very efficient method and may suffer from frequent drops in performance (Fang et al. 2005). Other key drawbacks are inadequate sludge settlability (solids carryover and loss of performance), longer aeration times (higher energy costs), excess sludge production, and biological inhibition by biotoxic substances (Renou et al. 2008). Therefore, alternative techniques are still the subject of ongoing research. 1.5.6.1.2 Physical-chemical processes Since biological processes may not effectively treat leachate with a low BOD5/COD ratio or with high concentrations of toxic constituents, physical-chemical processes may be more useful in these cases. They may be used in conjunction with a biological process (Lema et al. 1988), which would be particularly advantageous for treatment of mature and recalcitrant leachates. The commonly used physical-chemical treatment processes include: coagulation-flocculation-precipitation (Amokrane et al. 1997; Tatsi et al. 2003), activated carbon adsorption (Copa and Meidl 1986), ion exchange (Papadopoulos et al. 1996; Street et al. 2002), air stripping (Lema et al. 1988; Silva et al. 2003; Calli et al. 2005), membrane filtration (Ushikoshi et al. 2002), and chemical oxidation (Ince 1998; Qureshi et al. 2002; Lopez et al. 2004) each of which is described in more detail below:
Coagulation, flocculation, chemical precipitation and sedimentation. Also known as conventional chemical treatment, these processes are fully developed and proven reliable for use in the removal of substances capable of forming solid precipitates, such as soluble heavy metals, some dissolved organics, and colloidal particles suspended in the leachate. They are generally practical, effective, and relatively low-cost for water softening, inorganic phosphorus and heavy metal removal, removal of suspended particles, color and/or turbidity, but they show only limited removal of COD. Information concerning the removal of other constituents is very rare.
While coagulation, flocculation, and sedimentation are independent mechanisms, they are interrelated and often used in conjunction of one anther. Common coagulants include metallic salts such as aluminum sulfate (Al2(SO4)3), aluminum

31
chloride (AlCl3), ferric sulfate (Fe2(SO4)3), ferric chloride (FeCl3), lime (Ca(OH)2), or polymers. But selecting the most effective combination of these is not an easy task as results depend on the initial composition of the waste (Méndez-Novelo et al. 2005). Depending on the coagulant used, some level of disinfection can also be achieved in that the removal of suspended solids and the operating pH can inactivate pathogens in the leachate. However, these processes require chemical addition, large areas for sedimentation basins and sludge storage, and fine operational control for optimizing coagulant doses for the extreme range of operating flow rates and chemical composition of leachate.
These processes can also be used as an efficient pretreatment step prior to biological or membrane treatment, or alternatively as an effective post-treatment step for leachate (Amokrane et al. 1997; Tatsi et al. 2003). However, coagulation/precipitation is generally not appropriate for full treatment of leachate, due to its limited efficiency for removing organic content. Reported leachate COD removal efficiencies depend primarily on coagulant species, coagulant dose, pH and leachate characteristics, ranging widely from 10 to 80%. Several investigators reported that coagulation favored removal of high molecular organic compounds in leachate (Chian and DeWalle 1977; Slater et al. 1985; Yoon et al. 1998). Silva et al. (2003) reported 25% removal of COD, but no removal of ammonia using coagulation and flocculation with aluminum sulfate. Ferric chloride appeared to be more efficient than alum in removing organic constituents in leachate, particularly at pH values above 9.0. Wu et al. (2004) reported a removal of 60% of COD using ferric chloride as the coagulant. As a traditional coagulant, lime can achieve up to 90% removal of heavy metals such as Fe, Cd and Cr. However, lime increases pH, provides poor COD removal (20 – 40%), and generates excessive sludge at high dosages (Amokrane et al. 1997). Amokrane et al. (1997) also attempted coagulation with ferric chloride, flocculation, and sedimentation but were only able to achieve 54% removal of COD. Méndez-Novelo et al. (2005) tried different coagulants at different doses but could not achieve a removal of COD greater than 47%. Of the 864 jar tests they conducted, the average removal was only 4%. They attribute their successful results to the action of sweep floc or enhanced coagulation, which requires excess addition of coagulant. The literature reported here in Table 9 reveals that iron salts are more effective than alum or lime and combined coagulants may be more effective. However, drawbacks include larger sludge volume production and an increase in metals concentrations in the aqueous phase. In practice, coagulation/flocculation processes are mostly employed prior to additional treatment, such as ozonation or advanced oxidation processes for polishing. In terms of nitrogen, chemical precipitation processes can reduce the ammonia-nitrogen levels in leachate via precipitation as magnesium ammonium phosphate (MAP). Li et al. (1999) reduced ammonia-nitrogen concentration from 5600 to 110 mg/L within 15 minutes by addition of MgCl2·6H2O and Na2HPO4·12H2O with a Mg/NH4/PO4 ratio of 1/1/1 at a pH of 8.5–9.0. Struvite has also been used effectively (Ozturk et al. 2003).

32
Veli et al. (2008) used aluminum and iron as materials for electrodes in an electrochemical coagulation technique using a laboratory-scale reactor (16 cm×15 cm×20 cm, Volume = 2 L). The removal indices for the leachate treatment by traditional chemical coagulants (FeSO4·7H2O + Al2(SO4)3·18H2O) appeared to be lower than for the electro-coagulation method, which showed maximum COD removals of 87-90%, while for conventional coagulation with FeSO4·7H2O the observed removal was 77%, and with Al2(SO4)3·18H2O the removal was 88%. Color removal (86-99%) was also observed.
33
Table 9. Summary of COD removal performance tests conducted with cogulation/flocculation technologies on landfill leachates. Coagulant Dose
(g/L) CODo (mg/L)
BOD/COD pH Removal (%)
Reference
Ca(OH)2 2.0 7000 nr 12 86 Kargi and Pamukoglu 2003
Ca(OH)2 + Fe2(SO4)3
0.5–4.0 + 0.0–0.2
4000 – 8810 0.15 8.3 39 Loizidou et al. 1992
Ca(OH)2 + Al2(SO4)3
1.5 + 1.0
6000 ‐ 8200 0.11 – 0.17
nr 42 Papadopoulos et al. 1988
FeCl3 + Al2(SO4)3
1.0–5.0 5300 0.2 7.9 75 Tatsi et al. 2003
FeCl3 1.5 5.5
5350 70,900
0.20 0.38
10 6.2
80 30
Tatsi et al. 2003
Al2(SO4)3 1.5 3.0
5350 70,900
0.20 0.38
10 6.2
38 40
Tatsi et al. 2003
FeCl3 Al2(SO4)3
0.8 0.4
5690 5690
0.05 0.05
4.5 5.0
55 42
Diamadopoulos 1994
FeCl3 or Al2(SO4)3
1.6–11.4 or 3.4–23.9
4100 4100
0.05 0.05
8.2 8.2
40 50
Amokrane et al. 1997
FeCl3 0.2–1.2 1200 – 1500 0.04 6.8 –7.5
39 Yoo et al. 2001
FeCl3 1.6 7400 – 8800 0.05 – 0.06
8.5 – 9.0
40 – 90 Rivas et al. 2003
Fe2(SO4)3 0.3 15,700 0.27 7.7 70 Wang and Shen 2000
FeSO4∙7H2O + Al2(SO4)3∙18H2O
1.25 + 0.35
4022 nr 3.0 77‐90 Veli et al. 2008
Adsorption processes. This process can be used to remove small concentrations
of dissolved substances that do not settle well in sedimentation basins. It works by physical adhesion of dissolved organics onto the surface of solid media. Granular activated carbon (GAC) or powedered activated carbon (PAC) is commonly used in water treatment due to its highly porous matrix, thermo-stability, low acid/base reactivity, and large adsorptive surface area (> 1000 m2/g). Activated carbon processes have a proven track record with regards to the ability to remove a wide variety of organic and inorganic pollutants dissolved in aqueous media.
In Thessaloniki Greece, a similar study was conducted with powdered activated carbon (PAC) of varying dosage (from 0.2 to 10.0 g/L), suggesting the applicability of Freundlich isotherm with a COD removal of 95% (CODo = 5690 mg/L) (Diamadopoulos 1994). More recently, Wasay et al. (1999) performed a

34
separate investigation utilizing granular activated carbon, granular activated alumina and ferric chloride for the treatment of heavy metals [Cd(II), Cu(II), Cr(III), Mn(II), Pb(II) and Zn(II)], indicating GAC to be the most efficient adsorbent with 80–96% removal at a pH range of 6.0–7.7 with initial metals concentrations of 184 mg/L). Foo and Hameed (2009) stabilized leachate from Goslar, Germany using a granular activated carbon (GAC) column to achieve 91% COD removal (CODo = 940 mg/L). Film diffusion and internal surface diffusion characteristics of the adsorbent and the reactor configuration were demonstrated to play a key role in determining the reactor kinetics. In Malaysia, a comparative study for the removal of ammonia-nitrogen was conducted by Aziz et al. (2004) and Aghamohammadi et al. (2007) using granular activated carbon and limestone in the Burung Island landfill. Approximately 40% of ammonia-nitrogen (Co = 1909 mg N/L) was eliminated with 42 g/L of GAC while only 19% removal was achieved using 56 g/L of limestone under the same initial ammonia concentrations.
Activated carbon systems can also be used as part of a polishing process following biological treatment, for instance. Using biologically pretreated leachate, Morawe et al. (1995) reported COD and BOD5 removal of 91 and 65%, respectively. But their initial BOD5 was very low (< 3.0 mg/L), and their initial COD was only on the order of 900 mg/L. Using granular activated carbon media, Abdel-Halim et al. (2003) reached an uptake of 89% on organically bound lead (Pbo = 4.0 mg/L) contained in industrial or synthetic wastewater, although the initial lead concentration was on the high range of what would be expected concentrations found in typical leachate. In another experiment, the initial concentration of lead was 10 mg/L, and the removal efficiency was nearly the same at 86%. Other experiments conducted by Copa and Meidl (1986) demonstrated the benefits of combining aerobic treatment with the granular activated carbon technology. With a detention time of 12 days, they achieved complete removal of BOD5 (Co = 30 mg/L, and they also reported 77% removal of COD (Co = 920 mg/L), 98% removal of ammonia-nitrogen (Co = 210 mg N/L), and 46% removal of suspended solids (TSSo = 210 mg/L). In a second step, they implemented their treatment process with sand filters and a second polishing stage of granular activated carbon treatment. This modification increased the removal of COD and suspended solids to 90 and 99%, respectively. But this complicated process is considered to be an expensive solution due to the necessity of frequent media regeneration in a column reactor or the cost of the large quantities of adsorbents required (Lema et al. 1988). In leachate treatment, this is also typically the case, as carbon has to be regenerated on a more frequent basis due to the high concentrations of impurities, suspended solids in particular. Pretreatment may be necessary to reduce the solid content and limit bacterial growth on the media. Activated carbon technologies have been demonstrated to be efficient for removing non-biodegradable compounds, such as recalcitrant COD, preferentially adsorbing those compounds of low molecular weight (Morawe et al. 1995). In

35
Table 10, a summary of treatment performance shows that 19-90% removal of COD, 16-95% removal of ammonia-nitrogen, and 50-60% removal of color can be achieved depending on the conditions and the age of the leachate. Adsorption processes have been used at full scale for leachate applications but not in Florida.
Table 10. Summary of performance tests conducted with adsorption technologies on landfill leachates. Adsorbent Adsorbate Leachate Type Removal (%) Reference
Commercial PAC COD Ammonia
Synthetic 87 16
Kargi and Pamukoglu 2004
Commercial PAC COD Synthetic 25 Song et al. 2009 Commercial PAC COD
Ammonia Leachate 5 – 10 yrs old 75
44 Uygur and Kargi 2004
Commercial PAC COD Ammonia
Leachate 5 – 10 yrs old 49 16
Kargi and Pamukoglu 2003
Commercial PAC COD Mature leachate more than 10 yrs old
38 Hur and Kim 2000
Commercial PAC COD Ammonia Color
Young leachate less than 5 yrs old
49 78 50
Aghamohammadi et al. 2007
Commercial GAC COD Synthetic 19 Song et al. 2009 GAC COD
Ammonia Mature leachate more than 10 yrs old
60 95
Kurniawan et al. 2006
Calgon Filtrasorb 400
COD Mature leachate more than 10 yrs old
70 Morawe et al. 1995
Rice Husk COD Color
Young leachate less than 5 yrs old
70 60
Kalderis et al. 2008
Norit 0.8 COD COD
Leachate 5 – 10 yrs old Mature leachate more than 10 yrs old
68 90
Rivas et al. 2006 Rivas et al. 2003
Ion exchange. Ion exchange involves the reversible interchange of ions between
an aqueous solution and a solid material known as the ion exchange resin. The main use of this process is water softening to reduce concentrations of calcium and magnesium hardness using sodium ions. In water treatment, it is used for the removal of nitrogen (NH4
+ and NO3-), heavy metals, organics, or TDS. Zeolites
are natural ion exchange materials, and synthetic materials such as: aluminosilicates, resins, or phenolic polymers can also be used (Qasim, Motley, and Zhu 2000). Street et al. (2002) reported that a novel polyacrylate-based ion-exchange material removed modest amounts of lead in the high-ppm concentration range and reduced the effluent lead concentration to the low parts per billion range. Likewise, Papadopoulos et al. (1996) successfully used clinoptilolite (microporous mineral from the zeolites group) in a sodium form in a pilot ion exchange reactor. A maximum removal of 83% of ammonia was achieved with a starting concentration of 2700 mg N/L. They also achieved 15% removal of BOD5, with a starting concentration of 8500 mg/L.

36
In addition to organic compounds and ammonia, ion exchange using kaolinite was employed to study the sorption of Cd(II) and Ni(II) from leachate from a landfill in Italy (Majone et al. 1998). With an initial Ni(II) concentration of 0.94 mg/L and Cd(II) concentration of 0.002 mg/L, removal was 99% and 90%, respectively. Contradicting Bishkin (1998), Escobar et al. (2006) report that the ion exchange technology requires costly resin regeneration (producing additional liquid brine wastes) or inevitable resin replacement because of fouling. The presence of competing ions such as sulfate, the excessive suspended solid content, and organic fouling due to the presence of oil and grease are major operational issues. Also, to be competitively efficient as compared to other less expensive technologies, this process requires appropriate preliminary treatment such as filtration and pH control to reduce concentrations prior to the ion exchanger, followed by another method to remove recalcitrant organics (i.e. adsorption or advanced oxidation). Those are the two main explanations why this technology is not more widespread in water treatment operations. Recent progress with the magnetic ion exchange (MIEX) process has shown promising results in the laboratory setting for use with leachate in unpublished work by Boyer and Townsend at the University of Florida. Depending on the type of organic matter present and the ion exchange resin employed, this process can be effective for heavy metal removal from landfill leachate but must be used in concert with other treatment processes to effectively handle the other constituents found in leachate. To our knowledge, ion exchange systems have not been employed for field scale wastewater or leachate treatment applications in Florida.
Air stripping. This technology is used to remove ammonia and volatile organic
compounds (VOCs) (American Water Works Association 1999). The mechanism involved in air stripping is the transfer of a dissolved gas from the liquid phase to the gaseous phase. This is accomplished by contacting the liquid containing the gas with another gas (usually air) that does not contain appreciable amounts of the target gas, initially. This creates a concentration gradient, which is the driving force to transfer the dissolved gas or VOC from the aqueous phase into the gaseous phase. Air stripping is commonly used in applications involving ammonia removal. However, this process typically requires a pH adjustment to a value near 11, which is usually accomplished using lime addition (Lema et al. 1988). Silva et al. (2003) was able to demonstrate 99.4% removal of ammonia (Co = 880 mg/L as N), after 96 hours of treatment at pH = 11. It should be noted that during those same experiments, ammonia was not removed appreciably by either coagulation/flocculation or membrane fractionation. Calli et al. (2005) also demonstrated considerable removal (>94%) with an initial concentration on the order of 2330 mg/L as N from young leachate using conventional air stripping treatment with pH adjustment. In order to maximize process efficiency, air stripping of ammonia-nitrogen requires high pH and the addition of concentrated acid to treat the contaminated gas phase before release. The major concern with this process is the potential for air contamination if the released ammonia cannot be neutralized with either sulfuric acid or hydrochloric acid. Other drawbacks include scale formation in the tower due to lime addition for pH adjustment, and

37
foaming (Li et al. 1999). In conclusion, although air stripping is proven efficient for removal of ammonia, VOCs, and dissolved gases, it does not address the other constituents of concern commonly associated with landfill leachate, such as BOD5, COD, and other organics that are not volatile, nor does it deal with inorganics such as trace metals. Consequently, air stripping cannot be used on its own without other companion treatment processes. Pi et al. (2009) demonstrated a combined process using air stripping followed by coagulation/ultrafiltration. They were able to achieve 89% removal of ammonia (Co = 214 mg N/L) in 18 hours with high temperature (50°C) primary air stripping and 85% removal of COD (Co = 18,730 mg/L) and 96% removal of color after treatment with coagulation/flocculation followed by ultrafiltration.
Filtration. Filtration is a solid/liquid separation technique. It is also generally
employed before advanced treatment processes to remove excess suspended solids and other contaminants by size exclusion. Slow and rapid sand gravity filtration technologies are variations of the depth filtration process, which are effective for removal of suspended and colloidal solids and insoluble metal precipitates.
For removing even smaller materials, membrane filtration such as: microfiltration (MF), ultrafiltration (UF), nanofiltration (NF), and reverse osmosis (RO) can be used, but there are significant barriers to their application to leachate. Membranes require very clean water to start with. This means minimal starting concentrations of organics, microbes, and suspended material. These conditions are highly unlikely in leachate applications. Fouling is a major issue with all membranes (Bloetscher, Meeroff, and Toro 2010 and references therein) and fouling is exacerbated in leachate applications because of the complex matrix of suspended solids, oil and grease, microbial growth, heavy metals, organics, and saturation scaling. To guard against fouling, extensive pretreatment regiments are required or frequent cleaning of the membranes, which results in shorter membrane life and decreased process productivity through flux decline. Regardless of configuration, successful application of membrane technology requires control of membrane fouling. Nanofiltration and reverse osmosis can produce an effluent of nearly distilled water quality, and are effective on a multitude of compounds, dissolved matter in particular, but ammonia is usually conserved in membrane applications; thus, pretreatment is generally required. Where membranes are used, they usually constitute the last stage of a treatment train that may consist of particle filtration, biological pretreatment, pH adjustment, and disinfection prior to introduction of the wastewater to the membrane filter. Slater et al. (1983) reported after pre-treatment (oil/grease separation, coagulation by lime, recarbonation, and pH adjustment), they were able to achieve 98% removal of TDS (Co = 16,400 mg/L) and 68% removal of COD (Co = 26,400 mg/L) using a reverse osmosis unit with a permeate flux of 4.4
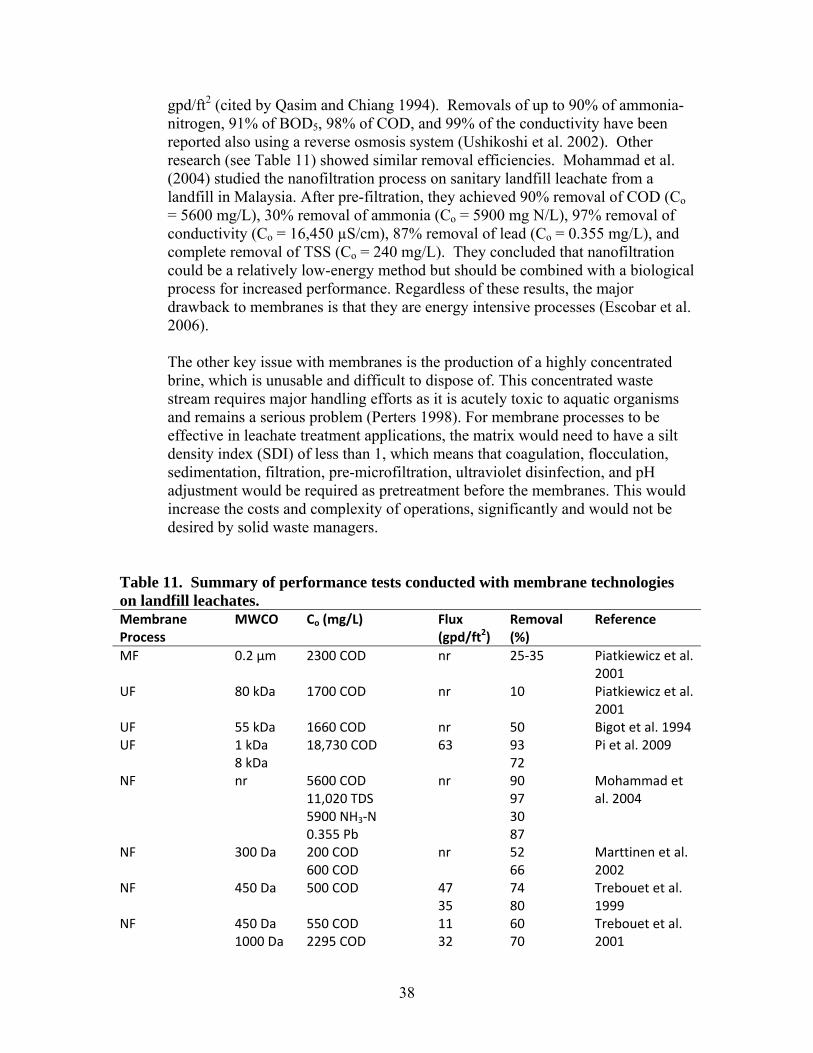
38
gpd/ft2 (cited by Qasim and Chiang 1994). Removals of up to 90% of ammonia-nitrogen, 91% of BOD5, 98% of COD, and 99% of the conductivity have been reported also using a reverse osmosis system (Ushikoshi et al. 2002). Other research (see Table 11) showed similar removal efficiencies. Mohammad et al. (2004) studied the nanofiltration process on sanitary landfill leachate from a landfill in Malaysia. After pre-filtration, they achieved 90% removal of COD (Co = 5600 mg/L), 30% removal of ammonia (Co = 5900 mg N/L), 97% removal of conductivity (Co = 16,450 µS/cm), 87% removal of lead (Co = 0.355 mg/L), and complete removal of TSS (Co = 240 mg/L). They concluded that nanofiltration could be a relatively low-energy method but should be combined with a biological process for increased performance. Regardless of these results, the major drawback to membranes is that they are energy intensive processes (Escobar et al. 2006). The other key issue with membranes is the production of a highly concentrated brine, which is unusable and difficult to dispose of. This concentrated waste stream requires major handling efforts as it is acutely toxic to aquatic organisms and remains a serious problem (Perters 1998). For membrane processes to be effective in leachate treatment applications, the matrix would need to have a silt density index (SDI) of less than 1, which means that coagulation, flocculation, sedimentation, filtration, pre-microfiltration, ultraviolet disinfection, and pH adjustment would be required as pretreatment before the membranes. This would increase the costs and complexity of operations, significantly and would not be desired by solid waste managers.
Table 11. Summary of performance tests conducted with membrane technologies on landfill leachates. Membrane Process
MWCO Co (mg/L) Flux (gpd/ft2)
Removal (%)
Reference
MF 0.2 μm 2300 COD nr 25‐35 Piatkiewicz et al. 2001
UF 80 kDa 1700 COD nr 10 Piatkiewicz et al. 2001
UF 55 kDa 1660 COD nr 50 Bigot et al. 1994 UF 1 kDa
8 kDa 18,730 COD 63 93
72 Pi et al. 2009
NF nr 5600 COD 11,020 TDS 5900 NH3‐N 0.355 Pb
nr 90 97 30 87
Mohammad et al. 2004
NF 300 Da 200 COD 600 COD
nr 52 66
Marttinen et al. 2002
NF 450 Da 500 COD 47 35
74 80
Trebouet et al. 1999
NF 450 Da 1000 Da
550 COD 2295 COD
11 32
60 70
Trebouet et al. 2001

39
Membrane Process
MWCO Co (mg/L) Flux (gpd/ft2)
Removal (%)
Reference
Electrodialysis nr 70,000 COD 99,000 TDS
nr 98 99
Schoemass et al. 2007
RO nr 26,400 COD 16,400 TDS
4.4 68 98
Slater et al. 1983
RO nr 7.9 – 97.4 COD 2190 – 27,300 TDS 0.96 – 34 NH3‐N 14 – 18 Color
0.003 – 0.006
98 – 99 >99 90 – 98 92 ‐ 99
Ushikoshi et al. 2002
RO nr 1700 COD 3000 COD
19 34
99 89
Ozturk et al. 2003
RO nr 846 COD nr 93 Bohdziewicz et al. 2001
RO nr 335 COD 925 COD
1.8 28
>98 >98
Linde et al. 1995
RO (PAC/SBR, Greensand filters, UF pre‐trt)
nr 2200 COD 220 BOD 5600 TDS 0.006 Pb
11 nr nr 94 nr
Grusauskas et al. 1996
RO (biological pre‐trt)
nr 1301 COD 18 99 Baumgarten and Seyfried 1996
RO (MBR pre‐trt)
nr 211 COD 856 COD
nr 97 97
Ahn et al. 2002
RO (evaporation pre‐trt)
nr 200 COD 12 17
90 86
Di Palma et al. 2002
Schoemass et al. (2007) evaluated electrodialysis (ED) as an alternative technology to desalinate/concentrate leachates for effluent volume reduction and pollution control using leachate with extremely high TDS and COD levels, 99 g/L and 70 g/L, respectively. The leachate also contained high concentrations of iron, manganese, barium, strontium, and phenolics. High TDS concentrations in leachate make treatment with reverse osmosis very difficult because of the rapid permanent fouling. After treatment, the desalinated effluent was significantly less toxic and more biodegradable than the feed. The treated water is almost of potable water quality (645 mg/L TDS) except for high COD (935 mg/L). The capital cost of a 0.3 MGD (feed) ED treatment unit is estimated at $2.38 million with operational costs estimated at $109 per 1000 gallons (Schoemass et. al 2007). (Schoemass et al. (2007) also found out that physical/chemical pretreatment of the leachate with fly ash and other coagulants reduced the fouling potential.
1.5.6.1.3 Summary of conventional processes In conclusion, physical and chemical processes have advantages in being immediately functional, relatively easy to operate, and insensitive to temperature variations. However, they typically generate large quantities of residuals (i.e. sludge, concentrates, spent resins,

40
spent sorbents, and filter backwash water) and may require daily chemical addition and process maintenance, adding significant costs to the operation (Lema et al. 1988). When, treating young leachate, biological techniques can provide reasonable treatment performance with respect to COD, ammonia-nitrogen, and heavy metals. When treating mature leachate, which is far less biodegradable, physical-chemical treatments may be suitable as a polishing step for biologically treated leachate, to remove refractory organics. Combining chemical, physical, and biological processes, regardless of the order of treatment, generally attenuates the disadvantages of individual processes, thus contributing to a more efficient level of the overall treatment but at higher cost and complexity. This review of traditional methods to treat landfill leachate leads to the eventual conclusion that individually no one single method will be sufficient from the perspective of long-term management of landfill leachate. Each treatment process has its advantages and limitations, but none can achieve consistent removal of the major constituents of concern while generating an environmentally-acceptable effluent and minimizing the generation of residuals (Table 12). Table 12. Relative effectiveness of conventional biological and physical-chemical treatment processes for leachate. Process Leachate Age Removal (%) Residuals Target Young Medium Mature BOD COD TKN TSS Management Strategy Leachate recirc 3 2 1 >90 60‐
80 ‐ ‐ Final leachate
disposal
Evaporation 1 2 3 n/a n/a n/a n/a Salts Moisture
Natural attenuation
3 3 3 n/a n/a n/a n/a Aquifer creep Dilution
Hauling 3 3 3 n/a n/a n/a n/a Waste sludge, air pollution
Depends
Sewer 3 2 1 Depends on POTW capacity Waste sludge
Biological Pre‐Treatment
Aerobic 3 2 1 >80 60‐90
>80 60‐80
Waste sludge Low MW organics
Anaerobic 3 2 1 >80 60‐90
>80 60‐80
Waste sludge Low MW organics
MBR 3 2 2 >80 >85 >80 >99 Waste sludge Organics and nutrients
Physical‐Chemical Pre‐Treatment
Coagulation/ flocculation
1 2 2 ‐ 40‐60
<30 >80 Sludge and metals content
Heavy metals and TSS
Precipitation 1 2 1 ‐ <30 <30 30‐40
Sludge and metals content
Heavy metals and ammonia
Adsorption 1 2 3 ‐ >80 70‐90
‐ Spent sorbent Organics
Ion exchange (for polishing after bio trt)
3 3 3 n/a n/a n/a ‐ Spent resin or resin recharge waste
Cations, anions, dissolved solutes
Air stripping 1 2 2 ‐ <30 >80 ‐ NH3 air pollution
VOCs and ammonia

41
Process Leachate Age Removal (%) Residuals Target Young Medium Mature BOD COD TKN TSS MF/UF 1 1 1 ‐ 50 60‐
80 >99 Concentrate TSS but
requires pre‐trt
NF with pre‐treatment
3 3 3 80 60‐80
60‐80
>99 Concentrate Hardness ions, sulfates
RO with pre‐treatment
3 3 3 >90 >90 >90 >99 Concentrate Organics and inorganics
Electrodialysis 3 3 3 n/a n/a n/a ‐ Concentrate Organics and inorganics
With discharge standards becoming more stringent and the age of landfill sites increasing, conventional biological or physical-chemical treatment may not be sufficient to reach the level of purification needed to fully reduce the negative impact of landfill leachates on the environment, going forward. Thus formulating a global recommendation for leachate treatment using conventional wastewater treatment processes is not possible at this time. A combination of several methods can be used, but costs will then increase, possibly becoming prohibitive because to improve the effluent and residuals quality, the treatment must be more extensive. Consequently, an all inclusive solution is currently not available for long-term leachate management. Thus, new technologies must be considered and further studies conducted. One of the potential solutions growing in interest is chemical oxidation, more specifically: advanced oxidation processes (AOPs) or energized processes (EPs). 1.5.6.2 Chemical oxidation processes Chemical oxidation is based on oxidation-reduction (redox) reactions tailored for the destruction of organics and precipitation of metals. These processes typically involve the use of oxidizing agents such as ozone, hydrogen peroxide, permanganate, chlorine, and molecular oxygen to bring about a change in the chemical composition of target compounds. Most of them, except simple ozonation (O3), use a combination of: 1) strong oxidants (e.g. O3 and H2O2); 2) irradiation (e.g. ultraviolet (UV), ultrasound (US), or electron beam); and 3) catalysts (e.g. transition metal ions or photocatalysts) (Metcalf and Eddy 2003). Advanced oxidation processes were defined by Glaze et al. (1987) as “near ambient temperature and pressure water treatment processes, which involve the generation of hydroxyl radicals in sufficient quantity to effect water purification.” An AOP can utilize ozone (O3), hydrogen peroxide (H2O2), or other agents to oxidize the pollutants through the production of the hydroxyl radical (OH•), which is a powerful and indiscriminate oxidant. The hydroxyl radical has a relative oxidation power of 2.05 compared to 1.00 for chlorine. Table 13 summarizes the relative oxidation power of the species used in most AOPs. Within milliseconds (Peyton and Glaze 1988, cited by Fang et al. 2005), hydroxyl radicals are capable of achieving complete mineralization (i.e. degradation of complex organics to CO2, H2O, and mineral ions) of virtually all organic compounds
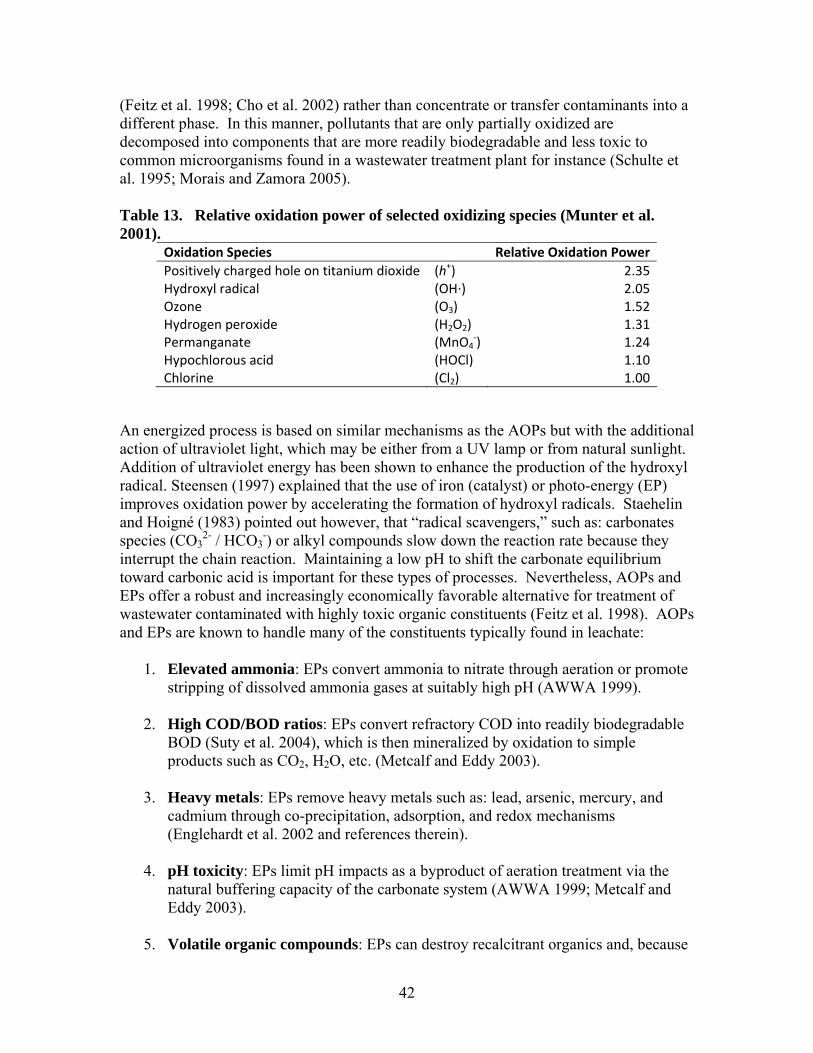
42
(Feitz et al. 1998; Cho et al. 2002) rather than concentrate or transfer contaminants into a different phase. In this manner, pollutants that are only partially oxidized are decomposed into components that are more readily biodegradable and less toxic to common microorganisms found in a wastewater treatment plant for instance (Schulte et al. 1995; Morais and Zamora 2005). Table 13. Relative oxidation power of selected oxidizing species (Munter et al. 2001).
Oxidation Species Relative Oxidation Power
Positively charged hole on titanium dioxide (h+) 2.35 Hydroxyl radical (OH∙) 2.05 Ozone (O3) 1.52 Hydrogen peroxide (H2O2) 1.31 Permanganate (MnO4
‐) 1.24 Hypochlorous acid (HOCl) 1.10 Chlorine (Cl2) 1.00
An energized process is based on similar mechanisms as the AOPs but with the additional action of ultraviolet light, which may be either from a UV lamp or from natural sunlight. Addition of ultraviolet energy has been shown to enhance the production of the hydroxyl radical. Steensen (1997) explained that the use of iron (catalyst) or photo-energy (EP) improves oxidation power by accelerating the formation of hydroxyl radicals. Staehelin and Hoigné (1983) pointed out however, that “radical scavengers,” such as: carbonates species (CO3
2- / HCO3-) or alkyl compounds slow down the reaction rate because they
interrupt the chain reaction. Maintaining a low pH to shift the carbonate equilibrium toward carbonic acid is important for these types of processes. Nevertheless, AOPs and EPs offer a robust and increasingly economically favorable alternative for treatment of wastewater contaminated with highly toxic organic constituents (Feitz et al. 1998). AOPs and EPs are known to handle many of the constituents typically found in leachate:
1. Elevated ammonia: EPs convert ammonia to nitrate through aeration or promote
stripping of dissolved ammonia gases at suitably high pH (AWWA 1999). 2. High COD/BOD ratios: EPs convert refractory COD into readily biodegradable
BOD (Suty et al. 2004), which is then mineralized by oxidation to simple products such as CO2, H2O, etc. (Metcalf and Eddy 2003).
3. Heavy metals: EPs remove heavy metals such as: lead, arsenic, mercury, and
cadmium through co-precipitation, adsorption, and redox mechanisms (Englehardt et al. 2002 and references therein).
4. pH toxicity: EPs limit pH impacts as a byproduct of aeration treatment via the
natural buffering capacity of the carbonate system (AWWA 1999; Metcalf and Eddy 2003).
5. Volatile organic compounds: EPs can destroy recalcitrant organics and, because

43
of their volatility or promote the stripping of VOCs during aeration, provided the appropriate conditions (AWWA 1999, Suty et al. 2004).
Advanced oxidation processes can occur both with and without the addition of energy. If AOPs or EPs are used as a pre-treatment step before a biological treatment, it has been demonstrated that these types of oxidation processes can reduce the detention time required for subsequent biological treatment (Bila et al. 2005). Initial filtration or sedimentation is still often required as a pre-treatment step to remove solids that would interfere with the action of UV. One important drawback of AOPs is the high demand for electrical energy (e.g. ozonizers, UV lamps, ultrasound, etc.), which increases cost (Lopez et al. 2004). Also, for complete mineralization of pollutants to occur, high oxidant doses may be required. Silva et al. (2004) needed 3.0 g/L of ozone to attain significant toxicity decrease. Furthermore, some intermediate oxidation byproducts generated by incomplete mineralization can increase the toxicity of leachate. In the following discussion, the use of various chemical oxidation methods is reviewed for the breakdown of BOD, the oxidation of ammonia, and the destruction of non-biodegradable COD. AOPs, which employ the hydroxyl radical (OH·) are discussed along with EPs, which employ the use of added energy from irradiation. 1.5.6.2.1 Hydrogen peroxide (H2O2) One of the most straightforward methods to generate hydroxyl radicals in aqueous waste streams is through the addition of hydrogen peroxide, which is a strong oxidant and a widely known disinfection agent. Hydrogen peroxide is produced by the electrolysis of ammonium bisulfate and the oxidation of alkylhydroanthraquinones. Amokrane at al. (1997) used hydrogen peroxide as a pre-treatment step before coagulation-flocculation. They demonstrated that H2O2 had a minor influence on the overall process. COD removal was increased only slightly from 54 to 57% by using 1.9 g/L of H2O2. Similarly, other experiments showed hydrogen peroxide’s comparatively low efficiency. Loizidou et al. (1993) treated leachate from a stabilized landfill near Athens, Greece for a period of 24 hours using a dose of 100 mL H2O2/L of waste (880 mM). The initial COD concentration was 7000 mg/L, and the final measured concentration was about 5900 mg/L (only 16% removal). Shu et al. (2006) experimented with hydrogen peroxide on leachate from a landfill in Taiwan. After 600 min of reaction ([H2O2] = 232.7 mM), they removed 60% of the COD (Co = 4000 mg/L). Information concerning the removal of other significant parameters (ammonia, suspended solid, BOD5 or lead) typically encountered in leachate is limited. Kurniawan and Lo (2009) investigated the treatment performance of H2O2 oxidation alone and also when combined with granular activated carbon (GAC) adsorption for raw leachate with BOD/COD ratio of 0.08. H2O2 oxidation alone achieved a COD removal of 33% (Co = 8000 mg/L) and an ammonia-nitrogen removal of 4.9% (Co = 2595 mg/L). GAC adsorption alone demonstrated 58% COD removal. However, when the two processes were combined, COD removal climbed to 82% and ammonia-nitrogen was

44
removed at 59%, while the BOD/COD ratio increased from 0.08 to 0.36. Although the H2O2 oxidation followed by GAC adsorption method was shown to be effective at treating leachate of varying strengths, effluents were still unable to meet the local COD limit for industrial pre-treatment discharge to a sanitary sewer (200 mg/L and the NH3-N of lower than 5 mg/L) (Kurniawan and Lo 2009). Addition of Fe(II) at 1.8 g/L further improved the removal of refractory compounds from 82% to 89%, in this study. Although hydrogen peroxide seems to have a lower expected COD removal efficiency, the effect of the hydroxyl radical predicts a wide range of action, so researchers have investigated enhancing the hydrogen peroxide method by combining it with other oxidants, as demonstrated by Steensen (1997) and others, as described in the following sections. Also, the benefits of combining hydrogen peroxide with the catalytic effect of ferrous iron are discussed further in the next section. 1.5.6.2.2 Fenton (H2O2/Fe2+) The Fenton reaction is probably the oldest advanced oxidation agent used in wastewater treatment, as reported first well over a hundred years ago for the oxidation of maleic acid (Fenton and Jones 1900). The process, although widely studied, is not completely understood but is thought to be the result of the catalytic action of ferrous ions (Fe2+) with hydrogen peroxide to generate hydroxyl radicals and superoxide radicals, according to the following proposed system:
2
2223
322
2
FeHOHOHFe
OHOHFeOHFe
An increase in the hydrogen peroxide to substrate ratio typically results in more extensive degradation, while a higher concentration of iron leads to increased yield (Lopez et al. 2004). Fenton’s reaction has no mass transfer limitation, and both ferrous iron and hydrogen peroxide are non-toxic, but Fenton’s process requires low pH. The Fenton process is known to degrade recalcitrant and toxic organic compounds that are found in typical leachate (Zhang et al. 2005), and the process can also improve biodegradability and remove odor and color. The reaction is fast at low pH (ideal pH is between 3 and 5), often requiring an initial pH adjustment. Because of the use of iron, sludge residuals mainly from ferric precipitates can be generated in large quantities, requiring an additional sedimentation or filtration step to deal with these residuals. Fenton processes can be roughly grouped into four categories: 1) direct Fenton treatment, 2) Fenton pretreatment prior to biological treatment, 3) Fenton treatment preceded by physical/chemical treatment, and/or occasionally followed by biological treatment, and 4) Fenton treatment preceded by biological treatment, and/or occasionally followed by physical/chemical or biological treatment. Direct Fenton treatment focuses on COD removal, while Fenton pretreatment for a biological process focuses on increasing the BOD5/COD ratio for mature leachates because Fenton pretreatment decomposes recalcitrant organics to less complex intermediates, which are more readily

45
biodegradable. Lopez et al. (2004) found that Fenton reagent doses required to achieve sufficient improvement in organic biodegradability are significantly lower than those required to achieve a target COD level in a typical mature raw leachate, which makes Fenton more efficient in the role of pretreatment. On major drawback is that the Fenton process is most efficient at low pH (Zhang et al. 2005). An optimal pH of 2.5-3.0 is typically indicated. A decrease in the removal percentage was also found as the initial COD concentration increased, even though the amount of COD removed increased. When Fenton is used as a post-treatment, coagulation is typically used as a pretreatment step to reduce organic loading on the Fenton process. Lime, alum, and ferric salts have been extensively investigated for full treatment and pretreatment of landfill leachate (Thornton and Blanc 1973; Cook and Foree 1974; Ho et al. 1974; Millot et al. 1987; Amokrane et al. 1997; Forgie 1988; Kim et al. 2001; Trebouet et al. 2001; Wang et al. 2002a; Wang et al. 2002b; Tatsi et al. 2003; Monje-Ramirez and de Velasquez 2004; Pala and Erden 2004; Silva et al. 2004; Wu et al. 2004). A modification of coagulation using ferric salts combined with the Fenton treatment involves the recycling of Fenton sludge. In this scheme, a portion of the Fenton sludge is returned to the coagulation tank to increase COD removal efficiency, and reduce coagulant consumption and sludge disposal cost (Yoo et al. 2001). However, if effluent from the Fenton unit contains COD above the allowable sewer discharge limits, post-treatment must be employed (Lin and Chang 2000). For some leachates, it may be required to have biological pretreatment utilizing aerobic or anaerobic processes to eliminate biodegradable organics or ammonia followed by Fenton and polished with another physical-chemical or biological process (Gau and Chang 1996; Bae et al. 1997; Yoon et al. 1998; Wang et al. 2000a; Lau et al. 2001; Gulsen and Turan 2004). Gau and Chang (1996) used activated carbon adsorption as an effective post-treatment to decrease COD from 320 mg/L to 150 mg/L. The reason for this efficiency may be that the effluent from Fenton treatment likely contains a large fraction of low molecular organics (Yoon et al. 1998), which may be effectively removed by activated carbon adsorption (Chiang et al. 2001). Another option for COD removal in Fenton-treated leachate is by using activated sludge post-treatment (Bae et al. 1997). In addition, a two-stage Fenton process, comprised of two successive Fenton processes in series, can be used in place of a single Fenton process. Gau and Chang (1996) reported that the second Fenton step could further reduce COD in leachate, although Fenton reagent doses in the second stage were much higher than those used in the first step. Lopez et al. (2004) utilized the conventional Fenton reaction to increase the BOD5/COD ratio above 0.5, to treat a raw leachate with an original BOD5/COD ratio equal to 0.22. After adjusting to pH <3.0, adding 10,000 mg/L of H2O2, and 830 mg/L of Fe2+, they demonstrated a maximum COD removal of 60% with a detention time of 2 hours (Co = 10,540 mg/L). Kim and Huh (1997) performed testing to raise the BOD/COD ratio in leachate from 0.04 to 0.58 by using a conventional Fenton process. They also found 92% color removal under the same conditions. Loizidou et al. (1993) treated leachate from a stabilized landfill near Athens, Greece, for a period of 24 hours using 40 mg/L of FeSO4 and 100 mL H2O2/L of waste. The initial COD concentration was 7000 mg/L, and the

46
final measured concentration was about 4550 mg/L (35% removal). For BOD5, the removal was 18% (Co = 3400 mg/L), but the final treated effluent concentration was 2800 mg/L. Englehardt et al. (2005) also used the Fenton process on pre-filtered and pH-adjusted leachate and achieved 61% removal of COD and also 14% removal of ammonia. Regarding ammonia, Lin and Chang (2000) reduced the concentration by 16% (Co = 33 mg/L) using an electro-Fenton process and a dosage of 750 mg H2O2/L (td < 30 minutes). They also obtained a colorless effluent. Calli et al. (2005) used the Fenton process on pretreated leachate. With a 60 second rapid mix of 1000 mg FeSO4/L and 2000 mg H2O2/L, and a sedimentation period of 30 minutes, 85% removal of the 1875 mg/L initial COD was recorded at pH < 4.0. As mentioned earlier, although Fenton treatment can potentially increase the biodegradability of organic compounds, the increase may not be sufficient to support subsequent biological treatment. For example, Kim et al. (2001) raised leachate BOD5/COD from 0.13 to 0.22 and 0.27 by Fenton and Fenton-like methods, respectively. And, Lin and Chang (2000) obtained a BOD5/COD ratio of 0.30 by electro-Fenton treatment of a leachate (original BOD5/COD = 0.10). A summary of treatment performance data for organics removal as documented in the scientific literature is found in Table 14. Information on the removal of other common leachate constituents other than organic color using the Fenton treatment process is scarce. Table 14. Summary of COD removal performance tests conducted with Fenton technologies on landfill leachates. H2O2 Dose (g/L)
Fe(II) Dose (mg/L)
CODo (mg/L)
BOD/CODbefore BOD/CODafter pH COD Removal (%)
Reference
0.2 600‐800
1050‐2020
0.05‐0.13 nr 4.0 60 Gau and Chang 1996
2.4 56 1150 <0.01 nr 3.0 70 Kim et al. 1997
1.5 120 2000 0.04 0.58 3.5 69 Kim and Huh 1997
15 20 330 <0.02 0.30 7.5 72 Welander et al. 1998
1.6 645 1500 0.02 nr 3.5 75 Kang and Hwang 2000
150 40 7000 0.49 0.62 3.0 35 Loizidou et al. 1993
4.3 4480 1288 nr nr 3.0 61 Deng 2007 7.6 4170 660
TOC nr nr 2.5 60 Abdul et
al. 2008

47
H2O2 Dose (g/L)
Fe(II) Dose (mg/L)
CODo (mg/L)
BOD/CODbefore BOD/CODafter pH COD Removal (%)
Reference
3.0 1000 1875 nr nr 4.0 85 Calli et al. 2005
1.5 2000 1800 0.13 0.22 3.0 52 Kim et al. 2001
1.2 1500 1800 0.13 0.27 4.5 45 Kim et al. 2001
0.2 300 1500 0.05 nr 6.0 70 Kim et al. 2001
0.2 300 1500 0.05 nr 8.5 14 Lau et al. 2001
1.0 830 10.540 0.22 0.50 8.2 60 Lopez et al. 2004
1.5.6.2.3 Ozone (O3) Ozone has been used as a chemical reagent, an industrial chemical, and an oxidant for water treatment for over a century (Glaze et al. 1987). Ozone is known to be a powerful oxidant and disinfection agent, with a thermodynamic oxidation potential that is among the highest of the common oxidants (refer to Table 13). The action of ozone itself is difficult to evaluate because ozone is highly unstable in water (t1/2 < 30 minutes in distilled water). It rapidly decomposes to the hydroxyl radical and reacts indiscriminately with a number of constituents. In principle, ozone should be able to oxidize inorganic substances to their highest stable oxidation states and be able to oxidize organic compounds to carbon dioxide and water to achieve complete mineralization. In practice however, ozone is known to exhibit selectivity with respect to oxidation affinity. In water treatment, ozone has been most successful for removing taste and odor in water, for aiding coagulation and filtration processes, and as a primary barrier to microorganisms during disinfection. Ozonation also significantly improves the biodegradability of organic residues and converts refractory COD to less complex molecules, CO2, and H2O (Fang et al. 2005). Geenens et al. (2000) achieved a maximum COD removal of only 30% with a specific ozone consumption of 1.5 g O3 per g COD (Co = 895 mg/L as O2). Imai et al. (1998) obtained slightly better results on leachate with an initial COD concentration of only 126 mg/L as O2. They reported 35% removal of COD with 10 minutes of contact time. Then, they further treated the effluent in two biological activated carbon fluidized bed reactors in series (anaerobic first and aerobic second with a 24 hour detention time) and improved the treatment to 63.5% removal of COD. This modification demonstrated 75% removal of BOD5 as well. Calli et al. (2005) used ozone on pre-treated leachate with an ozone dose of 2.8 g/L/h and a reaction time of 30 minutes. Under these conditions, they achieved 85% removal at pH = 9.0 (Co = 1875 mg/L). A summary of performance testing conducted with ozone on leachate is found in Table 15, which shows only moderate

48
removal of COD (25-67%) with a consistent increase in the BOD/COD ratio after treatment. Table 15. Summary of COD removal performance tests conducted with ozone technologies on landfill leachates. O3 Dose (g O3/g COD)
CODo (mg/L)
BOD/CODbefore BOD/CODafter pH Removal (%)
Reference
1.7 1050 0.00 Not recorded
8.5 67 Barratt et al. 1997
0.7 3500 0.01 0.21 8.2 67 Derco et al. 2002
3.1 14,600 0.20 0.32 7.8 56 Qureshi et al. 2002
1.3‐1.5 2300‐4970
0.13‐0.17 0.25 7.9‐9.0 30 Rivas et al. 2004
1.1 895 0.05 0.11 8.2 30 Geenens et al. 2000
0.53 4000 0.06 Not recorded
8.5 25 Sandya et al. 1995
Despite its strong oxidation power, ozone should be used with caution as formation of toxic byproducts (aldehydes and ketones) is known to occur. Economically speaking, ozone is regarded as energy-intensive because the oxidant must be generated on-site due to its instability, and therefore the process is more expensive (Geenens et al. 2000). Even if ozone has a theoretical oxidizing potential which is sufficient to directly convert many organic substances to mineralized end products, oxidation has been found to be further enhanced with the combined action of other oxidants (Steensen 1997), and ozone has been successfully combined with other oxidation processes, some of which are described further below. 1.5.6.2.4 Ozone and hydrogen peroxide (O3/H2O2) The use of ozone and hydrogen peroxide has the double effect of generating hydroxyl radicals and also directly oxidizing the contaminants, themselves. This combination is notably employed for wastes that are relatively impermeable to UV and for large flow volumes (Schulte et al. 1995). The combination of hydrogen peroxide with ozone requires a multi-step reaction mechanism to generate the hydroxyl radical as follows:

49
OHOHO
HOHO
OOOO
OOOHOHO
HHOOH
23
33
3232
2232
222
The overall equation of the formation of the hydroxyl radical is:
2322 322 OOHOOH
Schulte et al. (1995) established a comparison between the ozone process, the hydrogen peroxide process, and the combined ozone/hydrogen peroxide (O3/H2O2) process by monitoring the degradation of COD. They did not provide details about the origin of their samples, but they first confirmed that H2O2 itself is not very efficient, since the observed removal of COD was less than 6%. Using ozone by itself, they achieved a COD removal of 38%. By mixing the two reagents at a 1:1 ratio, they degraded 97% of the initial COD (Co = 760 mg/L). Wang et al. (2004) used a combination of 8 g O3 and 0.63 g H2O2 per liter of raw aged leachate to achieve 63% removal of 1100 mg/L of COD. Simultaneously, they degraded 40% of ammonia-nitrogen (Co = 455 mg/L). Compared to the results they obtained using only ozone, they concluded that the effect of H2O2 is relatively insignificant and did not justify the additional cost. This was also found by Geenes et al. (1999) as shown in Table 16, in which COD removal was only 28% without the peroxide addition. The literature reported on the combined ozone and hydrogen peroxide process shows a wide range of treatment efficiencies (see Table 16). Using different leachates with low COD and different ratios of reagent, the removal achieved varies. As a result, this process seems difficult to apply at full scale as leachate quantities also fluctuate widely. Table 16. Summary of COD removal performance tests conducted with O3/H2O2
technologies on landfill leachates. H2O2/O3 Dose (g/g)
CODo (mg/L)
BOD/CODbefore BOD/CODafter pH COD Removal (%)
Reference
0.3 2000 0.08 0.13 8.4 92 Bigot et al. 1994
0.5 nr nr nr 8.0 70 Schulte et al. 1995
0.25‐1.0 480 0.05 0.13 7.7 40 Haapea et al. 2002
0.4 2000 nr nr nr 95 Wable et al. 1993

50
H2O2/O3 Dose (g/g)
CODo (mg/L)
BOD/CODbefore BOD/CODafter pH COD Removal (%)
Reference
0.3 1360 <0.01 0.32 8.4 93 Geenens et al. 1999
0.0/0.76 895 0.05 0.14 8.2 28 Geenens et al. 1999
1.5.6.2.5 Ultraviolet light (UV) Ultraviolet light is commonly used for disinfection applications. The process involves direct photolysis of bacterial DNA at biocidal wavelengths (e.g. 254 nm). However, UV is also known to enhance the production of the hydroxyl radical (Schulte et al. 1995) by direct photolysis of water, but this is not its only action in water treatment. Indeed, the same authors explained that because of UV-light absorbing properties, many molecules are destroyed directly by photolysis or are activated by photosensitivity, thus making them more easily oxidizable. Using three 150-W lamps and a 60-minute reaction time, Schulte et al. (1995) removed approximately 15% of COD from landfill leachate with an initial COD concentration of 760 mg/L. Dobrović et al. (2007) also used the UV process to decrease the natural organic matter in lake water. They used mercury lamps with a total ultraviolet output of 13.8 W. The COD removal was noticeable in just over 12 minutes of treatment. They estimated the reaction to be first order with a reaction rate constant of 6.8×10⁻³ min-1. They also estimated the organic matter half-life to be on the order of 41.1 minutes. Deng and Englehardt (2007) reported that UV alone has been used for treatment of leachate with COD removal efficiencies of up to 31% at optimum conditions. In general, UV by itself does not appear to be a very efficient treatment process for applications involving leachate. For instance, metals are not affected by UV, which explains why UV is typically combined with other reagents to achieve better removal efficiencies.

51
1.5.6.2.6 Photo-Fenton / Fenton-like systems The photo-Fenton process consists of the addition of UV energy to the Fenton reaction. At low pH, the Fe(OH)2+ complex is formed and is subsequently oxidized by UV radiation according to the following reaction sequence:
OHFeOHFe
HOHFeOHFehv 22
22
3
)(
This has the effect of generating the Fenton catalyst in-situ and enhancing the production of hydroxyl radical through direct photolysis and also by reaction. Kim et al. (1997) used photo-Fenton reactions on municipal landfill leachate that was pre-treated biologically. After pH adjustment to pH < 3.0, the optimum conditions for maximum degradation were: [Fe2+] = 1.0 × 10⁻³ M (56 mg/L) and a molar ratio of 1:1 COD:H2O2. The starting COD concentration was 1150 mg/L, and after two hours of treatment at 80 kW/m3, the observed removal was 70%. Morais and Zamora (2005) used the photo-Fenton process to pre-treat raw mature leachate from a sanitary landfill in Brazil. They used a medium-pressure mercury vapor lamp (125 W), an O2 aeration system (Q = 45 mL/min), and reagent concentrations of 2000 mg H2O2/L and 10 mg Fe2+/L. The pH was adjusted to 2.8, and after 60 minutes, the initial COD concentration of 5200 mg/L as O2 was reduced to 2240 mg/L as O2, which equals a removal of 57%. They also greatly improved the biodegradability of the leachate by increasing the BOD5/COD ratio from 0.13 to 0.40. This confirms the general opinion that many AOPs enhance the biodegradability of landfill leachate. They proposed to use this process as a pre-treatment of leachate before biological treatment. Kim et al. (2001) used photo-Fenton treatment to increase the BOD5/COD ratio of leachate from less than 0.05 to greater than 0.60. Lau et al. (2002) applied photo-Fenton treatment to increase leachate BOD5/COD from 0.08 to 0.14. Deng and Englehardt (2006) studied the Fenton and photo-Fenton processes from treatment of landfill leachates using ferrous sulfate and hydrogen peroxide at circumneutral pH. After rapid mixing from 30 seconds to 60 minutes at impellor speeds of 80-400 rpm, they flocculated for 10-30 minutes at 20-80 rpm, followed by sedimentation for periods of from 30 minutes to several days. They found that at optimal pH (2.0-4.5), the removal of COD increased with increasing concentration of iron salt, but removal may be marginal when the concentration of iron salt is high, and the lower pH range inhibited subsequent precipitation and sedimentation. They also optimized the molar ratio of H2O2 to Fe2+ at 11:1. Using these conditions, they demonstrated 51% COD removal at 80 kW/m3, but they found no oxidation of ammonia and encountered severe issues with foaming that inhibited mass transfer of hydroxyl radicals to the bulk solution. A summary of the COD removal performance for photo-Fenton processes obtained from the scientific literature is presented in Table 17.

52
Table 17. Summary of COD removal performance tests conducted with UV/Fe(II)/ H2O2 technologies on landfill leachates. H2O2 Dose (g/L)
Fe(II) Dose (mg/L)
UV (W)
CODo (mg/L)
BOD/CODbefore BOD/CODafter pH COD Removal (%)
Reference
1.15 56 500‐1000
1150 <0.01 nr 3.0 70 Kim et al. 1997
2.0 10 125 5200 0.13 0.40 2.8 57 Morais and Zamora 2005
10 2000 150 3300‐4400
0.15‐0.24 nr 3.5 86 Primo et al. 2008
Advanced oxidation processes such as conventional Fenton, photo-Fenton and electro-Fenton are powerful advanced oxidation processes that effectively degrade refractory organics and persistent organic pollutants, which are difficult to decompose by other processes such as biological systems. But alone, they appear to be limited and instead must be used as a pretreatment step to facilitate other degradation processes. 1.5.6.2.7 Ultraviolet light and hydrogen peroxide (UV/H2O2) Using UV and H2O2 without iron or catalyst addition for water treatment results in three modes of treatment: 1) direct photolysis by UV, 2) direct oxidation by H2O2, and 3) the indirect generation of hydroxyl radicals. Direct photolysis of hydrogen peroxide also leads to the formation of hydroxyl radicals by the splitting of the oxygen-oxygen bond (Schulte et al. 1995):
OHOH hv 222 The oxidation of combined UV/H2O2 processes is more effective at low pH (pH = 2 – 4), which requires pH adjustment and reduction of alkalinity (Steensen 1997). Shu et al. (2006) enhanced the efficiency of their first experiments with H2O2 (described earlier) by adding four UV lamps. With this new set-up, they improved the COD removal from 60% with hydrogen peroxide alone to 65%, while reducing the reaction time in half from 600 minutes to 300 minutes. The formation of hydroxyl radical was greatly improved by the addition of UV energy. They also demonstrated the importance of the initial COD concentration on process performance. Indeed, the COD removal increased as the initial COD concentration decreased: 59.2, 61.5 and 88.1% removals were obtained with leachate strengths of 100, 50 and 20%, respectively when keeping the detention time constant at 180 minutes. Morais and Zamora (2005) also performed experiments with the UV/H2O2 process and reduced COD by 55% (H2O2 = 3000 mg/L). This confirms the initial finding that AOPs can enhance the biodegradability of sanitary landfill leachate. Other experimental results are found in Table 18, where Steensen (1997) shows that

53
removal is relatively independent of lamp power, and Qureshi et al. (2002) shows that increasing the hydrogen peroxide dose, increases the process removal efficiency from 79% COD removal at 5.2 g H2O2/L to 96% COD removal at 26 g H2O2/L . Table 18. Summary of COD removal performance tests conducted with UV/H2O2
technologies on landfill leachates. H2O2 Dose (g/L)
UV (W)
CODo (mg/L)
BOD/CODbefore BOD/CODafter pH Removal (%)
Reference
0.5 15 1100 <0.01 nr 3‐4 90 Steensen 1997
0.5 150 1000 <0.01 nr 3‐4 85 Steensen 1997
5.2 1500 26,000 0.11 0.37 3.0 79 Qureshi et al. 2002
13 1500 26,000 0.11 0.40 3.0 91 Qureshi et al. 2002
26 1500 26,000 0.11 0.45 3.0 96 Qureshi et al. 2002
1.5.6.2.8 Ultraviolet light and ozone (UV/O3) Ozone readily absorbs UV radiation to form H2O2, which will itself decompose into hydroxyl radicals by the following mechanism:
OHOOHO hv 2223
Prengle and co-workers at Houston Research Inc. were the first to see the commercial potential of the UV/O3 system (cited from Glaze et al. 1987). They showed that activating O3 with UV energy enhances the oxidation of COD and BOD and also complexed cyanides, chlorinated solvents, and pesticides as well. Other studies conducted on the combined effect of ozone and hydrogen peroxide show a COD removal efficiency on the order of 47-63% (see Table 19). Table 19. Summary of COD removal performance tests conducted with UV/O3
technologies on landfill leachates. O3 Dose (gO3/gCOD)
UV (W)
CODo (mg/L)
BOD/CODbefore BOD/CODafter pH Removal (%)
Reference
1.0 15 2300 0.09 nr 8.0 50 Bigot et al. 1994
nr 100 1280 0.08 nr 2.0 54 Ince 1998
nr 500 1280 0.08 nr 2.0 47 Ince 1998

54
O3 Dose (gO3/gCOD)
UV (W)
CODo (mg/L)
BOD/CODbefore BOD/CODafter pH Removal (%)
Reference
3.5 1500 26,000 0.11 0.32 7.8 63 Qureshi et al. 2002
4.7 1500 26,000 0.11 0.35 7.8 61 Qureshi et al. 2002
Ince (1998) used the UV/O3 combination on pretreated leachate from a municipal landfill. He applied 3.0 g H2O2/L and compared the influence of: 1) wide band UV wavelengths from 200 to 470 nm from a high pressure mercury lamp (500 W) and 2) the monochromatic germicidal wavelength (λ = 253.7 nm) from a low pressure mercury lamp (100 W) for a contact time of 8 hours. With the first lamp, the removal percentage was 47%, and the second lamp achieved 54% removal of COD (Co =1290 mg/L). This demonstrates the importance of the UV wavelength or delivery mechanism in the overall process efficiency. The UV/O3 process can also be upgraded by adding hydrogen peroxide as a third oxidant as discussed below. 1.5.6.2.9 Ultraviolet light, ozone and hydrogen peroxide (UV/O3/H2O2) The addition of H2O2 to the O3/UV process accelerates the decomposition of ozone, resulting in an increased rate of hydroxyl radical production. The conjugate base of H2O2, HO2
- has been shown to initiate this mechanism (Kidman and Tsuji 1992, Munter et al. 2001):
3232 OHOOHO
This step initiates the decomposition of ozone resulting in the production of additional hydroxyl radicals. Ince (1998) achieved 89% removal of COD with an initial concentration of 1280 mg/L, while using these three oxidants together (as shown in Table 20). Reactor conditions were: 3 g O3/L, 2.1 g H2O2/L, a low pressure mercury lamp, and contact time of eight hours. In the absence of O3, the system removed 59% of the COD, and in the absence of H2O2, the system removed only 54% of the COD. This energized process can be compared to the experiments conducted by Loizidou et al. (1993) who were using only H2O2. Percentages of removal are not equal, but the actual quantities of COD removed were very similar. This observation demonstrates that the combination of UV, O3, and H2O2 is still not capable of improving the quality of leachate to the level sufficient for safe discharge to the environment.

55
Table 20. Summary of COD removal performance tests conducted with UV/O3/H2O2 technologies on landfill leachates. O3 Dose (g/L)
H2O2 Dose (g/L)
UV (W)
CODo (mg/L)
BOD/CODbefore BOD/CODafter pH Removal (%)
Reference
3.0 2.1 100 1280 0.08 nr 2.0 89 Ince 1998
0.0 2.1 100 1280 0.08 nr 2.0 59 Ince 1998
3.0 0.0 100 1280 0.08 nr 2.0 54 Ince 1998
1.5.6.2.10 Electrochemical oxidation Electrochemical oxidation uses the process of electrolysis to effect treatment. A typical electrolytic system includes a direct current (DC) power supply, a cathode, an anode, and the electrolyte, which is the medium that permits ion transport between the anode and the cathode. Metal cations are removed at the cathode via reduction, and other constituents, most notably non-biodegradable organics, can be oxidized at the anode. Additionally, an oxidation reaction may occur in the bulk solution by secondary oxidants generated by partial oxidation at the electrodes. Electrochemical oxidation has been investigated as an efficient means of controlling pollution in water and wastewater treatment applications (Comninellis and Pulgarin 1991; Rao et al. 2001; Canizares et al. 2005), and recently Deng and Englehardt (2007) have studied its potential for landfill leachate treatment. They demonstrated COD removal of 70 to 90% after pretreatment with a sequencing batch reactor, which reduced the energy requirements by 31% compared to direct electrochemical oxidation. They also investigated pretreatment with chemical coagulation and activated carbon adsorption, which achieved 90% COD removal but increased the overall energy consumption by 20%. Byproducts were not investigated. Electrochemical oxidation can reduce concentrations of organic contaminants, ammonia, and color in leachate (Comninellis and Pulgarin 1991; Rao et al. 2001; Deng and Englehardt 2007). Using a constant flow rate of 2000 L/h for 180 min and at a current density of 1160 A/m2, Moraes and Bertazzoli (2005) achieved a maximum removal of 73% COD (Co = 1855 mg/L) and 49% ammonia-nitrogen (Co = 1060 mg/L). These results suggest that electrodegradation is an alternative means to breakdown recalcitrant organic compounds in landfill leachate. However, due to high energy consumption, this technology is more expensive than other treatment methods. As a result, this treatment technique has been investigated less extensively for the treatment of stabilized leachate. Pretreatment methods, anode materials, pH, current density, chloride concentration, and competing electrolytes can considerably influence performance, and high energy consumption and the formation of organochlorine byproducts may limit its application.
56
1.5.6.2.11 Photocatalytic oxidation The photocatalysis principle is based on the excitation of a metal semiconductor by photons to produce an electron-hole pair. This pair has a very powerful oxidation potential and should be able to oxidize almost any chemical. Munter et al. (2001) proposed the following reaction mechanism, where h+ is a “hole,” e- is an electron, and R is a generic organic compound:
RHRHh
OHRRHOH
RHOHRHOH
OHOHh
OOe
2
22
According to Munter et al. (2001), the presence of dissolved oxygen is necessary for this reaction to take place. It prevents the recombination of the electron-hole pair, while producing H2O2 in the process:
222
22
22
OHeHHO
HOHO
OeO
The hydrogen peroxide is then free to combine with iron for a Fenton reaction or to break down into hydroxyl radicals for secondary oxidations. Titanium dioxide (TiO2) is one of the most widely used metal oxides in the industry for photocatalytic applications. TiO2
particles generate strong oxidizing power when illuminated with UV light at wavelengths less than 400 nm. Irradiation of TiO2 with photons of light energy produce areas of positive charge in the valence band of the semiconductor (“holes”) and free electrons in the conductance band. When the “holes” and free electrons interact with water trapped in the pores of the catalyst, a mixture of indiscriminate oxidants are generated including hydroxyl radical (HO•) and superoxide radical (O2•
-). For photocatalysis to occur, electron “holes” must migrate to the surface of the TiO2 crystal. The “holes” primarily react with hydroxide (OH-) from water acting as electron donors to produce hydroxyl radicals. The electrons primarily react with O2(aq) (dissolved oxygen) in water acting as electron acceptors to yield the superoxide radical. Some of the electron-hole pairs, which do not participate in the redox reaction with water or oxygen, disappear as heat losses via the recombination of holes and electrons. Utilizing the combined oxidation power of holes and hydroxyl radicals generated in the valence band (VB), and electrons and superoxide radicals generated in the conduction band (CB), illuminated TiO2
photocatalysts can decompose organic compounds by participating in a series of mineralization reactions (Rincon and Pulgarin 2005). The effect of pH in this process has not been fully investigated yet. Several researchers report success with acidic waste

57
streams (pH < 4.5) (Bekbölet et al. 1996; Cho, Hong, and Hong 2002; Toor et al. 2006). In a case study of the end point of photocatalytic degradation of landfill leachate containing refractory matter (Cho, Hong, and Hong 2002), 52% COD removal and 79% TOC removal was found after 5 hours, and 56% COD removal and 88% TOC removal after 10 hours, with an initial pH of 3.1. On the other hand, with initial pH of 6.5-7.0, TiO2 photocatalytic processes have also been demonstrated to achieve 99% removal efficiency of phenol in 160 minutes with irradiation of 254 nm (Ilisz et al. 2002). Photocatalytic processes for destruction of organics via the hydroxyl radical oxidation pathway are well known; however, recently the destruction of certain nitrogen-containing organic pollutants through a reductive pathway has been reported (Schmelling et al. 1996). In addition, Vohra and Davis (2000) measured nearly 70% removal of lead at circumneutral pH after 50–70 minutes of treatment, which indicated that adsorption of intermediate complexes containing organically bound inorganics by TiO2 particles can occur.
TiO2 photocatalysts have generated much attention in environmental waste treatment applications because they generate highly oxidative radicals, which can mineralize a wide variety of aqueous refractory organic contaminants under UV radiation. Hydroxyl radical attack is reported to be the primary mechanism of decomposition. A literature review of photocatalytic alternatives for detoxification and treatment of leachate revealed that several researchers have investigated a wide range of photocatalytic techniques such as: fluidized bed photocatalysis (Kanki et al. 2005; Kostedt and Mazyck 2006; Mazyck et al. 2004), photocatalytic detoxification with thin film fixed bed reactors (Bekbölet et al. 1996), fixed film spinning discs (Yatmaz et al. 2001), fixed film slurry reactors (Toor et al. 2006), plug flow fixed film reactors (Grzechulska and Morawski 2002), and a process similar to the one investigated here, which utilizes fine particles suspended in solution in a batch-type treatment process (Cho et al. 2002). In terms of reactor design, many successful experiments have used glass plates coated with immobilized catalyst, TiO2. For instance, Hilmi et al. (1999) used this design in a photocatalytic process to remove mercury, lead, copper, and cadmium from aqueous solutions containing individual metals and mixtures. In those tests, individual metals at concentrations of 1.0 to 5.2 mg/L were reduced to undetectable levels in less than one hour of treatment. Bekbölet et al. (1996) performed experiments with leachate but were not very successful using a thin film fixed bed reactor. They achieved only 3% TOC reduction with 5 g/L Degussa P25, but at pH < 3-5, they increased removal to 4%. They found that when inorganic salts were present, degradation was inhibited and recommended that at high concentration levels, dilution with recirculation of treated wastewater would be beneficial compared to a single pass system.
As far as treatment of specific contaminants, Grzechulska and Morawski (2003) used a photocatlytic labyrinth flow reactor with immobilized Degussa P25 (52 m2/g) beds for removal of phenol from water. The photocatalyst was fixed to the bottom of the reactor using polymer glue, and utilized only half of the available surface area. UV lamp power was 140 W. They were able to achieve maximum removal at a starting concentration of

58
50 mg/L phenol in a reaction time of 5 hours. However at 300 mg/L phenol, the activity of the photocatalyst was noticeably impacted due to near complete coverage of the photoactive surface area with partial decomposition products of phenol. This was confirmed by FTIR (Fourier Transform Infrared Spectroscopy). Another example of studies conducted with immobilized photocatalysts (Kim, Lee, and Shin 2003) found that electrodes coated with TiO2 prepared by HCl etching and painting with TiCl3 have low surface resistivity, large surface area, and are capable of treating wastewater containing 50 mg/L of 4-chlorophenol dissolved in 0.2 M NaNO3. The photocatalytic reaction efficiency was enhanced by 90% by suppressing the recombination of hole-electron pairs. Yatmaz, Wallis, and Howarth (2001) investigated a novel application of immobilized photocatalysis using a spinning disc reactor with a 400 W UV source rotating at 350 rpm. They also found that the thin film slurries enhanced the transfer of organic constituents to the photocatalytic surface, but it was still less efficient than using particles of Degussa P25. Also at pH 3.1, they found that low pressure lamps (λpeak = 254 nm) outperformed medium pressure lamps (λpeak = 365 nm). This finding hints at the possibility of using solar energy to power the process. Zhang, Anderson, and Moo-Young (2000) investigated the use of solar radiation on fixed films of photocatalysts for treatment applications. They immobilized the photocatalyst on both sides of 0.05 m × 0.5 m corrugated plates and compared effects from solar radiation on one side and UV-A fluorescent lamps on the opposite side of the plate. Capture of reflected photons was shown to depend strongly on the angle of the corrugated plates. It was found that the smaller the angle of the plate (<30°), the higher the energy absorption efficiency. Also corrugated plates were found to enhance energy absorption efficiency by more than 100% for solar UV and by 50% for UV-A fluorescent lamps.
Immobilized catalysts are easy to install and reuse but they are limited in the effective surface area available for treatment. Therefore, Kanki et al. (2005) investigated fluidized bed photocatalytic reactors with 0.7 mm diameter ceramic microbeads coated with TiO2 using the sol-gel method. The reactor volume was 4 liters and used two 9W UV lamps. With a particle concentration of 7-12% volume fraction of the reactor, the bed was fluidized by bottom aeration at 0.5 Lpm to study the degradation of phenolic compounds (Co = 10 mg/L). This study found that phenol can be mineralized in 250 minutes, and bisphenol A in 350 minutes. The only intermediates detected were butareoxidized organic acids. Tests were also conducted using ambient solar light, and treatment times were on the order of 4 times longer. Following the same line of investigation, shallow slurry reactors for color removal were investigated by Toor et al. (2006) using 30 nm diameter anatase-based TiO2 powder (50 m2/g). At an optimum dose of 2 g/L for 3 hours at 25-50 W/m2, the removal of yellow dye was maximized at pH<4.5. In laboratory studies of photocatalysis of landfill leachate, the optimal concentration of TiO2 photocatalyst typically varies from 1.0 g/L (Kostedt and Mazyck 2006) to 5.0 g/L (Bekbölet et al. 1996). TiO2 additives are typically used in one of two forms: 1) immobilized onto a substrate, or 2) suspended in solution in a slurry of fine particles. Using suspended particles is advantageous as it allows maximal utilization of the available specific surface area. Cho,

59
Hong, and Hong (2002) conducted some batch-type experiments on the photochemical oxidation process using Degussa P25 TiO2 particles with a diameter of 20 mm. Combined with aeration, this process achieved 80% removal of COD (Co = 1400 mg/L) but essentially no removal of ammonia when they adjusted to pH < 4 with H2SO4. Conversely, at pH > 12, only 20% COD removal was possible, but the process also achieved 16% removal of ammonia (Co = 1525 mg/L as NH3-N). Both experiments were run for 12 hours. The influence of pH on degradation of organic compounds and ammonia-nitrogen is such that low pH favors the oxidation of organic matter and high pH enhances the stripping of ammonia. If an optimum pH range can be found, then the two removal mechanisms could occur simultaneously in a small reactor. This reactor configuration was also used to test the ability of TiO2 photocatalysis (Degussa P25; 1.0 g/L) to effectively disinfect wastewater using a 12 L coaxial photocatalytic reactor (Rincon and Pulgarin 2005). Using E. coli and Bacillus as indicators, the process was found to follow Chick’s Law with pH dependence when activated with λ = 364 nm. Tests conducted without UV energy activation showed no disinfection. It is interesting to note that agitation with oxygen enhanced the process. Toor et al. (2006) reported a concentration-dependence in their experiments, which suggests that if the surface per unit volume ratio can be increased, then the process can possibly achieve higher removal efficiencies. This means that the particle size must decrease. Cho and co-workers tested Degussa P25 TiO2 particles with a diameter of 20 nm (2002). The trend has been towards developing smaller particle sizes in the nanometer range. This can be done by carefully controlling the calcination temperature. The tradeoff is that the particles have lower purity but can be much smaller in diameter by decreasing particle agglomeration, which occurs readily at higher temperatures. Since suspended TiO2 catalysts enjoy free contact with UV irradiation in an aqueous photoreactor, they would be expected to achieve higher levels of efficiency compared to immobilized TiO2
catalysts. However, the separation and reuse of suspended catalyst powders from treated water often limits this application in practice, particularly as the diameter of the photocatalyst decreases. To retrieve the used photocatalyst (i.e. Degussa P25), two primary options have been used by investigators: 1) vacuum filtration with a 0.2 μm nitrocellulose membrane filter (or similar) type of setup, or 2) centrifugation of the treated liquid at very high speeds to separate the particles. If vacuum filtration is used, once recovered on the filter, according to Kostedt (personal communication July 2007), it is possible to dry the catalyst at 105°C and re-use the catalyst. In the field, this could be accomplished using exhaust heat from waste-to-energy plants. To improve the ability to recover photocatalysts, a TiO2-magnetite process has been proposed. A FAU, a new type of TiO2 catalyst is coated onto a magnetic substrate, which can be easily separated from aqueous solution using an applied magnetic field. The chemistry of heterogeneous photocatalysis is complex and depends on operating conditions such as pH, temperature, UV intensity, the presence of competing organic or inorganic compounds, mass transfer limitations, and oxygen concentration. Until now, this technology was thought to be too expensive because of the amount of catalyst surface area and the amount of energy required for activation and mixing. However, a new TiO2-

60
magnetite nanoparticle, developed through a collaboration with Dr. Tsai (FAU-Mechanical Engineering) and Dr. Sun (visiting research professor from Northeastern University, China), uses a novel microemulsion method to coat a magnetic substrate. This technique is cost-effective, since comparatively low-cost inorganic metal salts are used as raw materials instead of expensive metal-alkoxides to achieve uniform particle size/shape and high surface area to volume ratios. In addition, the process proposed for our synthesis of the TiO2-coated Fe3O4 nanopowder produces a byproduct (NH4Cl), which can be recovered for use as a fertilizer, for example, and thus is not harmful to the environment. The latest version of the TiO2-Fe3O4 nanocomposite particle is characterized by high photoactivity and high surface area to volume ratio, but suffers from reduced magnetic properties. If used in a photocatalytic fluidized spray with agitation by external magnetic field, the contact between the photocatalyst, the light source, and target pollutants will be enhanced, potentially improving reaction kinetics. If the magnetic properties of the core can be worked out, TiO2-magnetite will enhance process efficiency by permitting precise control of mass transfer and allow the particles to be easily retrieved from the photoreactor for separation and reuse. Cho, Hong, and Hong (2002) also investigated photocatalytic degradation of landfill leachate. In these tests, suspended Degussa P25 (70% anatase) was used (diameter = 20 nm). Photodegradation of refractory and nitrogen-containing substances was favored under acidic conditions (pHoptimal = 4.0). Degradation increased with photocatalyst concentration until 8000 mg/L. Photocatalyst particles in these experiments were removed after treatment using 3000 rpm centrifuge for 20 minutes and washed with deionized water and dried for 24 hours at 103°C and by filtration with a GF/C filter. The same researchers (Cho, Hong, and Hong 2004) continued this work and reported 52% COD removal and 79% TOC removal after 5 hours at pH = 4.0 with a photocatalyst dose of 3.0 g/L in a continuously stirred aerated quartz tube reactor at λ = 254 nm. Under these conditions, 20% of the TOC was found to adsorb onto the photocatalyst particles after just one hour of treatment. And the pH was found to increase from 4.5 to 5.3 in the same period of time. Doubling the reaction time to 10 hours increased removal only slightly to 56% for COD and 88% for TOC.
When UV/TiO2 was used for treatment of leachate with BOD5/COD <0.05, 80% removal of COD was achieved (Deng and Englehardt 2007). Deep color in wastewaters such as landfill leachate can significantly impede the transmission of light (including UV) through the solution, so photo-efficiency is reduced and fewer radicals are produced. However, the process may only be able to oxidize the color, if it is organic in origin. In summary, the application of photocatalytic technology has been shown to be successful in removal of organics, inorganics, nitrogen-containing compounds, and even pathogen indicators. However, to our knowledge, the process has not been demonstrated at field scale for treatment of highly variable, high strength wastewaters, such as those characteristic of landfill leachate.

61
1.5.6.2.12 Iron-Mediated Aeration (IMA) Although zero-valent iron (ZVI) has been extensively studied for the reductive dechlorination of organic compounds over the past 20 years (see Tang 2004 for a review), the degradation of organic compounds through iron-mediated oxidation in oxygen-containing water has only recently been reported (Englehardt et al. 2002; Noradoun et al. 2003; Englehardt et al. 2005; Joo et al. 2004 and 2005; Meeroff et al. 2006; Englehardt et al. 2007). The reaction mechanism of IMA is still not completely known, but evidence suggests that it involves:
The oxidation of Fe(s) to Fe2+ The creation of hydroxyl radical according to the Fenton reaction The oxidation action of hydroxyl radical The co-precipitation action of ferric precipitates The stripping action of the aeration
Both non-ferric iron and aeration were found essential for effective removal of organic compounds. Joo et al. (2004 and 2005) reported oxidative degradation of molinate (a carbothioate herbicide), benzoic acid, aniline, o-hydroxybenzoic acid, phenol, and humic acids using nanoscale iron metal. However, they reported that pH was important, in addition to iron metal and air supply. Lower pH resulted in increased degradation of these organic compounds. And, the significant scavenging effect of 1-butanol, a well-known hydroxyl radical scavenger, on Fe(0) oxidation of molinate implied a Fenton mechanism of oxidation. Noradoun et al. (2003) reported complete destruction of separate mixtures of 1.1 mM of 4-chlorophenol and 0.61 mM of pentachlorophenol, in the presence of 0.5 g of iron particles in 10 mL of 0.32 mM ethylenediamine tetraacetic acid (EDTA) under ambient aeration at room temperature. They found that the presence of EDTA greatly improved degradation of these organic compounds, and attributed this observation to the formation of FeII[EDTA] that might improve the redox cycle between Fe(0) dissolution, the Fenton reaction, and O2 reduction to H2O2. Three explanations for the oxidative capacity of iron-EDTA-mediated aeration were suggested: 1) heterogeneous activation of O2 at the Fe(0) surface, 2) homogeneous activation of O2 by FeII[EDTA], and 3) heterogeneous activation of O2 in conjunction with EDTA producing a surface-bound ferryl species (high valent iron). IMA treatment for landfill leachate was first studied during the FCSHWM-funded project entitled, “Investigation of options for management of leachate and wastewater,” directed by Dr. Englehardt (University of Miami) and Dr. Meeroff (Florida Atlantic University) in 2005. They were the first researchers to successfully demonstrate the IMA process for in-situ remediation of organic and metallic contaminants in soil and groundwater at former nuclear weapons facilities managed by the U.S. Department of Energy (2002). Then, they used the process to oxidize organics and co-precipitate inorganics in simulated wastewater (Englehardt et al. 2005; Meeroff et al. 2006; Englehardt et al. 2007). They achieved 99.996% removal of arsenic and 99% removal of EDTA.

62
Using the IMA process at pH 8.2, Englehardt et al. (2005) reduced the COD of leachate by 56%, and increased the BOD5/COD mass ratio from 0.1 to 0.28. In addition, the treatment was able to achieve 83% reduction in ammonia and 40% reduction in the effluent electrical conductivity of the leachate. Furthermore, two logs of removal of EDTA, Cd2+, Hg2+, and Pb2+, and an average 63% removal of Ni2+ were achieved (Englehardt et al. 2003). At the same time, 1-2 logs of removal of 1.0 mg/L 17-β-estradiol (estrogen) and di-n-butyl phthalate was removed in simulated natural waters at pH 7.5. Deng and Englehardt (2008) were able to increase the efficiency of the IMA process with the addition of hydrogen peroxide reagent. At pH 8.2, COD was reduced by 50%, the BOD/COD ratio was increased from 0.02 to 0.17, 83% ammonia-nitrogen, and 38% of TDS was also removed with this modification. In summary, the newly developed IMA process has shown some promising removal capacities in laboratory tests, and Meeroff et al. (2006) demonstrated a preliminary cost projection below $0.05 per gallon for IMA treatment for scale-up. Laboratory scale testing of IMA has demonstrated that both organics and inorganics can be treated simultaneously. Based on the ranking established during this project, the IMA process may be, at the laboratory scale, one of the most promising AOPs for treatment of all of the constituents found in landfill leachate. 1.5.6.2.13 Photochemical Iron-Mediated Aeration (PIMA) Preliminary studies of the IMA process enhanced with UV radiation were first conducted by Englehardt et al. (2005). This modification was called photochemical iron-mediated aeration (PIMA). PIMA is a new photochemically-assisted iron-mediated aeration process for oxidizing organics and co-precipitating inorganics in wastewater, which is currently under development at the University of Miami and Florida Atlantic University. In non-energized laboratory tests, iron-mediated technologies have been shown to oxidize estrogen, EDTA, and phthalate; co-precipitate arsenite, arsenate, mercury, chromate, nickel, lead, cadmium, vanadate, strontium, and nitrate; and inactivate E. coli, coliform, and heterotrophic bacteria (Englehardt et al. 2003; Meeroff et al. 2006). Results suggest oxidation via hydroxyl radical and/or ferryl species, implying indiscriminate oxidation of organics. A particularly surprising result from preliminary laboratory scale tests was that radical scavenging was not observed to terminate the reaction, even with 200 mg/L of bicarbonate and 33% more TOC than raw sewage. Furthermore, the reaction is thought to involve a self-regenerative reactive surface area associated with the soluble Fe(II) phase, which may have a larger effective surface area than proposed new nanocatalysts. The basis for PIMA comes from the fact that under aerobic conditions, some ferric chelates are known to be rapidly photodegraded by solar/UV radiation with a half-life on the order of 2 hours (Frank and Rau 1990; Kari et al. 1995; Lockhart and Blakely 1975). The rate of photodegradation is pH-dependent (optimized at pH<3.1) (Metsärinne et al. 2001). The ferric iron acts as a photosensitizer and may also participate in the formation of oxidants through photo-Fenton chemistry (Meeroff et al. 2006). In the presence of

63
complexed ferric iron, the photoassisted Fenton reaction (λ < 360 nm) can accelerate the rate of hydroxyl radical formation by two orders of magnitude, while regenerating ferrous iron to propagate a Fenton cycle (Kwan and Chu 2003). Furthermore, photochemical oxidation with added iron catalysts has been demonstrated for pH 3-8 at millimolar concentrations of organically-bound trace metal contamination (Davis and Green 1999).
Preliminary tests focused on methods to effectively enhance previously demonstrated IMA processes for degradation of EDTA and facilitate the release of bound metal cations, such as Cd, for subsequent removal from solution. The effect of added ultraviolet energy was investigated in comparison to non-energized IMA. Preliminary results indicated that the PIMA process increased the reaction rate for EDTA destruction by a factor of 4 compared to conventional IMA at circumneutral pH (Meeroff et al. 2006). This is an unexpected result since Fenton-like chemical reaction rates are known to be unfavorable at ambient pH (i.e. 6-8). Another surprising result of preliminary testing with EDTA was that identified oxidation byproducts were non-hazardous or readily biodegradable. Furthermore, only about 10% of the original carbon content was accounted for, indicating the possibility of near complete (>90%) mineralization. The implication here is the potential to completely destroy environmentally stable and persistent organic compounds, without pH adjustment or costly chemical addition. Also indications are that PIMA can be more rapid, and perhaps more thorough, than natural biodegradation in terms of eliminating environmental contamination.
Initial laboratory scale experiments with leachate found no significant difference between the PIMA and IMA technique. This result is attributed to the reactor design, the weakness of the UV source, and the steel wool packing density. However, in additional bench-scale experiments, Meeroff et al. (2006) showed a cadmium removal of 29% in a PIMA reactor compared to just 5% in the non-energized control IMA reactor (reaction time was 256 minutes and initial concentration was 0.10 M). The addition of UV seems to improve the removal of cadmium under these conditions. Meeroff et al. (2006), Meeroff, Gasnier, and Tsai (2006 and 2008), and Meeroff (2010) conducted bench scale tests using PIMA at 10 mW/cm2 and found that the process removes color and Pb (>90%) very effectively. They also found that COD and BOD5 were removed at 50%, and the process is capable of removing ammonia with pH adjustment. However, PIMA was unable to address odors or TDS. To our knowledge no other studies have been conducted on the PIMA process, and this technology is still at an immature stage.
1.5.6.2.14 Summary of chemical oxidation processes Table 21 shows the relative effectiveness of different chemical oxidation technologies for the removal of key constituents found in typical leachate. In conclusion, chemical oxidation processes have advantages in being able to achieve high process removal efficiencies for a variety of constituents of concern. However, most available process efficiency data is for COD removal, so it remains to be seen if any one of these listed technologies can handle a variable mixed waste stream like landfill leachate, without additional more complex treatment processes being required. An issue that commonly arises with most chemical oxidation processes is the high energy consumption for

64
ultraviolet irradiation. If the power requirement can be achieved with ambient levels of solar radiation, then this would become a non-issue, but this has not been demonstrated in the field yet. In addition, if the process is catalytic, the cost of reagents is nullified. When, treating young leachate, certain advanced oxidation techniques can provide reasonable treatment performance with respect to COD, ammonia-nitrogen, and heavy metals, some even simultaneously, but biological methods may be more cost effective. When treating far less biodegradable mature leachate, advanced oxidation treatments may be more suitable as a pre-treatment step (or a sequence of pre-treatment steps) to remove refractory organics before biologically treating the leachate. Combining chemical, physical, and biological processes, regardless of the order of treatment, generally attenuates the disadvantages of each individual process, thus contributing to a more efficient level of the overall treatment, but at a higher cost and level of complexity. In summary, the most promising treatment technologies would include some form of advanced oxidation process that can be made catalytic with minimal ultraviolet energy requirements. Table 21. Relative effectiveness of chemical oxidation treatment processes for landfill leachate. Process Young Medium Mature Removal (%) Residuals Leachate Leachate Leachate BOD COD TKN TSS
Fenton Process 2 2 3 n/a 45‐75
0 n/a Iron sludge
Hydrogen Peroxide
2 2 2 n/a 16 ‐60
n/a n/a
Iron‐Mediated Aeration
3 3 3 37‐99
28‐99
<10* n/a Iron sludge
Ozone 2 2 3 n/a 25‐80
0 n/a Residual ozone
Ozone and Hydrogen Peroxide
2 2 3 n/a 28‐97
n/a n/a Residual ozone
Photocatalytic Oxidation
3 3 3 n/a 78‐100
n/a n/a
Photochemical Iron Mediated Aeration
3 3 3 48‐99
40‐99
<13* n/a Iron sludge
Photo‐Fenton Processes
2 2 3 n/a 70‐78
n/a n/a Iron sludge
Ultraviolet Process
1 1 1 n/a <75 <5 n/a Spent Hg lamps
UV and Hydrogen Peroxide
2 2 3 n/a 22‐99
n/a n/a Spent Hg lamps

65
Process Young Medium Mature Removal (%) Residuals Leachate Leachate Leachate BOD COD TKN TSS
UV and Ozone 2 2 2 n/a 47‐63
n/a n/a Residual ozone and spent Hg lamps
UV and Ozone and Hydrogen Peroxide
2 2 3 n/a 54‐89
n/a n/a Residual ozone and spent Hg lamps
*Ammonia data only 1.6 PROBLEM STATEMENT Current and proposed leachate management options have been discussed in the previous sections. From biological to physical-chemical processes to advanced oxidation and energized processes, it seems that each technology has its limitations due to the complexity of the leachate composition and the variability in volumes generated. Regardless of the disposal option, the nature of the leachate waste stream is such that some form of biological treatment is required. However, biological treatment is not suitable for removal of bio-toxics from water. Thus polishing steps, such as activated carbon adsorption, membrane processing, air stripping, or chemical addition may be necessary. Multiple barrier approaches are complicated to operate, costly, and generally inefficient. Unfortunately, activated carbon and certain advanced treatment processes (i.e. O3) do not adequately address inorganics, while membrane systems or air stripping merely transfer organics to another phase. Catalytic and photochemical processes may be needed to address these concerns. The “one size fits all” approach of the past must be abandoned. Different leachates require different treatment strategies. The combination of treatment options should be optimized to meet the needs to the solid waste community and regulators. As a result, it was determined that what is needed is a decision support tool (DST) that will allow both regulators and solid waste professionals to keep up to date with the latest practices and operational experiences, at their finger tips, with a web-based decision support tool. 1.7 OBJECTIVES The objective of the proposed research is to identify viable options for leachate management and rank them according to sustainability, performance, risk, and cost criteria, if available. The assessment will not be limited to current practice. Futuristic technologies, which are not yet fully developed, such photocatalytic oxidation using iron-mediated aeration or TiO2-coated magnetite (under development at FAU), must also be evaluated to forecast which alternatives will be employed by the solid waste community in the years to come. Knowledge gained from these studies will be included in the BMP database for the decision support tool. From the assembled matrix of engineering alternatives that are innovative, practical, and environmentally-sound, we will develop an

66
interactive, web-based decision support tool to aid solid waste managers in long-term decision-making because the solid waste industry must become better informed about the new technologies and strategies that are becoming available to address their long-term needs. Therefore, the proposed DST will provide a methodology to evaluate the most effective leachate management options based on user-specific information. This report tackles the major technological need for addressing the communication gap in bringing sustainable, economical options for routine leachate management into the hands of the end users in the solid waste management industry.

67
2. METHODOLOGY 2.1 INFORMATION COMPILATION FAU conducted an extensive literature review of government publications, empirical studies, textbooks, industry reports, journal articles, current legislation, and government/association web sites, information gathered from site visits/interviews, and the technical literature. For this task, input from the Technical Advisory Group (TAG) was solicited to make sure that the latest information on the industry-wide state-of-the-art was included. The ongoing literature review focuses on viable leachate treatment methods, including the photochemically-assisted iron-mediated aeration process and the TiO2-magnetite photocatalysis process. The review began with FAU graduate students, Courtney Skinner, Adriana Toro, François Gasnier, and Tammy Martin in 2005. A visiting researcher from the Indian Institute of Technology in Bombay, Mr. Swapnil Jain, continued the work by conducting an exhaustive search of the photocatalytic literature [1990 and beyond] with the aid of the FAU S.E. Wimberley Library Information Services Department. Mr. Swapnil Jain prepared an annotated bibliography, which was refined by two other visiting scholars, one from Japan, Ms. Hatsuko Hamaguchi, and the other from Stanford University, Mr. Joseph Vasquez. From 2009, Mr. Richard Reichenbach, Mr. Anthony Ruffini, and Mr. André MacBarnette updated the existing annotated bibliography focusing on technological innovations of the past three calendar years including Dr. Hala Sfeir’s work on a statewide survey of leachate management options that was presented at the SWANA Conference in July 2007. The main focus of this targeted literature review was to identify precedents using photocatalytic oxidation and other advanced technologies for wastewater treatment applications. Specific questions to be addressed were: 1) advanced oxidation process efficacy and process removal efficiency for various pollutants, 2) appropriate UV intensity range, 3) appropriate reactor conditions (i.e. pH, temperature, etc.), 4) appropriate range of catalyst dose (in grams or m2), 5) appropriate hydraulic retention times or reaction/exposure times, 6) catalyst reconditioning requirements, 7) reasons for catalyst poisoning, and 8) appropriate mixing regime. In addition, any factors that could impact the efficiency of the process such as pollutant interactions, surfactants, impurities, pH/temperature effects, etc. were identified in preparation for photocatalytic oxidation pilot scale testing at FAU. Another focus of the literature review was to update the existing list of available and experimental long-term leachate management alternatives. The important information targeted during this review was any data that could assist in adequately ranking each management strategy according to selection criteria based on environmental sustainability, efficiency, treatment performance, risk, feasibility, and economic factors. The goal was to collect as much information regarding: 1) efficiency of treatment and pollutant removal performance, along with optimum process conditions; 2) residuals,

68
such as solids or liquids byproducts generated during treatment; 3) footprint, or space requirements for a unit process design for a capacity of up to 1.0 MGD; 4) preliminary cost estimates; and 5) any other parameters, included in this category are environmental impacts, odor generation, dependency on climate conditions, etc. This work also attempted to identify potential issues such as legal, policy, or social barriers to implementation. 2.2 IDENTIFY HOST INSTITUTION NEEDS The web-based decision support tool requires a host and a manager when it is ready to be launched. This institution was identified with input from the stakeholder group, which consisted of a technical advisory group from regulatory agencies, water managers, consulting engineers, private industry, as well as other individuals and organizations (see Appendix C). Dr. Teegavarapu initiated discussions with the Director of the Technical Services Group of the College of Engineering and Computer Science at FAU, Mr. Mahesh Neelakanta. These discussions outlined the possibility of hosting the tool through the FAU College of Engineering and Computer Science server and to identify any issues, obstacles, or contingency plans with regards to the host institution. Several software and operating platforms were evaluated for the development of the decision support system. The software include: EXSYS, CORVID, CLIPS and others. Other stand-alone systems were also evaluated. The availability of a host web-based server to install and launch the decision support tool was investigated in context with key operational aspects such as: reliability, support services, server requirements, security issues, database updates, client information storage, and ownership rights. The system selected for the web-based portal is “expertise-2-go”. A temporary web site hosted at FAU was set up to test the rules: http://www.civil.fau.edu/~ramesh/DST/leach.htm The temporary web site uses “e2gLite Expert System Shell” with Java interface. The rule bases required for the shell were developed in conjunction with the BMP guide and TAG input. A simple interface for the web-portal was successfully tested and refined. 2.3 DEVELOPMENT OF DATABASE OF ALTERNATIVES The intent was to provide a central source of reliable information, reported performance criteria, and technical expertise that can be accessed electronically. First, a set of practical objectives for long-term leachate management were developed with input from the stakeholder group (described above). Next, descriptions of processes, performance data, summary tables, preliminary cost estimates, risk characterizations, feasibility options, and alternative selection criteria matrices for the BMP guide were presented for peer-review.

69
This was conducted primarily by the TAG but also with input from the Florida Chapter of the Solid Waste Association of North America (SWANA) Landfill Committee members and individual consultants and solid waste managers that were contacted directly. TAG meetings were filmed and uploaded to the project website (http://labees.civil.fau.edu) so that input could be solicited from those who could not attend the meetings. The comments and input formed the basis of the database component of the decision support tool.
2.4.1 Ranking of treatment options
The compilation of information and review of the technical literature considered different engineering alternatives for leachate treatment. These were reviewed in Chapter 1 of this report. Regarding conventional options, some are capable of producing a high quality liquid effluent (such as membrane filtration), but the pollutants are merely transferred to another media, which in turn must be managed. Other traditional options are not efficient enough or have too many binding requirements (such as weather issues or surface area constraints, for example) to be used effectively for leachate applications. Discharge to a municipal sewer is an attractive option, but traditional wastewater treatment plants have long-term challenges particularly with nutrients and emerging contaminants of concern that conflict with solutions for sustainable management of leachate without some form of pretreatment. On the other hand, advanced oxidation processes have shown promising results with complex or concentrated waste streams because they oxidize and/or completely mineralize a broad spectrum of pollutants. Furthermore, the addition of UV has been demonstrated to enhance the reaction of simple advanced oxidation processes. Therefore, AOPs and other energized processes like photocatalytic oxidation and the IMA and PIMA processes should be considered precisely because there is presently a lack of solutions that, over the lifetime of a landfill, are proven to be efficient enough to lower initial pollutant concentrations to the required levels for safe discharge to a municipal sewer system. As a consequence, it is urgent to find an environmentally-friendly and viable solution for leachate management on a long term basis. For the purpose of comparison, a preliminary ranking of engineering alternatives is based on the following five criteria:
1. Efficiency of Treatment. This criterion focuses on pollutant removal performance for the major contaminants of interest in leachate.
2. Preliminary Costs. This criterion focuses on the capital and operation and maintenance costs for the proposed treatment process. However, with only pilot-scale and no full-scale demonstration testing results, the determination of capital and operating costs for each of the selected landfill leachate treatment alternatives is preliminary at this stage.
3. Residuals. This criterion focuses on solid or liquid by-products generated during treatment or as a consequence of treatment.

70
4. Footprint. This criterion focuses on the physical size requirements of the proposed treatment process.
5. Others Parameters. This catch-all criterion includes environmental impacts, odor generation, dependency on climate conditions, maturity of the technology, etc.
Each treatment process analyzed was assigned a score from 0 to 5 for each of these five criteria. To sort them by importance, a weight was also assigned to each criterion as follows:
Efficiency of Treatment, weight coefficient of 5. Preliminary Costs, weight coefficient of 3. Residuals, weight coefficient of 2. Footprint, weight coefficient of 1. Others Parameters, weight coefficient of 4.
If an engineering alternative scores 5 on each criterion, then the highest total weighted score possible is 75. Since costs developed in this report are only preliminary, the ranking presented here is only based on four criteria: efficiency, residuals, footprint, and other parameters, for a total maximum weighted score of 60. The best way to illustrate this ranking system approach is to show an example. In this case, we will select municipal sewer discharge without pretreatment as an example. Details of how the scores were determined are based on the information collected during the literature review. This example is summarized in Table 22. Table 22. Example of alternative analysis selection matrix for municipal sewer discharge without pre-treatment. Criterion Weight Unweighted
Score Weighted Score
Reasons
Efficiency 5 2 10 Efficient for BOD but not for COD, Ammonia, or toxic metals
Preliminary Costs
3 Not available ‐‐ ‐‐
Residuals
2 4 8 Tends to increase sludge production and odors at the wastewater treatment facility; metals content of sludge may limit final disposal options
Footprint 1 5 5 No on‐site treatment means zero footprint
Other Parameters
4 3 12 Odor generation, impacts on wastewater treatment facility
Total 14 (out of 20) 35 (out of 60)

71
2.4.2 Information collection tool
A list of survey questions useful for the development of the user interface module was assembled with TAG and industry input. The responses to these survey questions are mapped into the working database for representative Florida landfills that was developed for this study. This database was constructed with the support of the TAG members and in particular the efforts of Joe Lurix, FDEP Southeast District Solid Waste Management Program Director, and with the assistance of William “Lee” Martin and Clark B. Moore at FDEP in Tallahassee. Initially, a list of solid waste facilities in Florida (n = 52) was randomly selected as a representative dataset for this process, as shown in Table 23. Table 23. List of 52 representative landfill facilities in Florida, randomly chosen for the user profile survey. District County Facility Number Facility Name
Central Brevard 00016256 Central Landfill
Central Indian River 00019134 Indian River County
Central Lake 00019823 Lake Co. Solid Waste Mgt.
Central Marion 00020906 Baseline Landfill
Central Orange 00021847 Orange County Lf
Central Osceola 00089544 Oak Hammock Disposal
Central Seminole 00026122 Osceola Rd
Central Volusia 00027540 Tomoka Farms Road Landfill
Northeast Columbia 00031495 Winfield Sw Facility Lf1
Northeast Duval 00033628 Trail Ridge Landfill Lf1
Northeast Levy 00036895 Bronson Landfill Levy Co Lf1
Northeast Madison 00037059 Aucilla Area Sw Facility Lf1
Northeast Nassau 00037140 West Nassau Landfill Lf1
Northeast Putnam 00037570 Putnam Co Central Landfill Lf1
Northeast Union 00039815 New River Regional Landfill Lf1
Northwest Bay 00000016 Steelfield Road Landfill
Northwest Escambia 00001688 Perdido Landfill
Northwest Jackson 00006319 Springhill Regional Landfill
Northwest Leon 00006660 US 27 South Landfill
Northwest Santa Rosa 00012300 Santa Rosa Central Lf
Northwest Wakulla 00014494 Lower Bridge Landfill
South Charlotte 00071714 Charlotte County (Zemel Rd )
South Collier 00073046 Naples Cell #6 (Collier County)
South Collier 00073114 Immokalee Lf (#2 ‐ Stockade)
South Glades 00074648 Glades Co. San. Landfill #2
South Hendry 00074766 Lee/Hendry Co Regional SW
South Hendry 00074773 Hendry County
South Highlands 00074956 Highlands County SW
South Lee 00076728 Gulf Coast
Southeast Broward 00053209 Broward Co. South Resource Recovery
Southeast Broward 00053328 Broward Co. Interim Contingency

72
District County Facility Number Facility Name
Southeast Broward 00055093 Central Sanitary Landfill
Southeast Martin 00068803 Martin County (Palm City)
Southeast Miami‐Dade 00056824 South Dade Shredded Waste
Southeast Miami‐Dade 00060080 Medley Landfill
Southeast Okeechobee 00070436 Okeechobee Landfill (Berman Road)
Southeast Palm Beach 00065551 PBCSWA Resource Recovery Site #7
Southeast St. Lucie 00070652 St Lucie County
Southwest Citrus 00039859 Citrus Central
Southwest Desoto 00040512 Section 16 Expansion
Southwest Hardee 00040612 Hardee County Regional Landfill
Southwest Hernando 00040722 Hernando County Northwest
Southwest Hillsborough 00041193 Southeast County (Picnic Landfill)
Southwest Hillsborough 00043384 Kingsway Rd
Southwest Manatee 00044795 Lena Rd County
Southwest Pasco 00045797 East Pasco (Dade City)
Southwest Pasco 00045799 Pasco County Resource Recovery
Southwest Pinellas 00046742 Bridgeway Acres
Southwest Polk 00049722 North Polk Central (Site 201)
Southwest Polk 00049723 Southeast Polk (Site 203)
Southwest Sarasota 00051614 Sarasota Central Landfill Complex
The location of each of these facilities is plotted in Figure 6.
Figure 6. Location of each of the 52 landfills investigated in the survey (locations are shown as dots on the map).

73
The user provided information database was populated with information regarding the following items:
1. Facility name 2. Location 3. Contact information 4. Facility class 5. Capacity in tons/day of municipal solid waste processed and permitted acreage 6. Service area characteristics 7. Years of operation 8. Liner systems 9. Leachate management history 10. Volumes of leachate generated 11. Leachate water quality 12. Assessment of performance of leachate management systems 13. Identification of issues
Some of the information related to our list of representative landfill sites was developed using information gathered from various sources, including geospatial shape files using the ArcGIS platform, public record reviews, and interviews with solid waste management personnel and consultants. The geospatial information was gathered from the Florida Geographical Data Library (FGDL) online source. Dr. Meeroff met with William “Lee” Martin and Clark B. Moore at FDEP in Tallahassee to discuss new available sources of data needed for developing the user interface. Mr. Martin gave Dr. Meeroff a tutorial on using OCULUS and downloading data from electronic solid waste reports. Using these methods, OCULUS and solid waste facility reports were consulted to collect as much of the specific information needed to make the representative categories for decision mapping. The rest of the information was gathered through online surveys and telephone interviews, as needed. The online survey instrument was approved by the FAU Institutional Review Board for the Institutional Animal Care and Use Committee (IACUC), which governs the collection of data from human subjects, on February 18, 2009 (#h09-38xm). The instrument was distributed to the TAG members for comment, and its content was discussed at the TAG meeting on April 14, 2009, at the HCSHWM research review committee meeting on May 15, 2009, at the Geosyntec Annual Meeting on June 3, 2009, and Florida Section SWANA meeting of the landfill committee on July 21, 2009. The survey instrument is an interactive pdf form as shown in Figure 7 and is located on the project web site at: http://labees.civil.fau.edu/DST-tool.pdf The comments and data were collected and posted on the project web site for TAG members and interested stakeholders to supply information and feedback. The forms

74
were active on the website beginning on March 8, 2009.
Figure 7. Screenshot of the decision support tool survey for landfill managers. Initial comments were collected, and an online TAG meeting (April 17, 2009) was conducted to broadcast the results and disseminate the information as a web-based video file hosted on the project website (http://labees.civil.fau.edu/MeeroffSP.wmv). The FAU long distance learning department agreed to produce the video and convert it for use on the web for this project. The next step was to take the user provided information and develop groups or bins of categories that could be used to classify user site specific information and help the tool to evaluate tailored management practices. This was accomplished using the data from the information collection tool. First, data was exported from the master dataset according to the category of interest and was sorted by descending value. Bin size was initially

75
calculated by ranking the data entries into 4 bins (i.e. lowest 10%, next lowest 40%, next highest 40%, and highest 10%), or alternatively, by calculating one standard deviation from the mean, and plotting 3 bins (i.e. low, medium, high). Preliminary bins were plotted to check for normal distribution, and these initial bins were then later adjusted for practical fit, as determined by best fit judgment with TAG input. These refined bins were then used to help map leachate best management practices to categories provided under the user profile. After much discussion at TAG meetings, the 4 bin approach was agreed upon for most categories. 2.4 DESIGN OF THE DECISION TREE The adaptive user profile provides a mechanism to develop goal-based objectives, which will dictate the selection of BMPs from the database (developed as described above) to achieve those goals. Thus the decision tree is dynamic and incorporates a closed-loop adaptive feedback mechanism. It also allows for adjustment of site-specific costs, regulatory, and environmental risk issues (as well as professional judgment), as necessary. The development of decision trees (ex. Figure 8) in their simplest forms is based on available knowledge from case studies, literature review, laboratory performance testing, and also from TAG member feedback and stakeholder input. A set of questions were prepared to help relate site-specific information to several appropriate alternatives. The decision trees are developed in such a way that they can be used for knowledge base development for the decision support system. A matrix of alternatives along with a preliminary ranking scheme was developed and refined.
Constituents & Features:Ozone and Hydrogen Peroxide (AOP)- 1A, 2A, 5AA, 10A, 11A, 13A, 15AAir Stripping- 3A, 5AA, 9A, 14AAerobic and Anaerobic Process- 1A, 5CC, 14AOzone (AOP)-1A, 2A, 5AA, 10A, 11A, 13A, 15AUV and Ozone-1A, 2A, 5AA, 10A, 11A, 13A, 14A, 15AUV, Ozone, and Hydrogen Peroxide (EP)-1A, 2A, 5AA, 10A, 11A, 13A, 14A, 15ACarbon Adsoption-1A, 2A, 3A, 4A, 5AA, 14AUV and Hydrogen Peroxide-2A, 5AA, 10A, 11A, 14AFenton Process (AOP)-2A, 5BB, 6A, 11A, 14A, 15ASedimentation, Precipitation, Flocculation, & Coagulation- 2A, 4A, 5CC, 8A, 10A, 14AIon Exchange-3A, 4A, 5AA, 7A, 14AHydrogen Peroxide-2A, 5BB, 10A, 14APhotochemical Iron-Mediated Aeration-1A, 2A, 3A, 4A, 5AA, 10A, 11A, 12A, 15AMembrane Filtration-1A, 2A, 5CC, 8A, 10A, 15APhoto catalytic oxidation (EP)-1A, 2A, 3A, 5AA, 10A, 11A
Response type:A-YESB-NO
Foot Print:AA-SMALL
BB-MEDIUMCC-LARGE
Figure 8. Constituents and responses linked in a simple decision tree.
2.4.1 Decision tree development process
The decision tree is developed by evaluating available knowledge about leachate management. The first phase was the development of attributes and their values for usage in the decision support system rule base. First, a key was developed. The key focuses on the response options available to the user in the user profile information collection tool. An example of the key is provided in Figure 9. The constituents and processes are defined in Figure 10 and they are numbered for convenience. The response options and

76
footprint alternatives are attached to processes and constituents so that the rule-base can be developed.
KEYResponse type:
A‐YESB‐NO
FOR FOOT PRINT:AA‐SMALLBB‐MEDIUMCC‐LARGE
Figure 9. Main key for one of the decision trees developed in the current study.
CONSTITUENTS
BOD‐1A, 1BCOD‐2A, 2BAMMONIA‐3A, 3BINORGANICS‐4A, 4BFOOTPRINT‐5AA, 5BB, 5CCODOR CONTROL‐6A, 6BTDS‐ 7A, 7BTSS‐8A, 8BVOC‐9A, 9BDISINFECTANT‐10A, 10BIMPROVE BIODEGRADABILITY‐11A, 11BREMOVAL OF METAL‐12A, 12BINCREASE DO‐13A, 13BPRETREATMENT INVOLVED‐14A, 14BPOST‐TREATMENT INVOLVED‐15A, 15B
PROCESSESOzone and Hydrogen Peroxide (AOP)‐ 1A, 2A, 5AA, 10A, 11A, 13A, 15AAir Stripping‐ 3A, 5AA, 9A, 14AAerobic and Anaerobic Process‐ 1A, 5CC, 14AOzone (AOP)‐1A, 2A, 5AA, 10A, 11A, 13A, 15AUV and Ozone‐1A, 2A, 5AA, 10A, 11A, 13A, 14A, 15AUV, Ozone, and Hydrogen Peroxide (EP)‐1A, 2A, 5AA, 10A, 11A, 13A, 14A, 15ACarbon Adsoption‐1A, 2A, 3A, 4A, 5AA, 14AUV and Hydrogen Peroxide‐2A, 5AA, 10A, 11A, 14AFenton Process (AOP)‐2A, 5BB, 6A, 11A, 14A, 15ASedimentation, Precipitation, Flocculation, & Coagulation‐2A, 4A, 5CC, 8A, 10A, 14AIon Exchange‐3A, 4A, 5AA, 7A, 14AHydrogen Peroxide‐2A, 5BB, 10A, 14APhotochemical Iron‐Mediated Aeration‐1A, 2A, 3A, 4A, 5AA, 10A, 11A, 12A, 15AMembrane Filtration‐1A, 2A, 5CC, 8A, 10A, 15APhoto‐catalytic oxidation (EP)‐1A, 2A, 3A, 5AA, 10A, 11A
Figure 10. Constituents and processes defined for one of the decision trees developed in the current study. Management options are decided based on the decision trees developed for constituents and processes and also considering the responses from the user profile. The final link between the user inputs and the BMP Guide is established and defined through the management options branch of the decision tree. A selection of management options available for the above discussed constituents is shown in Figure 11.
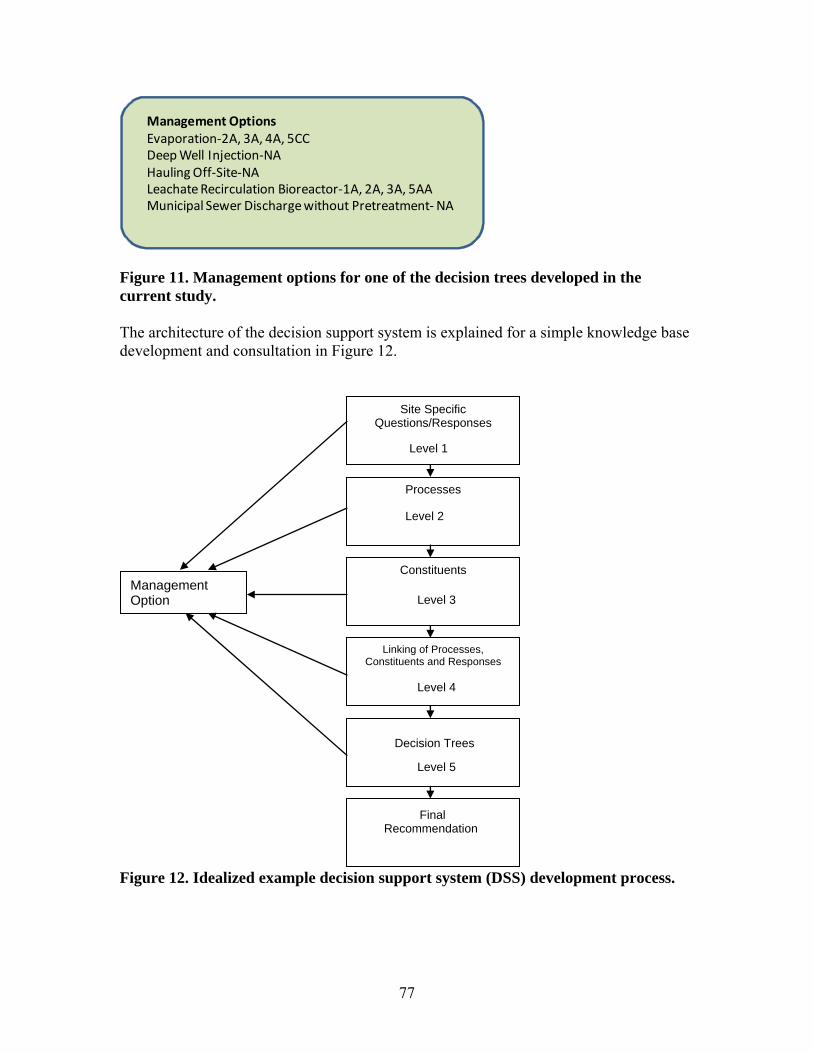
77
Management OptionsEvaporation‐2A, 3A, 4A, 5CCDeep Well Injection‐NAHauling Off‐Site‐NALeachate Recirculation Bioreactor‐1A, 2A, 3A, 5AAMunicipal Sewer Discharge without Pretreatment‐NA
Figure 11. Management options for one of the decision trees developed in the current study. The architecture of the decision support system is explained for a simple knowledge base development and consultation in Figure 12. Site Specific
Questions/Responses
Processes
Constituents
Linking of Processes, Constituents and Responses
Decision Trees
Management Option
Final Recommendation
Level 1
Level 2
Level 3
Level 4
Level 5
Figure 12. Idealized example decision support system (DSS) development process.

78
2.4.2 Prototype web-based decision support system
The prototype decision support system developed for the current study is hosted at: http://www.civil.fau.edu/~ramesh/dss/dss.html. Figure 13 shows a screen shot of the opening user interface. The developed decisions support system (DSS) can be easily ported to any web-server by obtaining the applets from expertise2Go.com. Once the applets are installed, the rule-base can be transferred to the web-server to serve as a knowledge-base for the DSS.
Figure 13. Screen shot of a typical web-based expert system/decision support system The decision support/expert system was developed using a web-enabled expert system platform using the Java applets and already developed empty shell available from eXpertise2Go.com. The shell is referred to as “e2gRuleEngine Expert System Shell”. The decision to use a freeware program was made to help reduce the cost of overall development of the expert system. The expert system helps create rules that are developed following the “IF-THEN-ELSE” generic logical structure. For example:

79
Leachate knowledge base (example rule) RULE [Best Management Option?] If [] = "" or [] = "" Then [the recommended action] = "Option # 1" A set of examples of specific rules related to leachate management used in the decision support system in this study is given below: RULE [Is Ion Exchange applicable?] If [the result of BOD5] = "BOD5 is low" and [the result of ammonia] = "ammonia is high" and [the result of metals] = "metals is high" and [the result of TDS] = "TDS is high" Then [option] = "Ion Exchange is applicable" RULE [Is Flocculation, Precipitation, or Sedimentation applicable?] If [the result of COD] = "COD is high" and [the result of ammonia] = "ammonia is low" and [the result of metals] = "metals is high" and [the result of TDS] = "TDS is high" and [the result of TSS] = "TSS is high" and [the result of footprint] = "Large" Then [option] = "Flocculation, Precipitation, Sedimentation is applicable" A sample rule-base defined using specific management options is provided in Appendix A. The development of a rule-base depends on all the available management options obtained from the decision tree. The development of rule-base considering all management options with the help of decision trees is an ongoing process, because the tool is adaptive to user responses and can adjust the scoring criteria to reflect user input and new developments in technologies and performance tracking. Once the rule-base is completed with all the checks and appropriate goals, then it becomes a knowledge-base, which can be structured in such as way that independent knowledge-bases can be developed. An existing rule-base can be easily altered based on new knowledge and responses from TAG, regulators, vendors, and solid waste managers and operators, as well as any other interested stakeholders. A number of goals are identified in the knowledge-base and in the order in which facts are sought through consultation with the user. The decision support system employs a backward-chaining search for finding the appropriate rules and seeking the appropriate goals. The backward chaining procedure is a goal-oriented strategy and is the foundation for most rule-based expert or knowledge-based systems. Backward chaining systems are described as hypothesis driven because they operate by selecting successive rules that can determine the value of a goal or sub-goals. This is achieved in the system by using the following procedure in the knowledge-base.

80
The “goal” in this section refers to the final goal that needs to be achieved by the DSS in the current context for the sample knowledge-base provided; the goal is to find the best management option. This is summarized by the statement below: GOAL [option], MINCF 60 The decision support system developed in this study can handle multiple goals and uncertainties associated with the inputs provided by the user. The statement above in the knowledge-base instructs the inference engine to search for the specified goals in parenthesis in the order specified. The knowledge-base system implementation in the current study is designed to handle the uncertainty associated with user input. The system allows the users to represent their degree of confidence in a response using a numerical scale. Some of the examples of representations of degree of confidence are probability scales (0 means no confidence, 1.0 means certainty) or percentages (0% means no confidence, 100% means certainty). These forms of certainty measurements are usually called certainty factors or confidence factors and denoted by the parameter designation “CF.” The minimum confidence factor can be adjusted by the developer of the decision support system. In the rule-base developed for the DSS, the minimum confidence factor (MINCF) used is 60. 2.5 DEVELOP USER INTERFACE Design and development services were provided by the FAU College of Engineering and Computer Science Technical Services Group. The DST was envisioned to be an on-line web-based application with an easily accessible graphical user interface (GUI). To facilitate end user and host management, separate component modules were developed. These include: user login (with necessary security functions), user profile (with site specific queries and adaptable performance measures tracking), BMP module (with interactive and goal-based functionality), and reporting module (customizable). Details of the architecture of the decision support tool are provided in Figure 3. The list of data results from innovative treatment technologies conducted at laboratory scale were compiled and analyzed to be able to include experimental technologies in the BMP guide. This data was used to fill in the gaps required for performance testing of experimental technologies for ranking purposes to create the decision trees at the heart of the management tool. 2.6 TOOL TESTING Peer review and beta testing will be initiated once the tool is made available to the technical advisory committee members and other user/stakeholder groups. Initial review and beta-testing of the decision support system, decision trees and knowledge-base runs was completed in-house. The rule-bases supplemented with decision trees will be

81
evaluated on a regular basis and a living knowledge-base will be created for future updates. A user guide will be developed to enable efficient use of the DSS. The DSS and user guide will go through modifications based on TAG input and suggestions. The DSS will be tested with new input data sets designed to elicit various levels of management options provided by the DSS. The options suggested by the DSS were evaluated by the TAG, and the DSS options reviewed and adjusted.
82
3. RESULTS 3.1 CURRENT LEACHATE STRATEGIES Each of the representative landfill sites selected for this study (n = 52) was queried as to existing leachate management approaches. This information was collected between October 2009 – April 2010 and is summarized in Table 24. The most popular option was municipal sewer discharge without pre-treatment (n = 18), but only 63% of respondents in this category identified the wastewater treatment facility that accepted their leachate. The next most popular option involved leachate recirculation with municipal sewer discharge either with pre-treatment (n = 8) or without pre-treatment (n = 2). Five of the facilities responded that they used some form of on-site pre-treatment prior to sewer discharge. The treatment processes varied widely from aeration to adsorption to sequencing batch reactors. However only two identified the wastewater treatment facility accepting the discharge (ocean outfall disposal Miami-Dade County), while the other three did not. Five facilities responded that they haul their leachate off-site to a wastewater treatment facility, four of which were located less than 25 miles away, with the last one hauling 130 miles away.

83
Table 24. Distribution of existing landfill leachate management strategies for the 52 representative landfills surveyed. On‐Site Management Options
Number Remarks
Municipal Sewer Discharge without Pre‐Treatment
16 Brevard Central Landfill Viera South Central Mainland WTF (5.5 MGD) [activated sludge carrousel, filtration, disinfection, spray irrigation of sod farm]
Broward County Interim Contingency (BIC) Pembroke Pines WWTP (9.5 MGD) [activated sludge, deep well discharge]
Broward County South Resource Recovery City of Hollywood WWTP (48.75 MGD) [pure oxygen activated sludge, ocean outfall discharge]
Central Sanitary Landfill & Recycling Center North District Broward County WWTP (84 MGD) [complete mix activated sludge, ocean outfall or deep well or reuse disposal]
Indian River County West Regional WWTP (2.0 MGD) [contact stabilization, filter, reuse to perc ponds and citrus/sod farms]
Martin County (tried modified Zimpro with R/O but not effective) Martin County WWTP Jensen Beach (1.2 MGD) [oxidation ditch, filtration, disinfection, reuse and deep well disposal]
Orange County Orange County Utility District South WRF (43 MGD) [advanced treatment with rapid infiltration basins and citrus‐public access reuse]
Perdido (previous on‐site aeration was unsuccessful) ECUA Water Reclamation Facility at Bayou Marcus (8.2 MGD) [advanced treatment with nitrification, denitrification, filtration and discharge to Bayou Marcus wetlands]
Steelfield Road Panama City Beach WWTP (7 MGD) [extended aeration, filtration, reaeration, chlorination, dechlorination, discharge to West Bay]
US 27 South T.P. Smith Water Reclamation Facility (27.5 MGD) [activated sludge and trickling filter and rotating biological contactors, activated sludge with nitrification‐denitrification, reuse on spray fields]
Bridgeway Acres (Slurry wall pond combined
groundwater and surface water) POTW East Pasco Landfill (Dade City) POTW Hardee County Regional POTW Hernando County Northwest POTW Sarasota Central Landfill Complex POTW Section 16 Lf Expansion POTW

84
On‐Site Management Options
Number Remarks
Leachate Recirculation / Municipal Sewer Discharge
8 Aucilla Area Greenville WWTF (0.12 MGD) [conventional activated sludge discharge to spray field]
Baseline Landfill Marion County Utilities Silver Springs Shores Plant (0.998 MGD) [2 lined storage basins, spray field, slow rate infiltration, public access rapid rate infiltration basin, perc ponds]
Immokalee Lf (#2 ‐ Stockade) Immokalee WWTP (2.5 MGD) [privately owned wastewater treatment plant]
Naples Slf Cell #6 Collier County South Regional WRF (8 MGD)
New River Regional Florida State Prison package plant Putnam County Central Trail Ridge Landfill West Nassau
Leachate Recirculation 3 Lena Rd County Landfill (equalizer tanks) North Polk Central Southeast Polk
Leachate Recirculation / On‐site Pre‐Treatment / Municipal Sewer Discharge
2 Gulf Coast (chlorine injection with recirc as needed) POTW
Tomoka Farms (evaporation ponds with misters) POTW (now installing on‐site treatment)
Leachate Recirculation / Wetlands / Municipal Sewer Discharge
1 Lee/Hendry County Regional POTW
Municipal Sewer Discharge with Pre‐Treatment
5 Highlands County (primary treatement with aeration basin with sand filters) POTW
Medley Landfill & Recycling Center (SBRs) Virginia Key WWTP (143 MGD) [pure oxygen activated sludge with ocean outfall disposal]
Oak Hammock Disposal (aerated leachate ponds) POTW
Pasco County Resource Recovery (Zimpro PACT system. 2 stage aerobic treatment) POTW
South Dade Shredded Waste (SBRs) Blackpoint WWTP (97 MGD) [pure oxygen activated sludge with ocean outfall disposal]
Municipal Sewer Discharge with Pre‐Treatment / Spray Irrigation
1 Southeast County (Picnic Landfill) (Modified Zimpro PACT and partial spray irrigation or to POTW)

85
On‐Site Management Options
Number Remarks
Hauling Off‐Site 5 Bronson GRU Main Street WRF (23.4 miles) (7.5 MGD) [Advanced secondary treatment, filtration, chlorine, reuse disposal]
Lake County Jax batch pre‐treatment, then to Buckman WWTF (130 miles) (52.5 MGD) [activated sludge with disposal to St. Johns River]
Lower Bridge Wakulla County WWTP (2146 Lawhon Mill Rd, Crawfordville) (11.9 miles) (0.6 MGD) [extended aeration, spray irrigation reuse]
Osceola Rd (Seminole County) Greenwood Lakes WWTP (22 miles) (3 MGD) [grit removal, oxidation ditch, filter, disinfection, reuse]
Santa Rosa pre‐treatment with equalizer tanks + aeration basin, now considering on‐site treatment Sundial WWTP (Dalisa Rd, Milton) (1.0 miles) (0.25 MGD) [package aero‐mod sequox biological nutrient removal unit]
On‐Site Treatment 3 Citrus County Central (Zimpro PACT, 2‐stage Aerobic Treatment)
Glades Co. San. Landfill #2 St Lucie County used to haul to Lakeland (148 miles)
[used to be 2 aeration ponds pre‐treatment Ft. Pierce WWTP] (now on site treatment with Aqua‐Kleen)
Leachate Recirculation / Hauling Off‐Site
2 Springhill Regional Landfill POTW Winfield Town of Baldwin WWTF (44 miles) (0.4 MGD) [extended aeration, filtration, UV, post‐aeration, discharge to surface water]
Natural Attenuation (Deep Well Injection)
2 Palm Beach County SWA Okeechobee (Evaporation system using LFG also some
leachate to POTW. Now constructing deep well injection system to reduce O&M costs)
Enhanced Natural Attenuation (Pre‐Treatment Deep Well Injection
1 Charlotte County Zemel Rd (Zimpro PACT) Deep well
Evaporation / Recirculation
0
Not Responding 3 Hendry County (closed, no leachate production) Kingsway Rd (David J. Joseph Landfill) Suwannee County

86
3.1.1 Bin development of user specific information Using the data from the information collection tool, bins were created for the major categories of information, as described in Section 2.4.2. The initial bins were plotted to check for normal distribution and were later adjusted for practical fit, as determined by best fit judgment. From the 52 landfills surveyed, we evaluated each facility for the following categories:
1. Facility class 2. Capacity in tons/day of municipal solid waste processed and permitted acreage 3. Service area characteristics 4. Years of operation 5. Leachate management history 6. Volumes of leachate generated 7. Leachate water quality
In terms of facility class represented by the sample set of Florida landfills, the distribution is shown in Table 25. Table 25. Distribution of landfill facility class in the 52 representative Florida landfills surveyed. Facility Class Number
Class I 48 Class I closed 4 Class II 1 Class III 18 Class III without liner 6 Class III closed 2 Ash monofill 9 Codisposal at the same facility 8 Not designated 0
In terms of capacity in tons/day of municipal solid waste processed in the sample set of Florida landfills, the distribution is shown in Table 26. These ranges are still preliminary due to the small number of respondents. Table 26. Distribution of landfill facility class in the 52 representative Florida landfills surveyed. Capacity Class Range (tons/day) Number
Small < 150 7 Medium 150 – 1000 17 Large 1000 – 3000 18 Super > 3000 5 No response ‐‐ 5
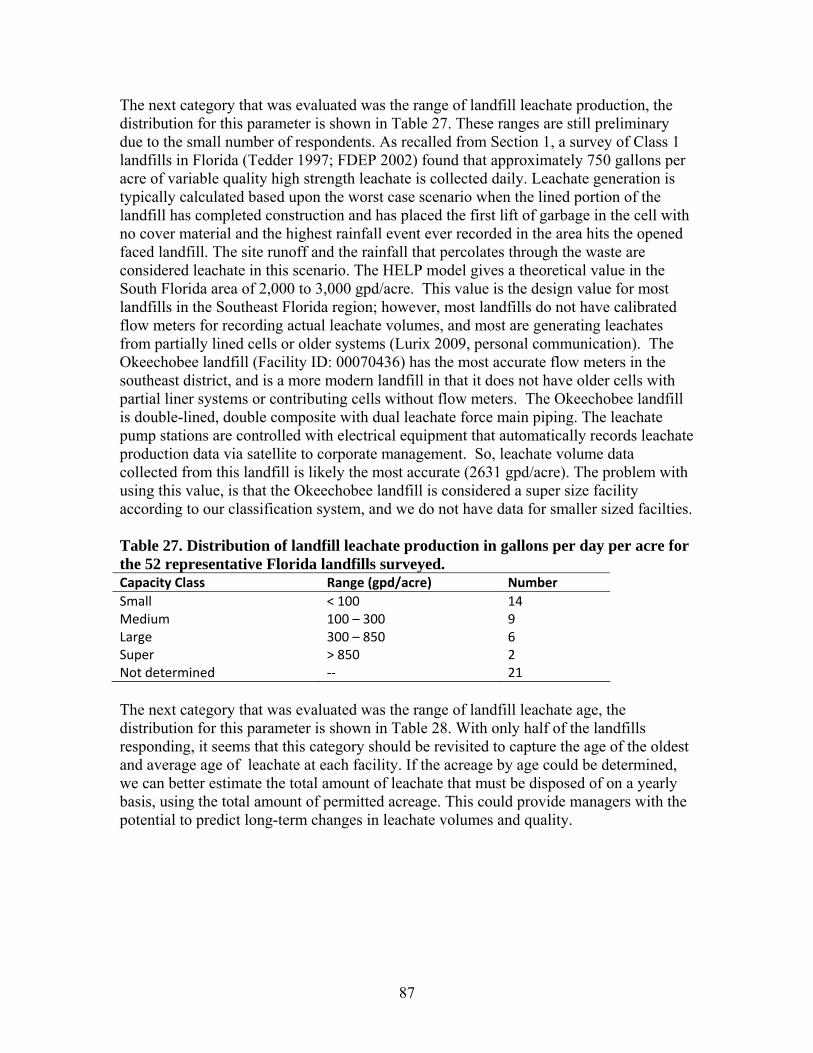
87
The next category that was evaluated was the range of landfill leachate production, the distribution for this parameter is shown in Table 27. These ranges are still preliminary due to the small number of respondents. As recalled from Section 1, a survey of Class 1 landfills in Florida (Tedder 1997; FDEP 2002) found that approximately 750 gallons per acre of variable quality high strength leachate is collected daily. Leachate generation is typically calculated based upon the worst case scenario when the lined portion of the landfill has completed construction and has placed the first lift of garbage in the cell with no cover material and the highest rainfall event ever recorded in the area hits the opened faced landfill. The site runoff and the rainfall that percolates through the waste are considered leachate in this scenario. The HELP model gives a theoretical value in the South Florida area of 2,000 to 3,000 gpd/acre. This value is the design value for most landfills in the Southeast Florida region; however, most landfills do not have calibrated flow meters for recording actual leachate volumes, and most are generating leachates from partially lined cells or older systems (Lurix 2009, personal communication). The Okeechobee landfill (Facility ID: 00070436) has the most accurate flow meters in the southeast district, and is a more modern landfill in that it does not have older cells with partial liner systems or contributing cells without flow meters. The Okeechobee landfill is double-lined, double composite with dual leachate force main piping. The leachate pump stations are controlled with electrical equipment that automatically records leachate production data via satellite to corporate management. So, leachate volume data collected from this landfill is likely the most accurate (2631 gpd/acre). The problem with using this value, is that the Okeechobee landfill is considered a super size facility according to our classification system, and we do not have data for smaller sized facilties. Table 27. Distribution of landfill leachate production in gallons per day per acre for the 52 representative Florida landfills surveyed. Capacity Class Range (gpd/acre) Number
Small < 100 14 Medium 100 – 300 9 Large 300 – 850 6 Super > 850 2 Not determined ‐‐ 21
The next category that was evaluated was the range of landfill leachate age, the distribution for this parameter is shown in Table 28. With only half of the landfills responding, it seems that this category should be revisited to capture the age of the oldest and average age of leachate at each facility. If the acreage by age could be determined, we can better estimate the total amount of leachate that must be disposed of on a yearly basis, using the total amount of permitted acreage. This could provide managers with the potential to predict long-term changes in leachate volumes and quality.

88
Table 28. Distribution of landfill leachate age in the 52 representative Florida landfills surveyed.
Capacity Class Age (years) Number
Young leachate < 5 0 Medium leachate 5 – 10 1 Mature leachate > 10 43 Mixed ‐‐ 2 Not determined ‐‐ 6
For each of the landfills in the survey, the year that the facility began operation and the landfill closure year was obtained. The two oldest facilities began accepting waste in 1955. There were two more from the decade of the 1960s and 16 from the decade of the 1970s. Fourteen of the facilities began operating after 1984 with two of those in the current decade of 2000-2010. With respect to closure, 6 of those surveyed were already closed, and the remaining 20 who responded varied in the anticipated closure date from 2011 to 2096. The average closure date of those responding was 2030, meaning that in the next 20 years, permitting activities for new landfill sites in Florida will be increasing. The amount of waste in place at each facility was also requested in the survey. The average was 6.2 million tons, varying from a low of 0.2 million tons to a high of 23.3 million tons. Cost data was more difficult to collect from the participating landfills, with only 6 of the landfills responding. Hauling costs varied from $40 – 300 per 1000 gallons) not including final disposal/discharge fees and water quality surcharges. One facility that discharged to a POTW was charged $3.17/1000 gallons for disposal. This value did not include the transportation costs; this was only the fees. For those facilities that discharged to municipal sewers for treatment at a POTW, the permitted capacity of the receiving facility varied from 0.12 MGD to 143 MGD. There were 8 POTWs that were considered small (<5 MGD), followed by 7 medium sized facilities (5-20 MGD), three large facilities (20-50 MGD), and three super sized facilities (> 50 MGD). The largest facilities are located in southeast Florida and the smallest facilites were located in the northwest district. A variety of treatment options and disposal methods are employed at these facilities. Please see the final database (Appendix B) for more details. In terms of water quality parameters, the research team conducted a records review to supplement the low number of responses to this inquiry through the questionnaire by searching OCULUS reports. The values reported and the bin distribution is shown in Table 29. The concentrations in the “High” range would generally not be allowable for sewer discharge, and the concentrations in the “Low” range would generally meet safe sewer discharge standards.

89
Table 29. Distribution of landfill leachate composition in the 52 representative Florida landfills surveyed. Water Quality Parameter
Number responding
Avg value (mg/L)
Low # Med # High #
BOD5 9 110 < 25 4 25 – 400 3 >400 2 COD 10 900 < 50 0 50 – 800 4 >800 6 NH4‐N 14 160 <25 1 25 – 100 3 > 100 10 TSS 7 114 < 25 3 25 – 400 2 > 400 1 TDS 17 4,250 < 1,000 0 1,000 – 2,000 3 > 2,000 14 pH 16 7.56 <6.5 0 6.5 – 7.5 9 >7.5 7 Alkalinity 5 2900 <50 0 50 – 300 0 >300 5 Pb 5 0.015 <0.015 3 0.015 – 0.100 2 >0.1 0 Fe 11 12.9 <0.3 1 0.3 – 3.0 2 >3.0 8
3.1.2 POTW discharge limits Discharges to sanitary sewers in Florida must comply with Chapter 62-625, F.A.C., which contains the pretreatment rules for discharging non-domestic wastewater (including leachate) to the sanitary sewer and can be viewed at the following URL: http://www.dep.state.fl.us/legal/Rules/wastewater/62-625.pdf Additionally, local municipalities (Cities and Counties) establish their own discharge regulations in their industrial pre-treatment ordinances in order to comply with the pretreatment rules and regulations specific to their wastewater treatment facilities. For each situation, the solid waste manager must contact the particular utility to verify if a pretreatment discharge permit is required prior to discharging leachate to any sewer collection system. The Florida pre-treatment rules also require Cities and Counties to develop their own local discharge limitations (local limits) that must be met prior to discharge, as long as they meet the minimum criteria set forth in 62-625. A number of municipalities and counties (n = 80) which filed sewer discharge limits with FDEP were provided to our research team by Dawn K. Templin, P.E., FDEP Pretreatment Program Coordinator. Each of the 80 sets of rules was analyzed (see Appendix B), and a summary of the limits for key leachate constituents was prepared, by district as shown in Table 30.

90
Table 30. Summary of sewer discharge limits by district for key constituents of concern in Florida landfill leachate. District Stat. BOD COD Iron Lead NH4‐N TN TKN TDS TSS Cond pH
NW n 4 2 5 1 2 4
Min 200 2.0 0.21 571 35 200
Max 83,000 4.5 1.50 571 193 155,000
Avg 22,299 3.2 0.72 571 114 39,863
s 40,510 1.8 0.48 112 76,770
NE n 3 1 1 9 1 1 3
Min 450 1,600 148 0.15 620 2,400 350
Max 6,699 1,600 148 1.90 620 2,400 3,341
Avg 2,850 1,600 148 0.93 620 2,400 1,397
s 3,367 0.69 1,685
Central n 12 7 1 23 1 7 1 4 17 7
Min 250 200 39 0.01 50 40 42 500 200 5.5‐9.0
Max 15,000 10,918 39 1.10 50 1,100 42 5,000 15,000 6.0‐10.5
Avg 3,956 3,505 39 0.45 50 303 42 1,863 3,422 5.5‐9.5
s 5,496 4,149 0.31 396 2,112 4,834
SW n 15 3 3 17 2 9 16 1 2
Min 250 1,086 50 0.04 40 35 250 1275 6.0‐11.0
Max 10,000 10,000 200 8.30 120 550 3,772 1275 6.0‐11.0
Avg 1,939 5,083 100 1.10 80 215 1,361 1275 6.0‐11.0
s 2,818 4,528 87 1.95 57 158 1,028
South n 1 1 2 1
Min 3,100 6,200 0.69 302
Max 3,100 6,200 1.72 302
Avg 3,100 6,200 1.20 302
s 0.73
SE n 10 2 3 13 2 1 10 6
Min 250 800 5 0.40 50 30 250 5.0‐9.0
Max 1,000 1,000 10 3.30 100 30 1,000 5.5‐11.0
Avg 560 900 8 1.33 75 30 522 5.5‐9.5
s 265 141 3 1.09 35 236
TOTAL n 45 14 10 70 3 11 14 5 50 1 15
Min 200 200 2 0.01 50 40 30 500 200 1,275 5.0‐9.0
Max 83,000 10,918 200 8.30 100 1,100 620 5,000 15,5000 1,275 6.0‐11.0
Avg 4,067 3,527 52 0.94 67 286 204 1,970 4,976 1,275 6.0‐10.0
s 12,537 3,682 68 1.25 29 333 188 1,844 21,868
It is clear that safe sewer discharge requirements vary widely across the State of Florida. The most number of limits deal with lead, BOD, and TSS. The BOD limit varies from 200 – 83,000 mg/L, and the TSS limit varies from 200 – 15,500 mg/L. With respect to the lead requirements, the limit varies from 0.012 – 8.30 mg/L. The other constituents are restricted with less frequency across the state. As stated earlier, in locations where the landfill is relatively near to a wastewater

91
treatment plant capable of assimilating the leachate without disrupting the biological treatment process, a common option for leachate management is to discharge directly to the municipal sewer system. As shown in Figure 14, it is generally the case that landfills are located in relatively close proximity with a wastewater treatment facility. The only issues would be if the infrastructure is in place to convey the leachate to the POTW and the ability of the biological process to handle the volume and water quality of the leachate in order to avoid disrupting the treatment process efficiency and the effluent water quality to be discharged.
Figure 14. Location of wastewater treatment facilities (little dots) and landfill sites in Florida (larger dots). 3.2 ALTERNATIVE SELECTION PROCESS According to our initial investigations, leachate management in the future must have the following characteristics:
1. Must be sustainable 2. Must be site-specific 3. Must be capable of adaptation to evolving regulations, climate change,
population growth, and leachate variability

92
In addition to these characteristics, it is not likely that the solid waste management industry will embrace becoming wastewater treatment plant operators over and above their duties. Thus, operating and maintaining a functional on-site wastewater treatment plant with multiple unit processes is an unlikely scenario. The most likely approach that will be able to achieve the above noted objectives is either pumping or hauling the leachate to a municipal wastewater treatment facility (or publicly owned treatment works-POTW) followed by safe discharge to the environment, or if the POTW is relatively far away, then some form of “black box” on-site pretreatment, to reduce the toxicity of the leachate, followed by discharge to the sanitary sewer network for eventual treatment and discharge by the POTW. For either option, the leachate may not meet the POTW’s sewer discharge limits (see Table 30 and Appendix B); therefore, some form of targeted pre-treatment may be required. Table 31 shows more details on the City of Boca Raton, FL sewer discharge limits, as an example. Table 31. Example of allowable public sewer discharge concentrations for the City of Boca Raton, FL (FAU EHS 2006). Parameter Units Maximum Allowable Value
over any 24‐hr Period
Lead mg/L 0.37 Total dissolved solids (TDS) mg/L 2000 Total suspended solids (TSS) mg/L 400 Chemical oxygen demand (COD) mg/L 800 Biochemical oxygen demand (BOD5) mg/L 400 pH mg/L 6.0 – 8.5 Iron mg/L 21 Ammonia mg/L as NH3‐N Not listed Conductivity µS/cm Not listed
After compiling all of the literature data from Section 1, the advantages and disadvantages of the engineering alternatives discussed in those previous sections are qualitatively summarized in Table 32.

93
Table 32. Summary of advantages and disadvantages of selected leachate management strategies. Technology Type Advantages Disadvantages
Municipal Sewer Discharge without Pre‐Treatment
Off‐site
No on‐site treatment required
No footprint required Efficient for BOD5
High COD and ammonia toxicity can disrupt WWTP if Q > 2‐10%. Impacts include: longer detention times, poorer settling properties, and increased sludge production.
Does not address bio‐toxics Results are highly variable and
site specific
Potential for additional odor generation
Evaporation On‐site
Efficient on COD Efficient on ammonia
Efficient on inorganics
Dependent on climate conditions
Post treatment required for residuals
Large footprint required Deep Well Injection
On‐site
Minimal on‐site treatment required
Small footprint
No treatment performed
Environmental treat to ground water and soil
Difficult to permit
Extensive monitoring required
High installation cost Constructed Wetlands
On or Off‐Site
If located near to the property, they can be energy efficient
Large footprint Very difficult to permit
Variable process removal efficiency
Complex O&M
Hauling Off‐Site Off‐site
No or minimal on‐site treatment required
Small footprint‐storage only
No treatment performed
High transportation risk Dependent upon finding an
entity that will accept the leachate within a relatively short distance from the generation site
Cost

94
Technology Type Advantages Disadvantages
Leachate Recirculation Bioreactor
On‐site
Efficient on COD Efficient for BOD5
Efficient on ammonia
Efficient on inorganics Small footprint
Treatment efficiency is dependent on the initial leachate quality and waste composition
Treatment performance is highly variable and site specific
Duration of treatment is not known
Post treatment may be required
Aerobic Biological Processes
On‐site
Efficient for BOD5
Relatively rapid treatment (>90% removal of BOD5 in 6‐8 hours)
Proven reliable technology
Minimal odor concerns
Treatment efficiency is dependent on the initial leachate quality and waste composition
Treatment performance is highly variable and may require pre‐treatment or surcharges
Does not address bio‐toxics Potentially large sludge
production that must be disposed of (typically at a landfill)
Potentially large energy requirements
Does not address TDS or conductivity
Anaerobic Biological Processes
On‐site
Efficient for BOD5
Proven reliable technology
Generates biogas for energy production
Requires minimal energy input
Treatment efficiency is dependent on the initial leachate quality and waste composition
Treatment performance is highly variable and site specific
Does not address bio‐toxics Some sludge production
Potential for odor generation Large footprint (treatment
requires detention times of days‐weeks not hours)
Does not address TDS or conductivity

95
Technology Type Advantages Disadvantages
Carbon Adsorption
On‐site
Efficient on COD Efficient for BOD5
Efficient on ammonia
Efficient on inorganics Small footprint
Treatment efficiency is dependent on the initial leachate quality and waste composition
Treatment performance is highly variable and site specific
Pre‐treatment required (pH adjustment, filtration)
Does not address TDS or conductivity
Limited or no full scale field experience with leachate
Ion Exchange On‐site
Efficient on ammonia
Efficient on inorganics Efficient on TDS and
conductivity
Small footprint
Treatment efficiency is dependent on the initial leachate quality and waste composition
Treatment performance is highly variable and site specific
Inefficient for BOD5 and COD
Pre‐treatment required (pH adjustment, filtration)
Limited or no full scale field experience with leachate
Air Stripping On‐site
Efficient on ammonia, at elevated pH
Efficient for VOCs Small footprint
Treatment efficiency is dependent on the initial leachate quality and waste composition
Treatment performance is highly variable and site specific
pH adjustment required
Chemica l addition costs
Inefficient for COD Inefficient for BOD5
Inefficient for inorganics Does not address TDS or
conductivity
Potential odor generation Potential air toxics risks Limited or no full scale field
experience with leachate

96
Technology Type Advantages Disadvantages
Physical/Chemical Processes (Coagulation, Flocculation, Precipitation, Sedimentation)
On‐site
Efficient on COD Efficient on inorganics Efficient on TSS Some disinfection action
Treatment efficiency is dependent on the initial leachate quality and waste composition
Treatment performance is highly variable and site specific
Limited effectiveness for ammonia
Unknown effectiveness for TDS and conductivity
Potential odor generation Large footprint Chemical addition costs
Potential chemical storage risks
Sludge disposal Membrane Filtration
On‐site
Efficient for TSS Efficient for particulate
organics (pBOD5, pCOD)
Some disinfectant action
Treatment efficiency is dependent on the initial leachate quality and waste composition
Treatment performance is highly variable and site specific
Pre‐treatment required (pH adjustment, anti‐scalant, organics reduction, microbe reduction, cartridge filtration)
Post‐treatment required (degasifier, membrane cleaning, backwash)
Brine disposal is a major issue
Potentially large energy requirements
Large footprint Limited or no full scale field
experience with leachate

97
Technology Type Advantages Disadvantages
Hydrogen Peroxide
On‐site AOP
Improves biodegradability
Strong disinfectant action Efficient on COD Medium footprint
Treatment efficiency is dependent on the initial leachate quality and waste composition
Treatment performance is highly variable and site specific
Not efficient by itself Limited effectiveness on
ammonia
Limited effectiveness on inorganics
Limited effectiveness on BOD5
Does not address TDS and conductivity
Long detention times or storage requirements
Chemical addition costs
Potential chemical storage risks
Limited or no full scale field experience with leachate
Fenton Process On‐site AOP
Improves biodegradability
Removes odor and color
Efficient on COD Medium footprint
Treatment efficiency is dependent on the initial leachate quality and waste composition
Treatment performance is highly variable and site specific
Limited effectiveness on ammonia
Limited effectiveness on inorganics
Limited effectiveness on BOD5
Does not address TDS and conductivity
Pre‐treatment required (pH adjustment)
Post‐treatment required (pH adjustment and filtration)
Long detention times or storage requirements
Chemical addition costs
Potential chemical storage risks
Limited or no full scale field experience with leachate
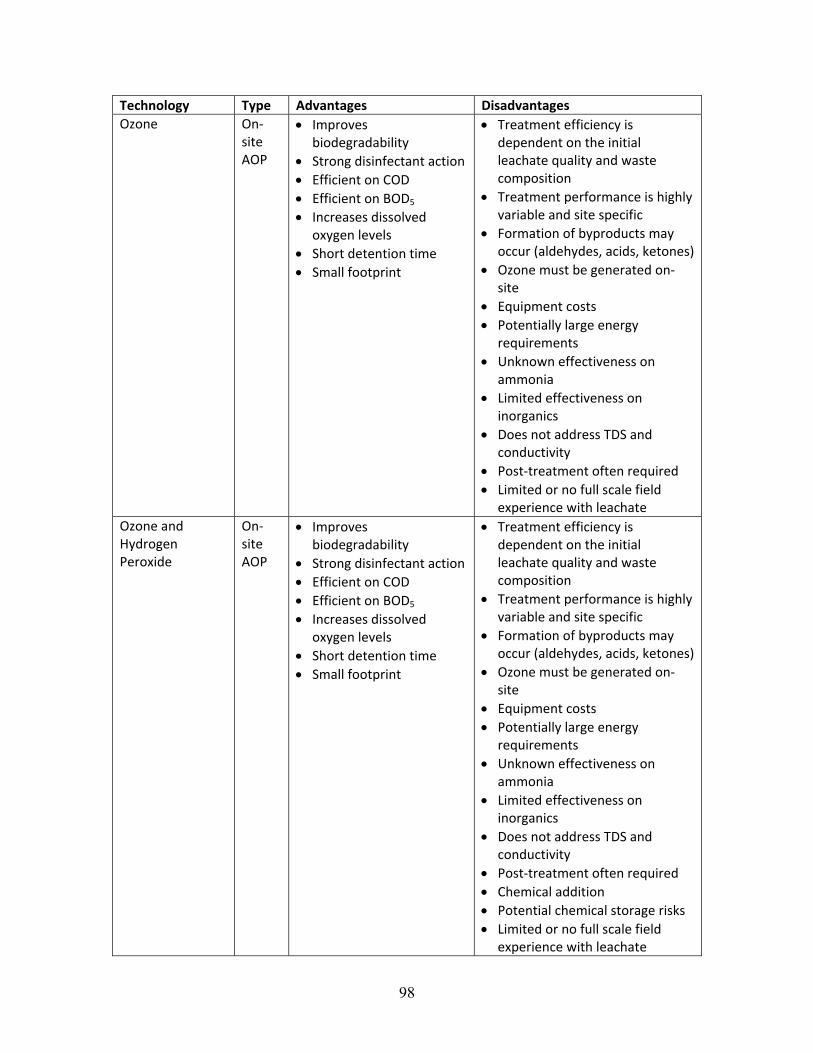
98
Technology Type Advantages Disadvantages
Ozone On‐site AOP
Improves biodegradability
Strong disinfectant action Efficient on COD Efficient on BOD5
Increases dissolved oxygen levels
Short detention time
Small footprint
Treatment efficiency is dependent on the initial leachate quality and waste composition
Treatment performance is highly variable and site specific
Formation of byproducts may occur (aldehydes, acids, ketones)
Ozone must be generated on‐site
Equipment costs
Potentially large energy requirements
Unknown effectiveness on ammonia
Limited effectiveness on inorganics
Does not address TDS and conductivity
Post‐treatment often required
Limited or no full scale field experience with leachate
Ozone and Hydrogen Peroxide
On‐site AOP
Improves biodegradability
Strong disinfectant action Efficient on COD Efficient on BOD5
Increases dissolved oxygen levels
Short detention time
Small footprint
Treatment efficiency is dependent on the initial leachate quality and waste composition
Treatment performance is highly variable and site specific
Formation of byproducts may occur (aldehydes, acids, ketones)
Ozone must be generated on‐site
Equipment costs
Potentially large energy requirements
Unknown effectiveness on ammonia
Limited effectiveness on inorganics
Does not address TDS and conductivity
Post‐treatment often required
Chemical addition
Potential chemical storage risks
Limited or no full scale field experience with leachate

99
Technology Type Advantages Disadvantages
Iron‐Mediated Aeration
On‐site AOP
Efficient on metals
Efficient on COD Efficient on ammonia,
with pH adjustment
Improves biodegradability
Disinfectant action Broad spectrum
applicability for organics and inorganics
Treatment efficiency is dependent on the initial leachate quality and waste composition
Treatment performance is highly variable and site specific
Limited effectiveness on TDS and conductivity
Requires metallic iron reagent, partially recoverable
Not catalytic Can generate important
quantities of iron sludge residuals
Longer detention times
Requires filtration post‐treatment
Requires pH adjustment for ammonia stripping
Potentially large energy requirements for aeration mixing
No full scale field experience with leachate
Ultraviolet Processes
EP Improves biodegradability
Strong disinfectant action Efficient on
photosensitive COD
Efficient on photosensitive BOD5
Short detention time
Small footprint
Treatment efficiency is dependent on the initial leachate quality and waste composition
Treatment performance is highly variable and site specific
Not very efficient by itself Pre‐filtration required for the UV
to work efficiently
Does not address ammonia
Does not address inorganics Does not address TDS and
conductivity
Potentially large energy requirements
Equipment costs
Limited or no full scale field experience with leachate

100
Technology Type Advantages Disadvantages
UV and Hydrogen Peroxide
EP Improves biodegradability
Strong disinfectant action Efficient on COD Lower detention times
compared to the H2O2 process
Small footprint
Treatment efficiency is dependent on the initial leachate quality and waste composition
Treatment performance is highly variable and site specific
Pre‐filtration required for the UV to work efficiently
Does not address ammonia
Does not address inorganics Does not address TDS and
conductivity
Potentially large energy requirements
Chemical addition
Potential chemical storage risks
Limited or no full scale field experience with leachate
Photo‐Fenton Processes
EP Improves biodegradability
Some disinfectant action
Efficient on COD Small footprint
Treatment efficiency is dependent on the initial leachate quality and waste composition
Treatment performance is highly variable and site specific
Pre‐filtration necessary for the UV to work more efficiently
Limited effectiveness for ammonia
Limited effectiveness for inorganics
Limited effectiveness for TDS and conductivity
Potentially large energy requirements
Chemical addition
Potential chemical storage risks
Post‐treatment often required
Limited or no full scale field experience with leachate

101
Technology Type Advantages Disadvantages
UV and Ozone EP Improves biodegradability
Strong disinfectant action Efficient on COD Efficient on BOD5
Increases dissolved oxygen levels
Short detention time (increased hydroxyl radical generation rate)
Small footprint
Treatment efficiency is dependent on the initial leachate quality and waste composition
Treatment performance is highly variable and site specific
Pre‐filtration required for the UV to work efficiently
Limited effectiveness for ammonia
Limited effectiveness for inorganics
Limited effectiveness for TDS and conductivity
Potentially large energy requirements
Formation of byproducts may occur (aldehydes, acids, ketones)
Ozone must be generated on‐site
Equipment costs
Post‐treatment required
Limited or no full scale field experience with leachate

102
Technology Type Advantages Disadvantages
UV and Ozone and Hydrogen Peroxide
EP Improves biodegradability
Strong disinfectant action Efficient on COD Efficient on BOD5
Increases dissolved oxygen levels
Short detention time (increased hydroxyl radical generation rate)
Small footprint
Treatment efficiency is dependent on the initial leachate quality and waste composition
Treatment performance is highly variable and site specific
Pre‐filtration required for the UV to work efficiently
Limited effectiveness for ammonia
Limited effectiveness for inorganics
Limited effectiveness for TDS and conductivity
Potentially large energy requirements
Formation of byproducts may occur (aldehydes, acids, ketones)
Ozone must be generated on‐site
Equipment costs
Post‐treatment required
Chemical addition
Potential chemical storage risks
Complex process to operate
Limited or no full scale field experience with leachate

103
Technology Type Advantages Disadvantages
Photochemical Iron Mediated Aeration
EP Efficient on metals
Efficient on COD Efficient on BOD5
Efficient on ammonia, with pH adjustment
Improves biodegradability
Strong disinfectant action Broad spectrum
applicability for organics and inorganics
No pre‐treatment required
Short detention time
Small footprint
Treatment efficiency is dependent on the initial leachate quality and waste composition
Treatment performance is highly variable and site specific
Limited effectiveness on TDS and conductivity
Requires metallic iron reagent, partially recoverable
Not catalytic Can generate important
quantities of iron sludge residuals
Requires filtration post‐treatment
Requires pH adjustment for ammonia stripping
Potentially large energy requirements for aeration mixing and ultraviolet energy
Equipment costs for UV
No full scale appications Photocatalytic Oxidation
EP Efficient on COD Efficient on BOD5
Efficient on ammonia
Catalytic process Improves
biodegradability
Broad spectrum applicability for organics and inorganics
No pre‐treatment required
Strong disinfectant action Short detention time
Small footprint
Treatment efficiency is dependent on the initial leachate quality and waste composition
Treatment performance is highly variable and site specific
Limited effectiveness on TDS and conductivity
Requires recoverable photocatalyst
Potentially large energy requirements for aeration mixing and ultraviolet energy
Equipment costs for UV
No full scale applications The same analysis was repeated for all of the engineering alternatives evaluated in this report, summarized in Table 32 and Table 33. The results are presented in descending order, which helps to indicate that there are benefits of using AOPs over traditional on-site techniques. Furthermore, the addition of UV energy improves the performance of AOPs but adds potential costs. The on-site treatment options assume municipal sanitary sewer discharge for disposal. During the course of this study, data has been collected that will allow refinement of the scores, particularly for the PIMA and photocatalytic

104
oxidation processes, which the final version of the DST can integrate into the guide. The major gap is that many of the less conventional management options have not been field tested, so the preliminary scores should be viewed with caution until such field experience can be obtained. Table 33. Summary of alternative analysis comparison results after revision Technology Efficiency Residuals Footprint Other Total
WeightedScore
Management Options
Deep Well Injection (Natural Attenuation)
5 or 0* 5 3 1 17 – 42*
Hauling Off‐Site 5 or 0** 5 5 1 19 – 44**
Municipal Sewer Discharge without Pre‐Treatment
2 4 5 4 39
Leachate Recirculation Bioreactor 4 2 3 3 39
Evaporation 2 2 1 3 27
On‐Site Treatment Options
Photocatalytic Oxidation 4 4 3 4 47
Membrane Filtration 5 1 3 2 38
Iron‐Mediated Aeration 4 1 3 3 37
Photochemical Iron Mediated Aeration 4 1 2 3 36
Hydrogen Peroxide 3 3 2 3 35
Ion Exchange 3 2 3 3 34
Physical/Chemical Processes (Coagulation, Flocculation, Precipitation, Sedimentation)
3 2 2 3 33
Fenton Process 3 1 2 3 31
UV and Hydrogen Peroxide 3 3 2 2 31
Photo‐Fenton Processes 3 1 2 3 31
Carbon Adsorption 3 2 3 2 30
Ultraviolet Processes 2 4 3 2 29
UV and Ozone and Hydrogen Peroxide 3 2 2 2 29
UV and Ozone 3 2 2 2 29
Ozone 2 2 3 2 25
Anaerobic Biological Processes 2 3 1 2 25
Aerobic Biological Processes 2 2 2 2 24
Ozone and Hydrogen Peroxide 2 2 2 2 24
Air Stripping 1 3 3 2 22
*Preferred option if permit can be obtained **Preferred option if receiving facility is less than 100 miles away The working version (see Error! Reference source not found.) is located on‐line for public comment at: http://labees.civil.fau.edu/LeachateMatrix.pdf

105
The selection criteria and the mapping of user profile information to the selection criteria are continuously under development for refinement after peer review from TAG members (starting from the initial review on April 14, 2009). The refined version serves as the BMP database, which is at the heart of the decision support tool. We are actively soliciting responses from the HCSHWM research review committee, our TAG members, and the landfill committee of Florida SWANA.
Figure 15. Screenshot of the alternative analysis comparison results. If the landfill facility is located too far for cost effective hauling or is located in an area where deep injection wells are difficult to permit, the bioreactor landfill approach and the direct municipal sewer discharge option are heavily favored. If none of the five management options is applicable, then pre-treatment prior to sewer discharge may be the only option left. In this case, the energized processes score favorably. The average score obtained for the energized processes is 33.1 compared to 30.2 for the more conventional wastewater treatment techniques and 30.4 for the advanced oxidation processes. This demonstrates the benefits of AOPs, and especially EPs. Their main strength is in broad spectrum applicability, higher performance efficiency, and low environmental impacts. However, some improvements can still be accomplished as the highest individual score from the EPs category is still below 50 points (47 out of 60). Furthermore, costs and the limited field application experience of thse practices have not been factored, which may

106
be significant. It was suggested by the TAG members that a new category for field experience be developed for the set of on-ste treatment options analyzed here; however, only a couple of the technologies have been applied at full scale, so the comparison would be meaningless. The point is well taken in that field experience will have a major impact on adoption of one technology versus another. Unproven technologies must be evaluated at full scale before recommending adoption. But at this stage in the development of these options, there is just too little information on which to base an adequate comparison. This factor would be relatively simple to add to the model once the data from full scale operations comes available. 3.3 MAPPING OF ALTERNATIVES TO USER SPECIFIC INFORMATION Taking the site specific categories and mapping the engineering alternatives to those categories with engineering judgment and TAG input, the key decision trees were created. A sample of one decision tree is shown in the next section below. The key pieces of information included:
1. How far away is the nearest POTW? a. Short (< 30 miles) b. Medium (30 – 100 miles) c. Long (> 100 miles)
2. What is the capacity of treatment for that POTW? a. Too small (< 5 MGD) b. Medium (5-20 MGD) c. Large (20-50 MGD) d. Super (> 50 MGD)
3. What are the sewer discharge limits for that POTW? 4. How much leachate is produced on a gpd/acre basis?
a. Small (< 100 gpd/acre) b. Medium (100 – 300 gpd/acre) c. Large (300 – 850 gpd/acre) d. Super (> 850 gpd/acre)
5. What is the leachate age? a. Young (< 5 yrs) b. Medium (5 – 10 yrs) c. Mature (> 10 yrs)
6. What are the leachate water quality parameters? a. BOD (low < 25 mg/L; med 25-400 mg/L; high > 400 mg/L) b. COD (low < 50 mg/L; med 50-800 mg/L; high > 800 mg/L) c. NH4-N (low < 25 mg/L; med 25-100 mg/L; high > 100 mg/L) d. TSS (low < 25 mg/L; med 25-400 mg/L; high > 400 mg/L) e. TDS (low < 1,000 mg/L; med 1,000-2,000 mg/L; high > 2,000 mg/L) f. Other

107
3.4 USER INTERFACE 3.4.1 Sample interactive session with the decision support system The interactive session starts with an initial screen requesting the start of the consultation. It is important that the browser that is being used should be JAVA enabled so that some of the applets designed under the JAVA environment will work. If the browser needs the JAVA software or any other add-ins, the tool will automatically prompt the user. Once the user starts the consultation, the user is directed to several screens in sequential order, with the DSS prompting the user to answer questions along with confidence or certainty factors provided to the user under the web-based interactive environment. This first step is for the tool to prompt for critical user input. These include:
Facility class a. Class I b. Class III c. Ash Monofill d. Co-Disposal e. Other, specify
Capacity in tons/day of municipal solid waste processed (and permitted acreage) a. small (<150 tons/d) b. medium (150-1000 tons/d) c. large (1000-3000 tons/d) d. super (>3000 tons/d)
Age of leachate a. young (<5 yr) b. medium (5-10 yr) c. mature (>10 yr)
Volumes of leachate generated a. Small (< 100 gpd/acre) b. Medium (100 – 300 gpd/acre) c. Large (300 – 850 gpd/acre) d. Super (> 850 gpd/acre)
Leachate management history User will describe which management option(s) has/have been used in
the past and evaluate level of performance on a scale of 1-5. This input will be used to alter the ranking of identified management
options or eliminate from them from further consideration, altogether. Leachate water quality (see Table 29) Service area characteristics (under development)
The tool will convert the user input into bin class for evaluating alternatives, and then proceed with the decision tree and rule-base as described earlier.

108
A sample interactive session is shown in Figure 16 and Figure 17.
Figure 16. Interactive session with web-based expert system/decision support system.

109
Figure 17. Final interactive session and decision (option/alternative) provided by DSS. A complete explanation of the inference mechanism and the sequence of rules that are fired can be obtained using the DSS. The user can ask questions based on the queries requested by the DSS at any point in the consultation. A complete list of rules, the sequence in which they are fired and how the DSS arrives at a specific management option is shown in Figure 18 for the sample consultation sessions shown in Figure 16 and Figure 17.

110
Explanation and Firing of Rules
• Minimum confidence factor for accepting a value as a fact: 60.0%
• Determined option is Ion Exchange is applicable with 100.0% confidence from:• >Rule below fired at CF=100.0% and assigned the value [Ion Exchange is applicable] with
100.0% confidence:• >IF: the result of BOD5 is BOD5 is low and• >the result of ammonia is ammonia is high and• >the result of metals is metals is high and• >the result of TDS is TDS is high• >THEN: option is Ion Exchange is applicable• >>Determined the result of BOD5 is BOD5 is low with 100.0% confidence from:• >>>[BOD5 is low] was input with 100.0% confidence• >>Determined the result of ammonia is ammonia is high with 100.0% confidence from:• >>>[ammonia is high] was input with 100.0% confidence• >>Determined the result of metals is metals is high with 100.0% confidence from:• >>>[metals is high] was input with 100.0% confidence• >>Determined the result of TDS is TDS is high with 100.0% confidence from:• >>>[TDS is high] was input with 100.0% confidence
Figure 18. Explanation and firing of rules by the decision support system provided to the user upon request. The leachate management decision support system is a knowledge assisted system, and is based on the knowledge of assessment of management options acquired from input derived from several sources. In the current state, the DSS environment is sufficient to guide the user to select the appropriate answers for the typical leachate quality and important site-specific key factors. However, more guidance is required for the user to assess the field applicability for different assessment queries. This guidance can be provided in a separate help document (user manual) or included in the user interface, itself. Help available within the interactive session is beneficial to the user as it constitutes real-time support. The use of a knowledge-based system in the current context for the domain of leachate management is justified because there is a need to capture the knowledge and experience of the practitioners, researchers, engineering professionals, regulators, and other stakeholders to develop a system that can help identify and prepare a preliminary list of management options that need further attention and can be further refined. The utility of the system depends on the knowledge-base and field-specific knowledge that is appropriate for a particular region. The user should also realize that some of the assessment elements that are used in the DSS are debatable and sometimes do not represent conditions visible in the field. The DSS can be run iteratively a number of times in the consultation period in which the knowledge-base can be refined by additional user inputs.

111
3.5 TOOL TESTING The testing of the DSS tool was accomplished by systematically checking the knowledge-base derived answers via repeated user consultation under multiple combinations of selections of choices for DSS supplied queries. A sample rule-base is provided in Appendix A. The DSS was first tested on a stand-alone personal computer system and was evaluated using a sample real-time consultation under a web-based environment. The tool was made available on-line on April 2, 2010 for public usage along with interactive help and information about management options. The web-based system can be fully tested and the any problems with knowledge-base can be rectified based on user feedback. The tool testing process involved the following steps:
1. Evaluate the ability of the DSS to reach a conclusion when all valid inputs are provided
2. Assess the correctness of the conclusion reached based the user provided inputs 3. Evaluate the appropriateness of the questions and the sequence of questions asked
to guide the user to a conceptually simple and comprehensible questionnaire 4. Validate the confidence factors assigned to the answers 5. Test the rules for: lack of conclusions, infinite loops, no-conclusion reached
conditions 6. Test consultation sessions with new rules added for robustness of the system 7. Confirm the validity of the conclusions reached by DSS by multiple experts,
practitioners and experienced professionals involved with field of leachate management.
All the above mentioned tests were carried out after the system (i.e., DSS) was tested on-line. Some of these preliminary tests were conducted on the stand-alone system on a personal computer, prior to lauching the first online version. 3.6 USER MANUAL The leachate management decision support tool was developed using a public domain expert system inference engine. The inference engine is available at expertise2go.com and can be downloaded for stand-alone applications on a PC environment. The current version (Version 1.0) of the system developed is available at web site http://www.civil.fau.edu/~ramesh/DST/leach.htm The background color of the screen may change from time to time with the content and the system remaining the same. A screenshot of the opening screen is shown in Figure 19.

112
Figure 19. Opening screenshot of the decision support tool. 3.6.1 Web-based decision support tool The web-based decision support tool is a live knowledge-based system and can be continuously improved and revised when new knowledge becomes available or based on feedback from users. No expertise is required when using this system. As the tool is developed using an inference engine from public domain, any errors or problems associate with the consultation or use of the tool may require attention from the tool developers and sometimes cannot be easily resolved. 3.6.2 Tool execution and system requirements The tool execution or consultation with the decision support system is made possible by connecting to the web link provided by using any internet browser. http://www.civil.fau.edu/~ramesh/DST/leach.htm An interactive session with the decision support tool starts with an initial screen requesting the start of the consultation. It is important that the browser that is being used should be JAVA-enabled so that some of the applets designed under the JAVA

113
environment will work. If the browser needs the JAVA software or any other add-ins, the tool will automatically prompt the user to do so. 3.6.3 Online help The website provides online help alongside of the decision support tool by providing the user with description of the basic leachate management options. The online help system is a live document and is updated as and when new information becomes available. 3.6.4 User consultation session Once the consultation starts, the user is directed to several screens in sequential order, with the decision support tool prompting the user to answer questions along with confidence or certainty factors. The consultation screen shown in Figure 20 consists of a question and an explanation of the question or a phrase/acronym/abbreviation used in the question. The consultation involves the system asking a prescribed set of (multiple choice) questions. The user is required to select one of the options, including the one where the system indicates – “I don’t know/would rather not answer.” The response choices are based on the mapped categories developed during the research and reviewed by the TAG committee. The tool then asks the user to report the level of certainty of the response between 50-100%.
Figure 20. Initial consultation screen. In every consultation screen, the user is prompted to express the confidence level in the answer by selecting an option between “very uncertain” (50%) to “very certain” (100%) as shown in Figure 21. The user can select the appropriate confidence level based on personal assessment. It should be cautioned that some of the rules may not be executed correctly if the user always selects the “very uncertain” option. The confidence level is set at one level higher than 50% in the current system. In other words, values tagged with

114
the “very uncertain” label will not fire the rule set. It is generally advisable to select at least 80% confidence level whenever possible for the system to work properly and recommend the most appropriate management options. Please note that the default option for the certainly factor is 100%, which can be changed by the user at any time for any question.
Certainty Factor
Figure 21. Example of certainty factors for questions. The screen also consists of three choices at the bottom of all the answers. These include:
1. “Submit your response” 2. “Why ask” 3. “Restart”
The button, “Submit your response” will take the user to the next screen for the next question. The “Why ask” button triggers the response from the tool as shown in Figure 22, which explains to the user that the response is required for the system to execute this particular rule from the knowledge-base and also explains the resulting consequences if the option is selected as shown in the rule. The “Return” button will take the user back to the previous screen where the consultation has stopped.

115
Figure 22. Response of the system to the “Why ask” option. The “Restart” button will return the user to the initial screen (Figure 19) and start the consultation process from the beginning again. Users are cautioned not to use the restart button unless there is a need to restart the entire consultation process because all previous responses will be reset. 3.6.5 Consultation progress The user will continue with several consultation screens one after the other until all questions are asked by the tool. There is no way to stop the consultation and come back to restart the consultation from the place where it is left. The consultation needs to be completed in one session. If the web-based system is closed (web browser is closed), then the consultation session is lost, and the user will need to restart the session from the beginning. The successive consultation sessions are shown in Figure 23.

116
(a)
(b)
(c)
(d)
(e)

117
Figure 23. Progress of consultations (a,b,c,d,e) with user supplied answers. The final screen for the example consultation provides the preferred management option(s). Multiple options are also provided in some instances. The user can stop the consultation here and note the management option, restart the entire session again, or ask the system to provide the logic behind the selection of a particular management option. This is possible by clicking the button “Explain.” In the current example consultation session, the preferred option is “Air Stripping.” Figure 24 shows the option available for the user to evaluate the way the tool reaches its conclusion by checking all the rules that were executed based on the answers provided the user.
Figure 24. Final consultation screen with option of explanation for different rules.

118
3.6.6 Summary This help manual provides a description of the execution of the web-based decision support tool. As the tool evolves, a manual with more examples of consultations and expanded help sections for each query will be available on the website. The system will be updated on a continuous basis as and when new information is available. Any additional queries about the system and usage should be directed to the developers of the system.

119
4. CONCLUSIONS AND RECOMMENDATIONS Planning for long term leachate management requires site-specific details on generation rates, climate, water quality goals, availability of disposal options, environmental issues, space constraints, economics, permitting, and regulatory considerations. The decision support system tool developed in the current study will provide guidance for selection of leachate management options based on user provided input. The tool is a knowledge-assisted assessment system and is based on the knowledge acquired from the technical literature, specific documents from existing landfills, surveys of landfill operators, regulators, and consultants, input from technical advisory group meetings, and in-house laboratory experiences. After evaluating 52 landfills in the State of Florida and evaluating more than 35 engineering alternatives, the research team has developed a decision support tool that will aid solid waste managers in Florida in becoming better informed about the emerging technologies that are becoming available to address their needs for long-term management of leachate. For each management option analyzed, numerical scores were used to rank each option according to the criteria specified above in the decision support system. Next, bins were set up to categorize important user-specific variables such as size of facility, type of leachate, etc. The alternatives were mapped to the bins, and a set of rules for the knowledge base was created. A user profile interface was created, the tool was launched privately for initial testing, and the tool is currently on-line at: http://www.civil.fau.edu/~ramesh/DST/leach.htm. In the current state, the decision support system tool is sufficient to guide the user to obtain an appropriate management option for various user-specific scenarios. However, more guidance is required for the user to assess the site-specific conditions, which may fall in the mid range of two assessment elements used in the DSS. The tool will be continuously updated as more and more knowledge becomes available, and the web-based system will provide the mechanism for user feedback after consulting with the DSS. The following recommendations can be made from the completed study:
1. The decision support tool framework can be expanded to include more site specific characteristics of landfills that may not always be available from already existing literature.
2. The tool should consider the age of the landfill and the amount of leachate generated in a more quantitative fashion.
3. Uncertainty associated with answers provided by the users should be incorporated into the decision-making processing using confidence factors. The use of confidence factors in the existing DSS tool needs to be improved.
4. A subroutine that can allow the user to eliminate certain alternatives from consideration should be added to the tool. This subroutine should also provide the

120
user with the option of exploring a particular leachate treatment option and provide a rationale if the user leachate treatment option is not viable.
5. A method for users to see why certain options were ranked higher than others should be made available. This function would provide a pop-up bubble with the pertinent information or links to the information. We have started to develop this function, but it is still incomplete.
6. The explanation of the tool result can be further enhanced by providing the user with a detailed description of the leachate treatment option as well as explaining the user as to how this leachate treatment option is the most viable way to treat the leachate based on sustainability, performance, risk, and preliminary cost criteria. This can be accomplished with a pop-up bubble with links to the appropriate information.
7. A rough cost estimation of the leachate treatment option can be beneficial to the user. This information will become more available as the tool usage becomes more widespread.
The interactive decision support tool for leachate management should be very beneficial to a landfill operator and can be the first step towards narrowing down the leachate treatment options for longterm management of leachate. A comprehensive study of site characteristics, leachate quality, and quantity is needed before attempting to use the tool and ultimately deciding on the most appropriate leachate management option.

121
5. REFERENCES Abdel-Halim, S.H., Shehata, A.M.A., and El-Shahat, M.F. Removal of lead ions from
industrial waste water by different types of natural materials. Water Research. 37(7): 1678-1683.
Abdul, J.M., Vigneswaran, S., Shon, H.K., Nathaporn, A., and Kandasamy, J. (2008). Comparison of granular activated carbon bio-sorption and advanced oxidation processes in the treatment of leachate effluent. Korean Journal of Chemical Engineering. 26(3): 724-730
Aghamohammadi, N., Aziz, H.A., Isa, M.H., and Zinatizadeh, A.A. (2007). Powdered activated carbon augmented activated sludge process for treatment of semi-aerobic landfill leachate using response surface methodology. Bioresources Technology. 98: 3570–3578.
Ahn, W.-Y., Kang, M.-S., Yim, S.-K., and Choi, K.-H. (2002). Advanced landfill leachate treatment using integrated membrane process, Desalination. 149: 109–114.
Akesson and Nilsson (1997). Seasonal Changes of Leachate Production and Quality from Test Cells. Journal of Environmental Engineering. 123(9): 892 – 900.
Al-Yaqout et al. (2005). Characteristics of Wastes, Leachate, and Gas at Landfills Operated in Arid Climate. Practice periodical of hazardous, toxic, and radioactive waste management. 9(2): 97 – 102.
Amokrane et al. (1997). Landfill leachates pretreatment by coagulation-flocculation. Water Research. 31(11): 2775 – 2780.
Anagiotou, C., Papadopoulos, A., and Loizidou, M. (1993). Leachate treatment by chemical and biological oxidation. Journal of environmental science and health. Part A, Environmental science and engineering. A28(1): 21 – 36.
Andreozzi et al. (1999). Advanced oxidation processes (AOP) for water purification and recovery. Catalysis Today. 53: 51 – 59.
APHA, AWWA and WEF (2005). Standard Methods for the Examination of Water & Wastewater, 21st Ed., American Public Health Association, Washington, DC.
Atwater, J.W., Jasper, S., Mavinic, D.S., and Koch, F.A. (1983). Experiments using Daphnia to measure landfill leachate toxicity. Water Research. 17: 1855–1861.
AWWA (1999). Water Quality and Treatment, Fifth Edition. McGraw-Hill, New York. Aziz, H.A., Adlan, M.N., Zahari, M.S.M., and Alias, S. (2004). Removal of ammoniacal
nitrogen (N-NH3) from municipal solid waste leachate by using activated carbon and limestone. Waste Management Research. 22: 371–375.
Bae, J.-H., Kim, S.-K., Chang, H.-S. (1997). Treatment of landfill leachates: Ammonia removal via nitrification and denitrification and further COD reduction via Fenton's treatment followed by activated sludge. Water Science and Technology. 36(12): 341-348.
Barratt, P.A., Baumgartl, A., Hannay, N., Vetter, M., and Xiong, F. ChemoxTM: advanced waste water treatment with the impinging zone reactor. Water Science and Technology. 35: 347–352.
Baumgarten, G. and Seyfried, C.F. (1996). Experiences and new developments in biological pretreatment and physical post-treatment of landfill leachate. Water Science and Technology. 34: 445–453.
Bekbölet, M., Linder, M., Weichgrebe, D., and Bahnemann, D.W. (1996). Photocatalytic

122
detoxification with the thin film fixed bed reactor (TFFBR): Clean up of highly polluted landfill effluents using a novel TiO2 photocatalyst. Solar Energy. 56(5): 455-469.
Bernard, C., Colin, J. R., and Le Dû-Delepierre, A. (1997). Estimation of the hazard of landfills through toxicity testing of leachates: 2. Comparison of physico-chemical characteristics of landfill leachates with their toxicity determined with a battery of tests. Chemosphere. 35(11): 2783 – 2796.
Bigot, V., Luck, F., Paillard, H., and Wagner, A. (1994). Landfill leachate treatment: comparison of three oxidation processes using ozone, in: Proceedings of the International Ozone Association Regional Conference, Zurich, Switzerland.
Bila, D.M., Montalvão, A.F., Silva, A.C., and Dezotti, M. (2005). Ozonation of a landfill leachate: Evaluation of toxicity removal and biodegradability improvement. Journal of Hazardous Materials. 117(2-3): 235-242.
Bishkin, B. (1998). PCB wastewater treatment. Print Circuit Fabrication. 21(11): 4. Bloetscher, F., Meeroff, D.E., and Toro, A. (2009). Concentrating the concentrate:
solutions for concentrate management, International Desalination Association Journal, 1(1): 38-51.
Bohdziewicz, J., Bodzek, M., and Gorska, J. (2001). Application of pressure-driven membrane techniques to biological treatment of landfill leachate. Process Biochem. 36: 641–646.
Booth, S.D.J., Urfer, D., Pereira, G., and Cober, K.J. (1996). Assessing the impact of a landfill leachate on a Canadian wastewater treatment plant. Water Environment Research. 68(7): 1179-1186.
Boyle, W.C. and Ham, R.K. (1974). Biological Treatability of Landfill Leachate, Journal of the Water Pollution Control Federation. 46(5): 860-872.
Bruner, M. A., P. A. Shipman, M. Rao, and J. A. Bantle (2002). Developmental effects of ambient UV-B light and landfill leachate in Rana blairi and Hyla chrysoscelis. Ecotoxicology and environmental safety. 53(1): 73 - 80.
Calli, B., Mertoglu, B., and Inanc, B. (2005). Landfill leachate management in Istanbul: Applications and alternatives. Chemosphere. 59(6): 819 – 829.
Çeçen, F. and Çakıroglu, D. (2001). Impact of landfill leachate on the co-treatment of domestic wastewater. Biotechnology Letters. 23(10), 821-826.
Chan, G.Y.S., Chu, L.M., and Wong, M.H. (2002). Effects of leachate recirculation on biogas production from landfill co-disposal of municipal solid waste, sewage sludge and marine sediment. Environmental Pollution. 118: 393–399.
Chian, E.S.K. and Dewalle, F.B. (1977). Evaluation of Leachate Treatment Volume I. Characterization of Leachate. Available from the National Technical Information Service, Springfield VA 22161 as PB-272 885. Report EPA-600/2-77-186a.
Chiang, L.C., J.-E. Chang, and C.-T. Chung (2001). Electrochemical oxidation combined with physical-chemical pretreatment processes for the treatment of refractory landfill leachate. Environmental Engineering Science. 18(6): 369.
Cho, S.P., Hong, S.C., Hong, S.I. (2002). Photocatalytic degradation of the landfill leachate containing refractory matters and nitrogen compounds. Applied Catalysis B: Environmental. 39: 125-133.
Cho, S.P., Hong, S.C., Hong, S.I. (2004). Study of the end point of photocatalytic degradation of landfill leachate containing refractory matter. Chemical Engineering
123
Journal, Vol. 98, p. 245-253. Comninellis, C. and Pulgarin, C. (1991). Anodic oxidation of phenol for waste water
treatment. Journal of Applied Electrochemistry. 21(8): 703-708. Cook, E.N. and Foree, E.G. (1974). Aerobic biostabilization of sanitary landfill leachate.
Journal of the Water Pollution Control Federation. 46(2): 380-392. Copa, W.M. and Meidl, J.A. (1986). Powdered carbon effectively treats toxic leachate.
Pollution Engineering. 18(7): 32-37. Crites, R.W. (1996). Constructed wetlands for wastewater treatment and reuse.
Engineering Foundation Conference, Environmental Engineering in the Food Processing Industry XXVI, Sante Fe, NM.
Cureton, P.M., Groenevelt, P.H., and Mcbride, R.A. (1991). Landfill leachate recirculation: effects on vegetation vigour and clay surface cover infiltration. Journal of Environmental Quality. 20(1): 17 - 24.
Davis, A.P. and Green, D.L. (1999). Photocatalytic oxidation of cadmium-EDTA with titanium dioxide. Environmental Science and Technology. 33(4), 609-617.
de Morais, J. L., and Zamora, P. P. (2005). Use of advanced oxidation processes to improve the biodegradability of mature landfill leachates. Journal of Hazardous Materials. 123(1 – 3): 181 – 186.
Deng, Y. (2007). Physical and oxidative removal of organics during Fenton treatment of mature municipal landfill leachate. Journal of Hazardous Materials. 146(1-2): 334-340.
Deng, Y. and Engelhardt, J.D. (2006). Treatment of landfill leachate by the Fenton Process. Water Research. 40: 3683-3694.
Deng, Y. and Engelhardt, J.D. (2007). Electrochemical oxidation for landfill leachate treatment. Waste Management. 27: 380-388.
Deng, Y. and Engelhardt, J.D. (2008). Hydrogen peroxide-enhanced iron-mediated aeration for the treatment of mature landfill leachate. Journal of Hazardous Materials. 153: 293-299.
Derco, J., Gulyasova, A., and Hornak, M. (2002). Influence of ozonation on biodegradability of refractory organics in a landfill leachate. Chem. Papers. 56: 41–44.
Devare, M. and Bahadir, M. (1994). Biological monitoring of landfill leachates using plants and luminescent bacteria, Chemosphere. 28: 261–271.
Di Palma, L., Ferrantelli, P., Merli, C., and Petrucci, E. (2002). Treatment of industrial landfill leachate by means of evaporation and reverse osmosis, Waste Management. 22: 951–955.
Di Palma, L., P. Ferrantelli, C. Merli, and E. Petrucci (2002). Treatment of industrial landfill leachate by means of evaporation and reverse osmosis. Waste Management. 22: 951 – 955.
Diamadopoulos, E. (1994). Characterization and treatment of recirculation stabilized leachate. Water Research. 28: 2439–2445.
Dobrović, S., H. Juretić, and N. Ružinski (2007). Photodegradation of Natural Organic Matter in Water with UV Irradiation at 185 and 254 nm: Importance of Hydrodynamic Conditions on the Decomposition Rate. Separation Science and Technology. 42(7): 1421 – 1432.
Ehrig, H., and Stegmann, R. (1992). Chapter 3.1: Biological Process in Landfilling of

124
Waste: Leachate, Elsevier Applied Science, New York. Englehardt, J.D., Meeroff, D.E., Echegoyen, L., Deng, Y., Raymo, F.M., and Shibata, T.
et al. (2002), In-situ chelation/reduction process for metals and radionuclides – Laboratory Study, U.S. Department of Energy, Report.
Englehardt, J.D., Meeroff, D.E., Echegoyen, L., Deng, Y., Raymo, F.M., and Shibata, T. et al. (2005). Options for Managing Municipal Landfill Leachate: Year 1 Development of Iron-Mediated Treatment Processes. University of Miami Coral Gables, Internal Report.
Englehardt, J.D., Meeroff, D.E., Echegoyen, L., Deng, Y., Raymo, F.M., and Shibata, T. (2007). Oxidation of aqueous EDTA and associated organics and coprecipitation of inorganics by ambient iron-mediated aeration, Environmental Science and Technology, 41(1): 270–276.
Escobara, C., Soto-Salazar, C., and Torala, M.i. (2006). Optimization of the electrocoagulation process for the removal of copper, lead and cadmium in natural waters and simulated wastewater. Journal of Environmental Management. 81(4): 384-391.
Esplugas et al. (2002). Comparison of different advanced oxidation processes for phenol degradation. Water Research. 36: 1034 – 1042.
Ettala, M.O. (1988). Short rotation tree plantations at sanitary landfills, Waste Management and Research. 6(33): 291-302.
Fang, H.H., Lau, I.W., and Wang, P. (2005). Anaerobic treatment of Hong Kong leachate followed by chemical oxidation. Water Science and Technology. 52(10-11): 41-49.
FAU EHS (2006). Chemical Hygiene Plan. Florida Atlantic University Environmental Health and Safety. http://www.fau.edu/facilities/ehs/info/Chem-Hygiene-Plan.pdf.
FDEP (2004). “Solid Waste Management in Florida 2002-2003.” http://www.dep.state.fl.us/ (April 19, 2006).
Feitz et al. (1998). Advanced oxidation processes and potential applications. Water: Official Journal of the Australian Water and Wastewater Association. 26(1): 34 – 35.
Fenton, H. J. H., and H. O. Jones (1900). The oxidation of organic acids in presence of ferrous iron Part I. Journal of the Chemical Society. 77: 69 – 76.
Foo, K.Y. and Hameed, B.H. (2009). An overview of landfill leachate treatment via activated carbon adsorption process. Journal of Hazardous Materials. 171: 54–60.
Forgie, D.J.L. (1988). Selection of the most appropriate leachate treatment methods. Part 3: A decision model for the treatment train selection. Water Quality Research Journal of Canada. 23(2): 341-355.
Frank, R. and Rau, H. (1990). Photochemical transformation in aqueous solution and possible environmental fate of ethylenediaminetetraacetic acid (EDTA). Ecotoxicology and Environmental Safety, 19: 55-63.
Gasnier, F. (2007). Photochemical Iron-Mediated Aeration Treatment of Landfill Leachate. A masters thesis. Florida Atlantic University, Boca Raton, FL.
Gau, S.H. and Chang, F.S. (1996). Improved Fenton method to remove recalcitrant organics in landfill leachate. Water Science and Technology. 34: 455–462.
Gearheart, R.A., Klopp, F. and Allen, G. (1989). Constructed free surface wetlands to treat and receive wastewater: pilot project to full scale, in D.A. Hammer (ed.) Constructed wetlands for wastewater treatment, Lewis Publishers, Chelsea, MI.

125
Geenens et al. (2000). Combined ozone-activated sludge treatment of landfill leachate. Water Science and Technology. 44(No 2-3): 359 – 365.
Geenens, D., Bixio, B., and Thoeye, C. (1999). Advanced oxidation treatment of landfill leachate, in: Proceedings of the Seventh International Waste Management and Landfill Symposium, Sardinia, Italy.
Gersberg, R.M., Elkins, B.V., Lyons, R., and Goldman, C.R. (1985). Role of aquatic plants in wastewater treatment by artificial wetlands, Proceedings of the Water Reuse Symposium III, Volume 2. American Water Works Association Research Foundation. pp. 639-648.
Glaze et al. (1987). Chemistry of Water Treatment Processes Involving Ozone, Hydrogen Peroxide and Ultraviolet Radiation. Ozone Science and Engineering. 9(4): 335 – 352.
Gonze et al. (2003). High Frequency Ultrasound as a Pre-or a Post-Oxidation for Paper Mill Wastewaters and Landfill Leachate Treatment. Chemical Engineering Journal, 92: 215 - 225.
Gray, D., Pollard, S.J.T., Spence, L., Smith, R. and Gronow, J.R. (2005). Spray irrigation of landfill leachate: Estimating potential exposures to workers and bystanders using a modified air box model and generalised source term. Environmental Pollution. 133(13): 587 – 599.
Groundwater Protection Council (2005). Injections wells An Introduction to their use, operation, and regulation. http://www.gwpc.org (July 17, 2007).
Grusauskas, J.F., Mathews, D.L, and Laliberte, D.M. (1996). Landfill leachate management: Combining biophysical treatment with ultrafiltration/reverse osmosis. Florida Water Resource Journal. September 1996: 24-26.
Grzechulska, J. and Marowski, A.W. (2003). Photocatlytic labyrinth flow reactor with immobilized P25 TiO2 bed for removal of phenol from water. Applied Catalysis B: Enviromental. 46: 415-419.
Gulsen, H. and Turan, M. (2004). Treatment of sanitary landfill leachate using a combined anaerobic fluidized bed reactor and Fenton’s oxidation. Environmental Engineering Science. 21(5): 627.
Haapea, P., Korhonen, S., and Tuhkanen, T. (2002). Treatment of industrial landfill leachates by chemical and biological methods: ozonation, ozonation + hydrogen peroxide, hydrogen peroxyde and biological posttreatment for ozonated water. Ozone Sci. Eng. 24(5): 369-378.
Henry, J.G. and Heinke, G.W. (1989). Environmental Science and Engineering. Prentice Hall: Englewood Cliffs, NJ.
Hickman (2003). American Alchemy – The History of Solid Waste Management in the United States, ForesterPress, Santa Barbara.
Hilmi, A., Luong, J.H., and Nguyen, A.L. (1999). Utilization of TiO2 deposited on glass plates for removal of metals from aqueous wastes. Chemosphere, 38(4):865-74.
Ho, S., Boyle, W.C., and Ham, R.K. (1974). Chemical treatment of leachate from sanitary landfills. Journal Water Pollution Control Federation. 46(7): 1776 – 1779.
Hur, J.M. and Kim, S.H. (2000). Combined adsorption and chemical precipitation process for pretreatment, Korean Journal of Chemical Engineering. 17(4): 433–437.
Ilisz, I., Dombi, A., Mogyorosi, K., Farkas, A. and Dekany, I. (2002). Removal of 2-chlorophenol from water by adsorption combined with TiO2 photocatalysis. Applied Catalysis B: Enviromental. 39(3): 247-256.

126
Imai et al. (1998), Effects of pre-ozonation in refractory leachate treatment by the biological activated carbon fluidized bed process. Environmental Technology. 19: 213 – 221.
Ince (1998). Light-enhanced chemical oxidation for tertiary treatment of municipal landfill leachate Water Environment Research. 70(6): 1161 – 1169.
Jimenez, L., Alzaga, R., and Bayona, J.M. (2002). Determination of organic contaminants in landfill leachates: A review. International Journal of Environmental Analytical Chemistry, 82(7), 415-430.
Jirka, A.M. and M.J. Carter (1975). Micro semi-automated analysis of surface and wastewaters for chemical oxygen demand. Analytical Chemistry, 47(8), 1397-1402.
Johnson, K.D., Martin, C.D., Moshiri, G.A., and McCrory, W.C. (1998). Performance of a constructed wetland leachate treatment system at the Chunchula Landfill, Mobile County Alabama, in Constructed Wetlands for the Treatment of Landfill Leachates, ed. by G. Mulamoottil, E.A. McBean, and F. Rovers. Lewis Publishers.
Joo, S.H., A.J. Feitz, and T.D. Waite (2004). Oxidative degradation of the carbothioate herbicide, molinate, using nanoscale zero-valent iron. Environmental Science and Technology. 38(7): 2242.
Joo, S.H., A.J. Feitz, D.L. Sedlak, and T.D. Waite (2005). Quantification of the oxidizing capacity of nanoparticulate zero-valent iron. Environmental Science and Technology, Vol. 39(5), 1263.
Kalderis, D., Koutoulakis, D., Paraskeva, P., Diamadopoulos, E., Otal, E., del Valle, J.O., and Fernández-Pereira, C. (2008). Adsorption of polluting substances on activated carbons prepared from rice husk and sugarcane bagasse. Chemical Engineering Journal. 144: 42–50.
Kang, Y.W. and Hwang, K.-Y. (2000). Effects of reaction conditions on the oxidation efficiency in the Fenton process. Water Research. 34: 2786–2790.
Kanki, T., Hamasaki, S., Sano, N. Toyoda, A., and Hirano, K (2005). Water purification in a fluidized bed photocatalytic reactor using TiO2 coated ceramic particles. Chemical Engineering Journal. 108: 155-160.
Kargi, F. and Pamukoglu, M.Y. (2004a). Adsorbent supplemented biological treatment of pretreated landfill leachate by fed-batch operation. Bioresources Technology. 94: 285–291.
Kargi, F. and Pamukoglu, M.Y. (2004b). Powdered activated carbon added biological treatment of pre-treated landfill leachate in a fed-batch reactor. Biotechnology Letters. 25: 695–699.
Kari, F.G., Hilger, S., and Canonica, S. (1995). Determination of the reaction quantum yield for the photochemical degradation of Fe(III)-EDTA: Implications for the environmental fate of EDTA in surface waters. Environmental Science Technology, 29(4), 1008-1017.
Kidman, R.B. and Tsuji, K.S. (1992). Preliminary costs comparison of advanced Oxidation Processes. Department of Energy, Technical Report, Washington, DC.
Kim, J. S., Kim, H. Y., Won, C. H., and Kim, J. G. (2001). Treatment of leachate produced in stabilized landfills by coagulation and Fenton oxidation process. Journal of the Chinese Institute of Chemical Engineers. 32(5): 425.
Kim, K.W., Lee, E.H., Kim, Y.J., Lee, M.H., and Shin, D.W. (2003). A study on characteristics of an electrolyte photocatalytic reactor using an anode coated with

127
TiO2. Kim, S.M., Geissen, S.U., and Vogelpohl, A. (1997). Landfill leachate treatment by a
photoassisted Fenton reaction. Water Science and Technology. 35(4): 229 – 248. Kim, Y.-K. and Huh, I.-R. (1997). Enhancing biological treatability of landfill leachate
by chemical oxidation. Environ. Eng. Sci. 14: 73–79. Kjeldsen et al. (2002a). Present and Long-Term Composition of MSW Landfill Leachate:
A Review. Critical Reviews in Environmental Science and Technology. 32(4): 297 – 336.
Kjeldsen, P., Barlaz, M.A., Rooker, A.P., Baun, A., Ledin, A., and Christensen, T.H. (2002b). Present and longterm composition of MSW landfill leachate: A review. Critical Reviews in Environmental Science and Technology, 32(4), 297-336.
Kostedt, W.L. and Mazyck, D.W. (2006). Performance of a Magnetically Agitated Photocatalytic Reactor for Oxidation of Ersatz Water. Proceedings of the SAE International Conference on Environmental Systems, July 2006, Norfolk, VA.
Kurniawan, T.A. and Lo, W.H. (2009). Removal of refractory compounds from stabilized landfill leachate using an integrated H2O2 oxidation and granular activated carbon (GAC) adsorption treatment, Water Research. 43: 4079–4091.
Kurniawan, T.A., Lo, W.H., and Chan, G.Y.S. (2006). Degradation of recalcitrant compounds from stabilized landfill leachate using a combination of ozone-GAC adsorption treatment, Journal of Hazardous Materials. B137: 443–455.
Kwan, C.Y. and Chu, W. (2003). Photodegradation of 2,4-dichlorophenoxyacetic acid in various iron-mediated oxidation systems. Water Research. 37: 4405-4412.
Lau, I.W.C., Wang, P., and Fang, H.H.P. (2001). Organic removal of anaerobically treated leachate by Fenton coagulation. Journal of Environmental Engineering Science. 27(7): 666-669.
Lema, J. M., Méndez-Novelo, R. and Blázquez, R. (1988). Characteristics of landfill leachates and alternatives for their treatment: A review. Water, Air, & Soil Pollution, 40(3-4): 223-250.
Li, X.Z., Zhao, Q.L., and Hao, X.D. (1999). Ammonium removal from landfill leachate by chemical precipitation. Waste Management. 19: 409–415.
Lin, S. H. and C. C. Chang (2000). Treatment of landfill leachate by combined electro-Fenton oxidation and sequencing batch reactor method. Water Research 34 (17): 4243 – 4249.
Linde, K., A. Jönsson, and R. Wimmerstedt (1995). Treatment of three types of landfill leachate with reverse osmosis. Desalination 101: 21 – 30.
Living Technologies, Inc. (1997). Advanced ecologically engineered system, South Burlington, VT, progress report. Massachusetts Foundation for Excellence, Boston, MA.
Lockhart, H.B. and Blakely, R.V. (1975). Aerobic photodegradation of Fe(III)-(ethlyenedinitrilo)tetraacetate (ferric EDTA). Environmental Science and Technology, 9: 1035-1038.
Loizidou, M., A. Papadopoulos, and E. G. Kapetanios (1993). Application of chemical oxidation for the treatment of refractory substances in leachates. Journal of environmental science and health. Part A, Environmental science and engineering, 28(2): 385 – 402.
Loizidou, M., N. Vithoulkas, and E. Kapetanios (1992). Physical chemical treatment of

128
leachate from landfill” Journal of environmental science and health. Part A. Environmental science and engineering. 27(4): 1059 – 1082.
Lopez, A., M. Pagano, A. Volpe, and A. C. Di Pinto (2004). Fenton’s pre-treatment of mature landfill leachate. Chemosphere. 54(7): 1005 – 1010.
Maehlum, T. (1995). Treatment of landfill leachate in on-site lagoons and constructed Wetlands. Water Science Technology, 32(3): 129-135.
Majone, M., Papini, M.P., and Rolle, E. (1998). Influence of metal speciation in landfill leachates on kaolinite sorption, Water Research. 32: 882–890.
Martin, C.D. and Johnson, K.D. (1995). The use of extended aeration and in-series surface-flow wetlands for landfill leachate treatment. Water Science Technology, 32(3): 119 – 128.
Marttinen, S.K., Kettunen, R.H., Sormunen, K.M., Soimasuo, R.M., and Rintala, J.A. (2002). Screening of physical–chemical methods for removal of organic material, nitrogen and toxicity from low strength landfill leachates, Chemosphere. 46: 851–858.
Mazyck, D.W., Drwiega, J., Lee, S.-W., Wu, C.-Y., Sigmund, W., and Chadik, P. (2004). Development and Characterization of a Magnetically Agitated Photocatalytic Reactor for Water Recovery. Proceedings of the SAE International Conference on Environmental Systems, Colorado Springs, CO.
Meeroff, D.E., J. D. Englehardt, L. A. Echegoyen, and T. Shibata (2006). Iron-Mediated Aeration: evaluation of energy-assisted enhancement for in situ subsurface remediation. Journal of Environmental Engineering 132(7): 747 – 767.
Meeroff, D.E., Gasnier, F., and Tsai, C.T. (2006). “Investigation of Energized Options for Leachate Management: Photochemical: Iron-Mediated Aeration Treatment of Landfill Leachate.” Final Report Year 1 for the William W. “Bill” Hinkley Center for Solid and Hazardous Waste Management, Gainesville, FL.
Meeroff, D.E., Gasnier, F., and Tsai, C.T. (2008). “Investigation of Energized Options for Leachate Management: Year Two Tests of Advanced Oxidation Processes for Treatment of Landfill Leachate.” Final Report Year 2 for the William W. “Bill” Hinkley Center for Solid and Hazardous Waste Management, Gainesville, FL.
Meeroff, D.E. (2010). “Advanced Oxidation Technology for Sustainable Leachate Management,” WASTECON-2010 Proceedings. Boston Convention and Exhibition Center, Boston, MA. August 15-17, 2010.
Méndez-Novelo, R. I., E. R. Castillo-Borges, M. R. Sauri-Riancho, C. A. Quintal-Franco, and G. Giacomán-Vallejos (2005). Physico-chemical treatment of Merida landfill leachate for chemical oxygen demand reduction by coagulation. Waste management & Research. 23(6): 560 – 564.
Méndez-Novelo, R.I., Castillo-Borges, E.R., Sauri-Riancho, M.R., Quintal-Franco, C.A., Giacomán-Vallejos, G., and Jiménez-Cisneros, B. (2005). Physico-chemical treatment of Merida landfill leachate for chemical oxygen demand reduction by coagulation. Waste Management & Research. 23(6): 560-564.
Mensar, H.A., Winant, W.M., and Bennett, O.L. (1983). Spray irrigation with landfill leachate. BioCycle. 24: 22-25.
Metcalf and Eddy (2003). Wastewater engineering, treatment and reuse. 4th Ed., eds. Tchobanoglous, G., Burton, F.L., and Stensel, H.D., McGraw-Hill Companies, New York.

129
Metsärinne, S., T. Tuhkanen, and R. Aksela (2001). Photodegradation of ethylenediamine tetraacetic acid (EDTA) and ethylenediamine disuccinic acid (EDDS) within natural UV radiation range. Chemosphere, 45(6-7): 949-955.
Millot, N., Granet, C., Wicker, A., Faup, G.M., and Navarro, A. (1987). Application of G.P.C. processing system to landfill leachates. Water Research. 21(6): 709-715.
Mohammad, A. W., N. Hilal, and L. Y. Pei (2004), Treatment of landfill leachate wastewater by nanofiltration membrane. International Journal of Green Energy. 1(2): 251 – 263.
Monje-Ramirez and Orta de Velasquez (2004). Removal and transfor-mation of recalcitrant organic matter from stabilized saline landfill leachates by coagulation-ozonation coupling processes. Water Research. 38: 2359 – 2367.
Moraes, P. B., and R. Bertazzoli (2005). Electrode gradation of landfill leachate in a flow electrochemical reactor. Chemosphere. 58: 41 – 46.
Morawe, B., Ramteke, D.S., and Vogelpohl, A. (1995). Activated carbon column performance studies of biologically treated landfill leachate. Chemical Engineering and Processing, 34(3): 299-303.
Morris et al. (2003). Findings from long-term monitoring studies at MSW landfill facilities with leachate recirculation. Waste Management, 23: 653 – 666.
Munter et al. (2001). Advanced Oxidation Processes (AOPs): Water Treatment Technology for the Twenty-first Century. Kemia. Kemi., 28(5): 354 – 362.
Nolte and Associates (1997). Sacramento Regional Wastewater Treatment Plant Demonstration Wetlands Project-1996 Annual Report. Sacramento Regional County Sanitation District, Elk Grove, CA.
Noradoun, C., M. D. Engelmann, M. McLaughlin, R. Hutcheson, K. Breen, A. Paszczynski, and I. F. Cheng (2003). Destruction of chlorinated phenols by dioxygen activation under aqueous room temperature and pressure conditions. Journal of Hazardous Materials. 96(2-3): 277.
O’Leary et al. (1995). “Decision Maker’s Guide to Solid Waste Management, Volume II, (EPA 530-R-95-023)”, http://www.epa.gov (April 7, 2006)
Outwater, A.B. (1994). Sludge Dewatering, in Reuse of Sludge and Minor Wastewater Residuals. CRC Press Inc, Boca Raton, FL.
Oweis and Kehra (1998). Geotechnology of Waste Management, 2nd Ed., PWS Publishing Company, Boston.
Oztrk, I, Altinbas, M., Koyuncu, I., Arikan, O., and Gomec-Yangin, C. (2003). Advanced physico-chemical treatment experiences on young municipal landfill leachates. Waste Management. 23: 441–446.
Pala, A. and Erden, G. (2004). Chemical pretreatment of landfill leachate discharged into municipal biological treatment systems. Environmental Engineering Science. 21(5): 549.
Papadopoulos et al. (1996). Studies on the use of clinoptilolite for ammonia removal from leachates. Journal of environmental science and health. Part A, Environmental science and engineering. 31(1): 211 – 220.
Papadopoulos, A., Fatta, D., and Loizidou, M. (1998). Treatment of stabilized landfillleachate by physico-chemical and bio-oxidation processes, Journal of Environmental Science and Health. A33: 651–670.

130
Park, J.Y. and Batchelor, B. (2002). A multi-component numerical leach model coupled with a general chemical speciation code. Water Research. 36: 156–166.
Perters T. A. (1998). Purification of landfill leachate with reverse osmosis and Nanofiltration. Desalination, Vol. 119(1-3), p 289.
Peyton, G.R. and Glaze, W.H. (1988). Destruction of Pollutants in Water with Ozone in Combination with Ultraviolet Radiation. 3. Photolysis of Aqueous Ozone. Environmental Science and Technology. 22: 761-767.
Pi, K.W., Li, Z., Wan, D.J., and Gao, L.X. (2009). Pretreatment of municipal landfill leachate by a combined process. Process Safety and Environmental Protection. 87: 191–196.
Piatkiewicz, W., Biemacka, E., and Suchecka, T. (2001). A polish study: treating landfill leachate with membranes. Filtrat. Sep. 38: 22–26.
Pohland and Harper (1986). Critical Review and Summary of Leachate and Gas Production from Landfills. EPA 600/2-86/073, USEPA.
Pohland, F.G., Stratakis, M., Cross, W.H., and Tyahla, S.F. (1990). Controlled landfill management of municipal solid and hazardous wastes. Proceedings of the 1990 Water Pollution Control Federation National Specialty Conference on Water Quality Management of Landfills, Chicago, IL, July 15-18, 1990. p. 3-32.
Primo, O., Rivero, M.J., and Ortiz, I. (2008). Photo-Fenton process as an efficient alternative to the treatment of landfill leachates. Journal of Hazardous Materials. 153(1-2):834-842.
Qasim and Chiang (1994). Sanitary landfill leachate – Generation, Control and Treatment. CRC Press, Boca Raton, FL.
Qasim, S.R., Motley, E.M., and Zhu, G. (2000). Water Works Engineering: Planning, Design, and Operation. Prentice Hall: Upper Saddle River, NJ.
Qureshi, T.I., Kim, H., and Kim, Y. (2002). UV-catalytic treatment of municipal solid-waste landfill leachate with hydrogen peroxide and ozone oxidation. Chinese Journal of Chemical Engineering. 10(4): 444.
Raina, S. and Mavinic, D.S. (1985). Comparison of full-and-draw reactors for treatment of landfill leachate. Water Quality Research Journal of Canada. 20(2): 12-28.
Rao, N.N., Somasekhar, K.M., Kaul, S.N., and Szpyrkowicz, L. (2001). Electrochemical oxidation of tannery wastewater. Journal of Chemical Technology & Biotechnology. 76(11): 1124 – 1131.
Reinhart and Grosh (1998). “Analysis of Florida MSW landfill leachate quality.” Florida Center for Solid and Hazardous Management, Report #97-3.
Reinhart and Townsend (1998). Landfill Bioreactor Design & Operation, Lewis Publishers, Boca Raton, FL.
Reinhart, D. R., and Al-Yousfi, A.B. (1996). The impact of leachate recirculation on municipal solid waste landfill operating characteristics. Waste Management & Research. 14: 337 – 346.
Reinhart, D.R, Chopra, M., Vajirkar, M., and Townsend, T. (2005). Design and Operational Issues Related to the Co-Disposal of Sludges and Biosolids in Class I Landfills-Phase II.
Reinhart, D.R. (1996). Full-scale experiences with leachate recirculating landfills: case studies. Waste Management and Research, 14: 347-365.
Renou, S., Givaudan, J.G., Poulain, S., Dirassouyan, F., and Moulin, P. (2008). Landfill

131
leachate treatment : review and opportunity. Journal of Hazardous Materials. 150: 468-493.
Rincon, A.-G. and Pulgarin C. (2005). Use of Coaxial Photocatalytic Reactor (CAPHORE) in the TiO2 photo-assisted treatment of mixed E.coli and Bacillus sp. and bacterial community present in the wastewater. Catalysis Today. 101: 331 - 344.
Rivas, F.J., Beltrán, F.J., Gimeno, O., Acedo, B., and Carvalho, F. (2003). Stabilized leachates: ozone-activated carbon treatment and kinetics. Water Research. 37: 4823–4834.
Rivas, F.J., Beltrán, F.J., Gimeno, O., Frades, J., and Carvalho, F. (2006). Adsorption of landfill leachates onto activated carbon: equilibrium and kinetics. Journal of Hazardous Materials. B131: 170–178.
Robinson, H. D., M. J. Barr, and S. D. Last (1992). Leachate collection, treatment and disposal. Water and environmental management: Journal of the Institution of Water and Environmental Management. 6(3): 321 – 332.
San, I. and Onay, T.T. (2001). Impact of various leachate recirculation regimes on municipal solid waste degradation, Journal of Hazardous Materials. B87: 259–271.
Sandya, B., Muttamara, S., Visvanathan, C., Boonthanon, S., and Mora, J.C. (1995). Preliminary investigations on ozone colour removal from a solid waste landfill leachate, in: Proceedings of the 12thWorld Congress of the International Ozone Association, Lille, France.
Saripalli, K.P., M. M. Sharma, and S.L. Bryant (2000). Modeling injection well performance during deep-well injection of liquid wastes. Journal of Hydrology 227: 41 – 55.
Schmelling, D., Gray, K., and Kamat, P. (1996). Role of Reduction in the Photocatalytic Degradation of TNT. Environmental Science and Technology. 30: 2547-2555.
Schulte, P., Bayer, A., Kuhn, F., Luy, T., and Volkmer, M. (1995). H2O2/O3, H2O2/UV and H2O2/Fe2+ processes for the oxidation of hazardous wastes. Ozone: Science & Engineering. 17(2): 119-134.
Shu et al. (2006). Treatment of MSW landfill leachate by a thin gap annular UV/H2O2 photoreactor with multi-UV lamps. Journal of Hazardous Materials. 129(1): 73 – 79.
Silva, A.C., M. Dezotti, and G.L. Sant’Anna Jr. (2004). Treatment and detoxification of a sanitary landfill leachate. Chemosphere 55: 207 – 214.
Slater, C.S., Uchrin, C.G., and Ahlert, R.C. (1988). Ultrafiltration processes for the characterization and separation of landfill leachates. Journal of Environmental Science and Health, Part A: Environmental Science and Engineering. A20(1): 97 – 111.
Slomczynska et al. (2004). Effect of advanced oxidation processes on the toxicity of municipal landfill leachates. Water Science and Technology. 49(4): 273 – 277.
Snoeyink and Jenkins (1980). Water Chemistry, John Wiley & Sons, New York. Snyder, L.J. (1947). Improved dithizone method for determination of lead. Analytical
Chemistry. 19(9), 684-687. Solid Waste Authority of Palm Beach County (2006). http://www.swa.org (several dates). Song, L.Y., Zhao, Y.C., Sun, W.M., and Lou, Z.Y. (2009). Hydrophobic organic
chemicals (HOCs) removal frombiologically treated landfill leachate by powder-activated carbon (PAC), granular-activated carbon (GAC) and biomimetic fat cell (BFC). Journal of Hazardous Materials. 163: 1084–1089.

132
Staehelin J. and Hoigné, J. (1983). Decomposition of Ozone in Water in the Presence of Organic Solutes Acting as Promoters and Inhibitors of Radical Chain Reactions. Environmental Science and Technology. 79: 1206-1213.
State of Florida (2006). “Florida Administrative - Code Chapter 62 – Department of Environmental Protection”, http://www.myflorida.com/ (February 23, 2006).
Statom et al. (2004). Temporal changes in leachate chemistry of a municipal solid waste landfill cell in Florida, USA. Environmental Geology. 45: 982 – 991.
Steensen (1997). Chemical oxidation for the treatment of leachate - Process comparison and results from full-scale plants. Water science and technology. 35(4): 249 – 256.
Street et al. (2002). Lead Removal from Synthetic Leachate Matrices by a Novel Ion-Exchange Material. Journal of the Air & Waste Management Association. 52(9): 1075 – 1082.
Suty, H. De Traversay, C., and Cost, M. (2004). Applications of advanced oxidation processes: Present and future. Water Science and Technology. 49(4): 227-233.
Tammemagi (1999). The Waste Crisis - Landfills, incinerators, and the search for a sustainable future, Oxford, New York.
Tatsi, A.A., Zouboulis, I, Matis, K.A., and Samaras, P. (2003). Coagulation–flocculation pretreatment of sanitary landfill leachates. Chemosphere. 53: 737 – 744.
Tchobanoglous and Kreith (2002). Handbook of solid waste management, 2nd Ed., McGraw-Hill Handbooks, New York.
Tchobanoglous, G.,Theisen, H., and Vigil, S. (1993). Integrated solid waste management: engineering principles and management issues. McGraw Hill, Inc., New Tork.
Tedder, R.B. (1997). Evaluating the performance of Florida double lined landfills. Geosynthetics Conference, Long Beach, CA.
Thornton, R.J. and Blanc, F.C. (1973). Leachate treatment by coagulation and precipitation. Journal of the Environmental Engineering Division. 99(4): 535-544.
Toor, A.P., Verma, A., Jotshi, C.K., Bajpai, P.K., and Singh, V. (2006). Photocatalytic degradation of Direct Yellow 12 dye using UV/TiO2 in shallow pond slurry reactor. Dyes and Pigments. 68: 53-60.
Trebouet, D., Schlumpf, J.P., Jaouen, P. and Quemeneur, F. (2001). Stabilized landfill leachate treatment by combined physicochemical–nanofiltration processes. Water Research. 35(12): 2935-2942.
Trebouet, D., Schlumpf, J.P., Jaouen, P., Maleriat, J.P., and Quemeneur, F. (1999). Effect of operating conditions on the nanofiltration of landfill leachates: pilotscale studies. Environmental Technology. 20: 587–596.
USEPA (1986). Quality Criteria for Water 1986. http://www.epa.gov (June 24, 2006). USEPA (1993). Constructed wetlands for wastewater treatment and wildlife habitat. EPA
832-R-93-005, Municipal Technology Branch, Washington, DC. USEPA (1995). Manual: Ground-Water and Leachate Treatment Systems.
http://www.epa.gov (April 13, 2006). USEPA (2000). Wastewater Technology Fact Sheet - Ammonia Stripping.
http://www.epa.gov (December 14, 2006). USEPA (2003). Characterization of Municipal Waste Combustion Ash, Ash Extracts, and
Leachates. United States Environmental Protection Agency. 530/SW-90-029b. USEPA (2005). “Municipal Solid Waste in the United States - 2003 Facts and Figures.”
http://www.epa.gov (April 7, 2006).

133
Ushikoshi, K., Kobayashi, T., Uematsu, K., Toji, A., Kojima, A., and Matsumoto, K. (2002). Leachate treatment by the reverse osmosis system. Desalination. 150(2): 121 – 129.
Uygur, A., and Kargi, F. (2004). Biological nutrient removal from pre-treated landfill leachate in a sequencing batch reactor, Journal of Environmental Management. 71: 9–14.
Veli, S., Öztürk, T., and Dimoglo, A. (2008). Treatment of municipal solid wastes leachate by means of chemical- and electro-coagulation. Separation and Purification Technology. 61: 82–88.
Viraraghavan, T. and Singh, K.S. (1997). Anaerobic biotechnology for leachate treatment: A review, Air & Waste Management Association 90. Annual Meeting.
Vohra, M.S. and Davis, A.P. (2000). TiO2-assisted photocatalysis of lead–EDTA. Water Research, 34(3), 952-964.
Wable, O., Jousset, M., Courant, P., and Duguet, J.P. (1993). Oxidation of landfill leachates by ozone and hydrogen peroxide: a French example. Proceedings of the International Symposium on Ozone-Oxidation Methods for Water and Wastewater Treatment, Wasser, Berlin. Berlin, Germany. International Ozone Association, European-Africa Group, Paris, France. pp. II.6.1–II.6.11.
Wang, B. and Shen, Y. (2000). Performance of an anaerobic baffled reactor (ABR) as a hydrolysis–acidogenesis unit in treating landfill leachate mixed with municipal sewage. Water Science and Technology. 42: 115–121.
Wang, F., M. Gamal El-Din, and D. W. Smith (2004). Oxidation of aged raw landfill leachate with O3 only and O3/H2O2: treatment efficiency and molecular size distribution analysis. Ozone: Science and Engineering. 26: 287 – 298.
Wang, Z. P., Z. Zhang, Y.-J. Lin, N.-S. Deng, T. Tao and K. Zhuo (2002a). Landfill leachate treatment by a coagulation-photooxidation process. Journal of Hazardous Materials. 95(1-2): p 153.
Wang, P., Lau, W.C.I., and Fang, H.P.H. (2002b). Ozonation of refractory chemicals in leachate with hydrogen peroxide. Journal of Environmental Sciences. 14(4): 495.
Ward, M. L., G. Bitton, T. G. Townsend, and M. Booth (2002). Determining Toxicity of Leachates from Florida Municipal Solid Waste Landfills Using a Battery of Tests Approach. Environmental Toxicology. 17(3): 258 – 266.
Wasay, S.A., Barrington, S., and Tokunaga, S. (1999). Efficiency of GAC for treatment of leachate from soil washing process. Water, Air, and Soil Pollution. 116: 449–460.
Watson, J.T., Reed, S.C., Kadlec, R.H., Knight, R.L, and Whitehouse, A.E. (1979). Performance expectations and loading rates for constructed wetlands, in D.A. Hammer (ed.) Constructed wetlands for wastewater treatment, Lewis Publishers, Chelsea, MI.
WCPH (1996). Total resource recovery project, final report. City of San Diego, CA. Western Consortium for Public Health, Oakland, CA.
Welander, U., Henrysson, T., and Welander, T. (1998). Biological nitrogen removal from municipal landfill leachate in a pilot scale suspended carrier biofilm process. Water Research. 4: 95–102.
Westlake, K. and M. Phil (1995). Landfill Waste Pollution and Control. Albion Publishing, Chichester (England).
Wichitsathian, B., S. Sindhuja, C. Visvanathan, and K. H. Ahn (2004). Landfill leachate

134
treatment by yeast and bacteria based membrane bioreactors. Journal of environmental science and health. Part A. 39(9): 2391 – 2404.
Winthelser, P. (1998). Leachate recirculation: a review of operating experience at municipal solid waste landfills throughout the United States. Water Quality International. 35: 35 – 36.
Wong, M.H. (1989). Toxicity test of landfill leachate using Sarotherodon mossambicus (freshwater fish). Ecotoxicol. Environ. Saf. 17: 149–156.
Wong, M.H. and Leung, C.K. (1989). Landfill leachate as irrigation water for tree and vegetable crops. Waste Management and Research, Vol. 7(1), p 311 – 323.
Wu et al. (2004). Treatment of landfill leachate by ozone-based advanced oxidation processes. Chemosphere. 54: 997 – 1003.
Yatmaz, H.C., Wallis, C., and Howarth, C.R. (2001). The spinning disc reactor studies on a novel TiO2 photocatalytic reactor. Chemoshere. 42: 397-403.
Yoo, H.-C., Cho, S.-H., and Ko, S.-O. (2001). Modification of coagulation and Fenton oxidation processes for cost-effective leachate treatment, Journal of Environmental Science and Health. A36(1): 39–48.
Yoon, J., Cho, S., Cho, Y., and Kim, S. (1998). The characteristics of coagulation of Fenton reaction in the removal of landfill leachate organics. Water Science and Technology. 38(2): 209 – 214.
Youcai et al. (2002). Treatment of Leachate by Aged-Refuse-Based Biofilter. Journal of Environmental Engineering. 128(7): 662 - 668.
Zachopoulos, S.A. et al. (1990). Co-treatment of sanitary landfill leachate with municipal wastewater. Water Pollution Control Federation Specialty Conference Proceedings: Water Quality Management of Landfills.
Zhang, H., Choi, H.J., and Huang, C. (2005). Optimization of Fenton process for the treatment of landfill leachate. Journal of Hazardous Materials B125: 166 – 174.
Zhang, Z., Anderson, W.A., and Moo-Young, M. (2000). Rigorous modeling of UV absorption by TiO2 films in a photocatalytic reactor. American Institute of Chemical Engineers Journal. 46(7): 1461-1470.

135
Appendix A REM Interactive Decision Support System for Leachate Management Options RULE [What is best when just COD?] If [the result of COD] = "COD is high" Then [option] = "Ozone is applicable" RULE [Is Ion Exchange applicable?] If [the result of BOD5] = "BOD5 is low" and [the result of ammonia] = "ammonia is high" and [the result of metals] = "metals is high" and [the result of TDS] = "TDS is high" Then [option] = "Ion Exchange is applicable" RULE [Is Flocculation, Precipitation, or Sedimentation applicable?] If [the result of COD] = "COD is high" and [the result of ammonia] = "ammonia is low" and [the result of metals] = "metals is high" and [the result of TDS] = "TDS is high" and [the result of TSS] = "Is your TSS too high?" and [the result of footprint] = "Large" Then [option] = "Flocculation, Precipitation, Sedimentation is applicable" RULE [Is Photocatalytic Oxidation applicable?] If [the result of BOD5] = "BOD5 is high" and [the result of COD] = "COD is high" and [the result of ammonia] = "ammonia is high" Then [option] = "Photocatalytic Oxidation is applicable" RULE [Is Membrane Filtration applicable?] If [the result of BOD5] = "BOD5 is high" and [the result of COD] = "COD is high" and [the result of TSS] = "TSS is high" and [the result of footprint] = "Medium" and [the result of footprint] = "Large" Then [option] = "Membrane Filtration is applicable" RULE [Is Iron-Mediated Aeration applicable?] If [the result of ammonia] = "ammonia is high" and [the result of COD] = "COD is high" and [the result of TDS] = "TDS is high" and [the result of metals] = "metals is high" Then [option] = "Iron-Mediated Aeration is applicable" RULE [Is Photochemical Iron Mediated Aeration applicable?]

136
If [the result of ammonia] = "ammonia is low" and [the result of COD] = "COD is high" and [the result of TDS] = "TDS is low" and [the result of BOD5] = "BOD5 is high" Then [option] = "Photochemical Iron Mediated Aeration is applicable" RULE [Is the Fenton Process applicable?] If [the result of COD] = "COD is high" and [the result of footprint] = "Medium" Then [option] = "The Fenton Process is applicable" RULE [Is Carbon Adsorption applicable?] If [the result of ammonia] = "ammonia is high" and [the result of COD] = "COD is high" and [the result of TDS] = "TDS is low" and [the result of metals] = "metals is high" and [the result of BOD5] = "BOD5 is high" and [the result of footprint] = "Medium" and [the result of footprint] = "Large" Then [option] = "Carbon Adsorption is applicable" RULE [Are Ultraviolet Processes applicable?] If [the result of ammonia] = "ammonia is low" and [the result of COD] = "COD is high" and [the result of metals] = "metals is low" Then [option] = "Ultraviolet Processes are applicable" RULE [Is a Bioreactor: leachate recirculation applicable?] If [the result of ammonia] = "ammonia is high" and [the result of COD] = "COD is high" and [the result of metals] = "metals is high" and [the result of BOD5] = "BOD5 is high" Then [option] = "ABioreactor: leachate recirculation is applicable" RULE [Are Aerobic and Anaerobic Biological Processes applicable?] If [the result of BOD5] = "BOD5 is high" and [the result of footprint] = "Large" Then [option] = "Aerobic and Anaerobic Biological Processes are applicable" RULE [Is Air Stripping applicable?] If [the result of TDS] = "TDS is low" and [the result of COD] = "COD is low" and [the result of metals] = "metals is low" and [the result of BOD5] = "BOD5 is low" Then [option] = "Air Stripping is applicable"

137
RULE [Is Evaportation applicable?] If [the result of ammonia] = "ammonia is high" and [the result of COD] = "COD is high" and [the result of metals] = "metals is high" and [the result of footprint] = "Large" Then [option] = "Evaportation is applicable" PROMPT [the result of BOD5] Choice CF "Is your BOD5 too high?:" "BOD5 is high" "BOD5 is low" PROMPT [the result of COD] Choice CF "Is your COD too high?:" "COD is high" "COD is low" PROMPT [the result of ammonia] Choice CF "Is your ammonia too high?:" "ammonia is high" "ammonia is low" PROMPT [the result of metals] Choice CF "Is your metals too high?:" "metals is high" "metals is low" PROMPT [the result of TDS] Choice CF "Is your TDS too high?:" "TDS is high" "TDS is low" PROMPT [the result of TSS] Choice CF "Is your TSS too high?:" "TSS is high" "TSS is low" GOAL [option] MINCF 60

138
Appendix B List of sewer discharge limits for key constituents of concern in Florida. District County Municipality BOD COD Iron Lead Ammonia Nitrogen TKN TDS TSS Cond pH Date
NW Bay n/a n/a n/a 0.69 n/a n/a n/a n/a n/a n/a n/a nr
NW Tallahassee 1,395 n/a n/a 0.54 n/a n/a 193 n/a 870 n/a n/a 01/2008
NW Escambia 4,600 n/a n/a 1.50 n/a 571 n/a n/a 3,382 n/a n/a 10/2008
NW Panama City 200 n/a 2.0 0.21 n/a n/a 35 n/a 200 n/a n/a 03/2009
NW Port St. Joe 83,000 n/a 4.5 0.68 n/a n/a n/a n/a 155,000 n/a n/a nr
NE Clay n/a n/a n/a 5.06 n/a n/a n/a n/a n/a n/a n/a 02/2004
NE Gainesville 2206‐6699
n/a 148 0.2 n/a n/a n/a n/a 363‐3341 n/a n/a 05/2007
NE Jacksonville‐ Buckman
n/a n/a n/a 1.4 n/a n/a n/a n/a n/a n/a n/a 04/2006
NE Jacksonville‐ District II
n/a n/a n/a 0.7 n/a n/a n/a n/a n/a n/a n/a 04/2006
NE Jacksonville‐ Southwest
n/a n/a n/a 1.9 n/a n/a n/a n/a n/a n/a n/a 04/2006
NE Jacksonville‐ Arlington East
n/a n/a n/a 1.17 n/a n/a n/a n/a n/a n/a n/a 04/2006
NE Jacksonville‐ Buckman 2
n/a n/a n/a 1.9 n/a n/a n/a n/a n/a n/a n/a 04/2006
NE Lake City 450 n/a n/a 0.68 n/a n/a n/a 2400 350 n/a n/a nr
NE Perry n/a n/a n/a 0.27 n/a n/a n/a n/a n/a n/a n/a 04/2009
NE St. Augustine n/a n/a n/a n/a n/a n/a n/a n/a n/a n/a None
NE St. Johns 1400 1600 0.15 n/a n/a 620 n/a 500 n/a n/a 01/2007
C Altamonte Springs
n/a n/a n/a 0.4 n/a n/a n/a n/a n/a n/a n/a 08/2009
C Apopka 6300 n/a n/a 1.1 n/a 1100 5275 n/a 5.5‐9.5 01/2009
C Cocoa Beach 1084 n/a n/a 0.26 n/a n/a n/a n/a 989 n/a n/a 07/2004
C Daytona Beach
n/a n/a n/a 0.4 n/a n/a n/a n/a n/a n/a n/a 12/2004
C Deland 220‐660 400‐600 n/a 0.07 30‐50 40‐60 n/a n/a 220‐550 n/a n/a nr
C Indian River n/a 500 n/a 0.29 n/a 40 n/a 1200 300 n/a 5.5‐9.5 10/2007
C Marion 350 Surcharge; 699 Max
800 Surcharge; 1517 Max
n/a 0.1 n/a 40 Surcharge; 133 Ma
n/a n/a 250 Surcharge; 759 Max
n/a n/a 10/2007
C Melbourne 1000 n/a n/a 0.62 n/a n/a n/a n/a 300 n/a n/a 03/2008
C Ocala n/a 10918 n/a 1.02 n/a n/a n/a n/a 2703 n/a n/a nr
C Orange County‐ Easterly
15000 n/a n/a 0.5 n/a n/a n/a n/a 15000 n/a 6‐8.5 nr
C Orange County‐ Northwest
15000 n/a n/a 0.5 n/a n/a n/a n/a 15000 n/a 6‐8.5 nr
C Orange County‐ South
5000 n/a n/a 0.5 n/a n/a n/a 5000 4300 n/a 6‐9.5 nr
C Orlando n/a 7500 n/a 0.25 n/a n/a n/a n/a 7500 n/a 5.5‐10.5 07/2006
C Ormond Beach
1000 n/a n/a 0.12 n/a n/a n/a n/a 500 n/a n/a 11/2005
C Palm Bay n/a n/a n/a 0.2 n/a n/a n/a n/a n/a n/a n/a 05/2005
C Port Orange 1000 n/a 38.7 0.69 n/a n/a 41.6 n/a 825 n/a n/a 01/2005
C Reedy Creek Improvement District
n/a n/a n/a 0.54 n/a n/a n/a n/a n/a n/a n/a 06/2006
C Rockledge n/a n/a n/a 0.28 n/a n/a n/a 500 n/a n/a 06/2009
C Sanford n/a 200 n/a 0.4 n/a n/a n/a n/a 200 n/a n/a 03/1997
C Seminole 478 n/a n/a 0.012 n/a 50 n/a 750 618 n/a n/a 08/2006
C Titusville 250 n/a n/a 1 n/a 175 n/a 250 n/a n/a 2005 Reference Manual
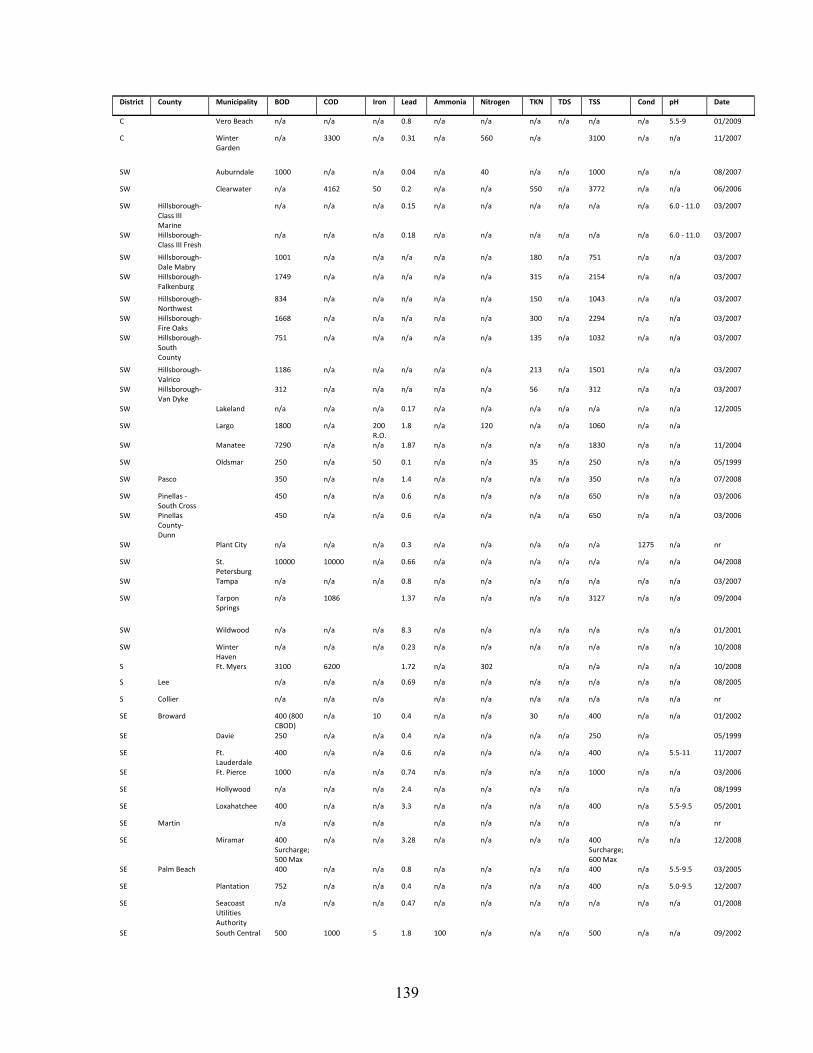
139
District County Municipality BOD COD Iron Lead Ammonia Nitrogen TKN TDS TSS Cond pH Date
C Vero Beach n/a n/a n/a 0.8 n/a n/a n/a n/a n/a n/a 5.5‐9 01/2009
C Winter Garden
n/a 3300 n/a 0.31 n/a 560 n/a 3100 n/a n/a 11/2007
SW Auburndale 1000 n/a n/a 0.04 n/a 40 n/a n/a 1000 n/a n/a 08/2007
SW Clearwater n/a 4162 50 0.2 n/a n/a 550 n/a 3772 n/a n/a 06/2006
SW Hillsborough‐ Class III Marine
n/a n/a n/a 0.15 n/a n/a n/a n/a n/a n/a 6.0 ‐ 11.0 03/2007
SW Hillsborough‐ Class III Fresh
n/a n/a n/a 0.18 n/a n/a n/a n/a n/a n/a 6.0 ‐ 11.0 03/2007
SW Hillsborough‐ Dale Mabry
1001 n/a n/a n/a n/a n/a 180 n/a 751 n/a n/a 03/2007
SW Hillsborough‐ Falkenburg
1749 n/a n/a n/a n/a n/a 315 n/a 2154 n/a n/a 03/2007
SW Hillsborough‐ Northwest
834 n/a n/a n/a n/a n/a 150 n/a 1043 n/a n/a 03/2007
SW Hillsborough‐ Fire Oaks
1668 n/a n/a n/a n/a n/a 300 n/a 2294 n/a n/a 03/2007
SW Hillsborough‐ South County
751 n/a n/a n/a n/a n/a 135 n/a 1032 n/a n/a 03/2007
SW Hillsborough‐ Valrico
1186 n/a n/a n/a n/a n/a 213 n/a 1501 n/a n/a 03/2007
SW Hillsborough‐ Van Dyke
312 n/a n/a n/a n/a n/a 56 n/a 312 n/a n/a 03/2007
SW Lakeland n/a n/a n/a 0.17 n/a n/a n/a n/a n/a n/a n/a 12/2005
SW Largo 1800 n/a 200 R.O.
1.8 n/a 120 n/a n/a 1060 n/a n/a
SW Manatee 7290 n/a n/a 1.87 n/a n/a n/a n/a 1830 n/a n/a 11/2004
SW Oldsmar 250 n/a 50 0.1 n/a n/a 35 n/a 250 n/a n/a 05/1999
SW Pasco 350 n/a n/a 1.4 n/a n/a n/a n/a 350 n/a n/a 07/2008
SW Pinellas ‐ South Cross
450 n/a n/a 0.6 n/a n/a n/a n/a 650 n/a n/a 03/2006
SW Pinellas County‐ Dunn
450 n/a n/a 0.6 n/a n/a n/a n/a 650 n/a n/a 03/2006
SW Plant City n/a n/a n/a 0.3 n/a n/a n/a n/a n/a 1275 n/a nr
SW St. Petersburg
10000 10000 n/a 0.66 n/a n/a n/a n/a n/a n/a n/a 04/2008
SW Tampa n/a n/a n/a 0.8 n/a n/a n/a n/a n/a n/a n/a 03/2007
SW Tarpon Springs
n/a 1086 1.37 n/a n/a n/a n/a 3127 n/a n/a 09/2004
SW Wildwood n/a n/a n/a 8.3 n/a n/a n/a n/a n/a n/a n/a 01/2001
SW Winter Haven
n/a n/a n/a 0.23 n/a n/a n/a n/a n/a n/a n/a 10/2008
S Ft. Myers 3100 6200 1.72 n/a 302 n/a n/a n/a n/a 10/2008
S Lee n/a n/a n/a 0.69 n/a n/a n/a n/a n/a n/a n/a 08/2005
S Collier n/a n/a n/a n/a n/a n/a n/a n/a n/a n/a nr
SE Broward 400 (800 CBOD)
n/a 10 0.4 n/a n/a 30 n/a 400 n/a n/a 01/2002
SE Davie 250 n/a n/a 0.4 n/a n/a n/a n/a 250 n/a 05/1999
SE Ft. Lauderdale
400 n/a n/a 0.6 n/a n/a n/a n/a 400 n/a 5.5‐11 11/2007
SE Ft. Pierce 1000 n/a n/a 0.74 n/a n/a n/a n/a 1000 n/a n/a 03/2006
SE Hollywood n/a n/a n/a 2.4 n/a n/a n/a n/a n/a n/a 08/1999
SE Loxahatchee 400 n/a n/a 3.3 n/a n/a n/a n/a 400 n/a 5.5‐9.5 05/2001
SE Martin n/a n/a n/a n/a n/a n/a n/a n/a n/a nr
SE Miramar 400 Surcharge; 500 Max
n/a n/a 3.28 n/a n/a n/a n/a 400 Surcharge; 600 Max
n/a n/a 12/2008
SE Palm Beach 400 n/a n/a 0.8 n/a n/a n/a n/a 400 n/a 5.5‐9.5 03/2005
SE Plantation 752 n/a n/a 0.4 n/a n/a n/a n/a 400 n/a 5.0‐9.5 12/2007
SE Seacoast Utilities Authority
n/a n/a n/a 0.47 n/a n/a n/a n/a n/a n/a n/a 01/2008
SE South Central 500 1000 5 1.8 100 n/a n/a n/a 500 n/a n/a 09/2002

140
District County Municipality BOD COD Iron Lead Ammonia Nitrogen TKN TDS TSS Cond pH Date
SE Vero Beach n/a n/a n/a 0.8 n/a n/a n/a n/a n/a n/a 5.5‐9 01/2009
SE West Palm Beach
1000 (400 CBOD)
800 10 1.9 50 n/a n/a n/a 865 n/a 5.5‐9.5 11/2001

141
Appendix C List of TAG Members that participated in this project: Jeff Roccapriore Joe Lurix Art Torvela Sermin Unsal Ravi Kadambala Fredericcck Bloetscher Amede Dimonnay Allan Choate Juan Quiroz Dan Schauer Tom Peel Lee Martin Lee Casey Chad Fettrow James Leavor Marshall Seymore Charles Emery Dan Morrical John Booth Ray Schauer Richard Meyers Manuel Hernandez Marc Bruner Matt Zuccaro