Embed Size (px)
Citation preview
Journal of Physics Conference Series
OPEN ACCESS
Interaction of fibrinogen and albumin with titaniumdioxide nanoparticles of different crystallinephasesTo cite this article Arianna Marucco et al 2013 J Phys Conf Ser 429 012014
View the article online for updates and enhancements
You may also likeDynamic protein adsorption at thepolyurethane copolymerwater interfaceM Yaseen H J Salacinski A M Seifalian etal
-
The influence of the sequence ofnanoparticles injection to solution on therate of fibrinogen-thrombin reactionM N Kirichenko S V Krivokhiza L LChaikov et al
-
Fabrication of 3D-nanofibrous fibrinogenscaffolds using salt-induced self assemblyKarsten Stapelfeldt StephaniStamboroski Polina Mednikova et al
-
Recent citationsInterfacial Modeling of FibrinogenAdsorption onto LiNbO3 SingleCrystalndashSingle Domain SurfacesJeffrey S Cross et al
-
Sputtered crystalline TiO2 film drivesimproved surface properties of titanium-based biomedical implantsHeloisa Navarro Pantaroto et al
-
In vitro osseointegration analysis of bio-functionalized titanium samples in aprotein-rich mediumShradha Rao et al
-
This content was downloaded from IP address 19153251118 on 14012022 at 2249
Interaction of fibrinogen and albumin with titanium dioxide
nanoparticles of different crystalline phases
Arianna Marucco Ivana Fenoglio Francesco Turci and Bice Fubini
University of Torino Dept of Chemistry Interdepartmental Centre ldquoG Scansettirdquo for
Studies on Asbestos and Other Toxic Particulates and Interdepartmental Center for
Nanostructured Interfaces and Surfaces Via P Giuria 7 10125 Torino Italy
ariannamariamaruccounitoit
Abstract TiO2 nanoparticles (NPs) are contained in different kinds of industrial products
including paints self-cleaning glasses sunscreens TiO2 is also employed in photocatalysis and
it has been proposed for waste water treatment Micrometric TiO2 is generally considered a
safe material while there is concern on the possible health effects of nanometric titania Due to
their small size NPs may migrate within the human body possibly entering in the blood stream
Therefore studies on the interaction of NPs with plasma proteins are needed In fact the
interaction with proteins is believed to ultimately influences the NPs biological fate
Fibrinogen and albumin are two of the most abundant plasma proteins They are involved in
several important physiological functions Furthermore fibrinogen is known to trigger platelet
adhesion and inflammation For these reasons the study of the interaction between these protein
and nanoparticles is an important step toward the understanding of the behavior of NPs in the
body In this study we investigated the interaction of albumin and fibrinogen with TiO2
nanoparticles of different crystal phases (rutile and anatase) using an integrated set of
techniques The amount of adsorbed fibrinogen and albumin for each TiO2 surface was
investigated by using the bicinchoninic acid assay (BCA) The variation of the surface charge
of the NP-protein conjugates respect to the naked NPs was used to indirectly estimate both
surface coverage and reversibility of the adsorption upon dilution Surface charge was
monitored by measuring the potential with a conventional electrophoretic light scattering
(ELS) system The extent of protein deformation was evaluated by Raman Spectroscopy We
found that both proteins adsorb irreversibly against electrostatic repulsion likely undergoing
conformational changes or selective orientation upon adsorption The size of primary particles
and the particles aggregation rather than the crystal phase modulate the affinity of fibrinogen
for the TiO2 surfaces
1 Introduction
The rapid diffusion in the market of nanotechnological products opens new concerns on the
possible adverse effects following the direct or indirect exposure of humans to nanoparticles (NPs) [1-
4] The hazard associated to nanomaterials is often difficult to be defined because of knowledge of
the interaction of nanoscale objects with living matter is still incomplete [5-7]
When a foreign body comes in contact with a biological fluid its surface is quickly covered by the
components of the fluid particularly proteins A layer of proteins defined as ldquoprotein coronardquo in the
case of nanoparticles [8] is rapidly formed Such layer is a dual system composed by a core of
strongly bound proteins and an outer layer of fast exchanging molecules [9 10] The composition of
the protein corona depends upon a series of competitive processes driven by both thermodynamic and
Nanosafe 2012 International Conferences on Safe Production and Use of Nanomaterials IOP PublishingJournal of Physics Conference Series 429 (2013) 012014 doi1010881742-65964291012014
Published under licence by IOP Publishing Ltd 1
kinetic factors [9] Interaction with blood proteins is considered the most critical step among the
events determining the fate of NPs in the body At the same time the interaction with blood proteins
may trigger adverse responses like thrombosis and inflammation [11] Plasma is a very complex
system composed by thousand of different proteins the two most abundant being albumin (35-50
mgml) and fibrinogen (18-35 mgml) Albumin is a soft protein of 67 kDa exhibiting a globular
shape (9 6 5 nm) At physiological pH it has a net negative charge the isoelectric point (IP) being
at pH 48 This protein is synthetized in the liver and its main physiological role is the transport of
solutes in the blood stream to their target organs It also contributes to maintain the pH and the
osmotic pressure of plasma [12] Fibrinogen is a large and complex glycoprotein (340 kDa) It has a rod-like shape with dimensions
of 9 475 6 nm and like albumin it shows a negative net charge at physiological pH (IP at pH 52)
[13] It is synthesized in the liver and it is involved in several different biological functions such as
blood clotting and stabilization of thrombi following vessel injury [14] It also triggers foreign body
reactions following implantation of prosthesis [15] and inflammatory responses to NPs [16] These
effects are mediated by surface-driven conformational changes leading to the exposure of specific
epitopes when fibrinogen is adsorbed [1516] It is generally accepted that the physico-chemical
properties of the surface play a crucial role in the interaction of a solid with living matter [15 17 18
19 20] but there is not yet a clear definition of the physico-chemical determinants of such interactions
Here we report about the interaction of albumin and fibrinogen with three different samples of TiO2
having different crystal phase (rutile and anatase) The study aims to elucidate the possible influence
of the crystal phase on the behaviour of these two proteins at the titania surface
Rutile and anatase nanometric titanium dioxide have been chosen for this study since they are largely
used in industry mainly as UV blockers in sunscreen and plastics TiO2 finds also application in
catalysis and has been proposed for water and air remediation thanks to its high photo-reactivity
Nanometric TiO2 is also a promising material in nanomedicine [21] Exposure of workers and users to
this kind of nanomaterial is therefore expected to increase in the next years
The interaction of nano- TiO2 with the two proteins was investigated by evaluating the amount of
protein interacting with the powder extent of surface coverage and irreversibility of the process
(spectrophotometry and electrophoretic light scattering) The occurrence of conformational changes
was also investigated by Raman spectroscopy
2 Materials and Methods
21 Materials
Pyrogenic nanometric anataserutile powder (Aeroxide P25) (TAR) was purchased from Degussa-
Evonik (Germany) while rutile (MT500B) (TR) was from LCM-Trading (Italy)
Nanometric anatase powder (TA) was synthesized by a sol gel process as described in previous
work [22]
Bovine Plasma Fibrinogen (BPF) and Bovine Serum Albumin (BSA) were chosen as model for
human fibrinogen and albumin and purchased from Sigma Aldrich (Germany) and used without
further purification
In all experiments ultrapure Milli Q (Millipore Billerca MA) water was used All other reagents
were from Sigma Aldrich (Germany)
22 Methods
221 X ray diffraction
XRD spectra were collected on a diffractometer (PW1830 Philips) using CoKα radiation in the
(20minus90) 2θ range with step width 2θ = 005 and diffraction peaks have been indexed according to the
ICDD database (International Centre for Diffraction Data) The spectra have been elaborated (Xrsquo-pert
Highscore 10c PANalytical BV) in order to assess the primary particle mean diameter of the
different specimens
Nanosafe 2012 International Conferences on Safe Production and Use of Nanomaterials IOP PublishingJournal of Physics Conference Series 429 (2013) 012014 doi1010881742-65964291012014
2
222 HR-TEM investigation
The morphology of rutile nanoparticles were investigated by JEOL 3010-UHR HR-TEM equipped
with a LaB6 filament operated at 300 kV beam current 114 microA and equipped with a 2k x 2k pixels
Gatan US1000 CCD camera The nanoparticles were dispersed in ultrapure water (MilliQ system
Millipore) sonicated for 20 minutes and a droplet was deposited on lacey carbon Cu grids
223 X ray fluorescence diffraction
The TiO2 samples were analyzed using an EDAX Eagle III energy dispersive micro-XRF
spectrometer equipped with a Rh X-ray tube and a polycapillary exciting a circular area of nominally
30 μm diameter Data collection occurred at each point for 200 s detector live time with X-ray tube
settings adjusted for 30 dead time About 1 times 106 Cps were counted per scan At least 4 points were
collected for each sample
224Surface Area Measurements
The surface area of the particles was measured by means of the Brunauer Emmett and Teller
(BET) method based on N2 adsorption at 77 K (Micrometrics ASAP 2020)
225 ζ Potential
The ζ Potential was evaluated by means of electrophoretic light scattering (ELS) (Zetasizer Nano-
ZS Malvern Instruments Worcestershire UK)
In this technique the velocity of particles in an oscillating electric field which is proportional to
their ζ Potential was measured by light scattering TiO2 particles were suspended in ultrapure water
and then sonicated for 2 min with a probe sonicator (100 W 60 kHz Sonoplus Bandelin Berlin
Germany)
The ζ Potential in function of pH was measured for all the samples in water and in 10 mM
phosphate buffer (PBS) for monitoring nanoparticles surface charge The ζ potential at pH 74 was
obtained by interpolation of a curve obtained by measuring the ζ potential at different pH (2minus9) by
adding 01 M HCl or NaOH to the suspension
The measurements were also repeated on titania powders incubated with protein solution and on
titania powders incubated with protein and then washed three times in PBS
226 Evaluation of the quantity of protein adsorbed on nanoparticles
Titania powders were suspended (33 mgml) in buffered protein solution (001M phosphate buffer
pH 74 0138 M NaCl and 27 mM KCl) at different concentrations (100-10000 mgL)
The suspension were stirred in a thermostatic stirrer at 37degC for 1h and centrifuged at 11000 RPM
then filtered through a membrane filter (cellulose acetate pore diameter 045 microm) and the
concentration of protein in the supernatant was determined spectrophotometrically (562 nm) by using
the bicinchoninic acid (BCA) assay
The amount of protein adsorbed was calculated as a difference between the final and the initial
concentration of protein in the supernatant The results are reported as the mean value of at the least
three separate determinations plusmn standard error The data are expressed as nano moli of protein
adsorbed on m2 as a function of the protein concentration present in solution after the incubation
The theoretical monolayers were calculated by protein sizes as the amount needed for obtain a side-
on protein monolayer on a totally available flat surface
227 Raman Spectroscopy
Raman spectra were acquired using an integrated confocal Raman system that includes a Horiba
Jobin-Yvon HR 800 microspectrometer an Olympus BX41 microscope and a CCD air-cooled
detector operating at -70degC
A polarized solid-state Nd laser operating at wavelength of 53211nm and a power of 80 mW was
used as excitation source
Nanosafe 2012 International Conferences on Safe Production and Use of Nanomaterials IOP PublishingJournal of Physics Conference Series 429 (2013) 012014 doi1010881742-65964291012014
3
Calibration of the instrument was performed by measuring the Stokes and the anti-Stokes bands of
the Si band at 5207 cm-1
For the powder samples the measure were made placing the sample on a polished stainless steel
slide and a 50X objective delivering a power of ca 15 mW to the sample was used
Spectra were acquired with a spectral resolution of ca 2 cm-1
and an integration time spanning
from 100 to 400 s for the spectral region of 400-1800 cm-1
3 Results and discussion
31 Physico-chemical characteristic of nanoparticles
The three different samples of TiO2 designated as TR (rutile) TAR (anataserutile) TA (anatase)
having different proportion of crystalline phase were chosen and thoroughly characterized (Table 1)
Table 1 Physico-chemical characterization
Sample Crystalline
Phase Purity
Surface
area
BET
(m2g)
Primary
particles
dimension
(nm)
Hydrodynamic
size
(nm)
PCZ
Potential
(pH 74)
TR 100
Rutile gt995 39
Lenght
405 plusmn 121 a
Diameter
274 plusmn 65 a
156
PDI 012 55 -357
TAR
77
Anatase
23 Rutile
gt996 53 19plusmn3
b
45plusmn7 b
214
PDI 018 69 -132
TA 100
Anatase gt996 83 11plusmn2
b
428
PDI 038 67 -175
a Evaluated by TEM
b Evaluated by XRD in according to the Scherrerrsquos equation
The degree of purity of the TiO2 samples evaluated by X-rays fluorescence (XRF) was found to be
very high (gt99) The samples showed a different specific surface area which correspond to a
different nanostructure (Table 1) In fact the estimated crystallites size of anatase was lower than in
the other two samples in agreement with to the higher SSA value obtained
The size analysis of the NP aggregates has been obtained by DLS in water at pH 10 At this pH
value the particles exhibit a highly negative surface charge which minimize the formation of
agglomerates because of electrostatic repulsions among particles All samples exhibited aggregates
having a wide range of diameters as suggested by the high polydispersity index (PDI) values (Table 1)
The anatase sample appears to be composed by aggregates larger than the other two samples
In water the TiO2 NP surface is charged due to the the presence of dissociated hydroxyl groups and
partially uncoordinated Ti(IV)
ions [23] The charge depends upon the pH value of the suspension and
may be estimated by the evaluation of the ζ potential ie the potential across the double layer of ions
around the particles
The variation of the ζ potential of the samples as a function of pH in deionised water is reported in
Figure 1A Under these experimental conditions the point of zero charge (PZC) of TR (55) resulted to
be different from the PZC of the other two samples (67 and 69 respectively) suggesting a higher
acidity of the hydroxyl groups in rutile The other two samples exhibit a similar behavior according
with the prevalence of the anatase phase in the TAR sample
The ζ potential was also measured by suspending the powders in phosphate buffer (PBS) (Figure
1B) as the interaction with proteins has been measured in PBS to simulate physiological conditions
Nanosafe 2012 International Conferences on Safe Production and Use of Nanomaterials IOP PublishingJournal of Physics Conference Series 429 (2013) 012014 doi1010881742-65964291012014
4
(see below) A decrease in ζ potential values was observed in the whole pH range as a consequence of
the high ionic strength of the suspension Furthermore a dramatic shift of the PZC was observed for
all samples This effect may be due to a strong adsorption of phosphate ions at the surface
Interestingly the ζ potential at physiological pH appears nearly the same for the three samples
suggesting that in physiological conditions the differences observed in water among rutile and
anatase disappear thus the electrostatic interactions with proteins are expected to be similar for the two
phases
2 4 6 8 10 12
-60
-40
-20
0
20
40
60
A
pH
Po
ten
tia
l m
V
0 2 4 6 8 10 12
-60
-40
-20
0
20
40
60
B
pH po
ten
tia
l m
V
Figure 1 Variation of Potential of TiO2 samples measured in different dispersant The curves are
measured after the suspension of samples nanoparticles TR (dot) TAR (solid) TA (dash) in water (A) and PBS (B)
by sonication The acquisition of these curve is repeated for three times
32 Evaluation of the amount of protein interacting with nanoparticles
To investigate the affinity of the proteins for the TiO2 buffered solutions of BSA or BPF at
increasing concentration (500-10000 mgL) were incubated for 1 hour with the powders The amount
of protein interacting with the particles was calculated by the decrease of their concentration in the
supernatant after incubation The results are reported in Figure 2 and are expressed as amount of
protein adsorbed on TiO2 per unit surface area vs the final concentration of the protein in solution after
adsorption The amount of adsorbed protein corresponding to a theoretical monolayer on an ideal flat
surface considering a side-on adsorption is also reported in the graph (dotted line)
0 2000 4000 6000 8000 10000
0
10
20
30
40
A
nm
ol a
ds m
2
BPFfree
mgL
0 2000 4000 6000 8000 10000
0
10
20
30
40
B
BSA free
mgL
nm
ol a
ds m
sup2
Figure 2 Comparisons of protein adsorption curves The quantity of adsorbed fibrinogen (A) and albumin
(B) on titania samples TR squares) TAR ( triangles) TA (circles) is show The theoretical monolayer (θ) is not
reached for all titania samples after the adsorption of BSA while in the case of BPF the adsorption on TAR and
TR largely exceeds of the θ
Nanosafe 2012 International Conferences on Safe Production and Use of Nanomaterials IOP PublishingJournal of Physics Conference Series 429 (2013) 012014 doi1010881742-65964291012014
5
BSA (Figure 2B) interacted with the three samples in a similar manner since the three adsorption
curves appear close to each other The amount of interacting protein increased with the protein
concentration and reached a plateau at values lower than the theoretical monolayer A different
behavior was observed for BPF (Figure 2A) A rapid initial growth of the amount of protein adsorbed
with a very low residual protein concentration was observed The amount of protein adsorbed
increased and overcame at high coverage the theoretical monolayer
The amount of fibrinogen adsorbed on TR nanoparticles results to be similar to TAR sample while a
different behavior was observed for the anatase which accommodates a lower amount of proteins on
its surface
The data obtained suggest that fibrinogen has an affinity for TiO2 surface higher than albumin
Differences in the properties of the two proteins may account for such differentiation Both proteins
have a negative net charge at pH 74 and therefore the adsorption of the proteins occurs against the
repulsive electrostatic forces with the negative TiO2 surface However BSA exposes at the solvent in
the native form a largely uniform negative charge Repulsive forces act both against the adsorption
onto the surface but also laterally among proteins which are therefore unable to adsorb close to each
other to form a compact monolayer Conversely fibrinogen has a negatively charge domain in the
central region but the αC regions exhibit a positive net charge due to the presence of arginine and
lysine [13] The presence of these positive domains possibly allows orientating the protein thus
facilitating the adsorption onto negative surfaces and the formation of multi-layers
The anatase sample exhibits a lower capacity to absorb proteins This effect was much more
evident for BPF than for BSA Since in PBS the ζ potential of the three samples was similar such
differences are not expected to be due to a different contribution of the electrostatic forces On the
other hand the anatase sample exhibits primary particles smaller than the other two samples which are
organized in large aggregates The presence of pores among particles accessible to nitrogen but not to
fibrinogen may be one reason of the lower amount of protein interacting with this sample On the
other hand the lower primary particle size and consequently the higher curvature of each single
primary particle makes rougher the surface of the aggregates possibly lowering the number of possible
points of interaction with fibrinogen In the case of BSA this effect is expected to be less important
being BSA a much smaller molecule
33 Evaluation of the extent of coverage of the NPs surface
To get insight on the extent of the coverage of the surface the shift of ζ potential following protein
adsorption was also evaluated
One of the most relevant effects of the formation of the protein corona on NPs is the consequent
masking of the NP surface Being charged entities proteins are expected to modify the ζ potential of
the NPs We therefore measured the ζ potential shift of the titania powders TAR previously incubated
with the fibrinogen and albumin at different concentrations (Figure 3A and B respectively) Similar
results were obtained with the other two powders (data not shown)
The adsorption of BPF led to a shift of the PZC toward the isoelectric point of the proteins
suggesting that the coverage of the surface increased proportionally with protein concentration (Figure
3A) in agreement with the adsorption curve However the isoelectric point (pI) of the protein was not
reached even at high coverage suggesting that the particle surface was still exposed at the solvent This
was expected for BSA since the amount absorbed was not enough to fully cover the surface However
a PZC lower than pI was also observed for BPF A preferential orientation of the protein at the surface
with the positive side toward the surface may account for this result
A similar masking effect is expected to occur with the protein corona is formed by both proteins
reversibly or irreversibly interacting with the surface Therefore the data obtained did not give any
information on the reversibility of the process This information is important to predict the behavior of
proteins in competitive conditions
Nanosafe 2012 International Conferences on Safe Production and Use of Nanomaterials IOP PublishingJournal of Physics Conference Series 429 (2013) 012014 doi1010881742-65964291012014
6
0 2 4 6 8 10 12
-60
-40
-20
0
20
40
60
A
pI BPF
pH
Po
ten
tia
l m
V
0 2 4 6 8 10 12
-60
-40
-20
0
20
40
60
B
pI BSA
pH
po
ten
tia
l m
V
Figure 3 Variation of potential after protein adsorption Increasing concentration of fibrinogen (A) and
albumin (B) is associated with the shift of the nanoparticles point of zero charge(PZC) toward the protein
isoelectric point (pI) The curves are relative to TAR sample before (stars) and after incubation with different
protein concentration 10 (triangles) 5 (circles) 25 (diamonds) and 05 (squares) gL
34 Evaluation of reversibility
The reversibly-bound fraction of the protein corona is expected to be removed by applying a
negative protein concentration gradient ie re-suspending the protein ndashNP conjugates in a fresh
protein-free buffer If the protein corona is totally reversible the ζ potential of the NPs is expected to
shift back to the values observed for the free NP surface On the contrary if a totally irreversible
corona is formed upon NP surface subsequent washing will not modify the conjugate ζ potential In
Figure 4 the ζ potential curves measured after suspending TAR previously incubated with the proteins
in PBS are reported BPF appeared to interact irreversibly with TiO2 nanoparticles since no shift of
the ζ potential curves was observed (Figure 4A) Similar results were obtained with the other two
powders (data not shown) Also for albumin the interaction appeared almost irreversible (Figure 4B)
0 2 4 6 8 10 12
-60
-40
-20
0
20
40
60
A
pH
pI BPF
Po
ten
tia
l m
V
0 2 4 6 8 10 12
-60
-40
-20
0
20
40
60
B
pH
pI BSA
po
ten
tia
l m
V
Figure 4 Variation of potential after washing The curves are acquired for the sample before the
adsorption (stars) after the incubation with a high (10000 mgL) protein concentration (circles) one cycle
(squares) and three cycles of washing (triangles) This experiment has been carried out also for the other
nanoparticles and for two other protein concentrations (5000 and 500 mgL) and in all cases the adsorption
resulted to be irreversible
Nanosafe 2012 International Conferences on Safe Production and Use of Nanomaterials IOP PublishingJournal of Physics Conference Series 429 (2013) 012014 doi1010881742-65964291012014
7
35 Evaluation of surface-driven protein conformational changes with Raman Spectroscopy
Albumin and fibrinogen are both soft proteins and their adsorption on nanoparticles is irreversible
It is therefore to be expected that BSA and BPF interacting with TiO2 NPs undergo some kind of
conformational change The evaluation of such conformational changes may be studied with micro-
Raman spectroscopy Raman spectroscopy can be used to evaluated the protein secondary structure
by analyzing the vibrational frequencies of the bands associated with the backbone amide bonds that
are dependent upon the secondary arrangement of the polypeptide chain [24]
The amide I band corresponds to the sum of coupled modes of the polypeptide backbone A major
contribution to the amide I modes comes from the C-O stretching of the peptide carbonyl groups [25]
It is possible to evaluate the surface-driven conformational modifications by comparing the Raman
spectral pattern of the native folded protein with that of the same protein adsorbed on the titania
surface Note that the Raman modes of both anatase and rutile TiO2 are located in the region between
200 and 800 cm-1
and therefore no interference by these picks is expected The spectra of BSA are
acquired in the native form or adsorbed on the titania nanoparticles the spectra relative to the
interaction with the TAR sample are reported in Figure 5 The amide I Raman bands for the intensity
maximum of each Raman spectrum was normalized to 1 The amide I band of native BSA (Figure 5
black spectrum 1657 cm-1
) is slightly shifted toward higher wavenumbers (1660 cm-1
) when BSA is
adsorbed on TAR and the amide III band (1278 cm-1
) is slightly shifted toward lower wavenumbers
(1267 cm-1
) after the adsorption These shifts are typical of a protein conformational change it is
possible that these modifications in protein structure are due to oxidative damage linked with the
reactivity (photocatalitic activity) of titania samples [26] The three peaks of aromatic residues (1557
1588 and 1618 cm-1
) are assigned according to previous data [24 25]
Figure 5 Evaluation of protein conformational change after adsorption on TAR Raman spectra of BSA
native (solid spectra) and adsorbed on nanoparticles (dot spectra)These data are the average of ten acquisition
The arrows point the peak of amide I (1657 cm-1
) and amide III (1279 cm-1
) bands The shift of these bands is
typical of a conformational change Spectra intensities were normalized to amide I peak
4 Conclusions
In this study the interaction of albumin and fibrinogen with three samples of TiO2 having distinct
crystal phases and different primary particle size has been evaluated
We found that both albumin and fibrinogen interact irreversibly with the negative surface of TiO2
NPs The interaction with albumin appears to be driven by conformational changes of the protein at
the surface This was expected since BSA has a low resistance to deformation In the case of BPF both
conformational changes and electrostatic forces between TiO2 surface and the positive domains of the
proteins my account for such interaction Fibrinogen interacts in large quantity with TAR and TR
while a lower amount was observed in the case of the anatase sample This effect was likely due to a
lower availability of the surface to the large fibrinogen molecule and to the higher roughness of this
Nanosafe 2012 International Conferences on Safe Production and Use of Nanomaterials IOP PublishingJournal of Physics Conference Series 429 (2013) 012014 doi1010881742-65964291012014
8
sample as a consequence of the lower dimension of the primary particles while the differences in
surface properties related to the crystal phase seemed to play a minor role A smaller effect was
observed for BSA because this protein may closely contact the particles surface while BPF is
expected to ldquoseerdquo the TiO2 powders as rough aggregates (Figure 6)
Figure 6 Proteins and titania nanoparticles Schematic representation
It is well known that small proteins are faster to diffuse and then arrive at the surface before large
proteins The early formed protein corona is however expected to evolve in fact proteins having
higher affinity for surfaces like fibrinogen may replace smaller proteins through a mechanism known
as Vromanrsquos effect [17 27 20] The present data suggest that the surface curvature of particles may
modulate the amount of fibrinogen interacting with the nanoparticles and possibly its affinity for the
surface Since the interaction of fibrinogen with NPs has been shown to trigger inflammatory
responses [16] the lower affinity of fibrinogen for the sample having smaller primary particles may
correspond to a possible higher biocompatibility of small TiO2 nanoparticles
References
[1] Oberdoumlrster G et al 2009 Nanoparticles and the Brain Cause for Concern Journal of
nanoscience and nanotechnology 9 pp4996-5007
[2] Savolainen K et al 2010 Risk assessment of engineered nanomaterials and nanotechnologies
Toxicology 269 pp 92-104
[3] Schrurs F and Lison D 2012 Focusing the research effort Nature nanotechnology 7 pp 546-
548
[4] Pietroiusti A 2012 Health implications of engineered nanomaterials Nanoscale 4 pp1231-1247
[5] Lin W et al 2006 In vitro toxicity of silica nanoparticles in human lung cancer cells
Toxicology and applied pharmacology 217 pp 252-259
[6] Fubini B et al 2010 Physico-chemical features of engineered nanoparticles relevant to their
toxicity Nanotoxicology 4 pp 347-363
[7] Schulze C et al 2011 Interaction of metal oxide nanoparticles with lung surfactant protein A
European Journal of pharmaceutics and biopharmaceutics 77 pp 376-383
[8] Lundqvist M et al 2008 Nanoparticle size and surface properties determine the protein corona
with possible implications for biological impacts Pnas 105 pp 14265-14270
[9] Walczyk D et al 2010 What the Cell Sees in Bionanoscience Journal of the American
Chemical Society 132 pp 5761-5768
Nanosafe 2012 International Conferences on Safe Production and Use of Nanomaterials IOP PublishingJournal of Physics Conference Series 429 (2013) 012014 doi1010881742-65964291012014
9
[10] Lynch I et al 2007 The nanoparticle - protein complex as a biological entity a complex fluids
and surface science challenge for the 21st century Advances in Colloid and Interface Science
134-35 pp 167-174
[11] Kamali P P and Simberg D 2011 Interaction of nanoparticles with plasma proteins
implication on clearance and toxicity of drug delivery systems Expert opinion drug delivery
8 pp 343-357
[12] Sugio S et al 1999 Crystal structure of human serum albumin at 25 Aring resolution Protein
engineering 12 pp 439-446
[13] Jung SY et al 2003 The Vroman effecta molecular level description of fibrinogen
displacement Journal american chemical society 125 pp 12782-12786
[14] Jackson S P 2007 The growing complexity of platelet aggregation Blood 109 pp 5087-5094
[15] Thevenot P et al 2008 Surface chemistry influences implant biocompatibility Current Topics
in Medicinal Chemistry 8 pp 270-280
[16] Deng ZJ et al 2011 Nanoparticle-induced unfolding of fibrinogen promotes Mac-1 receptor
activation and inflammation Nature nanotechnology 6 pp 39-44
[17] Nel A et al 2009 Understanding biophysicochemical interactions at the nano-biointerface
Nature Materials 8 pp 543-557
[18] Nel A et al 2006 Toxic potential of materials at the nanolevel Science 311 pp 622-627
[19] Rivera Gil P et al 2010 Correlating physico-chemical with toxicological properties of
nanoparticles the present and the future Acs Nano 4 pp 5527-5531
[20] Fenoglio I et al 2011 Multiple aspects of the interaction of biomacromolecules with inorganic
surfaces Advanced Drug Delivery Reviews 63 pp 1186-1209
[21] Liu H et al 2007 Nanomedicine for implants A review of studies and necessary experimental
tools Biomaterials 28 pp 354-369
[22] Bolis V et al 2012 Hydrophilichydrophobic features of TiO2 nanoparticles as a function of
crystal phase surface area and coating in relation to their potential toxicity in peripheral
nervous system Journal of colloid and interface science 369 pp 28-39
[23] Suttiponparnit K et al 2011 Role of surface area primary particle size and crystal phase on
titanium dioxide nanoparticles dispersion properties Nanoscale research letters 6
[24] Turci F et al 2010 An integrated approach to the study of the interaction between proteins and
nanoparticles Langmuir 26 pp 8336-8346
[25] Strehle M A et al 2004 a raman spectroscopy study of the adsorption of fibronectin and
fibrinogen on titanium dioxide nanoparticles Phys Chem Chem Phys 6 pp 5232-5236
[26] Fenoglio et al 2009 Non-Uv-induced radical reactions at the surface of TiO2 nanoparticles that
may trigger toxic responses chem Eur J 15 pp 4614-4621
[27] Vroman L 1962 Effect of absorbed proteins on the wettability of hydrophilic and hydrophobic
solids Nature 196 pp 476-7
Nanosafe 2012 International Conferences on Safe Production and Use of Nanomaterials IOP PublishingJournal of Physics Conference Series 429 (2013) 012014 doi1010881742-65964291012014
10

0 2 4 6 8 10 12
-60
-40
-20
0
20
40
60
A
pI BPF
pH
Po
ten
tia
l m
V
0 2 4 6 8 10 12
-60
-40
-20
0
20
40
60
B
pI BSA
pH
po
ten
tia
l m
V
Figure 3 Variation of potential after protein adsorption Increasing concentration of fibrinogen (A) and
albumin (B) is associated with the shift of the nanoparticles point of zero charge(PZC) toward the protein
isoelectric point (pI) The curves are relative to TAR sample before (stars) and after incubation with different
protein concentration 10 (triangles) 5 (circles) 25 (diamonds) and 05 (squares) gL
34 Evaluation of reversibility
The reversibly-bound fraction of the protein corona is expected to be removed by applying a
negative protein concentration gradient ie re-suspending the protein ndashNP conjugates in a fresh
protein-free buffer If the protein corona is totally reversible the ζ potential of the NPs is expected to
shift back to the values observed for the free NP surface On the contrary if a totally irreversible
corona is formed upon NP surface subsequent washing will not modify the conjugate ζ potential In
Figure 4 the ζ potential curves measured after suspending TAR previously incubated with the proteins
in PBS are reported BPF appeared to interact irreversibly with TiO2 nanoparticles since no shift of
the ζ potential curves was observed (Figure 4A) Similar results were obtained with the other two
powders (data not shown) Also for albumin the interaction appeared almost irreversible (Figure 4B)
0 2 4 6 8 10 12
-60
-40
-20
0
20
40
60
A
pH
pI BPF
Po
ten
tia
l m
V
0 2 4 6 8 10 12
-60
-40
-20
0
20
40
60
B
pH
pI BSA
po
ten
tia
l m
V
Figure 4 Variation of potential after washing The curves are acquired for the sample before the
adsorption (stars) after the incubation with a high (10000 mgL) protein concentration (circles) one cycle
(squares) and three cycles of washing (triangles) This experiment has been carried out also for the other
nanoparticles and for two other protein concentrations (5000 and 500 mgL) and in all cases the adsorption
resulted to be irreversible
Nanosafe 2012 International Conferences on Safe Production and Use of Nanomaterials IOP PublishingJournal of Physics Conference Series 429 (2013) 012014 doi1010881742-65964291012014
7
35 Evaluation of surface-driven protein conformational changes with Raman Spectroscopy
Albumin and fibrinogen are both soft proteins and their adsorption on nanoparticles is irreversible
It is therefore to be expected that BSA and BPF interacting with TiO2 NPs undergo some kind of
conformational change The evaluation of such conformational changes may be studied with micro-
Raman spectroscopy Raman spectroscopy can be used to evaluated the protein secondary structure
by analyzing the vibrational frequencies of the bands associated with the backbone amide bonds that
are dependent upon the secondary arrangement of the polypeptide chain [24]
The amide I band corresponds to the sum of coupled modes of the polypeptide backbone A major
contribution to the amide I modes comes from the C-O stretching of the peptide carbonyl groups [25]
It is possible to evaluate the surface-driven conformational modifications by comparing the Raman
spectral pattern of the native folded protein with that of the same protein adsorbed on the titania
surface Note that the Raman modes of both anatase and rutile TiO2 are located in the region between
200 and 800 cm-1
and therefore no interference by these picks is expected The spectra of BSA are
acquired in the native form or adsorbed on the titania nanoparticles the spectra relative to the
interaction with the TAR sample are reported in Figure 5 The amide I Raman bands for the intensity
maximum of each Raman spectrum was normalized to 1 The amide I band of native BSA (Figure 5
black spectrum 1657 cm-1
) is slightly shifted toward higher wavenumbers (1660 cm-1
) when BSA is
adsorbed on TAR and the amide III band (1278 cm-1
) is slightly shifted toward lower wavenumbers
(1267 cm-1
) after the adsorption These shifts are typical of a protein conformational change it is
possible that these modifications in protein structure are due to oxidative damage linked with the
reactivity (photocatalitic activity) of titania samples [26] The three peaks of aromatic residues (1557
1588 and 1618 cm-1
) are assigned according to previous data [24 25]
Figure 5 Evaluation of protein conformational change after adsorption on TAR Raman spectra of BSA
native (solid spectra) and adsorbed on nanoparticles (dot spectra)These data are the average of ten acquisition
The arrows point the peak of amide I (1657 cm-1
) and amide III (1279 cm-1
) bands The shift of these bands is
typical of a conformational change Spectra intensities were normalized to amide I peak
4 Conclusions
In this study the interaction of albumin and fibrinogen with three samples of TiO2 having distinct
crystal phases and different primary particle size has been evaluated
We found that both albumin and fibrinogen interact irreversibly with the negative surface of TiO2
NPs The interaction with albumin appears to be driven by conformational changes of the protein at
the surface This was expected since BSA has a low resistance to deformation In the case of BPF both
conformational changes and electrostatic forces between TiO2 surface and the positive domains of the
proteins my account for such interaction Fibrinogen interacts in large quantity with TAR and TR
while a lower amount was observed in the case of the anatase sample This effect was likely due to a
lower availability of the surface to the large fibrinogen molecule and to the higher roughness of this
Nanosafe 2012 International Conferences on Safe Production and Use of Nanomaterials IOP PublishingJournal of Physics Conference Series 429 (2013) 012014 doi1010881742-65964291012014
8
sample as a consequence of the lower dimension of the primary particles while the differences in
surface properties related to the crystal phase seemed to play a minor role A smaller effect was
observed for BSA because this protein may closely contact the particles surface while BPF is
expected to ldquoseerdquo the TiO2 powders as rough aggregates (Figure 6)
Figure 6 Proteins and titania nanoparticles Schematic representation
It is well known that small proteins are faster to diffuse and then arrive at the surface before large
proteins The early formed protein corona is however expected to evolve in fact proteins having
higher affinity for surfaces like fibrinogen may replace smaller proteins through a mechanism known
as Vromanrsquos effect [17 27 20] The present data suggest that the surface curvature of particles may
modulate the amount of fibrinogen interacting with the nanoparticles and possibly its affinity for the
surface Since the interaction of fibrinogen with NPs has been shown to trigger inflammatory
responses [16] the lower affinity of fibrinogen for the sample having smaller primary particles may
correspond to a possible higher biocompatibility of small TiO2 nanoparticles
References
[1] Oberdoumlrster G et al 2009 Nanoparticles and the Brain Cause for Concern Journal of
nanoscience and nanotechnology 9 pp4996-5007
[2] Savolainen K et al 2010 Risk assessment of engineered nanomaterials and nanotechnologies
Toxicology 269 pp 92-104
[3] Schrurs F and Lison D 2012 Focusing the research effort Nature nanotechnology 7 pp 546-
548
[4] Pietroiusti A 2012 Health implications of engineered nanomaterials Nanoscale 4 pp1231-1247
[5] Lin W et al 2006 In vitro toxicity of silica nanoparticles in human lung cancer cells
Toxicology and applied pharmacology 217 pp 252-259
[6] Fubini B et al 2010 Physico-chemical features of engineered nanoparticles relevant to their
toxicity Nanotoxicology 4 pp 347-363
[7] Schulze C et al 2011 Interaction of metal oxide nanoparticles with lung surfactant protein A
European Journal of pharmaceutics and biopharmaceutics 77 pp 376-383
[8] Lundqvist M et al 2008 Nanoparticle size and surface properties determine the protein corona
with possible implications for biological impacts Pnas 105 pp 14265-14270
[9] Walczyk D et al 2010 What the Cell Sees in Bionanoscience Journal of the American
Chemical Society 132 pp 5761-5768
Nanosafe 2012 International Conferences on Safe Production and Use of Nanomaterials IOP PublishingJournal of Physics Conference Series 429 (2013) 012014 doi1010881742-65964291012014
9
[10] Lynch I et al 2007 The nanoparticle - protein complex as a biological entity a complex fluids
and surface science challenge for the 21st century Advances in Colloid and Interface Science
134-35 pp 167-174
[11] Kamali P P and Simberg D 2011 Interaction of nanoparticles with plasma proteins
implication on clearance and toxicity of drug delivery systems Expert opinion drug delivery
8 pp 343-357
[12] Sugio S et al 1999 Crystal structure of human serum albumin at 25 Aring resolution Protein
engineering 12 pp 439-446
[13] Jung SY et al 2003 The Vroman effecta molecular level description of fibrinogen
displacement Journal american chemical society 125 pp 12782-12786
[14] Jackson S P 2007 The growing complexity of platelet aggregation Blood 109 pp 5087-5094
[15] Thevenot P et al 2008 Surface chemistry influences implant biocompatibility Current Topics
in Medicinal Chemistry 8 pp 270-280
[16] Deng ZJ et al 2011 Nanoparticle-induced unfolding of fibrinogen promotes Mac-1 receptor
activation and inflammation Nature nanotechnology 6 pp 39-44
[17] Nel A et al 2009 Understanding biophysicochemical interactions at the nano-biointerface
Nature Materials 8 pp 543-557
[18] Nel A et al 2006 Toxic potential of materials at the nanolevel Science 311 pp 622-627
[19] Rivera Gil P et al 2010 Correlating physico-chemical with toxicological properties of
nanoparticles the present and the future Acs Nano 4 pp 5527-5531
[20] Fenoglio I et al 2011 Multiple aspects of the interaction of biomacromolecules with inorganic
surfaces Advanced Drug Delivery Reviews 63 pp 1186-1209
[21] Liu H et al 2007 Nanomedicine for implants A review of studies and necessary experimental
tools Biomaterials 28 pp 354-369
[22] Bolis V et al 2012 Hydrophilichydrophobic features of TiO2 nanoparticles as a function of
crystal phase surface area and coating in relation to their potential toxicity in peripheral
nervous system Journal of colloid and interface science 369 pp 28-39
[23] Suttiponparnit K et al 2011 Role of surface area primary particle size and crystal phase on
titanium dioxide nanoparticles dispersion properties Nanoscale research letters 6
[24] Turci F et al 2010 An integrated approach to the study of the interaction between proteins and
nanoparticles Langmuir 26 pp 8336-8346
[25] Strehle M A et al 2004 a raman spectroscopy study of the adsorption of fibronectin and
fibrinogen on titanium dioxide nanoparticles Phys Chem Chem Phys 6 pp 5232-5236
[26] Fenoglio et al 2009 Non-Uv-induced radical reactions at the surface of TiO2 nanoparticles that
may trigger toxic responses chem Eur J 15 pp 4614-4621
[27] Vroman L 1962 Effect of absorbed proteins on the wettability of hydrophilic and hydrophobic
solids Nature 196 pp 476-7
Nanosafe 2012 International Conferences on Safe Production and Use of Nanomaterials IOP PublishingJournal of Physics Conference Series 429 (2013) 012014 doi1010881742-65964291012014
10
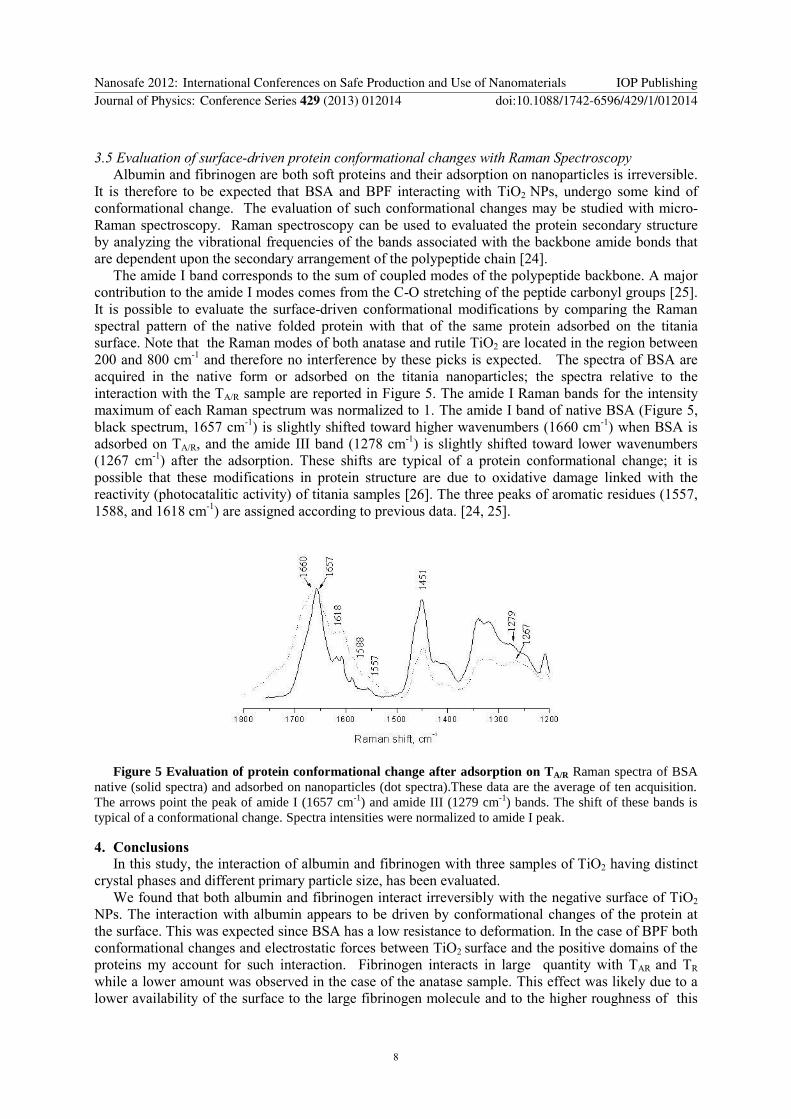