Embed Size (px)
Citation preview

134 The Open Construction and Building Technology Journal, 2010, 4, 134-145
1874-8368/10 2010 Bentham Open
Open Access
Interaction Between Wind and Buoyancy Effects in Natural Ventilation of Buildings Guohui Gan*
Department of Architecture and Built Environment, University of Nottingham, University Park, Nottingham NG7 2RD, UK
Abstract: Design of natural ventilation systems for many types of building is based on buoyancy force. However, exter-nal wind flow can have significant effects on buoyancy-driven natural ventilation. Simulation has been carried out for combined wind- and buoyancy-driven natural ventilation of a building with two wings of offices and a central atrium. Re-sults show that wind would adversely affect the air flow patterns in the building designed with buoyancy-driven natural ventilation. Wind can simultaneously assist and oppose buoyancy in the windward and leeward wings, respectively, whereas buoyancy can oppose wind-driven flow in both wings. To achieve or maintain a desired environmental quality in the natu-rally ventilated building would require intelligent control of ventilation openings and/or careful consideration of wind-driven ventilation at the design stage. The importance of measurements of variables such as pressure, velocity and tempera-ture for real size buildings is also highlighted.
Keywords: CFD, natural ventilation, ventilation rate, buoyancy, wind effect, atrium.
1. INTRODUCTION
Natural ventilation is one of the major design features of recent as well as traditional sustainable buildings. Thermal buoyancy is the main design consideration in terms of driv-ing force for natural ventilation of many types of building such as those incorporated with atria due to the unpredictable nature of wind. However, average wind speeds often produce stronger effects on natural ventilation than does buoyancy. The external wind can assist or oppose the internal buoy-ancy-driven flow depending on the building configuration and wind velocity. The internal air flow and resulting tem-perature/pollutant distribution in spaces with buoyancy-driven natural ventilation would therefore be complicated by the external wind.
The effects of wind and buoyancy on building ventilation can be determined by means of physical measurements and mathematical or numerical modelling. Afonso and Oliveria [1] measured natural ventilation through a real size solar chimney integrated into a test room and compared its per-formance with a conventional exhaust chimney. It was found that the ventilation rate through the solar chimney was be-tween 10% and 22% higher than that through the conven-tional exhaust chimney and that a simplified model neglect-ing the fluctuating wind effect underestimated the wind-assisted buoyancy-driven ventilation rate. Yang, et al. [2] tested wind-driven natural ventilation of a full-scale cube building under various weather conditions and results were used to validate a numerical model for predicting air flow and ventilation rate. Measurements of ventilation rates using
*Address correspondence to this author at the Department of Architecture and Built Environment, University of Nottingham, University Park, Not-tingham NG7 2RD, UK; Tel: +44(0)115 9514876; Fax: +44 115 9513159; Email: [email protected]
full scale models provide realistic data for building design and performance assessment but are costly or impractical, e.g., for high rise buildings. Therefore, reduced scale models are commonly used to study the fluid flow in and around buildings and the opposing and assisting effects of wind on buoyancy with the aid of a wind tunnel [3, 4] or water tunnel [5-9]. For air flow involving buoyancy, the accuracy of measurement with a reduced scale model in a wind tunnel would be compromised because it is not easy to satisfy the geometric and dynamic similarity conditions. Using a salt water tunnel can overcome the problem with scaling buoy-ancy flow. However, difficulties may arise to create a correct wind velocity profile using a water tunnel particularly with an inverted model for the flow both inside and outside of a building. Consequently, a uniform water flow or pressure at the upstream is often presumed in measurements [5, 8]. Re-sults from such measurements would be useful for validation of an analytical or mathematical model based on assump-tions of unidirectional/uniform or symmetrical inflow and outflow but would deviate from real wind flow through a building where the effect of vertical wind profile is signifi-cant such as wind-driven ventilation through a tall building with openings at different floors or where the resulting verti-cal velocity distribution is highly asymmetric across an inlet or outlet opening. The effect of non-uniform wind profile is illustrated with a simple example below (Fig. 1) for wind-driven ventilation of a 3 m high x 3 m deep and very wide (two-dimensional) building with two 0.5 m high ventilation openings – one in the left/windward wall 2 m above the floor and another in the right/leeward wall 1 m above the floor – using the same method as described in Section 2. A rough wind profile would be generated when a uniform wind flow at a far field approaches the building due to the friction with the ground (assumed to be smooth). Assuming a frictionless ground surface as one extreme example of ignoring the effect of wind profile, the predicted ventilation rate for the building

Wind- and Buoyancy-Driven Ventilation The Open Construction and Building Technology Journal, 2010, Volume 4 135
would be 16% less than that under the influence of the wind profile because more air available below the inlet opening would be deflected upwards by the front wall and so reduce forward flowing wind into the opening. For both scenarios, air flows asymmetrically up and forwards through the inlet opening and down and forwards through the outlet opening. As another extreme example, when the upstream wind flow pattern is so prescribed that air flows horizontally through the inlet opening and symmetrically across the opening, or the symmetrical inflow is prescribed without changing the far field wind profile, the predicted ventilation rate would be 57% higher than that with the natural wind profile. That is to say, models and measurements based on the assumption of uniform or symmetrical inflow could over estimate the wind-driven ventilation potential of such a building configuration by over 1/2. It follows that a water tunnel without provision of generating a proper atmospheric boundary layer profile is not suitable for accurate determination of the interaction be-tween wind- and buoyancy-driven natural ventilation of a building under real environmental conditions.
It may be worthwhile to mention multiple steady states or solutions for opposing wind- and buoyancy-driven natural ventilation. Multiple solutions have been derived for flow under idealised conditions such as unidirectional/uniform inflow and outflow and constant discharge coefficient of flow openings [10]. The phenomenon of multiple steady states has also been observed using the water tunnel method under similar ideal conditions [6]. However, the existence of multiple solutions would be more complex under real wind conditions. Etheridge [11] showed that wind turbulence would reduce the conditions for multiple solutions to occur and concluded that multiple solutions would not occur if the ratio of the mean to turbulent (standard deviation) pressure difference across two openings was less than 1.5. Besides, in general, for wind-driven natural ventilation of a real build-ing, neither the flow through a ventilation opening is unidi-rectional as shown above, nor is the discharge coefficient for a ventilation opening constant. For example, Heiselberg and Sandberg [12] demonstrated from laboratory measurements that the discharge coefficient for a window opening de-pended on the window type, opening area and geometrical relation between the window and facade, temperature and pressure differences across the opening and the control strat-egy. Karava, et al. [13] also found from a literature review that the discharge coefficient of openings for wind-driven cross ventilation varied considerably with opening area, po-rosity and configuration (shape and location in the façade) and wind velocity and considered it possibly invalid to sim-
plify the coefficient as a constant value. Obviously, if con-siderations are given to the multi-dimensional nature of in-flow and outflow and the variable discharge coefficient of ventilation openings as well as wind turbulence, it may not be possible to derive analytical solutions for multiple steady states or analytically determine the existence of the phe-nomenon.
Computer simulation of internal and external air flow based on numerical modelling has been carried out for de-signing natural ventilation systems and naturally ventilated buildings for many years. A major advantage of numerical modelling over physical measurement is that it allows simu-lation of flow by any mechanisms for full-scale buildings. In most simulation studies to date, modelling has been per-formed with either the buoyancy effect only [14-16] or the wind effect [2, 4]. Allocca, et al. [17] investigated single-sided natural ventilation of buildings under buoyancy alone and under combined wind and buoyancy effects using com-putational fluid dynamics (CFD) and the results were com-pared with analytical and empirical models. It was found that a large computational domain than the indoor space would be required for accurate simulation of buoyancy-driven ven-tilation. For combined wind- and buoyancy-driven ventila-tion, the CFD model for mean flow simulation would under-predict the ventilation rates, as it is known that transient wind turbulence plays an important role in driving air through single-sided ventilation openings. They also re-vealed that wind and buoyancy could assist or oppose one another in single-sided natural ventilation and recommended further investigation into interacting wind and buoyancy effects. Cook, et al. [18] carried out simulation of natural ventilation of an atrium building due to both wind and buoy-ancy effects but the effect of wind was represented using the surface pressure coefficient rather than natural wind flow around and through the building. The surface pressure coef-ficient is often used for wind-driven ventilation design. One problem with this simplified approach is that measured pres-sure data is only available for a limited number of building configurations and so a uniform pressure coefficient is gen-erally given to represent the pressure on an external surface of a wall or roof of a building [19] whereas the real pressure and surface pressure coefficient vary considerably even on a flat surface depending on its position and the wind velocity as well as surrounding structures. Another problem is that it fails to take account of the interaction between internal and external flow. For the same example building as shown in Fig. (1), when the windward opening was moved 1 m lower and the leeward opening moved 1 m higher so that the flow
Fig. (1). Wind-driven natural ventilation of a simple building.
3 m
0.5 m
0.5 m
Wind

136 The Open Construction and Building Technology Journal, 2010, Volume 4 Guohui Gan
outlet was at a higher position than the inlet, the predicted ventilation rate increased by 31% because air flow through the inlet opening became more symmetrical nearer the ground and the vertical direction of air flowing out of the building changed from downward to upward which was en-trained or assisted by the wind flowing over the roof. Such a large effect of opening position on the ventilation rate could not be revealed by means of an analytical solution based on the surface pressure coefficient or other methods including multiple solutions that disregard the dependence of flow through ventilation openings on the external flow field. Thus, using the surface pressure coefficient would not allow accurate determination of the effect of wind on buoyancy-driven flow particularly in a building with multiple ventila-tion openings in different positions of a surface. Alexander, et al. [20] from wind tunnel measurement and CFD predic-tion of wind-driven flow around an atrium building indicated significant variation in the surface pressure coefficient for any building surface. Costola, et al. [21] compared calcula-tions of air flow rate using local and surface-averaged pres-sure coefficients and results indicated large uncertainty in the calculated flow rate using the surface-averaged pressure co-efficient. Besides, the surface pressure coefficient deter-mined from an isolated building or structure such as chimney would not be suitable for applications where there might be interference of air flow between buildings or structures [22]. Good, et al. [23] found that the pressure coefficients ob-tained from wind tunnel measurement of a laboratory build-ing consisting of a number of rectangular models differed significantly from those for a cubic model. The difference was not only in magnitude but could also be in sign (positive or negative pressure coefficient), meaning that an air exhaust could be misrepresented as an intake and vice versa. In addi-tion, use of the pressure coefficient for calculating the venti-lation rate implies normal flow of air in and out of an open-ing. However, as shown above, the direction of wind-driven ventilation through an opening other than a narrow slot (for which the discharge coefficient varies with slot dimensions) is unlikely to be parallel with the flow path and this is an-other source of error in determining the ventilation rate using the pressure coefficient. van Hooff and Brocken [24] mod-elled wind flow through a naturally ventilated stadium in an urban environment using a coupled external and internal flow approach and considered this to be preferable to em-ploying the pressure coefficient as a boundary condition.
In order to achieve better design of naturally ventilated complex buildings, consideration should therefore be given to the wind effects from the external wind flow and the in-teraction between external and internal air flow. This work is concerned with simulation of combined wind- and buoy-ancy-driven flow through complex buildings and assessment of their interactive assisting and opposing effects using CFD. An atrium building is used as an example to demonstrate the capability of CFD for analysis of the interaction between wind and buoyancy effects on indoor air flow.
2. METHODOLOGY
Commercial CFD software FLUENT [25] was used for predicting steady state air flow and temperature distribution in a hypothetical linear atrium building with natural ventila-tion. The width of the building was large enough to allow simplification as two-dimensional flow. Fig. (2) shows the schematic diagram of the building. It consisted of two identi-cal wings of three-floor open plan offices 12 m deep and 3 m high separated by an atrium 8 m deep and 15.9 m high at the top of roof. There were two balconies of 3 m long in the atrium attached to the first and second floors on the left wing. The ceilings and external façade walls were 0.3 m thick and internal walls 0.1 m thick. There were operable windows in both the external façade and atrium wall for natural ventilation of offices and a vent opening at the atrium top. The bottom edges of the windows in the external and atrium walls were, respectively, 1 m and 2 m from the floor. The maximum size of window openings was 0.5 m high and the vent opening 2 m wide. It was assumed that heat gains in the building were equivalent to 40 W/m2 on the floors of offices and atrium. These heat gains were taken as a uniform heat source on the floors. Conduction heat transfer and infil-tration were negligible compared with the main driving forces for heat and air flow, i.e. convection heat transfer and purposely provided natural ventilation, respectively. The ambient temperature was assumed at 20oC.
For simulation of flow involving the wind effect, an at-mospheric boundary layer profile can be used to specify the inflow velocity; typically it is represented by V = Vm k za … (1) where V is the wind speed at the height of a reference point z (e.g. roof top), Vm is the wind speed measured at a weather station at 10 m high from the ground, a and k are constants
Fig. (2). Schematic diagram of the atrium building.
12 8
0.5 0.5
Dimension: m2
3
15.9
28.81 2
12
L1
L2
L3
R1
R2
R3
Wind- and Buoyancy-Driven Ventilation The Open Construction and Building Technology Journal, 2010, Volume 4 137
depending on the site terrain, e.g. for an urban terrain, k = 0.35 and a = 0.25 [19].
However, because the main concern of this work is the relative effect of wind on buoyancy-driven flow inside a building rather than the required magnitude of ventilation rate for a given building, a uniform wind speed was used to specify the inflow velocity at a large distance away from the building in consideration so that certain velocity profile would be established naturally when the wind approaches the building. A large extended computational domain was there-fore used for accurate simulation of both wind- and buoy-ancy-driven natural ventilation. The distances from the building to the windward, leeward and top sides of the do-main boundary were over five, ten and five times the build-ing height, respectively. The domain was divided into an unstructured grid and the size of the grid with refinement in and around the building was about 553,000 cells. Further refinement of the mesh to over one million cells showed lit-tle variation in the predicted flow patterns and ventilation rates; the maximum difference in the predicted ventilation rate using the two mesh sizes was less than 1% for any of the offices and below 0.3% for the whole building.
Wind-driven flow would generally be turbulent but buoyancy-driven ventilation of a building could involve both laminar and turbulent flow. Different methods can be used to predict the turbulence from the use of a turbulence model to direct numerical simulation. Besides, wind flow is transient and advanced CFD models such as large eddy simulation (LES) could be used to predict unsteady wind-driven ventila-tion of a building [4]. However, it would be time consuming to use an LES model in combination with a large computa-tional domain and a fine mesh required for simulation of unsteady flow due to both wind and buoyancy effects. There-fore, the RNG k-ε turbulence model [26] was used for simu-lation of steady-state air flow. The turbulence model was validated for buoyancy-driven flow in open cavities for natu-ral ventilation [27].
3. CALCULATION OF VENTILATION RATE
From flow simulation, the ventilation rate through an in-let or outlet opening can be obtained from the size of the opening and the mean velocity normal to the opening and this is defined as the predicted ventilation rate. The ventila-tion rate can also be calculated from the predicted pressure difference across the opening using the following equation:
Q =Cd
A2!P
" … (2)
where Q is the ventilation rate (m3/s), Cd is the discharge coefficient, A is the opening area (m2), ΔP is the pressure difference across the opening (Pa) and ρ is the air density (kg/m3).
The discharge coefficient is related to the flow resistance coefficient (ζ) as follows,
Cd= 1
! … (3)
The discharge coefficient for a sharp-edged thin orifice plate is about 0.61. For a thick orifice plate or for a ventila-tion opening whose flow path length cannot be neglected in
comparison with the opening size, the flow resistance coeffi-cient and hence the discharge coefficient are influenced by the thickness of the plate or wall. For a 0.5 m high opening in a 0.3 m thick facade wall, the ratio of equivalent plate thickness to orifice diameter is 0.6. The flow resistance coef-ficient for such a thick opening would decrease by about 25% [28] and so the discharge coefficient would increase by 11% according to Equation (3), i.e., Cd = 0.68.
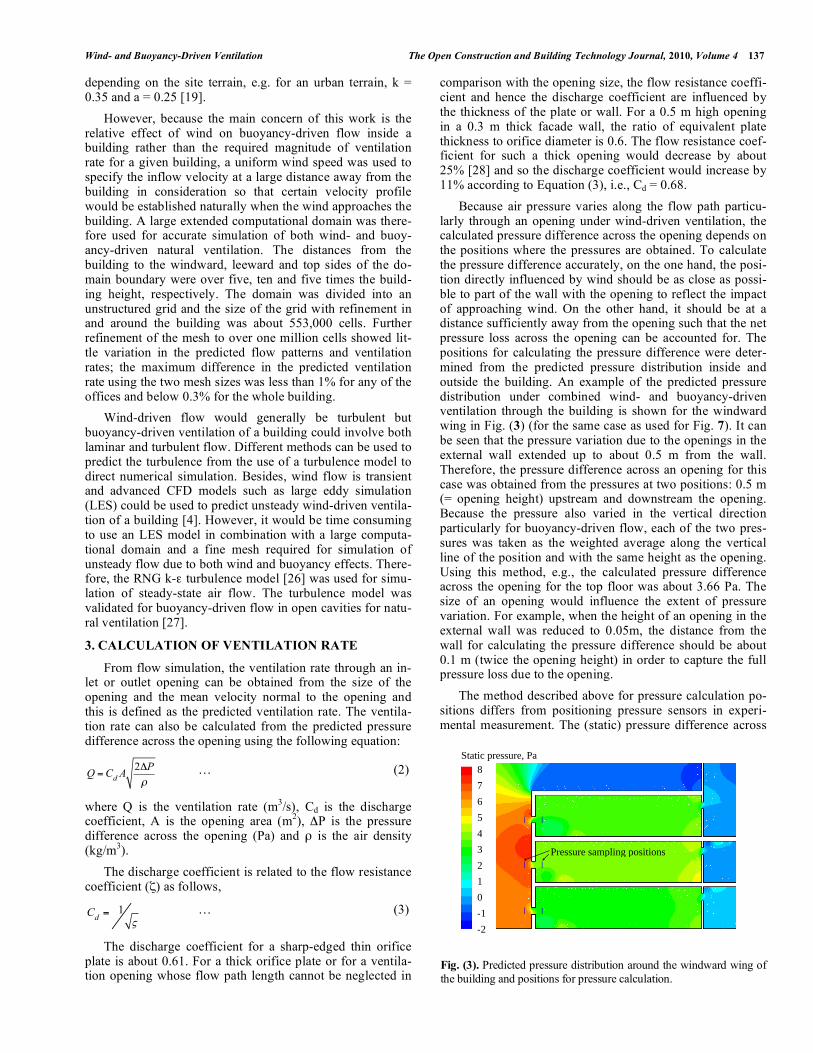
Because air pressure varies along the flow path particu-larly through an opening under wind-driven ventilation, the calculated pressure difference across the opening depends on the positions where the pressures are obtained. To calculate the pressure difference accurately, on the one hand, the posi-tion directly influenced by wind should be as close as possi-ble to part of the wall with the opening to reflect the impact of approaching wind. On the other hand, it should be at a distance sufficiently away from the opening such that the net pressure loss across the opening can be accounted for. The positions for calculating the pressure difference were deter-mined from the predicted pressure distribution inside and outside the building. An example of the predicted pressure distribution under combined wind- and buoyancy-driven ventilation through the building is shown for the windward wing in Fig. (3) (for the same case as used for Fig. 7). It can be seen that the pressure variation due to the openings in the external wall extended up to about 0.5 m from the wall. Therefore, the pressure difference across an opening for this case was obtained from the pressures at two positions: 0.5 m (= opening height) upstream and downstream the opening. Because the pressure also varied in the vertical direction particularly for buoyancy-driven flow, each of the two pres-sures was taken as the weighted average along the vertical line of the position and with the same height as the opening. Using this method, e.g., the calculated pressure difference across the opening for the top floor was about 3.66 Pa. The size of an opening would influence the extent of pressure variation. For example, when the height of an opening in the external wall was reduced to 0.05m, the distance from the wall for calculating the pressure difference should be about 0.1 m (twice the opening height) in order to capture the full pressure loss due to the opening.
The method described above for pressure calculation po-sitions differs from positioning pressure sensors in experi-mental measurement. The (static) pressure difference across
Fig. (3). Predicted pressure distribution around the windward wing of the building and positions for pressure calculation.
Pressure sampling positions
8
7
6
5
4
3
2
1
0
-1
-2
Static pressure, Pa

138 The Open Construction and Building Technology Journal, 2010, Volume 4 Guohui Gan
an opening is usually measured using pressure taps fixed on wall surfaces. However, because of the variation of the pres-sure on the surfaces of a building, which may not be clearly observed in small-scale model testing, the accuracy of the measurement would be highly dependent on correct position-ing of pressure taps. Fig. (4) shows an example of the varia-tion of the pressure difference between outer and inner sur-faces of the external wall for the top floor on the windward wing (same example as for Fig. 3). The pressure difference at a given height was calculated from the predicted pressures at two points at the same elevation – one on the outer surface and another on the inner surface of the wall. It is seen that there were significant variations in the pressure difference with the distance from the opening. The pressure difference decreased by 20% when the positions of would-be sensors moved upward from 0.1 m to 0.5 m from the top edge of the opening but increased by 32% when the positions moved downward for the same distance from the bottom edge of the opening. Hence, using surface pressure taps would give rise to large uncertainty in measurement of the real pressure dif-ference across a ventilation opening under the influence of wind. To minimise the uncertainty, CFD simulation can be used to assist experimental design in determining the appro-priate positions of pressure sensors for measuring the pres-sure difference across a ventilation opening and also related parameters such as the discharge coefficient for the opening involving wind-driven flow. For example, as illustrated above, the pressure difference calculated from the two posi-tions 0.5 m outside and inside the opening for the top floor was about 3.66 Pa and it is shown in Fig. (4) as a horizontal line. Fig. (4) indicates that this magnitude of the pressure difference could also be obtained from the pressure taps po-sitioned on the wall surfaces approximately 0.4 m above the opening or 0.25 m below the opening. Such appropriate posi-tions for pressure taps might however vary with the building configuration, external and internal environments.
4. RESULTS AND DISCUSSION
Simulations were performed first for different wind speeds and then for different window opening sizes for the atrium building designed principally with buoyancy-driven natural ventilation.
4.1. Effect of Driving Force
The first series of predictions were carried out for the in-door environment of the building under buoyancy and wind effects separately and in combination. For wind-driven simu-
lation, a wind speed of 3 m/s at a height of the atrium roof top in urban setting was used as a base simulation. This would approximately be equal to 4 m/s measured at a weather station according to Equation (1) or the annual aver-age wind speed in England. It was assumed that wind would flow from the left side of the computational domain. 4.1.1. Buoyancy Effect only
Fig. (5) shows the predicted air flow patterns and tem-perature distribution in the building under buoyancy-driven natural ventilation. The cool ambient air flowed into the building from window openings on both sides of external walls and due to the negative buoyancy effect it dropped onto each of the floors and then flowed forwards along the floors where it picked up heat. The heated air moved up-wards to the atrium due to buoyancy and the indoor air left the building through the opening at the atrium roof. The pre-dicted air movement in a lower floor was larger than that in an upper floor due to the higher buoyancy effect. The air velocity in the offices away from windows was below 0.5 m/s.
The predicted ventilation rates for the offices of the building are given in Table 1. The ventilation rate for an of-fice on the left wing was similar to that on the right wing at the same floor level. The ventilation rates in all the offices were quite high with the minimum value for the top floor of 13 L/s per m2 of floor area, or 130 L/s for an occupant with a 10 m2 floor space. As a result, the indoor air would be ther-mally comfortable with air temperatures in the offices vary-ing between 20oC and 22oC for the given ambient tempera-ture. The temperature in the atrium was slightly higher but still within comfortable conditions.
Fig. (4). Variation of the pressure difference with the distance from the opening on the top left wall of the building.
Fig. (5). Predicted air flow patterns and temperature distribution in the building with buoyancy-driven natural ventilation: (a) Air flow patterns, (b) Temperature distribution.
2
3
4
5
0 0.1 0.2 0.3 0.4 0.5
Distance from opening (m)
Above openingBelow opening0.5 m from and normal to opening
1.2
1.1
1.0
0.9
0.8
0.7
0.6
0.5
0.4
0.3
0.2
0.1
0.0
Velocity, m/s
(a) Air flow patterns
Temperature, oC
25.0
24.5
24.0
23.5
23.0
22.5
22.0
21.5
21.0
20.5
20.0(b) Temperature distribution

Wind- and Buoyancy-Driven Ventilation The Open Construction and Building Technology Journal, 2010, Volume 4 139
Table 2 presents the ventilation rates for the offices cal-culated with Equation (2). It is seen from both Table 1 and Table 2 that the predicted and calculated rates were close for buoyancy-driven ventilation. 4.1.2. Wind Effect only
Under wind-driven natural ventilation, ambient air flowed into the building from the windward side and part of the room air from the windward wing flowed across the atrium through the leeward wing of the building and the rest flowed out of the atrium from the roof opening, as seen from Fig. (6). Also, for the windward wing, incoming air flowed along the floors of the lower two offices (i.e. the ground and first floors) but the air in the top floor flowed upwards along the ceiling, due to upward flow of wind along the external wall and through the opening. This unusual flow pattern in the top floor could not be predicted without using the ex-tended domain, as pointed out in the Introduction, since the use of a uniform pressure or pressure coefficient at the win-dow opening would have resulted in an overall horizontal flow of incoming air which would then flowed towards the floor as occurred for the lower two floors. The flow direction of incoming air under a real environment would however be more complex than predicted as wind flow is transient and such an unusual flow direction could result from unsteady flow. To ascertain numerically the actual flow patterns of incoming air would require simulation of transient flow in-
stead of steady state flow in the space. Even under the steady state, the flow direction would also be affected by the verti-cal position of the opening in relation to the floor and ceiling and by the depth of the room. If the room depth is relatively large compared with the room height, the incoming air jet would attach to the surface with a low pressure region due to the Coanda effect – the ceiling of the top office room and floors of the other rooms for this case. For the leeward wing, because the openings for air supply were nearer the ceilings than floors, air from the atrium flowed along the ceilings due to the Coanda effect with very little mixing with room air, creating somewhat short circuiting. The ventilation rates in the offices on the windward wing were much higher than buoyancy-driven ventilation while those on the leeward wing were also higher than buoyancy-driven ventilation for the lower two floors.
Tables 1 and 2 show that the agreement between the pre-dicted and calculated flow rates for wind-driven ventilation was not as good as that for buoyancy-driven ventilation. In particular, the calculated ventilation rate for the top floor in the windward wing was much higher than the predicted value, due to the highly asymmetrical, up and forward flow of incoming air. The calculated ventilation rate through an opening was based on the predicted pressure difference which varied with opening position. If surface-averaged pressures or pressure coefficients were used, as assumed in
Table 1. Predicted Ventilation Rates in the Offices of the Atrium Building with 0.5 m High Window Openings
Ventilation Rate (L/s per m2 floor area)
Wind + buoyancy at wind speed (m/s) Inlet/Office (see Fig. 2) Buoyancy only Wind only at 3 m/s
3 2 1
L1 20.8 64.0 57.1 38.7 25.0
L2 17.8 73.7 66.6 43.3 25.3
L3 13.6 70.6 60.0 40.6 22.9
R1 20.7 -35.3* -11.0 3.0 15.6
R2 17.8 -29.9 -19.1 -10.3 8.9
R3 13.0 -13.3 -7.8 -1.5 6.5
* Negative value indicates air flowing out of the opening, i.e. incoming air from the atrium.
Table 2. Calculated Ventilation Rates in the Offices with 0.5 m High Window Openings
Ventilation Rate (L/s per m2 floor area) Inlet/Office (see Fig. 2)
Buoyancy only Wind only at 3 m/s 3 m/s wind + buoyancy
L1 19.7 74.4 67.0
L2 17.1 69.9 65.0
L3 13.6 83.1 70.0
R1 19.6 -34.7* -13.1
R2 17.4 -28.6 -22.5
R3 13.0 -14.7 -16.8
* See the footnote for Table 1.

140 The Open Construction and Building Technology Journal, 2010, Volume 4 Guohui Gan
some water tunnel measurement or analytical solution, the calculated ventilation rates using Equation (2) would be the same for all offices in the same wing and thus would deviate more from the predicted ventilation rates particularly for the leeward wing where the predicted ventilation rate for the bottom floor was nearly three times as much as that for the top floor. It can be argued that using different values of dis-charge coefficient in Equation (2) for different flow patterns could improve the accuracy of calculating wind-driven venti-lation rates. Similar to measurement of the surface pressure coefficient, this would however require determination of the variation of the discharge coefficient with the level of asymmetry of air flow through an opening which would de-pend on a number of factors related to the configurations of the building and opening and the surrounding as well as the wind velocity. Such data would be more difficult to deter-mine than the pressure coefficient and may not be available any time soon given that the local pressure coefficient has rarely been used for ventilation design. Also, it is doubtful if the flow asymmetry and associated discharge coefficient can be measured accurately using small scale models in a wind/water tunnel. For example, with a 1:100 scale model, it may not be possible to generate the flow pattern through a 1 cm model hole/slot as through a 1 m high ventilation open-ing in a real building particularly at a scaled-up air speed to achieve a desired magnitude of Reynolds number. Because of large uncertainties in the pressure coefficient and dis-charge coefficient in use, simple analytical equations would not be ideal for natural ventilation system design involving wind effects. 4.1.3. Combined Wind and Buoyancy Effects
The air flow patterns in and around the building under both wind and buoyancy forces are shown in Fig. (7a). One noticeable difference from the wind-driven ventilation was that air flow in the top floor on the windward wing was along the floor instead of ceiling due to the negative buoy-ancy effect of cool incoming air. The ventilation rates in the leeward wing were lower than those under either buoyancy or wind force alone due to their opposing effects. Neverthe-less, the wind effect was stronger than the buoyancy effect and air was driven from the atrium into the offices. The wind would be expected to assist buoyancy in driving air flow in the windward wing. However, the predicted ventilation rates in the offices were lower than those under the wind effect
only, suggesting that buoyancy behaved as an opposing force to the wind effect. This resulted from the stronger opposing effect in the leeward wing which reduced the overall ventila-tion in the building. Such opposing effects between wind and buoyancy have also been observed for single-sided natural ventilation of buildings [17].
The reduced ventilation rates led to air temperatures in the leeward wing being higher than achieved under buoy-ancy-driven ventilation but lower than achieved with wind-driven ventilation because of better mixing with room air. The air temperatures varied between 22oC and 24oC and so would be acceptable for thermal comfort (Fig. 7b)
The calculated ventilation rates for the leeward wing (Table 2) were higher than predicted. The calculated ventila-tion rate for the top floor was twice that from the prediction, because the flow direction just outside of the opening in the facade was almost vertical from the lower floor (see Fig. 7a) and so air flow out of the top floor (along the upper part of the opening) was extremely asymmetrical. It was also higher than that under the wind effect alone as if there were a nega-tive buoyancy effect to assist air flowing out of the facade opening. Hence, expressions from analytical solutions or measurements based on unidirectional flow path would not be able to provide accurate calculation of the ventilation rate through an opening with highly asymmetrical flow.
4.2. Effect of Wind Speed
When the reference wind speed was reduced from 3 m/s to 2 m/s, equivalent to the same measured annual average wind speed of 4 m/s at a height of the atrium roof top but in a city setting, the ventilation rates for the offices under com-bined wind and buoyancy effects decreased as expected. The decrease was about 1/3 in the windward wing but more in the leeward wing from ½ for the first floor to a much larger ratio for the ground and second floors. So much so that the ventilation rate for the second floor became negligible, i.e., buoyancy and opposing wind effects were at a similar level. Besides, the source of air flow into the ground floor changed from the atrium to fresh outside air (see Fig. 8). As a result, air in the windward wing was still comfortable but would be hot in the leeward wing particularly in the second floor. Ad-ditional simulations for the building with such large open-ings indicated that the adverse wind effect on the indoor en-vironment in the leeward wing could not be eliminated by i)
Fig. (6). Predicted air flow patterns in the building with wind-driven natural ventilation.
Velocity, m/s
4.4
3.96
3.52
3.08
2.64
2.2
1.76
1.32
0.88
0.44
0.0

Wind- and Buoyancy-Driven Ventilation The Open Construction and Building Technology Journal, 2010, Volume 4 141
Fig. (7). Predicted air flow patterns and temperature distribution in the building with combined wind- and buoyancy-driven natural ventilation: (a) Air flow patterns, (b) Temperature distribution.
Fig. (8). Predicted air flow patterns and temperature distribution in the naturally ventilated building with wind at 2 m/s: (a) Air flow patterns, (b) Temperature distribution.
Velocity, m/s4.4
3.96
3.52
3.08
2.64
2.2
1.76
1.32
0.88
0.44
0.0(a) Air flow patterns
30
29
28
27
26
25
24
23
22
21
20
Temperature, oC
(b) Temperature distribution
2.4
2.16
1.92
1.68
1.44
1.2
0.96
0.72
0.48
0.24
0.0
Velocity, m/s
(a) Air flow patterns
30
29
28
27
26
25
24
23
22
21
20
Temperature, oC
Ineffective in avoidingopposing flow
(b) Temperature distribution

142 The Open Construction and Building Technology Journal, 2010, Volume 4 Guohui Gan
simply increasing the negative wind pressure on the roof through structural design and operation such as increasing the outlet height or moving the outlet to the leeward roof or ii) diverting the predominantly wind-driven flow through the windward wing away from the leeward wing using some kind of barriers in front of internal windows (see Fig. 8b). Such measures could alter the flow patterns in the atrium but the overall air pressure in the atrium would still be higher than that in some or all of the offices in the leeward wing.
When the wind speed was reduced to 1 m/s, the ventila-tion rates in the windward wing decreased further by about 40%. The wind effect on the air flow in the leeward wing became so weak that the buoyancy effect overcame the wind effect and fresh air could enter the three offices from the outside as seen from Fig. (9). The air temperature would be acceptable (below 24oC) in all offices except for the top floor in the leeward wing where it would be warm at about 26oC.
The above predictions show that wind has a major influ-ence on the indoor environment of the naturally ventilated atrium building. The degree of influence would depend on the external environment, including the wind speed, wind direction and surroundings, and the internal environment such as the level of occupancy, amount of heat gains and furniture for a given ventilation strategy. To achieve a de-sired indoor environment, it would be necessary to control
the influence of wind e.g. through appropriate arrangement of ventilation openings.
4.3. Effect of Window Opening
Varying the size of window openings could either facili-tate or diminish wind effects in a naturally ventilated build-ing. The required size of each opening would be dependent on other openings and the factors associated with internal and external flow. An optimum combination of the openings could be found which would lead to the internal flow pat-terns as designed for buoyancy-driven natural ventilation. The indoor environment of the atrium building was predicted for a number of combinations of window opening levels and the predicted ventilation rates are presented in Table 3.
For example, when the window openings on the wind-ward wing were reduced from 0.5 m to 0.1 m high, the effect of wind at a speed of 3 m/s at the building height decreased considerably. The ventilation rates in the windward wing were reduced by about ¾ and the buoyancy effect could be re-established for the lower two floors in the leeward wing but the ventilation rates were not high enough to provide thermal comfort, particularly for the first floor where the net ventilation rate due to the difference between buoyancy and wind forces was negligible compared with the requirement for ventilation cooling and consequently the mean air tem-perature was over 30oC (see Fig. 10). The influence of wind
Fig. (9). Predicted air flow patterns and temperature distribution in the naturally ventilated building with wind at 1 m/s: (a) Air flow patterns, (b) Temperature distribution.
1.2
1.08
0.96
0.84
0.72
0.6
0.48
0.36
0.24
0.12
0.0
Velocity, m/s
(a) Air flow patterns
30
29
28
27
26
25
24
23
22
21
20
Temperature, oC
(b) Temperature distribution

Wind- and Buoyancy-Driven Ventilation The Open Construction and Building Technology Journal, 2010, Volume 4 143
was still stronger than buoyancy for the top floor in the lee-ward wing but the resulting ventilation rate was also low such that the mean air temperature was between 25oC and 27oC.
When the windward window openings were reduced fur-ther from 0.1 m to 0.05 m high, the ventilation rates in the windward wing would also be halved but the air would still be comfortable with temperatures below 24oC. Meanwhile, buoyancy-driven natural ventilation prevailed in the leeward wing. The ventilation rates for the lower two floors in the leeward wing were higher than those in the windward wing but the ventilation rate for the top floor was still too low and air temperature at 26oC to 27oC too high for thermal comfort.
To achieve thermal comfort for all the offices, the open-ing sizes of windows in the leeward wing should also be varied. For example, when the openings sizes were reduced to 0.2 m and 0.25 m for the ground and first floors respec-tively in the leeward wing while maintaining the same open-ing size of 0.05 m in the windward wing, the air tempera-tures in the offices would be generally lower than 25oC. If the openings were 0.2 m, 0.25 m and 0.5 m high for the ground, first and second floors, respectively, for both wings, the offices would have a similar ventilation rate due to buoy-ancy effect alone. The air temperatures in the offices would be between 20oC and 22oC and the indoor thermal comfort would be acceptable, similar to or even better than indoor
thermal environment (due to reduced velocity or potential draught risk) achieved with the uniform opening size of 0.5 m high for all the offices (see Table 1 for the case with buoyancy only). However, with these opening sizes, the combined wind (at 3 m/s) and buoyancy-driven flow would force air from the atrium through the leeward wing and as a result the indoor air would not be fresh or thermally comfort-able in the ground floor with temperatures of 25oC to 26oC.
These examples demonstrate that the indoor environment of a complex building designed with a buoyancy-driven ven-tilation strategy but influenced by wind could be controlled by adjusting the ventilation opening sizes. However, it would be unlikely that different levels of openings could be syn-chronised by occupants in different offices to provide every occupied space with fresh outdoor air. Instead, an intelligent control system could be deployed to control simultaneously the levels of several or all openings according to the wind speed and direction. It may also be possible to achieve the indoor buoyancy-driven flow patterns as designed through depressurising the building space. This could be attained by natural means using a wind turret/turbine at the atrium roof top to induce a negative air pressure such that it is larger in magnitude than the wind effect impacted through the wind-ward wing of the building. Without such natural means or in combination with intelligent control and proper design con-sideration of the possible adverse wind effect, mechanical
Table 3. Predicted Ventilation Rates in the Offices with Different Opening Sizes
Wind + buoyancy at wind speed 3 m/s Buoyancy only Inlet/Office (see Fig. 2)
A# Q# A Q A Q A Q A Q
L1 0.1 17.3 0.05 7.3 0.05 8.8 0.2 39.3 0.2 16.0
L2 0.1 17.2 0.05 7.7 0.05 8.9 0.25 49.9 0.25 15.8
L3 0.1 15.7 0.05 7.1 0.05 8.2 0.5 62.6 0.5 17.5
R1 0.5 7.5 0.5 17.6 0.2 15.2 0.2 -8.9 0.2 15.9
R2 0.5 1.8 0.5 11.2 0.25 11.4 0.25 -12.2 0.25 15.8
R3 0.5 -8.8* 0.5 3.3 0.5 6.6 0.5 -18.8 0.5 17.5
# A in m2 per meter of building width and Q in L/s per m2 floor area. * See the footnote for Table 1.
Fig. (10). Predicted air temperature in the naturally ventilated building with windward openings reduced to 0.1 m.
30
29
28
27
26
25
24
23
22
21
20
Temperature, oC
>30oC

144 The Open Construction and Building Technology Journal, 2010, Volume 4 Guohui Gan
ventilation would be required to assist the proper distribution of fresh air in the whole space.
5. CONCLUSIONS
Simulation of air flow in and around an atrium building with two wings of offices due to wind- and buoyancy-driven natural ventilation has confirmed interacting nature of wind and buoyancy effects. It has been shown that wind could adversely affect the buoyancy-driven flow patterns in the leeward wing and that assisting and opposing effects of wind and buoyancy could result from one of the forces to the other in either of the two wings. The degree of any of the effects depends on the size and arrangement of window openings as well as wind speed and direction. The wind effect can assist and oppose buoyancy in the windward and leeward wings, respectively, but buoyancy can be an opposing force to wind-driven flow in both wings. In the windward wing, the effect of either wind or buoyancy alone is a driving force for air flow in the direction from the facade to the atrium but, instead of one assisting the other, interaction between the two forces in the building could result in buoyancy becom-ing a resistance to wind-driven flow. To minimise the ad-verse wind effect on the desired indoor air flow patterns re-quires intelligent control by either decreasing the inflow of wind into the building through adjusting window openings on the windward façade or increasing the outflow of indoor air by depressurising the building with the aid of a wind-driven device at the roof top, or both.
The results are based on simulation of steady state air flow with wind from one direction. Wind is however inher-ently unsteady in magnitude and direction and the assisting and opposing effects of unsteady wind would be much more complex than simulated. For example, the opposing effect of wind on buoyancy-driven flow in the building might be less for wind from other directions than normal to the building width. Simulation of the full effects of wind requires tran-sient three-dimensional modelling but this would be compu-tationally prohibitive when using a large computational do-main and a fine mesh for accurate simulation of combined wind- and buoyancy-driven flow.
Even though CFD has been used to assist design of build-ings and ventilation systems, current design methods for natural ventilation systems are principally based on meas-urements and analytical solutions that neglect the effect of asymmetrical inflow and outflow which can be significant as a result of wind flow, likely leading to over-estimation of the building ventilation potential and inadequate provision of fresh air. The complex interaction between wind-driven and buoyancy-driven natural ventilation of realistic buildings needs also to be determined experimentally through meas-urements of pressure, velocity and temperature variations in the flow field from real size buildings or large scale models. Results would be valuable for further validation of CFD models and realistic ventilation design.
REFERENCES [1] C. Afonso, and A. Oliveira, “Solar chimneys: simulation and ex-
periment”, Energy and Buildings, vol. 32, no. 1, pp. 71-79, 2000. [2] T. Yang, N. G. Wright, D. W. Etheridge, and A. D. Quinn, “A
comparison of CFD and full-scale measurements for analysis of natural ventilation”, International Journal of Ventilation, vol. 4, no. 4, pp. 337-348, 2006.
[3] P. S. Carey, and D. W. Etheridge, “Direct wind tunnel modelling of natural ventilation for design purposes”, Building Services Engi-neering Research and Technology, vol. 20, no. 3, pp. 131-142, 1999.
[4] Y. Jiang, D. Alexander, H. Jenkins, R. Arthur, and Q. Chen, “Natu-ral ventilation in buildings: measurement in a wind tunnel and nu-merical simulation with large-eddy simulation”, Journal of Wind Engineering and Industrial Aerodynamics, vol. 91, no. 3, pp. 331-353, 2003.
[5] G. R. Hunt, and P. F. Linden, “The fluid mechanics of natural ventilation - displacement ventilation by buoyancy-driven flows as-sisted by wind”, Building and Environment, vol. 34, no. 6, pp. 707-720, 1999.
[6] G. R. Hunt and P. F. Linden, “Steady-state flows in an enclosure ventilated by buoyancy forces assisted by wind”, Journal of Fluid Mechanics, vol. 426, pp. 355-386, 2001.
[7] G. R. Hunt, and P. F. Linden, “Displacement and mixing ventila-tion driven by opposing wind and buoyancy”, Journal of Fluid Me-chanics, vol. 527, pp. 27-55, 2004.
[8] B. Lishman, and A. W. Woods, “The control of naturally ventilated buildings subject to wind and buoyancy”, Journal of Fluid Me-chanics, vol. 557, pp. 451-471, 2006.
[9] M. R. Flynn, and G. R. Hunt, “Effect of volumetric heat sources on hysteresis in natural and mixed-mode ventilation”, Building and Environment, vol. 44, no. 1, pp. 216-226, 2009.
[10] Y. Li, and A. Delsante, “Natural ventilation induced by combined wind and thermal forces”, Building and Environment, vol. 36, no. 1, pp. 59-71, 2001.
[11] D. W. Etheridge, “Wind turbulence and multiple solutions for opposing wind and buoyancy”, International Journal of Ventila-tion, vol. 7, no. 4, pp. 309-319, 2008.
[12] P. Heiselberg, and M. Sandberg, “Evaluation of discharge coeffi-cients for window openings in wind driven natural ventilation”, In-ternational Journal of Ventilation, vol. 5, no. 1, pp. 43-52, 2006.
[13] P. Karava, T. Stathopoulos, and A. K. Athienitis, “Wind driven flow through openings – a review of discharge coefficients”, Inter-national Journal of Ventilation, vol. 3, no. 3, pp. 255-266, 2003.
[14] R. Letan, V. Dubovsky, and G. Ziskind, “Passive ventilation and heating by natural convection in a multi-storey building”, Building and Environment, vol. 38, pp. 197-208, 2003.
[15] Y. Ji, and M. Cook, “Numerical studies of displacement natural ventilation in multi-storey buildings connected to an atrium”, Building Services Engineering Research and Technology, vol. 28, no. 3, pp. 207-222, 2007.
[16] Y. Ji, M. Cook, and V. Hanby, “CFD modelling of natural dis-placement ventilation in an enclosure connected to an atrium”, Building and Environment, vol. 42, no. 3, pp. 1158-1172, 2007.
[17] C. Allocca, Q. Chen, and L. R. Glicksman, “Design analysis of single-sided natural ventilation”, Energy and Buildings, vol. 35, pp. 785-795, 2003.
[18] M. Cook, Y. Ji, and G. R. Hunt, “CFD modelling of natural ventila-tion: combined wind and buoyancy forces”, International Journal of Ventilation, vol. 1, no. 3, pp. 169-179, 2003.
[19] M. W. Liddament, A Guide to Energy Efficient Ventilation, AIVC, UK, 1996.
[20] D. K. Alexander, H. G. Jenkins, and P. J. Jones, “A comparison of wind tunnel and CFD methods applied to natural ventilation de-sign”, In Proceedings of Fifth International IBPSA Conference (BS 1997), Prague, Czech Republic, September 8-10, 1997, pp. 321-326.
[21] D. Costola, B. Blocken, M. Ohba, and J. L. M. Hensen, “Uncer-tainty in airflow rate calculations due to the use of surface-averaged pressure coefficients”, Energy and Buildings, vol. 42, pp. 881-888, 2010.
[22] M. J. Holmes, and S. McGowan, “Simulation of complex wind and buoyancy driven building”, In Proceedings of Fifth International IBPSA Conference (BS1997), Prague, Czech Republic, September 8 – 10, 1997, pp. 127-134.
[23] J. Good, A. Frisque, and D. Phillips, “The role of wind in natural ventilation simulations using airflow network models”, In Proceed-ings of Third National Conference of IBPSA-USA (SimBuild 2008), Berkeley, California, July 30 – August 1, 2008, pp. 140-147.
[24] T. van Hooff, and B. Brocken, “Coupled urban wind flow and indoor natural ventilation modelling on a high-resolution grid: A case study for the Amsterdam Arena stadium”, Environmental Modelling and Software, vol. 25, no. 1, pp. 51-65, 2010.

Wind- and Buoyancy-Driven Ventilation The Open Construction and Building Technology Journal, 2010, Volume 4 145
[25] FLUENT User's Guide, Fluent Inc, New Hampshire, USA, 2005. [26] V. Yakhot, and S. A. Orzsag, “Renormalization group analysis of
turbulence: I. basic theory”, Journal of Scientific Computing, vol. 1, no. 1, pp. 1-51, 1986.
[27] G. Gan, “Impact of computational domain on the prediction of buoy-ancy-driven ventilation cooling”, Building and Environment, vol. 45, no. 5, pp. 1173-1183, 2010.
[28] G. Gan, and S. B. Riffat, “Pressure loss characteristics of orifice and perforated plates”, Experimental Thermal and Fluid Science, vol. 14, no. 2, pp. 160-165, 1997.
Received: September 09, 2010 Revised: October 08, 2010 Accepted: October 12, 2010 © Guohui Gan; Licensee Bentham Open.
This is an open access article licensed under the terms of the Creative Commons Attribution Non-Commercial License (http://creativecommons.org/-licenses/by-nc/3.0/) which permits unrestricted, non-commercial use, distribution and reproduction in any medium, provided the work is properly cited.