Embed Size (px)
Citation preview

INFOVIS8803DV > SPRING 17
INTERACTION, ANIMATION, & TRANSITION
Prof. Rahul C. Basole
CS/MGT 8803-DV > February 27, 2017

INFOVIS8803DV > SPRING 17
Agenda
• Interaction
• Animation
• Transition
• Tableau Tutorial

INFOVIS8803DV > SPRING 17
What is Interaction?

INFOVIS8803DV > SPRING 17
Alternatives
Interaction
=
Communication,
Analytic Discourse
Interaction
=
Being interactive,
not static
FOCUS
vs.

INFOVIS8803DV > SPRING 17
https://www.youtube.com/watch?v=7SFeCgoep1c
Minority Report

INFOVIS8803DV > SPRING 17
https://www.youtube.com/watch?v=jZkHpNnXLB0
A Day Made of Glass 2

INFOVIS8803DV > SPRING 17
Some Definitions (an HCI Perspective)
• Interaction is …
– “The communication between user and the system” [Dix et al. 1998]
– “Direct manipulation and instantaneous change” [Becker et al. 1987]
• In reality …
– HCI research is far from having solid (and falsifiable) theories of
interaction [Beaudouin-Lafon, 2004]

INFOVIS8803DV > SPRING 17
“The effectiveness of information visualization
hinges on two things: its ability to clearly and
accurately represent information and our ability
to interact with it to figure out what the
information means.”
S. Few
Now You See It, p. 55
Recall

INFOVIS8803DV > SPRING 17
“Overview first, zoom and filter,
then details-on-demand.”
B. Shneiderman
1996
Visual Information Seeking Mantra

INFOVIS8803DV > SPRING 17
Lots of Interaction Types
• Focus & Context
• Details on Demand
• Filter/Dynamic Query
• Brushing and Linking
• Explore
• Change Representation
– Re-encode
– Reconfigure/Rearrange
• Animation
• Abstract/Elaborate (Drill-down)
• Zoom and Pan
• etc.
NAVIGATION
SELECTION
FILTERING
RECONFIGURING
ENCODING
CONNECTING
ABSTRACTING/ELABORATING
HYBRID

INFOVIS8803DV > SPRING 17
What I expect you to know
• The types of interactions
– Definition
– Examples of use
• Why/when you might use each
• Design issues with each

INFOVIS8803DV > SPRING 17
Recall: Navigation (Zoom+Pan)
https://www.google.com/maps

INFOVIS8803DV > SPRING 17
Navigation (Rotate)
http://mbostock.github.io/d3/talk/20111018/cluster.html

INFOVIS8803DV > SPRING 17
Selecting: Highlights
http://bost.ocks.org/mike/uberdata/

INFOVIS8803DV > SPRING 17
Explore – “Follow the Links”
http://www.visualthesaurus.com/

INFOVIS8803DV > SPRING 17
Aggregate + Explore
http://mbostock.github.io/d3/talk/20111116/force-collapsible.html

INFOVIS8803DV > SPRING 17
Details-on-Demand (DoD)
• Provide a user with more information and details about a data
case(s).
– Get more information about a specific case
– May cause change from an aggregation view to an individual view
• Zoom in may result in not all data shown
• Or data may be abstracted

INFOVIS8803DV > SPRING 17
DoD: Pop-Up Tooltips
Hovering mouse cursor
brings up details of item

INFOVIS8803DV > SPRING 17
DoD: Distance from Selected Mark
Clicking on an item
selects it. Attributes of
data element are
shown.
Where is best place to
show?
Selected item
Attributes
Pros/Cons of where
Attributes are shown??

INFOVIS8803DV > SPRING 17
DoD: Distance from Selected Mark
Selected item
Attributes

INFOVIS8803DV > SPRING 17
DoD: How to select amongst Clutter?
Could
zoom in,
but then
loose
context.
Could
label, but
too
crowded.

INFOVIS8803DV > SPRING 17
DoD: Excentric Labels
• Dynamic means to label neighborhood of objects around the cursor
• Labels appear only when data marks selected
• Readable, non-ambiguous, do not hide important information
https://www.youtube.com/watch?v=8Lwr5HXC9Ik
http://vimeo.com/4661780

INFOVIS8803DV > SPRING 17
Focus + Context
https://www.google.com/finance?q=AAPL

INFOVIS8803DV > SPRING 17
Focus + Context
SeeSoft
15,000 lines
of code in
52 files
Heat map for
color-coded
characteristic
Selected
Code
Details of
Selected
Code

INFOVIS8803DV > SPRING 17
Focus + Context (Hyperbolic Browser)
https://www.youtube.com/watch?v=pwpze3RF55o
INFOVIS8803DV > SPRING 17
Filter and Dynamic Query
• “Show me something based on certain conditions”
• Change the amount of data displayed, based on selection criteria –
typically less data
• Called “dynamic query” or “dynamic filter” if continuous variation in
criteria => continuous change in the InfoVis

INFOVIS8803DV > SPRING 17
Filter: House Finder on the Web
Not dynamic – a
bit slow on
refresh - but
does filter
http://www.housingmaps.com
Filter on Price

INFOVIS8803DV > SPRING 17
Filter: Zillow
https://www.zillow.com/homes/for_sale/Beverly-Hills-
CA/10389_rid/globalrelevanceex_sort/34.134186,-118.30945,34.030967,-118.489695_rect/12_zm/

INFOVIS8803DV > SPRING 17
Filter: Name Search
http://www.babynamewizard.com/voyagerNote:
Animation for Transitions
Tool-tip detail on demand
Highlighting name ‘river’

INFOVIS8803DV > SPRING 17
Dynamic Query (DQ)
• Well known, very useful technique
• Could do regular query with traditional database query
– Example: Purchase a house/condo in ATL
Select house-address
From atl-realty-db
Where price >= 200,000 and
price <= 400,000 and
bathrooms >= 3 and
garage == 2 and
bedrooms >= 4

INFOVIS8803DV > SPRING 17
Typical Result of Database Query
• Too many to work with:
– 207 records match request
• 1. 635 Harvard, 3 bedrooms, $300,000
• 2. 187 Delaware Avenue, 4 bedrooms, ….
• 3.
• etc.
• Or too few to work with:
– 0 records match request

INFOVIS8803DV > SPRING 17
Database Queries: Pros/Cons
Pros
• Powerful
Cons
• Must learn language
• Shows exact matches
• Don’t know magnitude of results
• Context is missing
• Reformulating query may be slow

INFOVIS8803DV > SPRING 17
Dynamic Query: HomeFinder
https://www.youtube.com/watch?v=5X8XY9430fM

INFOVIS8803DV > SPRING 17
Dynamic Query
• Specifying a query brings immediate display of results.
– Selection by pointing (not typing)
– Immediate and continuous display of results
• Responsive interaction (< .1 second) with data and presentation of
solution. Visual representation of world of action including both the
objects and actions
• “Fly through the data”, promote exploration, and the experience
– Rapid, incremental, and reversible actions

INFOVIS8803DV > SPRING 17
DQ Pros/Cons
• Pros
– Fast, easy, reversible
– Removes clutter
– Can see cases appear and disappear
• So can understand how many cases have a specific variable value
• Cons
– Filters take space
– Becomes slow as data sets get larger
– How compare results of two different queries??

INFOVIS8803DV > SPRING 17
DQ Controls
• Fairly common across many examples
• Variable types
– Nominal, including binary - Buttons
– Ordinal, low cardinality - Buttons
– Ordinal, high cardinality - Sliders
– Quantitative - Sliders

INFOVIS8803DV > SPRING 17
DQ: FilmFinder Alpha Slider
• Uses alphabet as ordinal base on normal ordering of letters
A B C DEF G HI J K L M N OP QR S T UVW XYZ
GoldfingerCurrent
selection
Slider thumb
Slider area
Index

INFOVIS8803DV > SPRING 17
DQ: Data Distribution Sliders
• Put data in the controls
Low selection Data distribution High selection
Spider box shows properties of data distribution Dots show individual values
Andrienko and Andrienko, Interactive Maps for Visual Data
Exploration, Int’l J. Geographic Info. Sci., 13 (4), 355-374, 1999.

INFOVIS8803DV > SPRING 17
DQ: Data Sliders
http://www.kayak.com/

INFOVIS8803DV > SPRING 17
Linking
• Applies when you
have multiple views
of the same data
• Select one case in
a view and the
same case is
highlighted in the
other views
• Selected cases

INFOVIS8803DV > SPRING 17
Linking: Attribute Explorer’s Histograms
• Brushing + dynamic query filtering
• Histograms of each variable
• Histogram ‘column’ can be selected
– All corresponding cases highlighted
in main display area and potentially in
other histograms
• Also do DQ on each variable
• Useful in “zero-hit” situations or when
you’re not familiar with the data
• Does not fix DQ ConsCost
Cost
30K 100K
30K 100K
Spence, R., and Tweedie, L. “The Attribute
Explorer: Information Synthesis via Exploration,”
Interacting with Computers, 1998

INFOVIS8803DV > SPRING 17
Linking Histograms Give Context

INFOVIS8803DV > SPRING 17
Linking Histograms: DataMaps

INFOVIS8803DV > SPRING 17
Linking: Infoscope

INFOVIS8803DV > SPRING 17
Brushing & Linking
• Used with multiple views
• Selecting/highlighting
case in one view
highlights the case in all
other views
• Moving mouse over
cases can reveal
patterns of relationships
http://bl.ocks.org/mbostock/4063663

INFOVIS8803DV > SPRING 17
Brushing/Linking
http://square.github.io/crossfilter/

INFOVIS8803DV > SPRING 17
Reconfigure
• “Show me a different arrangement”
• Reconfigure information being displayed; much the same info shown
in both data visualizations
•
• Examples
– Sort or re-order columns
– Reorder parallel coordinates
– Changing baseline in the stacked histograms
– “Spread dust” feature in Dust & Magnet
– GapMinder – (x,y) bubble chart, world map

INFOVIS8803DV > SPRING 17
Reconfigure: Stacked Histogram
• NO new information added;
bars simply reordered
• What problem does this
reconfiguring (reordering in
this case) solve?
Before
After
http://www.hiraeth.com/alan/topics/vis/hist.html

INFOVIS8803DV > SPRING 17
Reconfigure: Reorder Columns
TableLens
New perspective
Limited real estate
Same idea for
parallel
coordinates

INFOVIS8803DV > SPRING 17
Reconfigure (Reordering) + Brushing
http://bl.ocks.org/jasondavies/1341281

INFOVIS8803DV > SPRING 17
Reconfigure: Animated Rearrangement
http://bost.ocks.org/mike/miserables/

INFOVIS8803DV > SPRING 17
Reconfigure: Dust & MagnetYi et al, Information Visualization ‘05
Uses magnet
metaphor
Magnets
represent
attributes
Magnets attract
dust
representing
data cases
https://www.youtube.com/watch?v=wLXwL38xek0

INFOVIS8803DV > SPRING 17
Re-encode – Change Representation
• “Show me a different representation”
• Change visual appearance
• Examples
– Change representation
• line to bar
• Starplot to parallel coordinates
– Change encoding of an attribute from size to color
– Change glyphs

INFOVIS8803DV > SPRING 17
Re-encode: Change Representation

INFOVIS8803DV > SPRING 17
Re-encode: GLO-STIX
http://vimeo.com/113232967
INFOVIS8803DV > SPRING 17
Animation (generally used to …)
• Show variable value as some other variable changes (typically but
not necessarily time)
• Show change in representation
• Call attention
• Two Key Issues
– Speed
– User control vs automatic
INFOVIS8803DV > SPRING 17
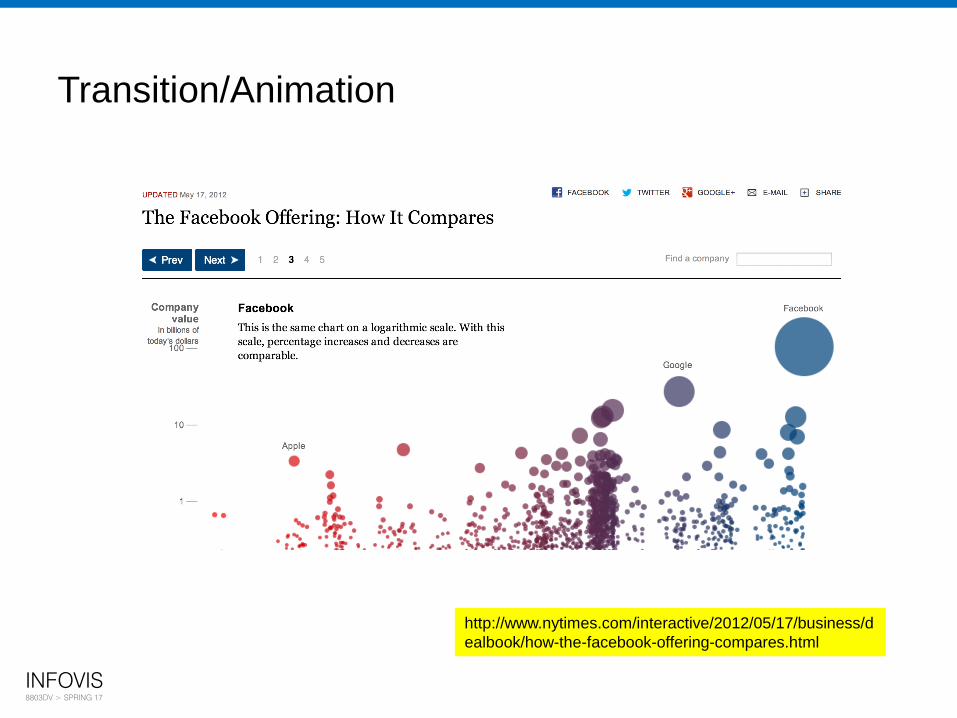
Transition/Animation
http://www.nytimes.com/interactive/2012/05/17/business/d
ealbook/how-the-facebook-offering-compares.html

INFOVIS8803DV > SPRING 17
Abstract/Elaborate
• “Show me more or less detail”
• Adjust the level of abstraction, either overview or detail
– Abstraction = aggregation – combine cases
– Elaborate = disaggregate
• Lots of Examples
– Unfold sub-categories in pie chart
– Drill down in tree map
– Combine arcs between nodes in a graph
– Roll-up subtrees
– Put cases into buckets based on variable bucket
– Zoom, as in Google Maps (Zooming also filters)

INFOVIS8803DV > SPRING 17
Elaborate: TableLens (also Focus + Context)
Expanded
Rows
Expanded
Rows
https://www.youtube.com/watch?v=qWqTrRAC52U

INFOVIS8803DV > SPRING 17
Elaborate: Sunburst
• Selected segment in Sunburst display is enlarged
– Three steps in animation:

INFOVIS8803DV > SPRING 17
Zoom + Reconfigure + Elaborate
http://mbostock.github.io/d3/talk/20111018/treemap.html

INFOVIS8803DV > SPRING 17
Viewing Clutter: Fisheye
http://bost.ocks.org/mike/fisheye/

INFOVIS8803DV > SPRING 17
Focus + Context through Brushing
http://bl.ocks.org/mbostock/1667367

INFOVIS8803DV > SPRING 17
Revisiting Zoom + Pan
• Geometric Zoom
– objects get larger as if you’re getting
closer to them.
– https://bl.ocks.org/mbostock/3680999
• Semantic Zoom
– objects stay the same size but are just
further apart when you zoom in.
– https://bl.ocks.org/mbostock/3680957

INFOVIS8803DV > SPRING 17
Designing Interactions for Tablets
vimeo.com/97798460
vimeo.com/195348951

INFOVIS8803DV > SPRING 17
Phew. Wrapping Up
• There are lots of interaction methods/techniques
• Can be categorized
• Many are often combined
• Remember
– What is each category/method good for?
– Design issues with each method

INFOVIS8803DV > SPRING 17
Tableau Tutorial

INFOVIS8803DV > SPRING 17
PM5: Designs
• Sketch and provide an overview of several iterations (2-3) of your
DataVis dashboard design and annotate the design. Explain your
design evolution, the interactions you think will be embedded in
them, etc. Think carefully about what you want to show and how.
Make sure that Tableau or the software you chose for the project
can handle the design/interactions you are providing. Creativity and
depth of thinking is important here.
• Submit your report on T-Square & bring two (2) copies to class.