Embed Size (px)
Citation preview

Inter-laboratory tests of the
methodology for filtration efficiency
tests in different filter media against
nanoparticles
Panagiota Sachinidou, Shawn S.C. Chen, David
Y.H. Pui, Paolo Tronville, Thomas Mosimann,
Mikael Eriksson, Jing Wang

Outline
• Project background
• Pre-normative research
• Qualification of the setup
• Inter-laboratory tests
• Summary
2Air Quality & Particle Technology (APT)

Project consortium
3
Methodology to Determine Effectiveness of Filtration Media against Nanoparticles in the Size Range of 3 to 500 Nanometer
Reference labAir Quality & Particle Research ETHZ/EMPA, SwitzerlandProf. Jing Wang
Supporting labParticle Technology LabUniversity of Minnesota, USAProf. David Y.H. Pui
Round-robin test labsCamfil, SwedenMr. Mikael ErikssonPolitecnico di Torino, ItalyProf. Paolo TronvilleUnifil, SwitzerlandMr. Nägeli Andreas
Bac
kgro
und
Pre
norm
Res
earc
hIn
terl
abora
tory
Tes
tsQ
ual
ific
atio
n

Summary of relevant air filtration standards
4
Jing Wang & Paolo Tronville (2014), Toward standardized test methods to determine the effectiveness
of filtration media against airborne nanoparticles, J Nanopart Res 16:2417
Bac
kgro
und
Pre
-norm
Res
earc
hIn
terl
abora
tory
Tes
tsQ
ual
ific
atio
n
Air Quality & Particle Technology (APT)

Filtration tests
5
DMA transfer function
Flow in the filter holder
Particle size
Bac
kgro
und
Pre
-norm
Res
earc
hIn
terl
abora
tory
Tes
tsQ
ual
ific
atio
n
Sachinidou, P., Bank, Y.K., & Wang, J, Aerosol Sci & Tech, 2016
Air Quality & Particle Technology (APT)

Flow distribution-CFD analysis
6
Inlet:
mass flow
inlet:0.000317
kg/s
Outlet: outflow
walls: wall
NP 3 μm:
Porous jump
5cm/s filter face
velocitySymmetry
Flow distribution in the large filter holder was simulated using ANSYS FLUENT.
K-ε realizable model was applied and mesh independency study was performed.
NP 3μm filter which is homogeneous was chosen for the investigation and
simulated with porous jump boundary conditions.
Bac
kgro
und
Pre
-norm
Res
earc
hIn
terl
abora
tory
Tes
tsQ
ual
ific
atio
n

Flow distribution- velocity distribution
7
Face velocity has a jet profile which is distributed homogeneously before the
filter.
Bac
kgro
und
Pre
-norm
Res
earc
hIn
terl
abora
tory
Tes
tsQ
ual
ific
atio
n
Air Quality & Particle Technology (APT)
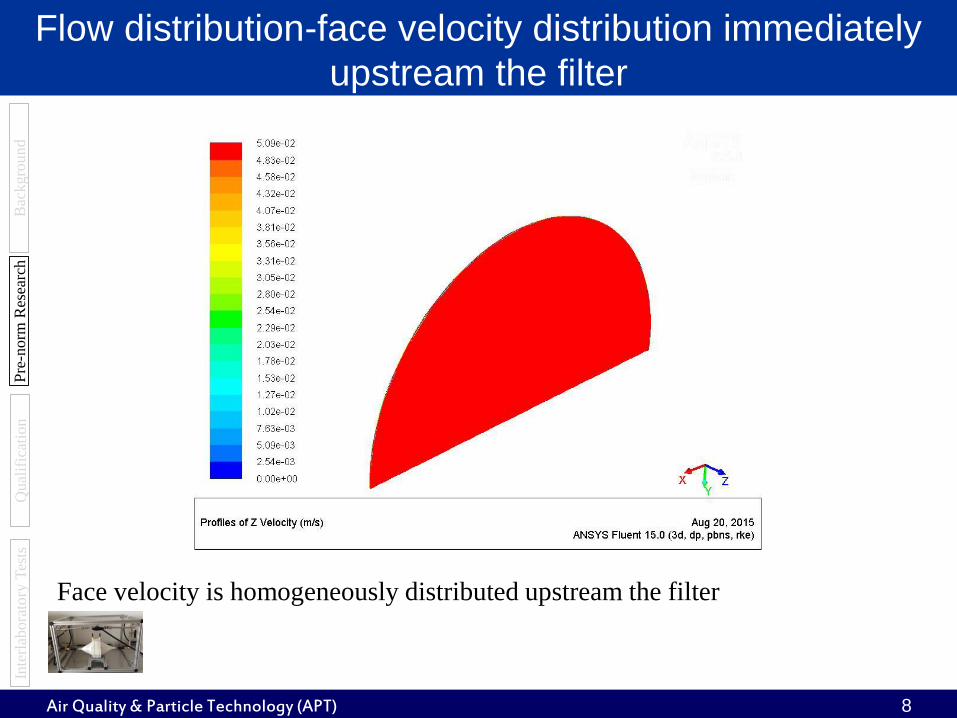
Flow distribution-face velocity distribution immediately
upstream the filter
8
Face velocity is homogeneously distributed upstream the filter
Bac
kgro
und
Pre
-norm
Res
earc
hIn
terl
abora
tory
Tes
tsQ
ual
ific
atio
n
Air Quality & Particle Technology (APT)

Monodispersity investigation
9
Flow distribution does not affect the calculated filtration efficiency.
• Flow distribution incorporated in the filtration model
500
Bac
kgro
und
Pre
-norm
Res
earc
hIn
terl
abora
tory
Tes
tsQ
ual
ific
atio
n
Air Quality & Particle Technology (APT)

Qualification procedure
10
Zero count test
Counting accuracy calibration
Bac
kgro
und
Pre
-norm
Res
earc
hIn
terl
abora
tory
Tes
tsQ
ual
ific
atio
n
DMA test
Neutralization efficiency test
Preparatory checks
Zero efficiency test
Air Quality & Particle Technology (APT)

Qualification of the test rig
-Neutralization efficiency
11
The neutralization effectiveness of the neutralizer was checked using two DMA connected
in series. The first one was used to pre-select the desired particle diameter and the second
one was used to select the particle diameter corresponding to singly, doubly and triply
charged particles. This set up allows checking the efficiency of the neutralizer that is
located inside the second DMA. The experimental particle charge ratio was compared with
the theoretical one (Wiedensohler (1988) and Kim et al. (2005)) The same experiments
were carried, using an additional neutralizer in between the two DMA in order to study if
the residence time does not affect the neutralization efficiency.
Neutralization Test
Bac
kgro
und
Pre
-norm
Res
earc
hIn
terl
abora
tory
Tes
tsQ
ual
ific
atio
n
Air Quality & Particle Technology (APT)

Qualification of the test rig
-Neutralization efficiency
12
1charges/icharge
Mobility
diameter
(nm)
Raw
counts
Experimental
Ratio
Theoretical
Ratio
1 charge 51.4 706.53
2 charges 35.66 26.97 26.19 24.2
1charges/icharge
Mobility
diameter
(nm)
Raw
counts
Experimental
Ratio
Theoretical
Ratio
1 charge 95.6 190.07
2 charges 64.99 22.87 8.31 7.23
1charge/icharge
Mobility
diameter
(nm)
Raw
counts
Experimental
Ratio
Theoretic
al Ratio
1 charge 193.3 84.31 1
2 charges 125.7 26.42 3.19 2.94
3 charges 99.22 4.855 17.36 14.49
1charges/icharge
Mobility
diameter
(nm)
Raw
counts
Experimental
Ratio
Theoretical
Ratio
1 charge 33.9822389.
4
2 charges 23.73 277.8 80.68 78.06
1charges/icharge
Mobility
diameter
(nm)
Raw
counts
Experimental
Ratio
Theoretical
Ratio
1 charge 80.58 7246
2 charges 55.28 784 9.24 9.62
1charge/icharge
Mobility
diameter
(nm)
Raw
counts
Experimental
Ratio
Theoretical
Ratio
1 charge 191.1 4690.8
2 charges 124.9 1455 3.22 2.98
3 charges 98.6 342.8 13.66 14.86
ETH (Kr-85) UMN (Po-210)
Results show the experimental ratio is in good agreement with the theoretical
one.
Bac
kgro
und
Pre
-norm
Res
earc
hIn
terl
abora
tory
Tes
tsQ
ual
ific
atio
n
Air Quality & Particle Technology (APT)

Test setup
13
ETH
Unifil PolitoCamfil
UMN
Bac
kgro
und
Pre
-norm
Res
earc
hIn
terl
abora
tory
Tes
tsQ
ual
ific
atio
n
Air Quality & Particle Technology (APT)

Filters tested
14
filter class:
filter type: media type:
bag filter pleatable synthetic glass fiber PTFE Synthetic
non-
chargedcharged
discharged/
non charged
Mesh X
M5 X X
NP 3μm X
F7 X X X X
F7 X X X
F9 X X X
E11 X X X
H13 X X X
F7 glass M5
F7 PTFE
F9
E11
Air Quality & Particle Technology (APT)

Interlaboratory Tests: Twilled Dutch weave
mesh 350x2600
15
SEM image
Twilled Dutch weave 350x2600
Solidity 0.62 -
Fiber Size (wrap) 32 μm
Fiber Size (weft) 22 μm
Filter thickness 0.08 mm
Material Stainless Steel
Bac
kgro
und
Pre
-norm
Res
earc
hIn
terl
abora
tory
Tes
tsQ
ual
ific
atio
n
Air Quality & Particle Technology (APT)

10 1005 8 15 20 30 45 67 150 224 335 500
0
10
20
30
40
50
60
70
80
90
100
A S1 DEHS
A S2 DEHS
A S3 DEHS
B S1 DEHS
B S2 DEHS
B S3 DEHS
C S1 DEHS
C S2 DEHS
E S1 DEHS
E S2 DEHS
E S3 DEHS
D S1 DEHS
D S2 DEHS
D S3 DEHS
A S1 Silver
A S2 Silver
A S3 Silver
B S1 Silver
B S2 Silver
B S3 Silver
C S1 Silver
C S2 Silver
Effic
ien
cy (
%)
Mobility diameter (nm)
Wire mesh 5 cm per s
Wire mesh
16
Filtration efficiency results are in accordance with each other among the difference
laboratories
Air Quality & Particle Technology (APT)

10 1005 8 15 20 30 45 67 150 224 335 500
0
10
20
30
40
50
60
70
80
90
100
A S1 DEHS
A S2 DEHS
A S3 DEHS
B S1 DEHS
B S2 DEHS
B S3 DEHS
C S1 DEHS
C S2 DEHS
E S1 DEHS
E S2 DEHS
E S3 DEHS
D S1 DEHS
D S2 DEHS
D S3 DEHS
A S1 Silver
A S2 Silver
A S3 Silver
B S1 Silver
B S2 Silver
B S3 Silver
C S1 Silver
C S2 Silver
Eff
icie
ncy (
%)
Mobility diameter (nm)
Wire mesh 5 cm per s
Wire mesh
17
There are not many straggles or outliers in the whole particle size range.
C
A
Green Color: stragglers
Red Color: outliers
Air Quality & Particle Technology (APT)

Wire mesh
18
The results shows small variance; Thus, statistical analysis reveals a few stragglers or outliers.
The variances calculated according to the statistical analysis are low for almost all the particle size range.
Air Quality & Particle Technology (APT)
m Sr Sl SR
20 43.2 0.5 4.6 4.6
30 27 0.79 5.59 5.64
45 17 0.81 3.48 3.57
67 11.653 0.685 2.252 2.354
100 8.087 0.625 1.618 1.735
150 7.18 0.86 0.77 1.15
224 6.26 0.82 1.78 1.96
335 7.55 1.55 0.55 1.6410 1005 8 15 20 30 45 67 150 224 335 500
0
10
20
30
40
50
60
70
80
90
100
A S1 DEHS
A S2 DEHS
A S3 DEHS
B S1 DEHS
B S2 DEHS
B S3 DEHS
C S1 DEHS
C S2 DEHS
E S1 DEHS
E S2 DEHS
E S3 DEHS
D S1 DEHS
D S2 DEHS
D S3 DEHS
A S1 Silver
A S2 Silver
A S3 Silver
B S1 Silver
B S2 Silver
B S3 Silver
C S1 Silver
C S2 Silver
Eff
icie
ncy (
%)
Mobility diameter (nm)
Wire mesh 5 cm per s

10 1005 8 15 20 30 45 67 150 224 335 500
76
78
80
82
84
86
88
90
92
94
96
98
100
A S1 DEHS
A S2 DEHS
A S3 DEHS
B S1 DEHS
B S2 DEHS
B S3 DEHS
C S1 DEHS
C S2 DEHS
C S3 DEHS
E S1 DEHS
E S2 DEHS
E S3 DEHS
D S1 DEHS
D S2 DEHS
D S3 DEHS
A S1 Silver
A S2 Silver
A S3 Silver
B S1 Silver
B S2 Silver
B S3 Silver
C S1 Silver
C S2 Silver
C S3 Silver
Effic
iency (
%)
Mobility diameter (nm)
F7 PTFE charged 5cm per s
F7 charged
19
D and E measures smaller efficiency compared to the ones measured by the other labs.
Pressure drop is close among the different laboratories except from A. Possibly this could attributed to the
measurement range of the instrument at laboratory A (minimum limit equals to 13Pa).
Air Quality & Particle Technology (APT)
Pressure drop (Pa)
A E B D C
S1 34 20 22 27 25
S2 37 21 23 23 21
S3 36 22 23 25 21

10 1005 8 15 20 30 45 67 150 224 335 500
76
78
80
82
84
86
88
90
92
94
96
98
100
A S1 DEHS
A S2 DEHS
A S3 DEHS
B S1 DEHS
B S2 DEHS
B S3 DEHS
C S1 DEHS
C S2 DEHS
C S3 DEHS
E S1 DEHS
E S2 DEHS
E S3 DEHS
D S1 DEHS
D S2 DEHS
D S3 DEHS
A S1 Silver
A S2 Silver
A S3 Silver
B S1 Silver
B S2 Silver
B S3 Silver
C S1 Silver
C S2 Silver
C S3 Silver
Effic
iency (
%)
Mobility diameter (nm)
F7 PTFE charged 5cm per s
F7 charged
20
High variance for laboratory D; Statistical analysis reveals many stragglers and outliers for laboratory D.
Air Quality & Particle Technology (APT)
Pressure drop (Pa)
A E B D C
S1 34 20 22 27 25
S2 37 21 23 23 21
S3 36 22 23 25 21
Green Color: stragglers
Red Color: outliers

F7 charged
21
Variances are about 1 – 2 %.
Air Quality & Particle Technology (APT)
m Sr Sl SR
20 96.8 0.7 1.1 1.3
30 92.22 0.85 2.53 2.67
45 88.80 0.61 0.48 0.77
67 84.189 0.836 2.066 2.228
100 83.760 0.859 1.592 1.809
150 85.26 0.60 1.24 1.38
224 85.99 0.97 1.33 1.65
335 88.02 1.01 1.14 1.52
Pressure drop (Pa)
A E B D C
S1 34 20 22 27 25
S2 37 21 23 23 21
S3 36 22 23 25 21
10 1005 8 15 20 30 45 67 150 224 335 500
76
78
80
82
84
86
88
90
92
94
96
98
100
A S1 DEHS
A S2 DEHS
A S3 DEHS
B S1 DEHS
B S2 DEHS
B S3 DEHS
C S1 DEHS
C S2 DEHS
C S3 DEHS
E S1 DEHS
E S2 DEHS
E S3 DEHS
D S1 DEHS
D S2 DEHS
D S3 DEHS
A S1 Silver
A S2 Silver
A S3 Silver
B S1 Silver
B S2 Silver
B S3 Silver
C S1 Silver
C S2 Silver
C S3 Silver
Eff
icie
ncy (
%)
Mobility diameter (nm)
F7 PTFE charged 5cm per s

10 1005 8 15 20 30 45 67 150 224 335 500
80
82
84
86
88
90
92
94
96
98
100
A S1 DEHS
A S2 DEHS
A S3 DEHS
B S1 DEHS
B S2 DEHS
B S3 DEHS
C S1 DEHS
C S2 DEHS
C S3 DEHS
E S1 DEHS
E S2 DEHS
E S3 DEHS
D S1 DEHS
D S2 DEHS
D S3 DEHS
A S1 Silver
A S2 Silver
A S3 Silver
B S1 Silver
B S2 Silver
B S3 Silver
C S1 Silver
C S2 Silver
C S3 Silver
Effic
iency (
%)
Mobility diameter (nm)
E11 5cm per s
E11 (5cm/s)
22Air Quality & Particle Technology (APT)
Pressure drop (Pa)
A E B D C
S1 71 76 62 57 54
S2 74 78 57 53 50
S3 75 80 59 60 66
The deviation in filtration efficiency is low among the different laboratories.
There is a deviation in pressure drop measured among the different laboratories.

10 1005 8 15 20 30 45 67 150 224 335 500
80
82
84
86
88
90
92
94
96
98
100
A S1 DEHS
A S2 DEHS
A S3 DEHS
B S1 DEHS
B S2 DEHS
B S3 DEHS
C S1 DEHS
C S2 DEHS
C S3 DEHS
E S1 DEHS
E S2 DEHS
E S3 DEHS
D S1 DEHS
D S2 DEHS
D S3 DEHS
A S1 Silver
A S2 Silver
A S3 Silver
B S1 Silver
B S2 Silver
B S3 Silver
C S1 Silver
C S2 Silver
C S3 Silver
Effic
iency (
%)
Mobility diameter (nm)
E11 5cm per s
E11 (5cm/s)
23Air Quality & Particle Technology (APT)
Pressure drop (Pa)
A E B D C
S1 71 76 62 57 54
S2 74 78 57 53 50
S3 75 80 59 60 66
The deviation in filtration efficiency is low among the different laboratories. Thus, statistical analysis does not
reveal outliers.
C
Green Color: stragglers
Red Color: outliers

E11(5cm/s)
24Air Quality & Particle Technology (APT)
m Sr Sl SR
20 98.4 0.3 0.2 0.4
30 96.22 0.48 0.83 0.96
45 92.98 0.74 1.02 1.26
67 90.759 0.877 1.056 1.373
100 90.196 0.849 1.962 2.138
150 91.27 0.90 1.56 1.80
224 94.61 0.85 1.05 1.35
335 97.00 0.47 1.11 1.21
Pressure drop (Pa)
A E B D C
S1 71 76 62 57 54
S2 74 78 57 53 50
S3 75 80 59 60 66
The deviation in filtration efficiency is low among the different laboratories. Thus, statistical analysis does not
reveal outliers and the variances are low for all the particle size range.
10 1005 8 15 20 30 45 67 150 224 335 500
80
82
84
86
88
90
92
94
96
98
100
A S1 DEHS
A S2 DEHS
A S3 DEHS
B S1 DEHS
B S2 DEHS
B S3 DEHS
C S1 DEHS
C S2 DEHS
C S3 DEHS
E S1 DEHS
E S2 DEHS
E S3 DEHS
D S1 DEHS
D S2 DEHS
D S3 DEHS
A S1 Silver
A S2 Silver
A S3 Silver
B S1 Silver
B S2 Silver
B S3 Silver
C S1 Silver
C S2 Silver
C S3 Silver
Effic
iency (
%)
Mobility diameter (nm)
E11 5cm per s
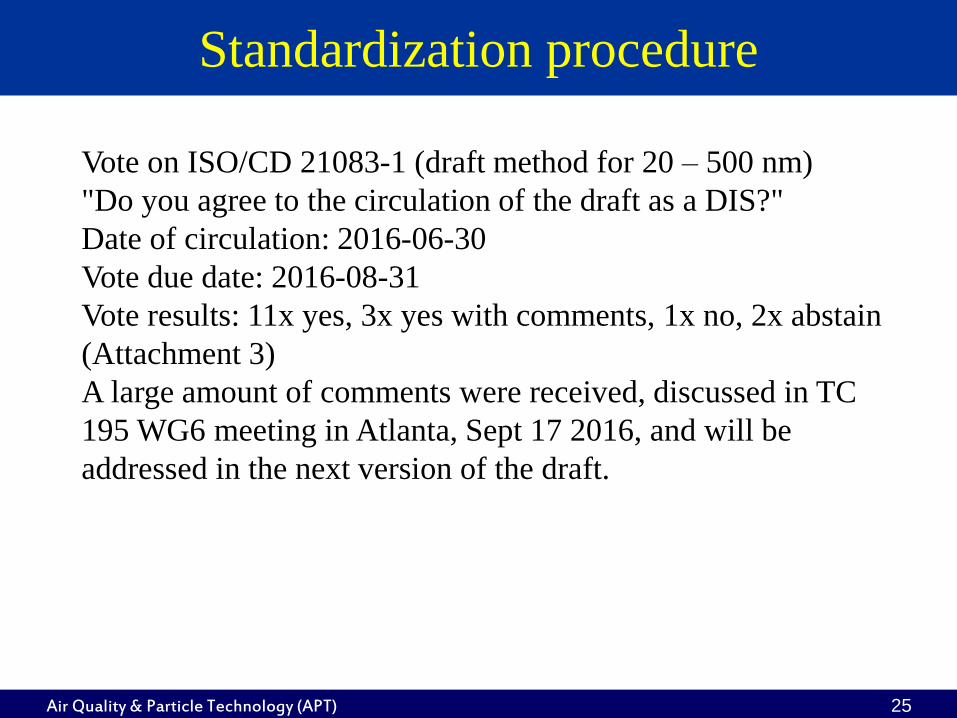
Standardization procedure
Vote on ISO/CD 21083-1 (draft method for 20 – 500 nm)
"Do you agree to the circulation of the draft as a DIS?"
Date of circulation: 2016-06-30
Vote due date: 2016-08-31
Vote results: 11x yes, 3x yes with comments, 1x no, 2x abstain
(Attachment 3)
A large amount of comments were received, discussed in TC
195 WG6 meeting in Atlanta, Sept 17 2016, and will be
addressed in the next version of the draft.
Air Quality & Particle Technology (APT) 25

Standardization procedure
Vote on ISO/CD 21083-2 (draft method for 3 – 20 nm)
"Do you agree to the circulation of the draft as a DIS?"
Date of circulation: 2016-07-01
Vote due date: 2016-08-31
Vote results: 11x yes, 3x yes with comments, 1x no, 2x abstain
(Attachment 4)
A large amount of comments were received, discussed in TC
195 WG6 meeting in Atlanta, Sept 17 2016, and will be
addressed in the next version of the draft.
Air Quality & Particle Technology (APT) 26
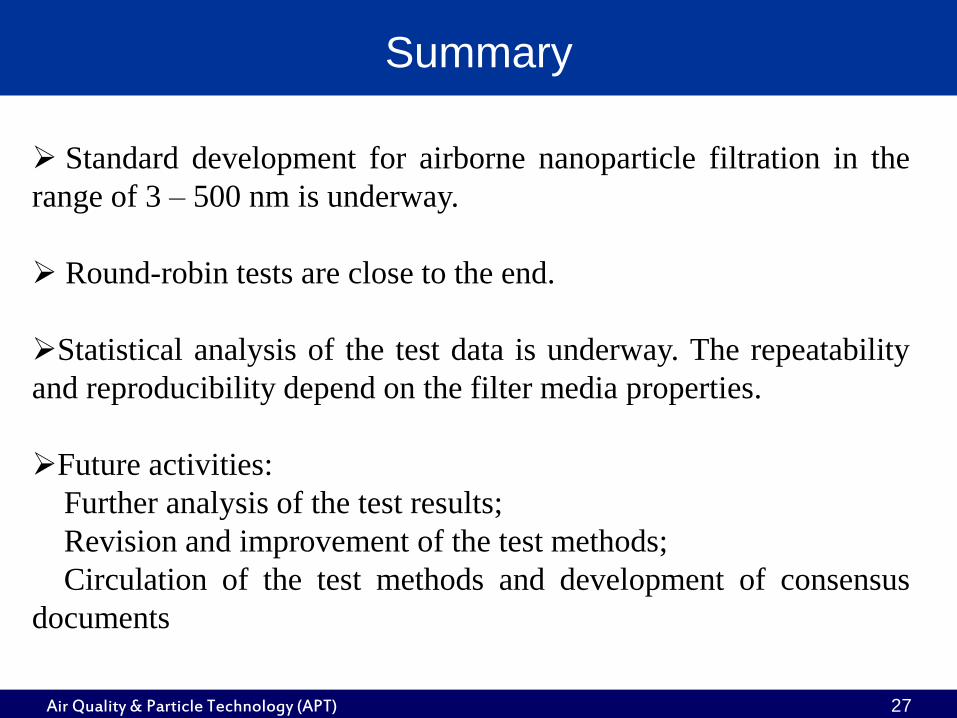
Summary
27
Standard development for airborne nanoparticle filtration in the
range of 3 – 500 nm is underway.
Round-robin tests are close to the end.
Statistical analysis of the test data is underway. The repeatability
and reproducibility depend on the filter media properties.
Future activities:
Further analysis of the test results;
Revision and improvement of the test methods;
Circulation of the test methods and development of consensus
documents
Air Quality & Particle Technology (APT)

28
Thank you
Air Quality & Particle Technology (APT)

Test procedure (1/2)
29
1. Preparatory checks
- The accuracy of instruments should be with in the specification of the
manufacturers.
- Zero check, purity check for test air and leakage check should be performed.
2. Pressure drop measurement
- Initial air pressure drop of clean filters should be measured.
3. Correction factors
- The factors, considering particles loss caused by the filter holder and filter
supporting screen, should be determined before the filtration tests.
Measuring location
Filter holder
Bac
kgro
und
Pre
-norm
Res
earc
hIn
terl
abora
tory
Tes
tsQ
ual
ific
atio
n
Air Quality & Particle Technology (APT)
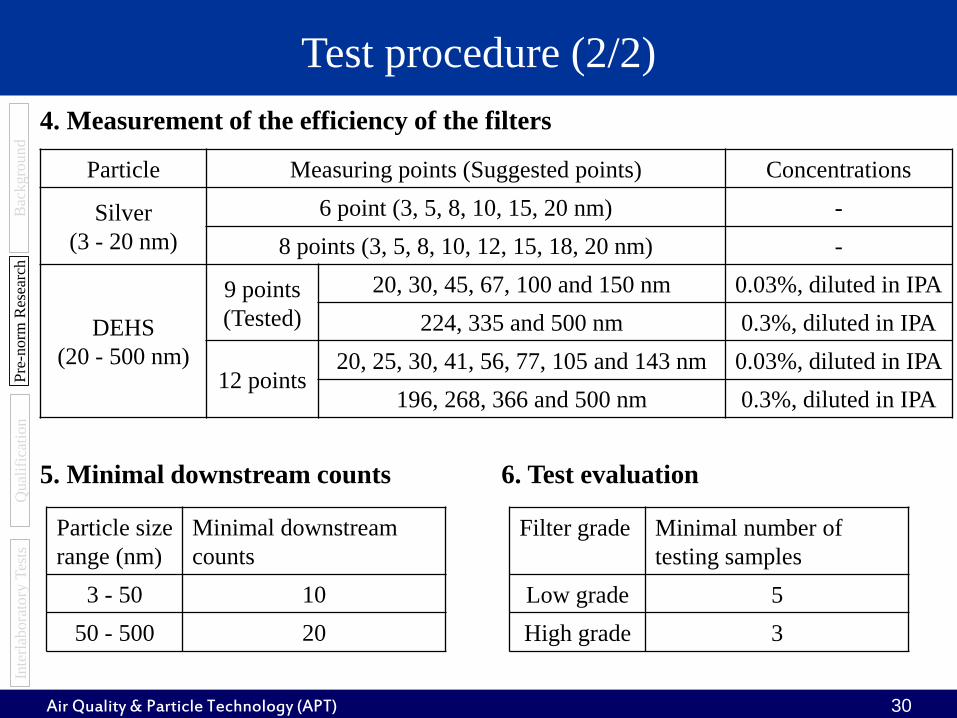
Test procedure (2/2)
30
5. Minimal downstream counts
4. Measurement of the efficiency of the filters
Particle Measuring points (Suggested points) Concentrations
Silver
(3 - 20 nm)
6 point (3, 5, 8, 10, 15, 20 nm) -
8 points (3, 5, 8, 10, 12, 15, 18, 20 nm) -
DEHS
(20 - 500 nm)
9 points
(Tested)
20, 30, 45, 67, 100 and 150 nm 0.03%, diluted in IPA
224, 335 and 500 nm 0.3%, diluted in IPA
12 points20, 25, 30, 41, 56, 77, 105 and 143 nm 0.03%, diluted in IPA
196, 268, 366 and 500 nm 0.3%, diluted in IPA
Particle size
range (nm)
Minimal downstream
counts
3 - 50 10
50 - 500 20
6. Test evaluation
Filter grade Minimal number of
testing samples
Low grade 5
High grade 3
Bac
kgro
und
Pre
-norm
Res
earc
hIn
terl
abora
tory
Tes
tsQ
ual
ific
atio
n
Air Quality & Particle Technology (APT)