Embed Size (px)
Citation preview

Inter-Generational Benefits of Improving Access to Justice for
Women: Evidence from Peru∗
Guadalupe E. Kavanaugh† Maria Micaela Sviatschi‡ Iva Trako§
September 28, 2017
Abstract
Domestic violence is a major concern in developing countries, with important social, economic
and health consequences. However, institutions do not usually address the problems facing
women or ethnic and religious minorities. For example, the police do very little to stop
domestic violence in rural areas of developing countries. This paper exploits the introduction
of women’s justice centers (WJCs) in Peru to provide causal estimates on the effects of
improving access to justice for women and children. These centers offer a new integrated
public service model for women by including medical, psychological and legal support in cases
of violence against women. Our empirical approach uses a difference in difference estimation
exploiting variation over time and space in the opening of WJC together with province-by-
year fixed effects. Exploiting administrative data from health providers, district attorney
offices and schools, we find that after the opening of these centers, there are important
improvements on women’s welfare: a large reduction in domestic violence, femicides and
female hospitalizations for assault. Moreover, using geo-coded household surveys we find
evidence that the existence of these services improves women’s health and increases women’s
threat points and, therefore, lead to household decisions that are more aligned with their
interests. Using administrative data on the universe of schools, we find large gains on human
capital for their children: affected children are more likely to enroll, attend school and have
better grades in national exams, instead of working for the family. In sum, the evidence in
this paper shows that providing access to justice for women can be a powerful tool to reduce
domestic violence and increase education of children, suggesting a positive inter-generational
benefit.
JEL Classification: J12, J16, I25, K38Keywords: domestic violence, access to justice, education, household bargaining
∗We are very grateful for the abundance of support, guidance, and helpful comments from Karen Macours. Wealso gratefully acknowledge all the helpful comments and suggestions from Martin Ravallion, Dominique van deWalle, Denis Cogneau, Sylvie Lambert, Gustavo Bobonis, John Giles, Suresh Naidu, Cristian Pop-Eleches, MiguelUrquiola, Bentley MacLeod, Jonas Hjort, Fabiola Alba and Maria Fernanda Rosales and all the participants ofthe Development Seminar at Paris School of Economics. We are responsible for all remaining errors.†Rutgers University, [email protected]‡Columbia University, Department of Economics, [email protected]§Paris School of Economics, [email protected]

1 Introduction
An accessible and fair justice system is thought to be important for economic development, so
much so that it was recently added as a United Nations Sustainable Development Goal.1 Access
to justice may be particularly important for vulnerable groups in developing countries, since
these groups are often unable to legally challenge violence and discrimination. In particular,
women are often unable to seek justice for domestic violence or receive equitable treatment
during a divorce (Duflo, 2012; Revilla, 1999). While research in this area has mainly focused
on addressing these issues through economically empowering women (e.g. Bobonis, Gonzalez-
Brenes and Castro, 2013; Angelucci, 2008; Aizer, 2010), there has been very little evidence on
the impact of improving access to justice for women in developing countries. Justice for women
is also important for understanding educational choices and the persistent gender gap across
generations. In addition, understanding the mechanisms through which better access to justice
for women can improve outcomes has implications for household bargaining more generally.
Domestic violence or intimate partner violence (IPV) remains a worldwide pressing social
problem, as every year one-third of women (30%) suffer physical and/or sexual intimate partner
violence (WHO, 2013).2 To address this issue, many developing countries have enacted more
comprehensive legislations to reduce violence against women, but these legal reforms have done
very little to curb its persistence since they lack a clear legal framework and do not address
institutional discrimination based on class, race and gender. For example, when women want
to file a domestic violence complaint, the regular police generally ignores them and sends them
home saying that “domestic disputes” are not a police matter. For this reason, in many cases
women do not trust these institutions enough to report these issues (e.g. Jubb et al., 2010;
Boesten, 2012).3
1The 2030 Agenda for Sustainable Development is a set of 17 ”Global Goals” with 169 targets between them.http://www.undp.org/content/dam/undp/library/corporate/brochure/SDGs_Booklet_Web_En.pdf
2Women who suffer from abusive in the household are more likely to report physical, mental, sexual andreproductive health problems (Campbell, 2002). Domestic violence may also limit their ability to take care oftheir children. An increasing literature on domestic violence shows that children exposed to domestic violenceare associted with a number of emotional and behavioral problems (e.g. Pollak, 2004; Carlson, 2000; Huth-Bocks,Levendosky and Semel, 2001; Koenen et al., 2003; Carrell and Hoekstra, 2010).
3Furthermore, in cases of family violence in rural Peruvian communities, women are always assumed to havea certain level of blame in a conflict (Revilla, 1999). According to Franco and Gonzalez (2009), the communityjustice based on customs presents many weaknesses when it tries to address the needs of women and children whoare victims of violence. They also find that such customs display cultural patterns based on the subordinationand discrimination of women.
1

As a result, during the same period, Peru, Mexico, Brazil, El Salvador and Ecuador, among
others have launched or expanded a special network of Women’s Police Stations or Women’s
Justice Centers. The WJC centers are specialized police or judicial institutions whose main
purpose is to improve access to justice to victims of domestic violence by providing legal, psy-
chological and medical support. Even though WJC centers are one such intervention that has
been gaining popularity, little attention has been paid on to the actual effectiveness of such
centers.
In this paper, we examine how introducing WJCs across all over Peru affects women’s status
and their children. Our findings reveal that providing better access to justice for women can
reduce domestic violence, femicides and female hospitalizations for assault and have positive
spillovers on children’s human capital by improving women’s health. After the opening of these
centers, femicides and hospitalizations for assault declined by 2-7% and children improved their
school attendance by 2%. Moreover, larger benefits are seen in girls at school. Finally, we also
find some evidence that after these centers opened, women resort more to formal institutions in
case of violence, suggesting an increase in trust on state institutions which might lead also to
an improvement in women’s intra-household bargaining power.
Our interest in Peru, as opposed to a different country which has implemented a similar
intervention, is particularly due to the fact that during the last decade the level of physical
and/or sexual intimate partner violence has been among the highest in the world and at the
same time women’s bargaining power is quite weak (e.g. Garcia-Moreno et al., 2006; Bott et al.,
2012). As a response to this endemic problem in the country, the Peruvian Ministry for Women
and Vulnerable Populations decided to create in 1999 the Women’s Justice Centers as part of
the National Program against Sexual and Family Violence. During the period 1999-2014, the
number of WJC centers has grown from 13 in the first year to 226 by the end of 2014, covering
100% of the 24 regions of Peru and 96% of the provinces.
To identify the casual effect, we use a difference in-differences strategy, which exploits vari-
ation created by the differential timing in the opening of the WJC centers and also the spatial
variation in the exposure of a school/household to a WJC center, together with province-by-year
fixed effects. We geo-match schools and households with detailed data on WJC’s locations and
founding years in order to construct two different measures of exposure to the WJC center: pres-
ence of WJC center within 1 kilometer (km) Euclidean buffer distance from the school/household
2

and presence of a WJC center in school’s/household’s district.
This empirical strategy allows us to compare changes in outcomes of schools and house-
holds (children and women) already residing in the proximity of a WJC center (“treatment
schools/households”) to those not yet reached by the program (“control schools/ household”).
Using the panel nature of the school level data, we control for school fixed-effects and initial
school characteristics in order to analyze how enrollment changes within a same school and
among initially-similar treatment and control schools upon the introduction of a WJC center in
the proximity of the school.
This paper benefits from multiple different types of geo-coded datasets: school level data,
individual and household-level data, administrative data on WJC centers, femicides and female
hospitalizations for assault, that allow us to analyze the effects at a very disaggregated level.
First, our school level data comes from the Peruvian School Census, which is a large geo-coded
panel dataset on primary and secondary school enrollment that covers the universe of schools in
Peru during the period 1998 to 2014. Second, our individual and household-level data comes from
the Peruvian Demographic Health Survey, which is a nationally representative cross-sectional
survey that contains rich information on demographic and socioeconomic characteristics of the
household members, as well as a detailed domestic violence module for married or cohabiting
women. The Peruvian DHS covers the period 2000-2014 and is geo-coded at the cluster level.
Third, the administrative data on WJC centers comes from the Peruvian Ministry for Women
and Vulnerable Populations (MIMP) and consists of a geo-coded directory of WJC centers and
their founding dates across all over Peru from 1999 till 2014. Finally, data on femicides and
female hospitalizations for assault at the district level come from administrative records of
the Peruvian Crime Observatory at the Ministry of Public Affairs and the Ministry of Health,
respectively.
Our main finding is that children’s human capital is affected positively by the introduction
of the WJC centers. We first show that the introduction of a WJC center within 1km of a school
is associated with an increase between 2% and 3% in the number of children enrolled in primary
school in the year after the center introduction. We also find evidence that after the opening
of a WJC center, children in primary and secondary school living in household’s located near a
WJC center are significantly more likely to attend school, have better national test scores, more
likely to pass the grade and they are also less likely to drop out of school. More specifically,
3

the probability that children reached by the WJC centers attended school and passed a grade
increases by approximately 2 percentage points, while drop out decreases by 1.8 percentage
points. These effects are localized within a few kilometers and they are mostly driven by girls
living in urban areas. Consistent with the results on education, we also find that girls are less
likely to be working after the opening of the WJC. These results are also robust to including
district specific trends and to limiting the sample to urban clusters and districts which ever have
a WJC center, and to the use of different datasets that measure the same outcomes.
The main threat to our identification strategy is time-varying unobservables that are corre-
lated to both the timing of the WJC center introduction and changes in education outcomes.
To ensure that our results are not driven by selection or time-varying unobservables, we perform
several falsification exercises and robustness checks. First, in order to control for the nonrandom
placement of the WJC centers, we also include a province-by-year fixed effect which controls
for any characteristics that may vary at the province and year level. By using province-by-year
fixed effects, our identification assumption is that treatment schools/households would otherwise
have changed similarly, on average, to control schools/households within their same province.
Second, we focus our analysis in the middle of the rollout period for which identifying as-
sumptions are likely to hold. In particular, we show that schools/households reached by the
WJC centers from 2006 till 2014 had similar pre-program trends. Thirdly, we show that WJC
center placement was not anticipated by changes in schooling.4 Lastly, we limit the samples
to areas most comparable to the those with WJC center presence: urban schools and urban
clusters of households, since the WJC centers were more likely to be located in more densely
populated areas. We further examine the results by limiting the sample to districts which ever
had a WJC center.
The next focus of this paper is to pin down the mechanisms driving these results. We propose
two potential mechanisms. Firstly, the introduction of WJC centers may have contributed to
4A central issue in our analysis in the fact that WJC centers are not placed randomly. Conversations withpolicymakers and WJC center managers suggest they choose where to locate primarily based on populationdensity, the level of infrastructure and proximity to several institutions, but there was no mention of locatingbased on anticipated increases in schooling or previous years schooling increases. We use the panel nature of theschool database to analyze the impact of WJC centers introduced in future years on current enrollment. If WJCcenter managers are targeting areas which have more rapidly increasing schooling, future WJC centers shouldalso correlate with changes in schooling. We do not find evidence for an impact of future WJC centers and theinclusion of future WJC centers does not affect our estimate of the impact of current WJC center. This placebotest suggests that WJC center placement was not anticipated by changes in schooling. Moreover, we also addressanother concern - that the results reflect changes in population after a WJC center opening - and argue that thisissue does not drive our results after controlling for total district population.
4

break the silence regarding violence against women and turning it into a public issue, with
the intention of improving access to justice. By making domestic violence more visible, these
specialized institutions may be changing the discriminatory social values and power structures
that underlie violence against women. Secondly, the presence of WJC centers may affect the
incidence of domestic violence and consequently children’s well-being in the household, either by
facilitating the disintegration of abusive relationships or by making the threat of incurring police
involvement, criminal penalties or issuing restraining orders towards the potential offender more
credible. Both mechanisms lead to the conclusion that WJC’s intervention in households with
abuse may change the behavior of offenders and victims by improving the situation of the woman
within the household and their ability to care for their children. Several economic theories of
household bargaining power suggest that policies aimed at affecting spouse’s outside option
from a marriage may also affect within-household distribution through changes in their relative
bargaining positions (McElroy and Horney, 1981; Manser and Brown, 1980). For instance,
economic empowerment of women is often considered a major tool in the fight against intimate
partner violence, even though its impact might be ambiguous.5 A possible explanation for
this is the fact that women in developing countries do not generally count with an effective
judicial protection or a credible threat in cases of domestic violence. In this study we analyze
an unexplored empowerment channel for women which is better access to justice.
Consistent with the domestic violence mechanism, we find that women who live within 1km
of a WJC center are significantly less likely to suffer from physical and emotional violence by
their spouse. At the same time, the presence of a WJC center in the district can be associated
with a suggestive reduction in the number of femicides and female hospitalizations for assault.
We also find suggestive evidence of an improvement in the bargaining power of women in the
household. In particular, we find that women living near a WJC center are more likely to make
joint decision-making with their husband, less likely to earn less than their husband and more
likely to earn as much as their husband. Moreover, we find that these women also experience
5On the one hand, employment opportunities such as conditional cash transfers or access to welfare servicesmay empower women by increasing their resources within the household; improve their outside options andbargaining status in their relationships; and decrease their exposure to violence (Farmer and Tiefenthaler, 1996;Stevenson and Wolfers, 2006; Aizer, 2010; Hidrobo and Fernald, 2013). On the other hand, an increase in theresources available to women may strengthen the incentives of men to use violence or threats of violence in orderto control these newly obtained resources or to regain decision-making power within the household. As a result,women may become more vulnerable to mistreatment (Bobonis, Gonzalez-Brenes and Castro, 2013; Eswaran andMalhotra, 2011; Bloch, Rao and Desai, 2004).
5

better health: they are more likely to have better weight.
These results are also consistent with a human capital model in which parents maximize
earnings and the education of their children. When domestic violence is prevalent, women are
more likely to be sick and are not able to do the domestic work and take care of their children.
As girls are substitute of mothers in domestic chores, the opportunity cost of schooling is large
and thus, they are more likely to work at home when the mother is exposed to domestic violence.
To the best of our knowledge, this is the first quantitative analysis that attempts to explore
the impact of an unexamined dimension of institutional intervention which provides better access
to justice for women, on the prevalence of domestic violence, femicides and its spillover effects
on children’s human capital. This study does not only provide evidence of the effectiveness
of an important component of Peru’s public policy aimed at curbing domestic violence, but it
also contributes to the literature on gender development by providing a new insight on women’s
empowerment in developing countries and its indirect effect on children’s education outcomes.
This paper draws upon research in the intersection of children’s human capital, domestic
violence, gender and development. First, it relates to the literature on effective policies at
increasing school enrollment in the developing countries (e.g. Duflo, Hanna and Rya, 2012;
Kremer et al., 2005; Kremer, 2003; Duflo, 2000). Second, it provides another factor that could
reduce gender gaps. While most of the focus has been on the economic development and gender
quotas, here we provide evidence that improving access to justice by improving women’ health
and empowerment can be an effective tool to increase girls education.
The remainder of this paper is organized as follows. In Section 2 we discuss the previous
literature on domestic violence in more depth. Section 3 presents a brief background on the
prevalence of domestic violence in Peru and on the WJC center intervention. Section 4 describes
the data. Section 5 presents the empirical strategy. Section 6 presents the main results. Section
7 investigates the channels through which WJC center introduction affects schooling. Section 8
provides supporting evidence consistent with the identification assumptions. Section 9 concludes.
2 Previous Literature
There are two bodies of literature on domestic violence. The first one focuses on the risk
factors for domestic violence, while the second one focuses on the effects of intimate partner
violence on women’s outcomes, including those for children living in households with domestic
6

violence. While most fundamental studies on the causes and effects of domestic violence center
in developed countries, especially United States, a new wave of literature has expanded the scope
of study to developing countries due to this form of violence’s perceived obstacle to the broader
development agenda.
There is a growing literature on causal channels that impinge on the prevalence of domestic
violence. One type of this literature focuses on the intra-household bargaining channels that
affect domestic violence through improvements in women’s outside options. For example, Aizer
(2011) shows that a decline in the gender wage gap reduces violence against women in Califor-
nia. The author’s interpretations is that a relative improvement in female income reduces her
exposure to spousal violence by increasing her bargaining power. Stevenson and Wolfers (2006)
find that the adoption of unilateral divorce laws in the United States resulted into a drop in fe-
male homicide and domestic violence. In a more recent study, Brassiolo (2016) finds a decline in
spousal conflict and in extreme partner violence in response to introducing less stringent divorce
legislation in Spain. Using victimization data from the US, Miller and Segal (2016) find that as
female representation increases among police officers in an area, violent crimes against women
in that area, and especially domestic violence, are reported to the police at significantly higher
rates. They also show that increases in female officer representation are followed by significant
declines in intimate partner homicide rates and in rates of repeated domestic abuse.
Another strand of this literature focuses on the heterogenous effects of conditional cash
transfer programs on domestic violence. Bobonis, Gonzalez-Brenes and Castro (2013) analyze
the effect of the Mexican program Oportunidades on domestic violence and find that beneficiary
women are less likely to be victims of physical violence but are more likely to receive threats of
violence. Using the same randomized evaluation, Angelucci (2008) finds that among households
that received small transfers, alcohol-related domestic violence declined, whereas in households
that received large transfers, the level of spousal abuse from husbands with particularly low
levels of education increased.
In addition, recent research has observed that in many contexts, increased autonomy and
women’s entry into the formal labor market is often associated with a higher likelihood of ex-
periencing violence in Colombia (Friedemann-Sanchez and Lovaton, 2012), Bangladesh (Heath,
2012; Rahman, Hoque and Makinoda, 2011) and India (Eswaran and Malhotra, 2011). Indeed,
the paid employment or the non-labor income of a female intimate partner may be threatening
7

for some men, especially those who are unemployed. Abusive partners may perceive a loss of
status and power and use violence or coercion to regain control.
However, less literature has been written on the consequences of intimate partner violence
(IPV) on children’s outcomes, especially in developing countries. Previous research has shown
that children exposed to domestic violence are associated with a number of health, emotional
and behavioural problems including, low birthweight, aggressive behaviour, bullying, depression,
violence in adulthood and also diminishing academic performance.6 With respect to children’s
education outcomes, studies conducted in the United States have found lower reading levels
among teenagers who have been exposed to domestic violence (Thompson and Whimper, 2010),
lower academic achievement in math and reading for children in elementary and middle school
(Kiesel, Piescher and Edleson, 2011), lower scores on standardized tests for children ages 6 to 17
- especially for girls and children younger than 12 years old (Peek-Asa et al., 2007)- and more
grade repetition and truancy among children 6 to 15 years old (Emery, 2011). Moreover, Carrell
and Hoekstra (2010) show that exposure to school peers from troubled families significantly
decreases reading and math test scores and increases misbehaviour in the classroom.
Among the scattering studies conducted in developing countries, Jayasinghe, Jayawardena
and Perera (2009) show that children who were directly or indirectly exposed to domestic violence
at home had poor school attendance and lower academic achievement on average. Similarly,
Durand et al. (2011) find that Brazilian children 5 to 12 years old who lived with mothers
exposed to psychological, physical and sexual domestic violence were more likely to be among
those dropping out of school or failing a school year.
What is perhaps most striking about this literature is that rigorous studies attempting to
evaluate the effectiveness of various intervention strategies aimed at curbing domestic violence
are quite scarce. This is mainly due to the difficulties and ethical considerations on collecting
reliable data on domestic violence. Another difficulty is dealing with the endogeneity problem.
Randomized experiments, for instance, are extremely rare. In addition, even though WJC
centers are one such intervention that has been gaining popularity, little attention has been
paid on to the actual effectiveness of such centers on eradicating violence against women and,
particularly, there is very little evidence on the extent of spillovers on their children. Two
6See Edleson (1999); Wolfe et al. (2003); Pollak (2004); Fantuzzo et al. (1997); Koenen et al. (2003); Holt,Buckley and Whelan (2008); Baldry (2003); Carlson (2000); Currie (2006); Black, Sussman and Unger (2010);Aizer (2011).
8

exceptions are the studies of Aguero (2013) and Perova and Reynolds (2017), which exploit
the variation stemming from the gradual municipality/district -level rollout of the WPS/WJC
centers in Peru and Brazil, respectively. We complement these papers by providing causal
estimates at a more disaggregated level on wide number of outcomes that allow us to disentangle
mechanisms and study spillover effects on children.
To sum up, the research to date has outlined much of the domestic violence problem and
provided some fundamental understanding of its causes and consequences, but has left policy
makers with little on which to build effective interventions. In this light, our paper contributes
to the literature on domestic violence by focusing on an unexplored empowerment channel for
women which is better access to justice and the role of women’s justice centers (WJC) in breaking
the cycle of violence and generating a spillover effect on their children’s outcomes.
3 Background
3.1 Domestic Violence in Peru
Domestic violence or intimate partner violence (IPV) is one of the most pressing social problems
in Latin America and the Caribbean. Even though the region has received much attention on
conflict, crime, political and economic instability, it is easily overlooked that violence against
women is among the most pervasive types of violence in the region (Fregoso and Bejarano, 2009;
Heinemann and Verner, 2006; Londono et al., 2000).
Among the Latin American countries, Peru has gained a considerable amount of attention
in recent years, largely due to the high prevalence and severity of domestic violence in this
country. According to a study carried out in 10 countries by the World Health Organization in
2006, the prevalence of physical violence by a male partner ranges from 13% in Japan’s urban
regions to 61% in rural areas of Peru and 49% in urban areas of Peru (Garcia-Moreno et al., 2006;
Morrison, Orlando and Pizzolitto, 2007). Flake and Forste (2006) study the relationship between
household characteristics and the likelihood of experiencing domestic violence in Colombia,
Dominican Republic, Haiti, Nicaragua and Peru. They find that although the prevalence of
domestic violence is high in all five countries, Peru had the highest percentage of instances at
38.9% followed by Nicaragua (26.1%), Dominican Republic (22.6%), Colombia (19%) and then
Haiti (15.7%). Data collected by Instituto Nacional de Estadistica e Informatica (INEI) through
9

the Demographic Health Surveys have found that although the prevalence of violence (physical
and/or sexual) affecting women has declined from 41.2% to 32.6% from 2000 to 2015, it still
remains quite high (INEI, 2001, 2015).7 All this evidence suggests that Peru is very high on the
world ranking of registered cases of domestic violence and among the leaders in Latin America
in terms of prevalence of violence against women.
While the majority of IPV is perpetrated within the domestic sphere, Peru’s institutions
also have a reputation for gender-based violence, including sexual violence. For many decades,
women in Peru have been subject to abuse- even by the one entity supposed to protect them:
the state. For instance, in the 1990s and early 2000s, Peru witnessed one of the most heinous
violations of women’s rights in recent history: under the administration of Alberto Fujimori,
thousands of women were forcibly sterilized in an attempt to prevent overpopulation and poverty.
The state is also complicit in institutional violence against women, ranging from insults to injury
in its hospitals, health centers and schools (Boesten, 2012).
Despite legislative progress in identifying and addressing the problem, the legal system has
constantly been characterized as ill-equipped to efficiently process complaints. In the early 1990s,
Peru was one of the first countries in the region to develop legislation and policy to address
violence against women. The Law for Protection from Family Violence was first adopted in
1993 and strengthened in 1997, attempting to codify IPV as a criminal offence while producing
a distinct and expedited procedure for victims to lodge complaints. However, these legal reforms
in the area of violence against women lacked a clear legal framework and have done very little
to curb its persistence. In short, “many women do not bother to file complaints because the
legal system is too slow to act” (UNHCR, 2010).
A major contributor to the persistence of domestic violence in Peru is a deeply embedded in-
equality of gender roles and status, which is usually represented through the notion of machismo.
Machismo defines gendered behaviors, which makes Peruvian families more susceptible to do-
mestic violence, since women are expected to accomplish familial obligations unconditionally
within a patriarchal family system. In addition, the high rates of intimate partner violence
might also be explained through dynamics of historical and cultural factors which are based
on the subordination and discrimination of women (Mitchell, 2013). Within this context, the
persistence of violence against women is a clear sign of women disempowerment, which impinges
7See Figure 4
10

on women’s autonomy within the household.
3.2 Centros de Emergencia para Mujeres (WJC) Program
In the last 15 years, there have been significant efforts to prevent, punish and eradicate vio-
lence, particularly in the case of violence against women. As a response to one of the highest
rates of domestic violence in Latin America, the Peruvian Ministry for Women and Vulnerable
Populations decided to create in 1999 the women’s justice centers (Centros de Emergencia para
Mujeres) as part of the National Program against Sexual and Family Violence.8
The Centros de Emergencia para Mujeres (WJC) are public centers which offer specialised
attention to victims of domestic and sexual violence, from an inter-disciplinary and integral
approach that includes legal, social and psychological dimensions. This program is aimed at
strengthening the capacities of the police, prosecutors and judicial officers to detect the risk of
domestic violence and also assist the victims. Aside from that, their aim is also to undertake
awareness-raising and rehabilitation programs for the victims of domestic violence. In this
regard, the WJC centers have put in practice courses for training justice promoters ‘facilitadoras
en accion”, which are volunteer women involved in activities and campaigns that raise awareness
about the problem of domestic violence (MIMDES, 2007).9
Basically, the idea of these centers is to centralize the different stages that a victim of
domestic violence has to go through - police station, attorney’s office and medical doctor- in
order to reduce as much as possible the time dedicated to issue the complaint and to follow the
legal procedure in the corresponding court of justice. The service in these centers is provided
free of change and is staffed by representatives of various government institutions such as police
officers, prosecutors, counsellors, psychologists and public welfare agents in order to help the
victims of domestic abuse.
The first women’s justice center was located in the District of Lima in 1999. In order to
provide more protection and access to justice to more victims of domestic violence, every year
more centers have been implemented at the national level. During the period 1999-2014, the
8The Peruvian Ministry for Women and Vulnerable Populations, known as Ministerio de la Mujer yPoblaciones Vulnerables - (MIMP) used to be called as Ministry for Women and Social Development (Min-isterio de la Mujer y Desarrollo Social - MIMDES) when the WJC center program was rollout in 1999.http://www.mimp.gob.pe/contigo/contenidos/pncontigo-articulos.php?codigo=14
9Ministerio de la Mujer y Desarrollo Social. 2007. ¿Que son los Centros de Emergencia Mujer?. Available athttp://www.mimp.gob.pe/files/programas_nacionales/pncvfs/Centros_Emergencia_Mujer_MIMDES1.pdf
11

number of centers has grown from 13 in the first year to 226 by the end of 2014, covering 100%
of the 24 regions of Peru and 96% of the provinces (188 of 196 provinces) (Figure 1). However,
the program has been implemented more intensively between 2006 and 2014: from 48 WJCs
in 2006 to 226 in 2014, which is an important measure. From a geographical coverage point of
view, by 2014 most of the WJCs were concentrated in Metropolitan Lima and Lima Provinces
(31 WJCs); in the Callao region there were 4 WJCs; the rest of the coastal region had 46 WJCs;
in the sierra region there were 117 WJCs and in the jungle region there were 28 WJCs. The
location of these centers is distributed mostly in urban areas.
According to statistics from the MIMP, the number of domestic violence cases registered in
the WJC centers has increased substantially: from 29,759 in 2002 to 50,485 in 2014 (See Figure
5). Most of the domestic violence cases reported in the WJC centers are of women between 25
and 45 years old (40%). However, the WJC centers also receive many reports of children and
teenagers (0-17 years old), which constitute around 30% of the total cases. A report from the
Peruvian Ministry for Women and Vulnerable Populations in 2009, which consists of surveys
and interviews in 51 women’s justice centers located all over Peru during 2006-2008, shows that
for the majority of the women (75%) who attended a WJC centers, domestic violence stopped
during and after the intervention of the WJC center. However, a smaller proportion of women
(25%) indicated that domestic violence did not stop in the household even after having attended
a WJC center (MIMDES, 2009).10
Therefore, it is particularly important to evaluate not only whether the opening of the WJC
centers has an effect on the incidence of domestic violence, but also whether these centers act
a mechanism of women empowerment which indirectly might also enhance women’s ability to
care for their children through better social protection and access to justice.
4 The Data
This paper makes use of three different types of datasets which provide variation across geo-
graphical regions and time at different levels of aggregation: school level data, individual and
household-level survey data and administrative data on WJC centers, femicides and female
10Ministerio de la Mujer y Desarrollo Social. 2009. Investigacion operativa: “Eficacia de la intervencion delos Centros Emergencia Mujer”. Available at http://www.mimp.gob.pe/files/programas_nacionales/pncvfs/
estadistica/eficacia_intervencion_cem.pdf
12
hospitalizations for assault at the district level.
4.1 School Level Data
The school level datasets we use are the Peruvian School Census (Censo Escolar, CE) and the
Census Evaluation of Students (Evaluacion Censal de Estudiantes, ECE). The Peruvian School
Census is a large panel dataset on primary and secondary school enrollment, which covers
the universe of schools in Peru during the period 1998 to 2014. This dataset is collected on
a yearly basis by the Peruvian Ministry of Education, with exception of the year 2003 and it
contains a rich set of information at the school level. More specifically, the School Census collects
comprehensive data on the total number of enrolled students by age, grade and gender. These
data are designed to reflect enrollment (not attendance) statistics corresponding to the months
of May-July. The School Census also collects data on school characteristics, such as language
of instruction, public or private, urban or rural area and other physical plant characteristics
(i.e. electricity, piped water etc). We complement these data with the Census Evaluation of
Students, which contains the standardized test scores of a national exam administered every
year to all primary school students in second grade during the period 2007-2014. This exam has
two portions: math and language (Spanish) skills.
Each school in these datasets is given a unique ID number, which allows us to follow schools
over time. In addition, one of the main advantages of these school datasets is that they are
geo-coded, which means that we can observe the exact location of the school. The geographic
coordinates of the schools allow us to combine these data with the WJC center’s locations, in
order to see whether the area/district of the school is located near the WJC center and thus
affected by the opening of these centers that provide specialized attention to victims of domestic
and sexual violence.11
Panel A of Table 1 shows the years of data coverage and the number of schools from 2006
till 2014, which is the period of analysis of our study. In the later years, the dataset covers a
larger share of schools. It is important to note that this dataset is not a balanced panel because
during the period of study some schools have closed, while others have opened. In addition,
as mentioned above, there is no data available for the year 2003, since data for this year was
not collected. Although this means we do not have a balanced panel, by including school fixed
11See Figures A-1 and A-2.
13

effects we ensure that we compare the same schools over time. The main analysis, then, draws
on a nine-year unbalanced panel dataset of 36.994 primary schools (grades one through six) and
12.811 secondary schools (grades one through five).12
Panel C of Table 1 provides some summary statistics on school enrollment and school char-
acteristics. The average primary school in our sample has 95.9 students, while the average
secondary school has 175 students. The proportion of primary schools is higher in rural areas,
while secondary schools are more likely to be found in urban areas. The majority of primary
schools are public and teach in Spanish language, but there is also a small proportion that teach
in Quechua and other native languages. In contrast, a large proportion of secondary schools
(40%) are private and in almost all of them the language of instruction is Spanish.
A final important issue of the School Census data is that it measures total number of children
enrolled, not enrollment/attendance rates. This may lead to the concern that our results reflect
changes in population. However, we discuss this issue in greater detail in Section 5. In addition,
we also use, as a robustness check, the Peruvian Demographic Health Survey (2006-2014) to
estimate the share of children who are attending school.
4.2 Individual and Household Level Data
Since we do not observe enrollment rates with the School Census, we also use the Encuesta
Demografica y de Salud Familiar (ENDES), which is the Peruvian version of a Demographic
and Health Survey (DHS) to estimate the share of children in primary and secondary level
who are enrolled and attending school. In order to be consistent with the school data, for this
analysis we use the Peruvian DHS which also covers the period 2000-2014. The Peruvian DHS
is exceptionally a continuous survey, which means that the data is collected every year. These
surveys are cross-sections designed to be representative at the national and regional levels. The
DHS employs a stratified random cluster sampling procedure in which the country is divided into
several primary sampling units (in this case, districts) and clusters of households are randomly
selected.
In addition to the standard survey which includes demographic and socioeconomic char-
acteristics of the household members (especially for women and children), the Peruvian DHS
12The primary-school sample covers between 4.1 and 3.5 million students each year, whereas the secondaryschool sample covers between 2.3 and 2.7 million students.
14

also includes a domestic violence module which asks eligible women if they have ever experi-
enced physical, sexual or emotional abuse from their current or previous partner in the last
12 months.13 While all women between the ages of 15 to 49 are asked to participate in the
standard survey, only one women in each household, who has ever been married or partnered,
is randomly selected to complete the domestic violence module. Women who are never married
or never cohabited are excluded from the sample. This selection process is taken by the DHS
program in order to minimize underreporting of domestic violence events.14
The DHS captures four different types of domestic violence: moderate physical violence,
severe physical violence, sexual violence and emotional violence.15 Since the last one is less
visible and more difficult to measure, in this study we define exposure to a domestic violence
event if the woman has ever experienced any type of moderate, severe or sexual violence during
the last 12 months. The main advantage of using this household survey is that we can link
children’s school attendance status with their mother’s self-reported domestic violence. This
information is crucial in order to be able to understand the mechanisms behind the results.
Panel B of Tables 2 and 3 provides summary statistics on children’s school attendance status
and on women’s domestic violence during 2006-2014, respectively. According to the Peruvian
DHS, the school attendance rate in primary level is 97% for both boys and girls, which is almost
universal. The school attendance rate in secondary level is also quite high (89%) and very similar
between genders. Given that secondary school is not compulsory, the drop-out rate reaches 9%
13It should be noted that though this is an important measure of domestic violence, it does not report thedifferent forms of gender-based violence that affect women beyond spouses and inter-family relationships.
14The domestic violence module of questions is implemented only to a subsample of the women selected forthe Peruvian DHS sample. There are three security and ethical precautions increasingly mandated by the DHSprogram for the collection of data on domestic violence. The first requires that the interviewer does not continuewith the questions on domestic violence if privacy cannot be ensured. In general, the interviewers are womentrained to elicit trust from the respondents. The second requires that only one eligible woman in each selectedhousehold is to be administered the module questions. In sample households where more than one woman iseligible for the DHS survey, the domestic violence module is administered to only one randomly selected woman.By interviewing only one woman in each household, possible security breaches, due to other persons in thehousehold knowing that information on domestic violence was given, are minimized. The third requires that thedomestic violence questions should be only administered to ever-married or cohabiting women, even though theDHS sample includes all women age 15-49. Underreporting of domestic violence events is quite low, as only 1%of the eligible women was not interviewed because privacy was not made possible in the household.
15The DHS defines moderate physical violence if the woman experienced at least one of these acts from theirspouse or partner:(a) spouse ever pushed, shook or threw something, (b) spouse ever slapped respondent, (c)spouse ever punched respondent with fist or something harmful, (d) spouse ever kicked or dragged respondent.Severe physical violence is defined if the woman experienced at least one of the following acts:(e) spouse ever triedto strangle or burn, (f) spouse ever threatened with knife/gun or other weapon, (g) spouse ever attacked withknife/gun or other weapon. Sexual violence is defined if the woman experienced at least one of the following acts:(h) spouse ever physically forced sex when not wanted, (i) spouse ever forced other sexual acts when not wanted(j) spouse ever twisted arm or pulled hair.
15

of the students in this educational level. As for the prevalence of domestic violence, the data
indicate that 39% of ever-partnered Peruvian women declared to have experienced abuse from
their spouse during the last 12 months.
In addition, the Peruvian DHS also records GPS coordinates for every cluster of households
in a certain district, which allows us to measure not only presence of WJC center in the district
of residence but also proximity to the WJC center. Although this data was collected yearly,
in this study we were able to obtain the GPS cluster locations only for the 2000, 2004-2008,
2009, 2010, 2011 and 2014 Peruvian DHS Surveys.16 Since the DHS does not disclose the name
of the villages (centros poblados) were the clusters are located, the final sample is a repeated
cross-section of individuals (children and women), where the lowest geographical unit we can
condition on is the district.
Our concern with this database is linked to the fact that GPS locations of the sampled DHS
clusters of households are displaced before public release to preserve confidentiality of respon-
dents. The GPS displacement is randomly carried out so that: urban clusters are uniformly
displaced up to 2 kilometers and rural clusters are displaced up to 5 kilometers, with 1% of the
rural clusters displaced up to 10 kilometers. In addition, the displacement is restricted so that
the points stay within the second administrative level, which is the province. Therefore, the GPS
displacement procedure introduces a random error, which can substantively affect the results of
the analysis (Burgert et al., 2013). Perez-Heydrich et al. (2013) propose several recommenda-
tions in order to reduce any distance measurement error. Firstly, they suggest that the amount
of measurement error depends on the spatial density of the resource facilities. As the density
of the resource facilities decreases, the probability that a DHS cluster is linked to the correct
closest WJC center increases for all types of locations (urban and rural). In Peru, there are a
total of 226 WJC centers by 2014, which means that the spatial density of the WJC centers is
quite low and, thus, the measurement error is quite reduced. Secondly, the authors recommend
to study the effect of the service within a reasonable buffer distance, rather than using the
closest-distance to the resource facility. For this reason, we are going to measure exposure to
the WJC center through different groups of Euclidean distance buffers. Lastly, we are also going
to limit the analysis to urban areas because in these locations the range of displacement is less
than in rural areas.
16See Figure A-3.
16

4.3 Administrative Data on WJC centers, Femicides and Female Hospital-
izations for Assault
Information on the rollout of the WJC centers was provided by the Peruvian Ministry for
Women and Vulnerable Populations (MIMP) and consists of a directory of WJC centers across
all over Peru. This directory contains the name of the WJC centers, their founding dates (date-
month-year), their administrative locations (district-province-department) and their addresses
during the period 1999 to 2014. By using the administrative locations and addresses provided
in the directory of the MIMP, we were able to geo-code all the WJC centers, which allows us to
have not only the district where they are located but also their exact GPS location.
This data collection project resulted in a dataset of 226 WJC centers from 1999 till 2014.
Figure 1 shows a histogram of WJC center founding dates and it also illustrates the evolution of
the opening of WJCs since 1999 till 2016, while Figure 2 maps the rollout of the WJC centers at
the national level, which allows to visualize the extensiveness and national scope of the program.
From both graphs, we can clearly see a substantial growth in the number of centers over time,
where 81% of them are founded after the year 2006.
Data on the number of femicides at the district level was obtained from the Peruvian Crime
Observatory at the Ministry of Public Affairs and it covers the period 2009-2015. This data is
recorded by each district attorney office in the country. We complement this information with
data on female hospitalizations for assault at the district level, which was obtained from the
Peruvian Ministry of Health. This information is recorded by different health facilities such as
hospitals, health clinics etc. The sample of female hospitalizations for assault includes women
between the ages of 18 and 59 and covers the rounds 2007, 2012, 2013 and 2014.
4.4 Measuring Exposure to the WJC Centers
In order to be able to match the data on WJC centers with the data on education, we construct
two measures of exposure to the program. The first measure uses the GPS coordinates of the
child’s school/DHS cluster of residence and the GPS coordinates of the WJC centers in order
to measure a 1 kilometer Euclidean buffer distances from every school/DHS cluster. For this
method, the Euclidean buffer of 1km was first centered on each school/DHS cluster and then
each school/DHS cluster was linked to a WJC center if the WJC center falls within the buffer,
without consideration of district administrative borders. For instance, a school/DHS cluster
17

located within 1km of a WJC center founded in 2008 is coded as having a WJC center within
1km of the school/DHS cluster since the 2008 school year. Figure 3 shows a visual representation
of the Euclidean buffers for two specific regions in Peru, Lima and Tumbes.
The second measure matches the presence of a WJC center in the district based on its date
of opening and location, with the district of the school/DHS cluster of residence. For instance,
a school/DHS cluster in the district of Lima (150101) with a WJC center introduced in 2006 is
coded as having a WJC center in the district of Lima since the 2006 school year.
Our preferred measure is the one that uses the Euclidean buffer since we want to estimate
the impact of having a WJC center in the neighborhood of the school/household. The second
measure is used as a robustness check because it might not always capture accurately the impact
of the WJC centers due to the fact that districts in Peru have very different sizes. Some districts
are very big, while other are very small. Panel B of Table 1 and Panel A of Tables 2 and 3
shows descriptive statistics of exposure to the WJC centers at the school and individual level.
The main reason for our choice of a 1km distance buffer instead of a larger buffer is not only
because we believe that these centers have a very localized effect, but also because the measure
of exposure using a 5km Euclidean buffer seems to be very similar to the one that uses presence
of WJC center in the district.
5 Empirical Strategy
5.1 Placement of WJC centers
A central methodological issue in our analysis is the fact that WJC centers are not placed
randomly across the country. Even though our analysis will take advantage of variation over
time, which will account for any fixed differences across areas, it still remains important to
understand what drives placement since placement decisions may not be orthogonal to other
factors that could affect education outcomes.
We address this concern in a number of ways which lead us to believe that the link between
the opening of the WJC centers and education outcomes is casual. First, we had several dis-
cussions with the Peruvian policymakers and WJC center managers about the location choices.
Since the foundation of the first WJC center in 1999 till the end of 2005, the primary criteria
they cited when deciding where to locate were population density and level of infrastructure at
18

the regional level. In this stage, capitals and large cities were prioritized locations to open a
WJC center. Starting from 2006, after the decentralization process which transferred the re-
sponsibility of the WJC centers to the local governments (districts), the Peruvian policymakers
decided to open new WJC centers at the district level and they incorporated additional criteria
such as proximity to police stations, district attorney offices (known as fiscalias) and health
establishments. Even though program guidelines suggested that priority should be given to
poorer districts with sufficient judicial and medical infrastructures, in several occasions, polit-
ical representatives had certain autonomy in deciding the order in which districts received the
program. However, our conversations with the Peruvian policymakers suggest that educational
considerations, and in particular enrollment rates or schooling performance, were never factored
into program placement decisions.
We are able to evaluate this endogenous placement statistically using our data. To do this
we estimate, at the district level: (a) the determinants of having a WJC center by the end of
the sample in 2014 and (b) the determinants of adding a WJC center during 2006-2014, which
is the period when the program grew substantially. We focus on several variables at the district
level cited by the Peruvian policymakers such as: number of justice courts, number of district
attorney offices, number of police stations and number of health establishments. We also control
for district population at baseline and department fixed-effects. Moreover, in order to verify that
education patterns before the program do not predict where the WJC centers are introduced, we
also control for pre-program changes in primary and secondary school enrollment at the district
level.
The results from these regressions are shown in Table 4. In general, the results corroborate
the evidence we collected from our conversations with the Peruvian policymakers and WJC
center managers. Districts with more police stations, more district attorney offices, more health
establishments and more densely populated are more likely to have WJC centers by 2014 and
more likely to add them during 2006-2014. Clearly, urban areas with more infrastructure devel-
opment are more likely to have these specialized centers for women. In addition, pre-program
changes in primary and secondary district enrollment do not seem to have any impact. Neither
coefficient is statistically significant and both are very small. This result suggests that WJC
center placement between 2006-2014 was not based on pre-program changes in schooling.
Finally, we note two additional concerns that might threaten the validity of our research
19

design. First, one might be worried that another shift (e.g. a government program or policy
change) might be rolled out during the same period and in the same places as the WJC centers,
which might also have an impact on education outcomes. An obvious candidate is the CCT
program Juntos, which was launched in September of 2005, right at the time when the WJC
centers started to be implemented more intensively.17 In addition to this, Juntos integrates two
broad objectives: in the short run, it aims to reduce poverty by providing households with cash
transfers; and in the long run, it aims to break the inter-generational transmission of poverty
by promoting human capital through improving access to education and health services.
In spite of this, several reasons lead us to believe that Juntos is not a confounding factor in
our empirical strategy. Districts were selected for program participation based on an index that
includes poverty and percentage of villages affected by violence during civil conflict. The aim of
Juntos was to reach some of the most vulnerable and marginalized segments of the population
and focused particularly on rural areas with high poverty rates and limited access to State
services.18 Figure A-6 presents a map showing the rollout of the CCT program. By 2014, about
1142 districts had CCTs and 225 districts had WJC centers. However, more than half of the
districts with WJC centers (123 districts) were not covered by the CCT Juntos program. This
evidence clearly suggests that WJC centers were more likely to be implemented in urban areas,
while the CCT program was more likely to cover dispersed populations in the poorest rural
areas. We test this assumption more directly by analyzing whether the WJC placement at the
district level was correlated with the CCT Juntos implementation. Columns 2 and 4 in Table 4
indicate that the WJC center placement was not determined by the rollout of the CCT Juntos
program.19
The second concern related to WJC center placement is that if we estimate the impact of
17See Figure A-4 on the presence of both programs at the district level and Figure A-5 on the timing ofCCT Juntos and WJC centers programme implementation. There are two large expansions of the CCT Juntosimplementation, first in 2007 and then in 2012.
18Juntos is targeted to the population living in poverty and extreme poverty: households with children under14, pregnant women, widowed parents and/or older adults. It is particularly focused on getting children out ofpoverty, improving their education, health and nutrition. This programme is also explicitly seen as a way totackle the special vulnerability of populations who were most affected by the political violence that was prevalentin Peru between 1980-2000. Most of the victims of this conflict were poor populations living in rural areas andQuechua speakers.
19We also construct a panel database at the district level on WJC center and CCT Juntos placement from2005 till 2014, which allows us to better analyze whether program implementations where correlated over spaceand time. By using a fixed-effects model, we can control for any time-invariant locality factors at the district leveland also year dummies. The results in Table A-9 corroborate the idea that the CCT Juntos is not a confoundingfactor in our research design.
20

the WJC centers on all areas, our results might be identified off of rural areas which are not
at risk of having a WJC center and these may not be an accurate comparison for those areas
which get a WJC center. Given this, we will focus our analysis on a specification in which we
limit the sample to urban areas (urban school and households), which are the ones more “at
risk” for opening a WJC centers. As a further robustness check, we will also limit our samples
to districts which ever have a WJC center during the sample period.
5.2 School Level Specification
We use a difference-in-difference empirical strategy to estimate the impact of WJC centers on
education outcomes. We exploit the variation created by the differential timing in the opening
of the WJC centers and also the spatial variation in the exposure to a WJC center. First, we
study the overall effect of WJC centers on education outcomes at the school level by using the
following regression equation:
Yst = β0 + β1WJCst + αs + λpt + γtX′s + εst (1)
where (Yst) is the education outcome (i.e. total number of children enrolled, standardized
test scores) in school s at year t, (WJCst) is an indicator variable that takes the value of one
if the school has a WJC center within 1km/in the district of the school, (αs) is a school fixed-
effect, (λpt) is a province-by-year fixed-effect, (γtX′s) is a year-interacted vector of school’s initial
characteristics (including initial school enrollment, presence of electricity, presence of piped
water, school language (Spanish), urbanisation and public school dummy) and (εst) is a random
error term. The inclusion of school fixed-effects accounts for any time-invariant characteristics at
the school level. However, this does not account for any differential trends in education outcomes
associated with WJC center placement. To address this, we allow the year fixed-effects to differ
by province and by measures of school’s baseline enrollment and baseline infrastructure. Firstly,
province-by-year fixed effects rule out the concern that our results are driven by changes that
vary by province and year such as an increase in political corruption or a decrease in provincial
resources. Secondly, because initially-different schools might be more likely to change differently,
this empirical specification focuses on comparing changes in treatment and control schools with
similar initial characteristics that might drive WJC center placement.
21

The coefficient of interest is (β1), which captures the average change in enrollment in schools
that are located near the WJC centers or in districts with WJC center, to the average change
in enrollment in schools that did not have a WJC center. The identification assumption is that
treatment schools located in the proximity of a WJC center/in districts with WJC center would
otherwise have changed similarly, on average, to those controls schools that are not exposed
to the services of a WJC center. In practice, by controlling for province-by-year fixed-effects
(λpt) and by variables that drive WJC center placement, the identification assumption is that
treatment schools would otherwise have changed similarly, on average, to control schools within
their same province and with similar initial characteristics. Throughout this analysis, we cluster
our standard errors at the school level. We also estimate this regression including district-specific
time trends.
As noted in the introduction, we are concerned about the possibility that the results are
driven by time-varying variables which might influence both the opening of the WJC centers
and school enrollment. A related issue is the possibility that WJC center managers consciously
decide to introduce centers where school enrollment is increasing. To address both of these
issues, we use the panel nature of the school data in order to construct a placebo treatment
based on the timing of the WJC centers introduction. We estimate whether future WJC centers
predict current enrollment using equation 2 below:
Yst = β0 + β1WJCst + β2WJCst+1 + β3WJCst+2 + β4WJCst+3 + αs + λpt + γtX′s + εst (2)
where (WJCst+1), (WJCst+2) and (WJCst+3) are indicator variables that takes the value
of one if the school has a WJC center within 1km/in the district of the school starting from
the year t + 1, t + 2 and t + 3. If β2 > 0, β3 > 0 and β4 > 0 are positive and significant, this
would indicate that WJC centers are being introduced in areas where schooling is increasing
more rapidly. While, if β2 = β3 = β4 = 0 this would indicate that WJC centers are introduced
in areas in which school enrollment is growing for other reasons.20 Therefore, the coefficients
β2, β3 and β4 effectively capture the effect of future openings for areas that are not covered by
the WJC centers in t. Our hypothesis for the placebo regression is that total enrollment in
schools that do not have a WJC center within 1km/in the district should not be affected by the
20This technique has already been used to address this concern by LaFerrara et al, 2012; Oster and Steinberg,2013.
22

fact that a WJC center may open in the future in the proximity of these schools.
5.3 Individual Level Specification
Since our school level data contain number of students enrolled, but not enrollment rates, we
then use, as a further robustness check, the Peruvian DHS to estimate the impact of WJC
centers on children’s school attendance status. The main individual outcomes is a dummy
variable indicating whether the child is attending school during the year of the survey. We also
use additional individual outcomes, which are defined as a changes in school attendance status
between one year and the next, conditional on the child being enrolled in school. Therefore,
the dependent variable can be classified as: (a) currently attending school, (b) passed grade
(c) repeated grade (d) dropped out and (e) left school more than 2 years ago. Using the same
identification strategy, the regression equation is the following:
yit = γ0 + γ1WJCit + αd + λpt + δX′it + εit (3)
where (yit) is one of the previously discussed school attendance statuses for child i at year t,
(WJCit) is an indicator variable that takes the value of one if there is a WJC center within 1km of
the child’s household/in the district of residence of child i in year t, (αd) is a district fixed-effect,
(λpt) is a province-by-year fixed-effect, (X′it) is a vector individual-level characteristics (including
age, gender, household’s head years of education, number of children in the household aged 0-18,
number of children in the household aged 0-5, number of female adults, number of male adults,
rural residence dummy) and (εit) is a random error term. Standard errors are clustered at the
district level and we also include district-specific time trends.
The coefficient of interest is (γ1), which captures the average change in school attendance
status of children that are located near the WJC centers or in districts with WJC center, to the
average change in school attendance status of children that are not reached by a WJC center.
The identification assumption is that in the absence of the WJC centers, treatment households
would otherwise have changed similarly, on average, to control households within their same
province. Note that in this specification we cannot control for individual fixed-effects because
the DHS database is a repeated cross-section.
23

6 Results
6.1 Impact of WJC Centers on School Enrollment
6.1.1 Main Results
This section analyzes our estimates of the impact of the WJC centers on education outcomes
at the school level. From estimating equation 1, Table 5 and Table 6 present estimated impacts
of WJC centers on average enrollment in primary schools and secondary schools, respectively.
While Table 7 presents the impact of WJC centers on standardized test scores for second grade
students in primary level.
Panel A of Table 5 shows our primary school enrollment estimates when exposure to the
program is measured through the presence of a WJC center within a 1km Euclidean buffer.
Column 1 presents the results using the entire sample. The coefficient on WJC center within
1km is positive and statistically significant. This result indicates that the introduction of a
WJC center within 1km of a school is associated with an increase of 2.8% in the number of
children enrolled in primary school in the year after the center was opened. Column 2 shows
this regression after including district-specific trends to address the concern that districts that
have a WJC center are trending differently than those that do not. The coefficient is almost
unchanged (2.7%) and still highly significant. In Column 3, we include district population
as a time-varying control in order to rule out the concern that our results might be driven
by mechanical changes in population, especially due to the fact that our school data measure
number of students enrolled, not enrollment rates. After controlling for district population,
the impact of WJC centers on primary school enrollment is even larger (3.3%) and statistically
significant. Our preferred specifications are shown in Columns 4 and 5, in which we limit the
sample to just urban schools and districts that ever have a WJC center, which means that
control schools are most comparable to those which are affected by a WJC center. Although
this restricts the sample significantly, the coefficient for urban schools in Column 5 is also larger
in magnitude to the overall sample (3.2%) and highly significant. Lastly, the impact for districts
that ever have a WJC center is bit smaller in magnitude (2.4%) and significant, despite the fact
that we restrict the sample size even further.
In Panel B of Table 5 we explore the impact of WJC centers on primary school enrollment
by using the alternative measure of exposure, presence of a WJC center in the district. We
24

use this alternative explanatory variable as a robustness check and also to explore whether the
opening of a WJC center matters in broader surroundings. Panel B shows that introducing
a WJC center in the district also has a positive and significant effect, but the coefficient is a
bit lower (1%), indicating that the effect probably decreases with distance. Focusing on our
preferred specifications in Columns 4 and 5, we find that adding a WJC center in the district
increases the total number of children in primary school between 1.2% and 1.9%.
Table 6 shows the impact of WJC centers on secondary school enrollment, using the different
measures of exposure to the program. We also find a positive impact on the number of children
enrolled in secondary school (2.9%) when we use the entire sample, but the effect is not robust
to controlling for district specific trends and to limiting the sample to districts which ever have
WJC center. The specification with urban schools is the only one that yields a positive and
significant coefficient of 3.4% for secondary school enrollment.
Lastly, consistent with these results, we also find some suggestive evidence of a positive effect
on standardized test scores for primary school children located in schools near a WJC center.
Table 7 shows that test scores of children in schools located in the proximity of a WJC center
are 0.02 - 0.05 standard deviations higher. Even though these results are not robust to all the
different specifications, they are positive and highly significant for urban schools.
All these findings suggest a strong connection between the presence of WJC centers and
total number of children in school. They also indicate that these findings are localized to within
few kilometers and they are mostly driven by urban areas. In Table A-2 of the Appendix, we
also show these effects broken down by gender and grade. We find that these effects are similar
for boys and girls, even though they seem to be driven mostly by girls. We also find that the
impact is equally distributed among the different grades.
6.1.2 Placebo regression: Future WJC centers
As mentioned earlier, the main threat to our identification strategy is the possibility that WJC
centers were rolled out in response to changes in enrollment, rather than causing them. This
is strongly linked to the issue of endogenous WJC center placement. Even though, we account
for characteristics which are constant over time through school fixed-effects, one concern that
remains is the possibility that WJC centers are placed in areas where enrollment is increasing
more rapidly since center managers or policymakers are targeting more densely populated areas.
25

Another concern is posed by time-varying unobservables correlated to both the timing of the
WJC centers and school enrollment. For example, it could be that areas reached by the WJC
centers are also hit by a positive economic shock or there are improvements in public welfare
programs at the time they are opening the WJC centers. We already account for this by
controlling for province-by-year fixed effects.
However, another way to address the concern that WJC centers are located in areas that
are changing in other ways that we do not observe is by constructing a placebo treatment based
on the timing of the WJC center openings. We estimate analogous regressions to the ones in
Tables 5 and 6 (our baseline school-level specification), but instead of only looking at the effects
of opening a WJC center on current enrollment, we also look at the effects of future openings.
The idea is that if future WJC center openings predict current enrollment, this would suggest
that WJC center placement anticipates changes in schooling, rather than causing them. Table 8
and 9 show the results for this falsification exercise for primary and secondary school enrollment,
respectively. We find that the effect of future WJC centers is virtually zero and not statistically
precise, suggesting no strong evidence of pre-trends. In addition, the inclusion of future WJC
centers does not affect our estimate of the impact of current WJC center on school enrollment.
6.2 Impact of WJC Centers on Children’s School Attendance
The evidence above suggests that overall primary school enrollment increases in response to
WJC center introduction. Here, we analyze the impact of WJC centers on children’s school
attendance and their attendance status as an additional robustness check since a downside of
our school-level data is that we observe number of students enrolled, not enrollment rates.
Table 10 and Table 11 summarize the estimated impacts of WJC centers on children’s school
attendance in primary and secondary level, respectively, from estimating equation 3. While,
Table 12 presents the results for children’s attendance status.
First, Panel A of Table 10 indicates that children in primary school living in household’s
located near a WJC center are significantly more likely to attend school. More specifically,
living in the proximity of a WJC center increases children’s school attendance by approximately
2 percentage points. Focusing on our preferred specifications in Columns 3 and 4, we find
a positive and statistically significant effect on children’s primary school attendance after the
opening of a WJC center in the proximity of the household but also in the district of residence.
26

These results are robust to using the different measures of exposure to the program and they are
also similar in magnitude to the results found with the school-level data, which is reassuring.21
Second, in Table 11 we also find a positive and statistically significant impact of WJC centers
on secondary school attendance for those children living within 1km of the center. These effects
range between 2 to 3 percentage points. However, this effects disappear when we use presence
of a WJC center in the district as a measure of exposure.22
Lastly, the impact of WJC centers on school attendance status - grade advancement condi-
tional on staying in school, repeating grade, recent drop-out and old drop-out was also estimated
using the same method as reported for school attendance. Results in Table 12 show that chil-
dren located near a WJC center are significantly more likely to pass a grade and they are also
significantly less likely to drop out of school. However, we do not find an effect on grade repe-
tition nor on having left school more than two years before the opening of the centers. These
results are robust to using different samples of children (i.e. children of the women selected for
the domestic violence module). What we find, overall, is that investments in children’s human
capital are affected positively by the introduction of the WJC centers.
7 Mechanisms
In this section we provide some initial evidence on the mechanisms that might potentially drive
these effects. We distinguish two possibilities. Firstly, the introduction of WJC centers may
have contributed to break the silence regarding violence against women and turning it into a
public issue. By making domestic violence more visible, these specialized institutions may be
changing the discriminatory social values and power structures that underlie violence against
21The magnitude of the main effects in Table 10 could be considered very large given the primary schoolattendance rate of 97%. In order to interpret this result, in Table A-10 of the Appendix we analyze domesticviolence in the household by children’s primary level school attendance status. Effectively, we find that domesticabuse is much higher among the 3% of households who do not send their children to primary school and thisdifference is driven by urban areas. We also analyze how primary school attendance is distributed in areas closerand further away from the WJC centers. Results in Table A-11 of the Appendix indicate that primary schoolattendance rates in areas/neighbourhoods with a WJC center are lower compared to areas without a WJC center.In addition, our second piece of evidence on the interpretation of the magnitude of these coefficients focuses onchild labor. Table A-12 reports regression results of the impact of WJC centers on child labor for children aged 6to 14 years old. These findings show that proximity to a WJC center is associated with a statistically significantreduction in child labor, especially for young girls.
22Due to the GPS displacement issue in the Peruvian DHS data, we also estimate the impact of WJC centersusing two additional Euclidean buffers: 3km and 5km. Results in Tables A-3 and A-4 show that when we analyzethe effect of the WJC in broader surroundings we do not find a significant impact for both primary and secondaryschool attendace rates.
27

women. Alternatively, the presence of a WJC center in the neighborhood or in proximity of
the household may generate a more credible threat to the potential offenders through greater
chances of demanding police involvement and criminal penalties. This distinction is potentially
important when thinking about public policy implications.
Both mechanisms lead to the conclusion that WJC center’s intervention in households with
abuse may change the behavior of offenders and victims. In other words, the opening of WJC
centers might be a powerful tool to reduce the incentives of the spouse to choose domestic
violence through an improvement of the bargaining power of women in the household and, in
turn, it might also improve women’s ability to take care of their children. Several economic
theories of household bargaining power suggest that policies aimed at affecting spouse’s outside
option from a marriage may also affect within-household distribution through changes in their
relative bargaining positions (McElroy and Horney, 1981; Manser and Brown, 1980).
In order to distinguish between these possible mechanisms, we use the Domestic Violence
Module of the Peruvian DHS and the administrative data from the Peruvian Crime Observatory
and the Ministry of Health, which allows us to estimate the impact of the WJC centers on: (a)
the prevalence of domestic violence during the last 12 months (physical and emotional) (b)
femicides and female hospitalizations for assault (c) decision-making and bargaining power in
the household. Table 13 presents the results of regressing the likelihood of experiencing domestic
violence in the last 12 months against the presence of a WJC center within 1km/in the district
after controlling for age, age at first marriage, number of children, years of education, number
of household members, number of households in the dwelling, marital status, rural residence
dummy, district fixed-effects and province-by-year fixed effects. These findings show that women
living within 1km of a WJC center or in a district with WJC center are significantly less likely
to suffer from physical violence by their spouse.23 These results are robust to including district
specific trends and to limiting the sample to urban clusters and districts which ever have a WJC
center. In Table A-6 of the Appendix, we also show that these results are driven by older and
more educated women, which are the ones that are more likely to have better outside options. In
addition, in Table 14 we present the impact of the WJC centers on different types of emotional
23The full sample of women in the Peruvian DHS surveys consists of 210.847 respondents aged 15 to 49 overthe period 2000-2014. However, this sample is reduced to 121.404 eligible women since we only include partneredwomen who are eligible for the domestic violence module. When we run estimations using the geo-coded clusterlocations during the period 2006-2014, this sample is reduced even further to 64.366 observations of women.
28

violence. In general, we find a negative but not statistically significant effect.
However, one limitation of the data collected on domestic violence is that it is self-reported
by respondents and, therefore, subject to recall bias, cultural values and willingness to report
domestic violence. In order to corroborate our results, we also use data on femicides and female
hospitalizations for assault at the district level. Tables 15 and 16 present the results of regressing
the log of number of femicides and female hospitalizations for assault against the number of WJC
centers in the district. These findings indicate that the opening of a WJC center in the district
can be associated with a statistically significant reduction in the number of femicides and female
hospitalizations for assault. The largest effect is found for women aged 20 to 39 years old, which
is reassuring in terms of the results found with the domestic violence data.
Next, we analyze patterns of institutional trust in case of a domestic violence event. We focus
on relating proximity to a WJC center to the type of institutional help sought by women in case
of having suffered from domestic violence abuse. More specifically, we analyze nine institutional
trust variables: whether the respondent reports having sought help in a police station, justice
court, district attorney office, DEMUNA (Defense center for children and adolescents), WJC
center, ombudsman office, health facility, NGO and other institution. Results in Table 17 indi-
cate that married or cohabiting women living within 1km of a WJC center are less likely to seek
help in a regular police police station, but instead they are significantly more likely to put their
trust in the women’s justice centers. This result suggests that institutional trust is reinforced
in the area close to the WJC center, which might lead to a potential female empowerment.
Central to the analysis on the mechanisms behind the results is the relationship between
household decision-making and the WJC center introduction. In order to test this, we also use
the Peruvian DHS which records who has the final say on a variety of household decisions. For
example, a woman is asked “who makes the final decision on large household purchases?” or
“who makes the final decision on money husband earns?”. Responses include: respondent only,
jointly with partner and partner only. For these categories, we construct three measure of equal
decision-making. The first one is a score that ranges from 0 to 6 and counts the number of times
the respondent makes decision jointly with partner. The second one is also a score that ranges
from 0 to 1 and counts the share of decisions made jointly with partner. The third one is a
dummy that takes the value of 1 when at least one decision is made jointly with the partner.
In addition to decision-making, we also estimate the effect of WJC centers on women’s earnings
29

relative to their husbands.
Table 18 provides the estimates of the impact of WJC centers on decision-making and bar-
gaining power. We find suggestive evidence of an improvement in the bargaining power of women
in the household. In particular, we find that women living near a WJC center are more likely to
make joint decision-making with their husband. The are also less likely to earn less than their
husband and more likely to earn as much as their husband. We also analyze whether the WJC
centers have an effect on women’s labor force participation. Results in Table 19 indicate that
women’s labor supply does not seem to be affected by the opening of these centers.
8 Assessing the Internal Validity of the Research Design
In this section we present several robustness checks that support the validity of the identification
assumption of the paper. The main threat to the identification strategy is the correlation between
the order of the opening of the WJC centers and the trends in education patterns before the
rollout of the program. Basically, the average effect of the WJC centers would be biased if the
timing of WJC centers creation was correlated with pre-program changes in education outcomes.
In order to test this, we begin by estimating a regression of pre-program changes in school
enrollment on indicators for the year the WJC center was introduced within a 1km radius of
the school:
∆Log(Yst) = Log(Yst−1)− Log(Yst) = γ + αt +∑k≥t
δkI(WJCyear<1km,s = k) + εst (4)
The dependent variable is ∆Yst is the change in the log of primary/secondary total school
enrollment from year t − 1 to year t. The set of dummy variables (WJCyear<1km = k) take
the value of 1 in the year in which a WJC center was opened within 1km of the school. Year
fixed-effects are denoted as αt. The data for this test is derived exclusively from the School
Census (CE) database and the sample is restricted to those schools that were reached by the
program between 2006 and 2014. The reference group is the opening of a WJC center in 2006.
If (WJCyear) effects are jointly significant it would indicate that year of WJC center creation
within 1km of the school was correlated with pre-program changes in total school enrollment.
We cannot perform the same test with the Peruvian DHS since we do not observe the same
clusters of households over time. This means that we cannot exploit the variation generated by
30

proximity to the WJC center through Euclidean buffers. However, we can still check whether the
timing of WJC center introduction in the district is correlated with changes in school attendance
in the district. For this case, we regress pre-program changes in district-level school attendance
rates on yearly indicators of WJC center introduction in the district:
∆ydt = ydt−1 − ydt = γ + αt +∑k≥t
δkI(WJCyeard = k) + εdt (5)
In Tables 20 and 21 we show results on three different windows of pre-program changes
in education outcomes, 1998-2000, 1998-2005 and 1998-2010, at the school and district level,
respectively. These findings show that pre-program changes in education at the beginning of
the rollout might be correlated with the timing of the WJC center introduction. While, the
other two windows of pre-program education results, 1998-2005 and 1998-2010, indicate that
the rollout year is not correlated with pre-program changes in education outcomes. For this
reason, we decide to focus our analysis in the middle of the rollout, that is, from 2006 till 2014,
for which identifying assumptions are likely to hold.
We do not find evidence that pre-program trends in education patterns were correlated with
the order of the WJC center implementation during the period 2006-2014. Tables A-7 and A-8
report the results of estimating equation (4) and (5), respectively. Results in Table A-7 indicate
that opening a WJC center within 1km of the school does not significantly explain pre-program
changes in primary and secondary school enrollment between 1998-2005. Similarly, results in
Table A-8 show that the opening of a WJC center in the district is not correlated to pre-program
changes in school attendance. Columns 2, 3, 5 and 6 repeat this exercise by gender. In all cases,
we are unable to reject the null hypothesis of the joint test. These findings strongly suggest
that pre-program time trends for the education outcomes of interest are not correlated with the
introduction of the WJC centers between 2006-2014. We also perform the same test with other
outcomes used in the study such as standardized test scores and domestic violence and we do
not find evidence of pre-program trends. See results in Tables 22 and 23. The pre-program
patterns for each relevant outcome are depicted by Figure 6.
We also exploit the fact that we have information prior to the introduction of the WJC,
since the rollout was done gradually each year, in order to conduct an additional formal test of
whether pre-trends in the outcomes of interest are correlated with the opening of the WJCs in
31

Peru. This test also allows us to better understand the dynamics of the WJC center introduction
and the outcomes of interest. For instance, how quickly school enrollment or attendance increase
after the opening of a WJC and whether this impact accelerates, stabilizes or mean reverts. To
explore these dynamics, we conduct an event study analysis, where we analyze the impact of
leads and lags of the WJC implementation. Formally, we estimate the following regressions at
the school and individual level, respectively:
Yst = β0 +4∑
i=−3WJCs ∗ βiI(τst = i) + αs + λpt + γtX
′s + εst (6)
yidt = γ0 +
4∑i=−3
WJCd ∗ βiI(τdt = i) + αd + λpt + δX′it + εit (7)
where τt denotes the event year, defined so that τ = 0 for the year the WJC was introduced
within 1km/in the district of the school/household, τ = 1 for one year after the WJC centers
began to operate, and so on. For τ ≤ −1, school and households were untreated by the WJC
introduction. The coefficients are measured relative to the omitted coefficient τ = −1. In other
words, we add indicator variables for up to 3 years before implementation and 0-4 years after
implementation. Figure 7 and 8 plot the coefficient of the interaction for the years leading up
to the opening of the WJC centers and the years after the introduction of the WJC centers
from estimating equations 6 and 7, respectively. For each outcome, we expect that coefficients
on dummies for years -3 and -2 (the years prior to the WJC centers) should not be significant,
because if this was the case, the validity of the parallel trends assumption would be violated.
For primary school enrollment and attendance, we find that the treated schools and house-
holds did exhibit a rising trend (relative to the control group) prior to the WJC implementation
but this difference is not statistically significant. For standardized test scores, there is also no
difference in pre-program trends between school located near a WJC center and those further
away. Indeed, the graphs show an absence of a strong pre-trend and evidence of a trend break
after the WJC opened within 1km/in the district. In the year of the opening, primary school en-
rollment increases substantially by 1.8% for schools located within 1km of the WJC, after which
this increment fluctuates around 2% over the subsequent 3 years. For school and households
located in districts with a WJC presence, the greatest impact on primary school enrollment,
primary school attendance and standardized test scores is found 2 years after the opening of the
32

centers. For secondary school enrollment, we find that schools exposed to a WJC center have
a lower enrollment and attendance prior to the opening of the WJC. However, this decline is
opposite to the direction we observe after the WJC introduction, though it is not statistically
significant.
For women’s outcomes (i.e. domestic violence, emotional violence, joint decision-making and
labor supply), the coefficients on the years leading up to the opening of the WJC centers are
close to zero and not significant, showing no evidence of an anticipatory response within district
about to introduce the WJC centers. In particular, we find that women located in districts with
a WJC center present lower propensity to experience domestic violence since the year of the
opening of the WJC center. This declining pattern reaches its largest impact 2 years after the
opening of the center, which coincides with the positive impact on education outcomes. The
similar timing of the effects on education and domestic violence provides further evidence that
improving access to justice for women might be an important mechanism for allowing women
to take better care of their children by increasing their investment in human capital.
9 Conclusion
In this paper we argue that the opening of WJC centers in Peru has a positive impact on
children’s human capital investment, and these impacts are concentrated in the very local areas
around the WJC center. To the best of our knowledge, this is the first quantitative analysis that
attempts to explore the impact of an unexamined dimension of institutional intervention that
provides better access to justice for women, namely the WJC centers, on education outcomes
and the prevalence of domestic violence.
We deal with the potential endogeneity in the WJC center placement by exploiting the
variation generated by the rollout of the women’s justice centers in Peru. Basically, in order
to ensure that our results are not driven by selection or time-varying unobservables, we use a
difference in-differences strategy, which exploits variation created by the differential timing in the
opening of the WJC centers and also the spatial variation in the exposure of a school/household
to a WJC center, together with province-by-year fixed effects. We provide evidence in support
of the identifying assumptions, and account for two key time-varying confounders: the fact that
WJC center introduction might anticipate changes in schooling and unobservable changes in
variables that might affect both the timing of the WJC centers and the education outcomes.
33

Our main finding is that investments in children’s human capital are affected positively by the
introduction of the WJC centers. In particular, we find that introducing a WJC center within
1km of a school causes an increase of 3% in the total number of children enrolled in primary
school. In addition, we also find suggestive evidence that primary school second graders have
better test scores in reading and mathematics. Moreover, we find that children in primary school
living in household’s located near a WJC center are significantly more likely to attend school,
to pass a grade and they are also significantly less likely to drop out of school. These effects are
localized within a few kilometers and they are mostly driven by urban areas.
We also test whether this pattern of results could be caused by potential mechanisms. Lastly,
we provide evidence that these improvements might be driven by a reduction in the prevalence
of domestic violence, femicides and by an increase in the bargaining power of women inside the
household. From a public policy standpoint, our analysis implies that providing better access
to justice for women can be a powerful tool to reduce domestic violence and increase human
capital investment of children, suggesting a positive inter-generational benefit of the program.
References
Aguero, Jorge. 2013. “Causal estimates of the intangible costs of violence against women inLatin America and the Caribbean.” Inter American Development Bank Working Paper No.IDB-WP 414.
Aizer, Anna. 2010. “The gender wage gap and domestic violence.” The American EconomicReview, 100(4): 1847.
Aizer, Anna. 2011. “Poverty, violence, and health the impact of domestic violence duringpregrancy on newborn health.” Journal of Human Resources, 46(3): 518–538.
Angelucci, Manuela. 2008. “Love on the rocks: Domestic violence and alcohol abuse in ru-ral Mexico.” The BE Journal of Economic Analysis & Policy: Contributions to EconomicAnalysis and Policy, 8(1): 43.
Baldry, Anna C. 2003. “Bullying in schools and exposure to domestic violence.” Child abuse& neglect, 27(7): 713–732.
Black, David S, Steve Sussman, and Jennifer B Unger. 2010. “A further look at the in-tergenerational transmission of violence: Witnessing interparental violence in emerging adult-hood.” Journal of Interpersonal Violence, 25(6): 1022–1042.
Bloch, Francis, Vijayendra Rao, and Sonalde Desai. 2004. “Wedding celebrations asconspicuous consumption signaling social status in rural India.” Journal of Human Resources,39(3): 675–695.
34

Bobonis, Gustavo J, Melissa Gonzalez-Brenes, and Roberto Castro. 2013. “Publictransfers and domestic violence: The roles of private information and spousal control.” Amer-ican Economic Journal: Economic Policy, 5(1): 179–205.
Boesten, Jelke. 2012. “The state and violence against women in Peru: intersecting inequali-ties and patriarchal rule.” Social Politics: International Studies in Gender, State & Society,19(3): 361–382.
Bott, Sarah, Alessandra Guedes, Mary Goodwin, and Jennifer Adams Mendoza.2012. “Violence Against Women in Latin America and the Caribbean: A comparative analysisof population-base.” Pan American Health Organization.
Brassiolo, Pablo. 2016. “Domestic violence and divorce law: When divorce threats becomecredible.” Journal of Labor Economics, 34(2): 443–477.
Burgert, Clara R, Josh Colston, Thea Roy, and Blake Zachary. 2013. “Geographicdisplacement procedure and georeferenced data release policy for the Demographic and HealthSurveys.” Calverton Maryland ICF International.
Campbell, Jacquelyn C. 2002. “Health Consequences of Intimate Partner Violence.” TheLancet, 359(9314): 1331–1336.
Carlson, Bonnie E. 2000. “Children exposed to intimate partner violence research findingsand implications for intervention.” Trauma, Violence, & Abuse, 1(4): 321–342.
Carrell, Scott E, and Mark L Hoekstra. 2010. “Externalities in the classroom: How childrenexposed to domestic violence affect everyone’s kids.” American Economic Journal: AppliedEconomics, 2(1): 211–228.
Currie, Cheryl L. 2006. “Animal cruelty by children exposed to domestic violence.” Childabuse & neglect, 30(4): 425–435.
Duflo, Esther. 2000. “Schooling and labor market consequences of school construction in In-donesia: Evidence from an unusual policy experiment.” National Bureau of Economic Re-search.
Duflo, Esther. 2012. “Women empowerment and economic development.” Journal of EconomicLiterature, 50(4): 1051–1079.
Duflo, Esther, Rema Hanna, and Stephen P Rya. 2012. “Incentives work: Getting teach-ers to come to school.” The American Economic Review, 102(4): 1241–1278.
Durand, Julia Garcia, Lilia Blima Schraiber, Ivan Franca-Junior, and Claudia Bar-ros. 2011. “Impact of exposure to intimate partner violence on children’s behavior.” Revistade Saude Publica, 45(2): 355–364.
Edleson, Jeffrey L. 1999. “Children’s witnessing of adult domestic violence.” Journal of in-terpersonal Violence, 14(8): 839–870.
Emery, Clifton R. 2011. “Controlling for selection effects in the relationship between childbehavior problems and exposure to intimate partner violence.” Journal of Interpersonal Vio-lence, 26(8): 1541–1558.
35

Eswaran, Mukesh, and Nisha Malhotra. 2011. “Domestic violence and women’s auton-omy in developing countries: theory and evidence.” Canadian Journal of Economics/Revuecanadienne d’economique, 44(4): 122–1263.
Fantuzzo, John, Robert Boruch, Abdullahi Beriama, Marc Atkins, and Susan Mar-cus. 1997. “Domestic violence and children: Prevalence and risk in five major US cities.”Journal of the American Academy of child & Adolescent psychiatry, 36(1): 116–122.
Farmer, Amy, and Jill Tiefenthaler. 1996. “Domestic violence: the value of services assignals.” The American Economic Review, 86(2): 274–279.
Flake, Dallan F, and Renata Forste. 2006. “Fighting families: family characteristics asso-ciated with domestic violence in five Latin American countries.” Journal of Family Violence,21(1): 19.
Franco, Rocıo, and Marıa Gonzalez. 2009. “Las mujeres en la justicia comunitaria:vıctimas, sujetos y actores.” Serie Justicia Comunitaria en los Andes: Peru y Ecuador, 3.
Fregoso, Rosa-Linda, and Cynthia Bejarano. 2009. Terrorizing Women: Feminicide inthe Americas. Duke University Press.
Friedemann-Sanchez, Greta, and Rodrigo Lovaton. 2012. “Intimate partner violence inColombia: Who is at risk?” Social Forces, 91(2): 663–688.
Garcia-Moreno, Claudia, Henrica AFM Jansen, Mary Ellsberg, Lori Heise, Char-lotte H Watts, et al. 2006. “Prevalence of intimate partner violence: findings from the WHOmulti-country study on women’s health and domestic violence.” The Lancet, 368(9543): 1260–1269.
Heath, Rachel. 2012. “Women’s access to labor market opportunities, control of householdresources, and domestic violence.”
Heinemann, Alessandra, and Dorte Verner. 2006. “Crime and violence in development:A literature review of Latin America and the Caribbean.”
Hidrobo, Melissa, and Lia Fernald. 2013. “Cash transfers and domestic violence.” Journalof Health Economics, 32(1): 304–319.
Holt, Stephanie, Helen Buckley, and Sadhbh Whelan. 2008. “The impact of exposure todomestic violence on children and young people: A review of the literature.” Child abuse &neglect, 32(8): 797–810.
Huth-Bocks, Alissa C, Alytia A Levendosky, and Michael A Semel. 2001. “The directand indirect effects of domestic violence on young children’s intellectual functioning.” Journalof Family Violence, 16(3): 269–290.
INEI. 2001. Encuesta demografica y de salud familiar. Instituto Nacional de Estadıstica andInformatica (Peru) and Macro International. MEASURE/DHS+ (Programme).
INEI. 2015. Encuesta demografica y de salud familiar. Instituto Nacional de Estadıstica andInformatica (Peru) and Macro International. MEASURE/DHS+ (Programme).
36
Jayasinghe, Stephnie, Pushpa Jayawardena, and Hemamali Perera. 2009. “Influenceof intimate partner violence on behaviour, psychological status and school performance ofchildren in Sri Lanka.” Journal of Family Studies, 15(3): 274–283.
Jubb, Nadine, Gloria Camacho, Almachiara D’Angelo, Kattya Hernandez, IMacassi Leon, LI Melendez Lopez, and G Yanez De la Borda. 2010. “Women’sPolice Stations in Latin America: An Entry Point for Stopping Violence and Gaining Accessto Justice.” Ottawa: Centre for Planning and Social Studies and International DevelopmentResearch Centre.
Kiesel, L, K Piescher, and J Edleson. 2011. “Direct and indirect child exposure to violence:Effects on academic performance and disability.” Mimeo.
Koenen, Karestan C, Terrie E Moffitt, Avshalom Caspi, Alan Taylor, and ShaunPurcell. 2003. “Domestic violence is associated with environmental suppression of IQ inyoung children.” Development and psychopathology, 15(2): 297–311.
Kremer, Michael. 2003. “Randomized evaluations of educational programs in developing coun-tries: Some lessons.” The American Economic Review, 93(2): 102–106.
Kremer, Michael, Nazmul Chaudhury, F Halsey Rogers, Karthik Muralidharan, andJeffrey Hammer. 2005. “Teacher absence in India: A snapshot.” Journal of the EuropeanEconomic Association, 3(2-3): 658–667.
Londono, Juan Luis, Rodrigo Guerrero, JL Londono, A Gaviria, and R Guerrero.2000. “Violencia en America Latina: epidemiologıa y costos.” Asalto al desarrollo. Violenciaen America Latina, 11-57.
Manser, Marilyn, and Murray Brown. 1980. “Marriage and household decision-making: Abargaining analysis.” International Economic Review, 32-44.
McElroy, Marjorie B, and Mary Jean Horney. 1981. “Nash-bargained household decisions:Toward a generalization of the theory of demand.” International Economic Review, 333–349.
Miller, Amalia R, and Carmit Segal. 2016. “Do Female Officers Improve Law EnforcementQuality? Effects on Crime Reporting and Domestic Violence.”
MIMDES, Ministerio de la Mujer y Desarrollo Social. 2007. “¿Que son los Centros deEmergencia Mujer?”
MIMDES, Ministerio de la Mujer y Desarrollo Social. 2009. “Investigacion operativa:“Eficacia de la intervencion de los Centros Emergencia Mujer”.”
Mitchell, Rhoda. 2013. “Domestic violence prevention through the Constructing Violence-freeMasculinities programme: an experience from Peru.” Gender & Development, 21(1): 97–109.
Morrison, A, MB Orlando, and G Pizzolitto. 2007. “The impact of intimate partnerviolence against women in Peru: estimates using matching techniques.” [Unpublished] 2007.Presented at the Population Association of America 2007 Annual Meeting New York NewYork March 29-31 2007.
37

Peek-Asa, Corinne, Leah Maxwell, Ann Stromquist, Paul Whitten, Mary Ann Lim-bos, and James Merchant. 2007. “Does parental physical violence reduce children’s stan-dardized test score performance?” Annals of epidemiology, 17(11): 847–853.
Perez-Heydrich, Carolina, Joshua L Warren, Clara R Burgert, and Michael Emch.2013. “Guidelines on the Use of DHS GPS Data.”
Perova, Elizaveta, and Sarah Anne Reynolds. 2017. “Women’s police stations and intimatepartner violence: Evidence from Brazil.” Social Science & Medicine, 174(188-196).
Pollak, Robert A. 2004. “An intergenerational model of domestic violence.” Journal of Pop-ulation Economics, 17(2): 311–329.
Rahman, Mosfequr, Md Aminul Hoque, and Satoru Makinoda. 2011. “Intimate partnerviolence against women: Is women empowerment a reducing factor? A study from a nationalBangladeshi sample.” Journal of Family Violence, 26(5): 411–420.
Revilla, Ana Teresa. 1999. “La administracion de justicia informal en el Peru.” Reforma ju-dicial en America Latina: una tarea inconclusa, Santa Fe de Bogota: Corporacion Excelenciaen la Justicia.
Stevenson, Betsey, and Justin Wolfers. 2006. “Bargaining in the shadow of the law: Divorcelaws and family distress.” The Quarterly Journal of Economics, 121(1): 267–288.
Thompson, Richard, and Lakecia A Whimper. 2010. “Exposure to family violence andreading level of early adolescents.” Journal of Aggression, Maltreatment & Trauma, 19(7): 721–733.
UNHCR. 2010. “Peru: Domestic violence, state protection and support servicesavailable.” Canada: Immigration and Refugee Board of Canada. Available at:http://www.refworld.org/docid/4e438b532.html [Last accessed 3 May 2017].
WHO. 2013. Global and regional estimates of violence against women: prevalence and healtheffects of intimate partner violence and non-partner sexual violence. World Health Organiza-tion.
Wolfe, David A, Claire V Crooks, Vivien Lee, Alexandra McIntyre-Smith, andPeter G Jaffe. 2003. “The effects of children’s exposure to domestic violence: A meta-analysis and critique.” Clinical child and family psychology review, 6(3): 171–187.
38

Figure 1: Distribution and Growth of the Openning of the Women’s Justice Centers (WJCs)by Year - Peru (1999-2016)
0
10
20
30
40N
umbe
r of W
JC c
ente
rs
1999
2000
2001
2002
2003
2004
2005
2006
2007
2008
2009
2010
2011
2012
2013
2014
2015
2016
year
0
50
100
150
200
250
Num
ber o
f WJC
cen
ters
1999
2000
2001
2002
2003
2004
2005
2006
2007
2008
2009
2010
2011
2012
2013
2014
2015
2016
year
39

Figure 2: Rollout of the WJCs across Time and Space (1999-2014)
a. WJC centers in 2000 b. WJC centers in 2006
c. WJC centers in 2011 d. WJC centers in 2014
40

Fig
ure
3:E
ucl
idea
nD
ista
nce
Bu
ffer
san
dW
JC
cente
rs(S
chool
san
dD
HS
Clu
ster
sof
Hou
seh
old
s)-
Lim
aan
dT
um
bes
41

Figure 4: Domestic Violence in Peru (2003-2015)
010
2030
40N
umbe
r of W
JCs
.1.2
.3.4
.5Pr
opor
tion
of w
omen
2000 2002 2004 2006 2008 2010 2012 2014 2016year
Emotional violenceSevere violenceDomestic violence
Less severe violence Sexual violence Number of WJCs
Source: 2003-2015 Peru DHS
Figure 5: Total Number of Persons Attended in WJC Centers by Year (2002-2016)
010
2030
40N
umbe
r of W
JC c
ente
rs
0
20000
40000
60000
80000
Peop
le a
ttend
ed in
WJC
cen
ters
1998 2000 2002 2004 2006 2008 2010 2012 2014 2016year
People attended in WJCs Number of WJCs
42
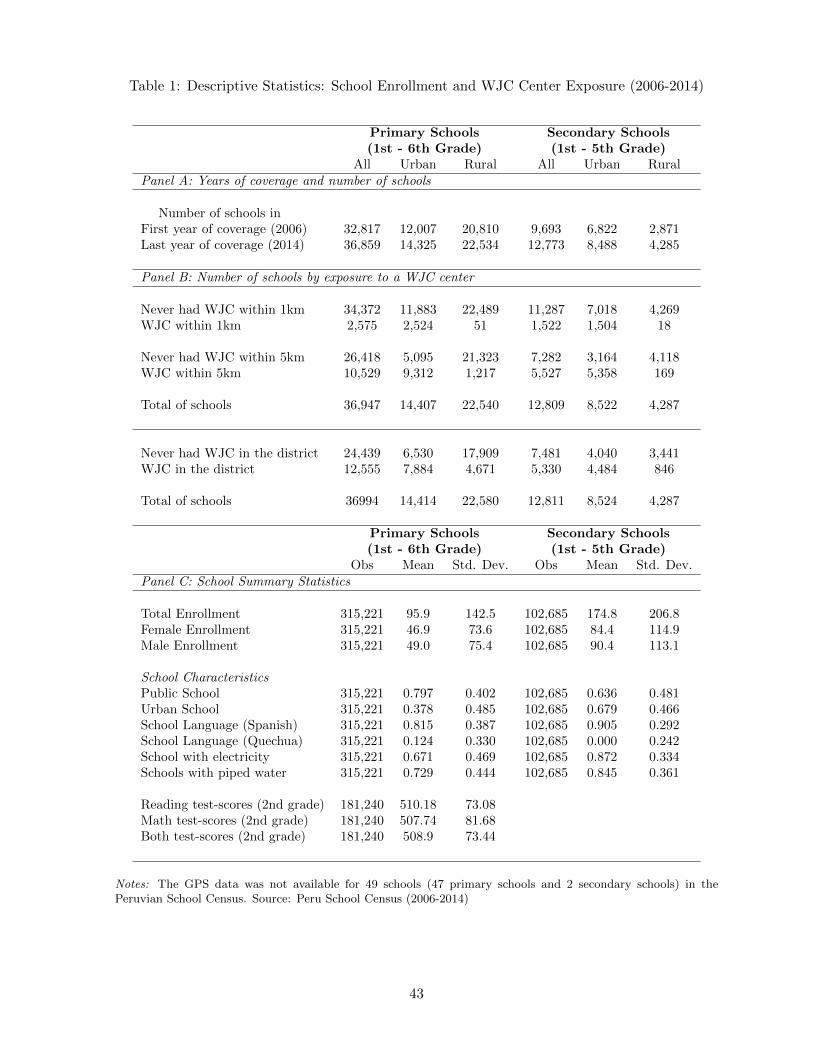
Table 1: Descriptive Statistics: School Enrollment and WJC Center Exposure (2006-2014)
Primary Schools Secondary Schools(1st - 6th Grade) (1st - 5th Grade)
All Urban Rural All Urban RuralPanel A: Years of coverage and number of schools
Number of schools inFirst year of coverage (2006) 32,817 12,007 20,810 9,693 6,822 2,871Last year of coverage (2014) 36,859 14,325 22,534 12,773 8,488 4,285
Panel B: Number of schools by exposure to a WJC center
Never had WJC within 1km 34,372 11,883 22,489 11,287 7,018 4,269WJC within 1km 2,575 2,524 51 1,522 1,504 18
Never had WJC within 5km 26,418 5,095 21,323 7,282 3,164 4,118WJC within 5km 10,529 9,312 1,217 5,527 5,358 169
Total of schools 36,947 14,407 22,540 12,809 8,522 4,287
Never had WJC in the district 24,439 6,530 17,909 7,481 4,040 3,441WJC in the district 12,555 7,884 4,671 5,330 4,484 846
Total of schools 36994 14,414 22,580 12,811 8,524 4,287
Primary Schools Secondary Schools(1st - 6th Grade) (1st - 5th Grade)
Obs Mean Std. Dev. Obs Mean Std. Dev.Panel C: School Summary Statistics
Total Enrollment 315,221 95.9 142.5 102,685 174.8 206.8Female Enrollment 315,221 46.9 73.6 102,685 84.4 114.9Male Enrollment 315,221 49.0 75.4 102,685 90.4 113.1
School CharacteristicsPublic School 315,221 0.797 0.402 102,685 0.636 0.481Urban School 315,221 0.378 0.485 102,685 0.679 0.466School Language (Spanish) 315,221 0.815 0.387 102,685 0.905 0.292School Language (Quechua) 315,221 0.124 0.330 102,685 0.000 0.242School with electricity 315,221 0.671 0.469 102,685 0.872 0.334Schools with piped water 315,221 0.729 0.444 102,685 0.845 0.361
Reading test-scores (2nd grade) 181,240 510.18 73.08Math test-scores (2nd grade) 181,240 507.74 81.68Both test-scores (2nd grade) 181,240 508.9 73.44
Notes: The GPS data was not available for 49 schools (47 primary schools and 2 secondary schools) in thePeruvian School Census. Source: Peru School Census (2006-2014)
43

Table 2: Descriptive Statistics: Children’s School Attendance and WJC Center Exposure (2006-2014)
Primary Level Secondary Level(Children: 6-11 years old) (Children: 12-16 years old)
All Urban Rural All Urban RuralPanel A.1: Number of children by exposure to a WJC center - (GPS data)
No WJC within 1km 42,914 19,654 23,260 29,494 14,282 15,212WJC within 1km 5,789 5,740 49 4,025 3,991 34
No WJC within 5km 32,066 9,706 22,360 21,691 7,087 14,604WJC within 5km 16,637 15,688 949 11,828 11,186 642
Total of children 48,703 25,394 23,309 33,519 18,273 15,246
Panel A.2: Number of children by exposure to a WJC center - (All data)
No WJC in the district 48,895 19,250 29,645 33,392 13,999 19,393WJC in the district 22,971 19,084 3,887 16,069 13,490 2,579
Total of children 71,866 38,334 33,532 49,461 27,489 21,972
Primary Level Secondary Level(Children: 6-11 years old) (Children: 12-16 years old)Obs Mean Std. Dev. Obs Mean Std. Dev.
Panel B: Children’s Summary Statistics
Currently Attending 48,703 0.970 0.169 33,519 0.895 0.305Female Attendance 24,689 0.970 0.169 18,549 0.899 0.300Male Attendance 24,014 0.970 0.169 14,970 0.891 0.311
Passed Grade 48,213 0.919 0.271 30,380 0.782 0.412Repeated Grade 48,213 0.048 0.215 30,380 0.038 0.191Dropped Out 48,213 0.022 0.146 30,380 0.090 0.287Left School +2 years ago 48,213 0.002 0.047 30,380 0.084 0.278
Children’s CharacteristicsAge 48,703 8.467 1.700 33,519 13.786 1.384Head’s Years of Education 48,703 8.602 7.159 33,519 8.348 7.025Urban Cluster 48,703 0.521 0.499 33,519 0.545 0.497# Female Adults in HH 48,703 1.219 0.532 33,519 1.218 0.541# Male Adults in HH 48,703 1.101 0.611 33,519 1.120 0.669# HH Members 0-18 years old 48,703 3.166 1.522 33,519 3.248 1.551
Notes: The GPS data was not available for the years 2012 and 2013 in the Peru DHS. Source: Peru DHS(2006-2014)
44

Table 3: Descriptive Statistics: Women’s Domestic Violence and WJC Center Exposure (2006-2014)
Women: 15-49 years oldAll Urban Rural
Panel A.1: Number of women by exposure to a WJC center(GPS data)
No WJC within 1km 55,323 29,432 25,891WJC within 1km 9,040 8,965 75
No WJC within 5km 38,603 13,841 24,762WJC within 5km 25,760 24,556 1,204
Total of women 64,363 38,397 25,966
Panel A.2: Number of women by exposure to a WJC center(All data)
No WJC in the district 61,946 28,540 33,406WJC in the district 34,614 30,041 4,573
Total of women 96,560 58,581 37,979
Women: 15-49 years oldObs Mean Std. Dev.
Panel B: Women’s Summary Statistics
Domestic violence last 12 months 64,363 0.390 0.487Emotional violence 64,363 0.323 0.467Less severe violence 64,363 0.376 0.484Severe violence 64,363 0.174 0.379Sexual violence 64,363 0.093 0.291
Women’s CharacteristicsAge 64,363 33.93 8.336Age at first marriage 64,363 20.14 4.739# Total children ever born 64,363 2.811 1.993# Years of education 64,363 8.577 4.481# Household Members 64,363 4.626 1.818Married 64,363 0.356 0.478Living together 64,363 0.517 0.499Widowed 64,363 0.007 0.089Divorced 64,363 0.118 0.319Urban cluster 64,363 0.596 0.490
Notes: The GPS data was not available for the years 2012 and 2013 in the Peru DHS. Source: Peru DHS(2006-2014)
45
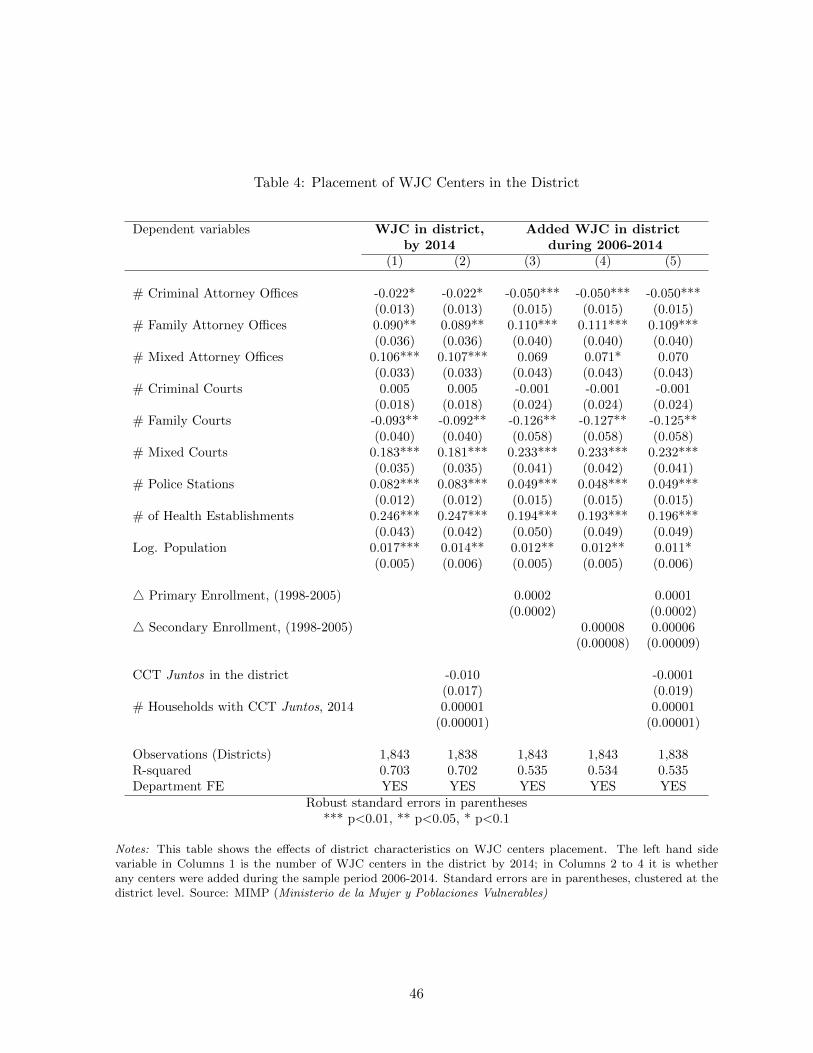
Table 4: Placement of WJC Centers in the District
Dependent variables WJC in district, Added WJC in districtby 2014 during 2006-2014
(1) (2) (3) (4) (5)
# Criminal Attorney Offices -0.022* -0.022* -0.050*** -0.050*** -0.050***(0.013) (0.013) (0.015) (0.015) (0.015)
# Family Attorney Offices 0.090** 0.089** 0.110*** 0.111*** 0.109***(0.036) (0.036) (0.040) (0.040) (0.040)
# Mixed Attorney Offices 0.106*** 0.107*** 0.069 0.071* 0.070(0.033) (0.033) (0.043) (0.043) (0.043)
# Criminal Courts 0.005 0.005 -0.001 -0.001 -0.001(0.018) (0.018) (0.024) (0.024) (0.024)
# Family Courts -0.093** -0.092** -0.126** -0.127** -0.125**(0.040) (0.040) (0.058) (0.058) (0.058)
# Mixed Courts 0.183*** 0.181*** 0.233*** 0.233*** 0.232***(0.035) (0.035) (0.041) (0.042) (0.041)
# Police Stations 0.082*** 0.083*** 0.049*** 0.048*** 0.049***(0.012) (0.012) (0.015) (0.015) (0.015)
# of Health Establishments 0.246*** 0.247*** 0.194*** 0.193*** 0.196***(0.043) (0.042) (0.050) (0.049) (0.049)
Log. Population 0.017*** 0.014** 0.012** 0.012** 0.011*(0.005) (0.006) (0.005) (0.005) (0.006)
4 Primary Enrollment, (1998-2005) 0.0002 0.0001(0.0002) (0.0002)
4 Secondary Enrollment, (1998-2005) 0.00008 0.00006(0.00008) (0.00009)
CCT Juntos in the district -0.010 -0.0001(0.017) (0.019)
# Households with CCT Juntos, 2014 0.00001 0.00001(0.00001) (0.00001)
Observations (Districts) 1,843 1,838 1,843 1,843 1,838R-squared 0.703 0.702 0.535 0.534 0.535Department FE YES YES YES YES YES
Robust standard errors in parentheses*** p<0.01, ** p<0.05, * p<0.1
Notes: This table shows the effects of district characteristics on WJC centers placement. The left hand sidevariable in Columns 1 is the number of WJC centers in the district by 2014; in Columns 2 to 4 it is whetherany centers were added during the sample period 2006-2014. Standard errors are in parentheses, clustered at thedistrict level. Source: MIMP (Ministerio de la Mujer y Poblaciones Vulnerables)
46

Table 5: The Effect of WJC Centers on Primary School Enrollment (2006-2014)
Dep. variable Log (Primary School Enrollment)Sample All schools All schools All schools Only urban Ever WJC
schools in districtControls Standard District trends Standard Standard Standard
(1) (2) (3) (4) (5)
Panel A: WJC center within a distance buffer from the school
WJC within 1km 0.028*** 0.027*** 0.033*** 0.032*** 0.024**(0.008) (0.008) (0.008) (0.008) (0.010)
Log (District Population) 0.443*** 0.424*** 0.415***(0.023) (0.031) (0.055)
Observations 315,221 315,221 315,221 119,232 103,662Number of schools 36947 36947 36947 14405 12413Mean dep. var 95.9 95.9 95.9 177.8 127.7
Panel B: WJC center in the district of the school
WJC in the district 0.009* 0.002 0.005 0.012** 0.019**(0.005) (0.004) (0.005) (0.006) (0.009)
Log (District Population) 0.439*** 0.417*** 0.398***(0.023) (0.031) (0.056)
Observations 315,407 315,407 315,407 119,270 103,730Number of schools 36994 36994 36994 14412 12427Mean dep. var 95.9 95.9 95.9 177.8 127.7School FE YES YES YES YES YESProvince*Year FE YES YES YES YES YESCovariates YES YES YES YES YES
Robust standard errors in parentheses*** p<0.01, ** p<0.05, * p<0.1
Notes: The dependent variable is the logarithm of enrollment plus one. The independent variables measures thenumber of WJC centers within a 1km Euclidean buffer from the school and presence of WJC center in school’sdistrict. Standard errors (in parentheses) are clustered at the school level. All regressions are weighted by initialschool enrollment level. Covariates include school fixed effects, year fixed effects, year-by-province fixed effects,and a vector of controls of baseline school characteristics interacted with academic year (including initial schoolenrollment, presence of electricity, presence of piped water, school language (spanish), urban and public schooldummy).Source: Peruvian School Census 2006-2014.
47

Table 6: The Effect of WJC Centers on Secondary School Enrollment (2006-2014)
Dep. variable Log (Secondary School Enrollment)Sample All schools All schools All schools Only urban Ever WJC
schools in districtControls Standard District trends Standard Standard Standard
(1) (2) (3) (4) (5)
Panel A: WJC center within a distance buffer from the school
WJC within 1km 0.029** 0.017 0.030** 0.034*** -0.005(0.012) (0.014) (0.012) (0.013) (0.019)
Log (District Population) 0.427*** 0.426*** 0.442***(0.038) (0.043) (0.082)
Observations 102,685 102,685 102,685 69,686 41,324Number of schools 12809 12809 12809 8516 5175Mean dep. var 174.8 174.8 174.8 215.3 195.3
Panel B: WJC center in the district of the school
WJC in the district 0.023*** -0.004 0.014* 0.019** -0.005(0.008) (0.008) (0.008) (0.008) (0.013)
Log (District Population) 0.420*** 0.417*** 0.448***(0.038) (0.043) (0.083)
Observations 102,691 102,691 102,691 69,692 41,324Number of schools 12811 12811 12811 8518 5175Mean dep. var 174.8 174.8 174.8 215.3 195.3School FE YES YES YES YES YESProvince*Year FE YES YES YES YES YESCovariates YES YES YES YES YES
Robust standard errors in parentheses*** p<0.01, ** p<0.05, * p<0.1
Notes: The dependent variable is the logarithm of enrollment plus one. The independent variables measures thenumber of WJC centers within a 1km Euclidean buffer from the school and presence of WJC center in school’sdistrict. Standard errors (in parentheses) are clustered at the school level. All regressions are weighted by initialschool enrollment level. Covariates include school fixed effects, year fixed effects, year-by-province fixed effects,and a vector of controls of baseline school characteristics interacted with academic year (including initial schoolenrollment, presence of electricity, presence of piped water, school language (spanish), urban and public schooldummy).Source: Peruvian School Census 2006-2014.
48

Table 7: The Effect of WJC Centers on Primary Level 2nd Grade Test Scores - (2006-2014)
Dep. variable Standardized Test Scores (2nd Grade)Sample All schools All schools Only urban Ever WJC
schools in districtControls Standard District trends Standard Standard
(1) (2) (3) (4)
Panel A: WJC center within a distance buffer from the school
WJC within 1km 0.028* 0.018 0.040** 0.027(0.017) (0.019) (0.018) (0.021)
Observations 181,240 181,240 92,666 69,822Number of schools 29737 29737 13507 10858Mean dep. var 508.9 508.9 536.9 526.9
Panel B: WJC center in the district of the school
WJC in the district 0.026** -0.020 0.050*** 0.050***(0.011) (0.016) (0.013) (0.016)
Observations 181,279 181,279 92,681 69,838Number of schools 29747 29747 13510 10862Mean dep. var 508.9 508.9 537.0 527.0School FE YES YES YES YESProvince*Year FE YES YES YES YESCovariates YES YES YES YES
Robust standard errors in parentheses*** p<0.01, ** p<0.05, * p<0.1
Notes: The dependent variable is the average of the standardized reading and math test scores for 2nd grade ofprimary school. The independent variables measures the number of WJC centers within a 1km Euclidean bufferfrom the school and presence of WJC center in school’s district. Standard errors (in parentheses) are clusteredat the school level. All regressions are weighted by initial school enrollment level. Covariates include school fixedeffects, year fixed effects, year-by-province fixed effects, and a vector of controls of baseline school characteristicsinteracted with academic year (including initial school enrollment, presence of electricity, presence of piped water,school language (spanish), urban and public school dummy). Source: Peru ECE 2007-2014.
49

Table 8: Placebo regressions, Impact of Future WJC Centers on Primary School Enrollment
Dep. variable Log (Primary School Enrollment)Sample All schools All schools Only urban Ever WJC
schools in districtControls Standard District trends Standard Standard
(1) (2) (3) (4)
Panel A: WJC center within a distance buffer from the school
WJC within 1km, t 0.024*** 0.023*** 0.027*** 0.019**(0.008) (0.007) (0.008) (0.009)
WJC within 1km, t+ 1 0.004 0.005 0.003 0.006(0.006) (0.006) (0.007) (0.007)
WJC within 1km, t+ 2 0.002 -0.002 -0.003 0.002(0.006) (0.006) (0.007) (0.008)
WJC within 1km, t+ 3 0.004 0.011 0.004 -0.002(0.008) (0.008) (0.009) (0.010)
Observations 315,221 315,221 119,232 103,518Number of schools 36947 36947 14405 12398P-value joint test 0.987 0.493 0.831 0.767Mean dep. var 95.9 95.9 177.8 127.7
Panel B: WJC center in the district of the school
WJC in the district, t 0.008* 0.000 0.017*** 0.029***(0.004) (0.004) (0.006) (0.008)
WJC in the district, t+ 1 0.002 -0.000 0.006 -0.002(0.004) (0.004) (0.005) (0.006)
WJC in the district, t+ 2 0.003 -0.001 0.001 0.015**(0.004) (0.004) (0.005) (0.006)
WJC in the district, t+ 3 -0.007 -0.009** -0.004 -0.012(0.005) (0.004) (0.006) (0.008)
Observations 315,407 315,407 119,270 103,586Number of schools 36994 36994 14412 12412P-value joint test 0.200 0.148 0.408 0.071Mean dep. var 95.9 95.9 177.8 127.7School FE YES YES YES YESProvince*Year FE YES YES YES YESCovariates YES YES YES YES
Robust standard errors in parentheses*** p<0.01, ** p<0.05, * p<0.1
Notes: The dependent variable is the logarithm of enrollment plus one. The independent variable measures thepresence of a WJC center within 1km/in the district in year t and controls for openings of future WJC centersin year t + 1, t + 2 and t + 3. All regressions are weighted by initial school enrollment level. Covariates includeschool fixed effects, year fixed effects, year-by-province fixed effects, and a vector of controls of baseline schoolcharacteristics interacted with academic year (including initial school enrollment, presence of electricity, presenceof piped water, school language (spanish), urban and public school dummy). Source: Peruvian School Census:2006-2014.
50

Table 9: Placebo regressions, Impact of Future WJC centers on Secondary School Enrollment
Dep. variable Log (Secondary School Enrollment)Sample All schools All schools Only urban Ever WJC
schools in districtControls Standard District trends Standard Standard
(1) (2) (3) (4)
Panel A: WJC center within a distance buffer from the school
WJC within 1km, t 0.033*** 0.023* 0.039*** 0.006(0.012) (0.013) (0.013) (0.019)
WJC within 1km, t+ 1 -0.017 -0.017 -0.020 -0.032*(0.013) (0.013) (0.014) (0.018)
WJC within 1km, t+ 2 0.010 0.008 0.004 0.008(0.013) (0.014) (0.014) (0.020)
WJC within 1km, t+ 3 0.014 0.011 0.023 0.013(0.014) (0.014) (0.015) (0.020)
Observations 102,685 102,685 69,686 41,277Number of schools 12809 12809 8516 5170P-value joint test 0.162 0.215 0.073 0.163Mean dep. var 174.8 174.8 215.3 195.3
Panel B: WJC center in the district of the school
WJC in the district, t 0.026*** 0.002 0.032*** 0.015(0.007) (0.008) (0.008) (0.012)
WJC in the district, t+ 1 -0.013* -0.018** -0.008 -0.014(0.007) (0.007) (0.008) (0.011)
WJC in the district, t+ 2 0.008 0.002 0.003 0.009(0.008) (0.008) (0.009) (0.013)
WJC in the district, t+ 3 0.010 -0.002 0.010 0.009(0.009) (0.008) (0.011) (0.015)
Observations 102,691 102,691 69,692 41,277Number of schools 12811 12811 8518 5170P-value joint test 0.047 0.119 0.314 0.288Mean dep. var 174.8 174.8 215.3 195.3School FE YES YES YES YESProvince*Year FE YES YES YES YESCovariates YES YES YES YES
Robust standard errors in parentheses*** p<0.01, ** p<0.05, * p<0.1
Notes: The dependent variable is the logarithm of enrollment plus one. The independent variable measures thepresence of a WJC center within 1km/in the district in year t and controls for openings of future WJC centersin year t + 1, t + 2 and t + 3. All regressions are weighted by initial school enrollment level. Covariates includeschool fixed effects, year fixed effects, year-by-province fixed effects, and a vector of controls of baseline schoolcharacteristics interacted with academic year (including initial school enrollment, presence of electricity, presenceof piped water, school language (spanish), urban and public school dummy). Source: Peruvian School Census:2006-2014.
51

Table 10: The Effect of WJC Centers on Children’s Primary School Attendance - (2006-2014)
Dep. variable Currently Attending Primary LevelSample All children All children Only urban Ever WJC
6-11 y.o 6-11 y.o clusters in districtControls Standard District trends Standard Standard
(1) (2) (3) (4)
Panel A: WJC center within a distance buffer from the cluster of residence
WJC within 1km 0.019** 0.018* 0.027*** 0.023***(0.008) (0.009) (0.009) (0.008)
Observations 48,703 48,703 25,391 19,563Number of districts 1159 1159 485 215Mean dep. var 0.970 0.970 0.971 0.969
Panel B: WJC center in the district of residence
WJC in the district 0.005 -0.005 0.016** 0.022**(0.007) (0.011) (0.008) (0.009)
Observations 71,866 71,866 38,330 29,051Number of districts 1286 1286 531 225Mean dep. var 0.970 0.970 0.970 0.967District FE YES YES YES YESProvince*Year FE YES YES YES YESCovariates YES YES YES YES
Robust standard errors in parentheses*** p<0.01, ** p<0.05, * p<0.1
Notes: The dependent variable is a dummy indicating whether the child is currently attending primary school.The independent variables measures the presence of a WJC within a 1km Euclidean buffer of the child’s clusterof residence and presence of a WJC center in the child’s district. Robust standard errors (in parentheses) areclustered at the district level. The sample includes children between the ages of 6 and 11. Covariates include age,gender, household’s head years of education, number of children in the household aged 0-18, number of childrenin the household aged 0-5, number of female adults, number of male adults, rural residence dummy, district fixedeffect and province-by-year fixed effect. Source: Peru DHS 2006-2014.
52

Table 11: The Effect of WJC Centers on Children’s Secondary School Attendance - (2006-2014)
Dep. variable Currently Attending Secondary LevelSample All children All children Only urban Ever WJC
12-16 y.o 12-16 y.o clusters in districtControls Standard District trends Standard Standard
(1) (2) (3) (4)
Panel A: WJC center within a distance buffer from the cluster of residence
WJC within 1km 0.022* 0.027* 0.029** 0.027**(0.012) (0.014) (0.012) (0.013)
Observations 33,519 33,519 18,266 13,570Number of clusters 1140 1140 480 215Mean dep. var 0.895 0.895 0.916 0.908
Panel B: WJC center in the district of residence
WJC in the district 0.012 0.039** 0.027 0.036(0.016) (0.018) (0.020) (0.024)
Observations 49,461 49,461 27,482 20,275Number of districts 1270 1270 528 224Mean dep. var 0.896 0.896 0.913 0.904District FE YES YES YES YESProvince*Year FE YES YES YES YESCovariates YES YES YES YES
Robust standard errors in parentheses*** p<0.01, ** p<0.05, * p<0.1
Notes: The dependent variable is a dummy indicating whether the child is currently attending secondary school.The independent variables measures the presence of a WJC within a 1km Euclidean buffer of the child’s clusterof residence and presence of a WJC center in the child’s district. Robust standard errors (in parentheses) areclustered at the district level. The sample includes children between the ages of 12 and 16. Covariates include age,gender, household’s head years of education, number of children in the household aged 0-18, number of childrenin the household aged 0-5, number of female adults, number of male adults, rural residence dummy, district fixedeffect and province-by-year fixed effect. Source: Peru DHS 2006-2014.
53

Tab
le12
:S
chool
Att
end
ance
Sta
tus
and
Pro
xim
ity
toa
WJC
cente
r-
(200
6-2014)
Pri
mary
Sch
ool
Att
en
dan
ce
Sta
tus
Secon
dary
Sch
ool
Att
en
dan
ce
Sta
tus
Sam
ple
Ch
ild
ren
:6-1
1ye
ars
old
Ch
ild
ren
:12-1
6yea
rsold
Dep
.va
riab
les
Pas
sed
Rep
eate
dD
rop
ped
Lef
tsc
hool
Pass
edR
epea
ted
Dro
pp
edL
eft
sch
ool
grad
egra
de
ou
t+
2ye
ars
ago
gra
de
gra
de
ou
t+
2ye
ars
ago
(1)
(2)
(3)
(4)
(5)
(6)
(7)
(8)
Sam
ple
A:
All
Chil
dre
n
WJC
wit
hin
1km
0.02
0**
-0.0
04
-0.0
18**
0.0
01
0.0
20*
-0.0
00
-0.0
17*
-0.0
02
(0.0
10)
(0.0
05)
(0.0
09)
(0.0
01)
(0.0
13)
(0.0
05)
(0.0
12)
(0.0
09)
Ob
serv
atio
ns
64,9
2164,9
21
64,9
21
64,9
21
53,3
78
53,3
78
53,
378
53,3
78
Nu
mb
erof
dis
tric
ts11
651165
1165
1165
1161
1161
1161
1161
Mea
nd
ep.
var.
0.91
70.0
48
0.0
23
0.0
02
0.7
78
0.0
36
0.0
94
0.0
85
Sam
ple
B:
Chil
dre
nof
the
wom
ense
lect
edfo
rth
eD
VM
odu
le
WJC
wit
hin
1km
0.02
3***
-0.0
06
-0.0
19***
0.0
01
0.0
30**
-0.0
07
-0.0
18
-0.0
03
(0.0
08)
(0.0
05)
(0.0
07)
(0.0
01)
(0.0
13)
(0.0
05)
(0.0
12)
(0.0
09)
Ob
serv
atio
ns
48,2
1348,2
13
48,2
13
48,2
13
30,3
80
30,3
80
30,
380
30,3
80
Nu
mb
erof
dis
tric
ts11
551155
1155
1155
1135
1135
1135
1135
Mea
nd
ep.
var.
0.91
90.0
48
0.0
22
0.0
02
0.7
82
0.0
38
0.0
90
0.0
84
Dis
tric
tF
EY
ES
YE
SY
ES
YE
SY
ES
YE
SY
ES
YE
SP
rovin
ce-Y
ear
FE
YE
SY
ES
YE
SY
ES
YE
SY
ES
YE
SY
ES
Cov
aria
tes
YE
SY
ES
YE
SY
ES
YE
SY
ES
YE
SY
ES
Rob
ust
stan
dard
erro
rsin
pare
nth
eses
***
p<
0.0
1,
**
p<
0.0
5,
*p<
0.1
No
tes:
The
dep
enden
tva
riable
isa
dum
my
indic
ati
ng
the
school
att
endance
statu
sof
the
child.
The
indep
enden
tva
riable
sm
easu
res
the
pre
sence
of
aW
JC
wit
hin
a1km
Eucl
idea
nbuff
erof
the
child’s
clust
erof
resi
den
ce.
Robust
standard
erro
rs(i
npare
nth
eses
)are
clust
ered
at
the
dis
tric
tle
vel
.T
he
sam
ple
for
pri
mary
level
incl
udes
childre
nb
etw
een
the
ages
of
6and
11
and
the
sam
ple
for
seco
ndary
level
incl
udes
childre
nb
etw
een
the
ages
of
12
and
16.
Cov
ari
ate
sin
clude
age,
gen
der
,house
hold
’shea
dyea
rsof
educa
tion,
num
ber
of
childre
nin
the
house
hold
aged
0-1
8,
num
ber
of
childre
nin
the
house
hold
aged
0-5
,num
ber
of
fem
ale
adult
s,num
ber
of
male
adult
s,ru
ral
resi
den
cedum
my,
dis
tric
tfixed
effec
tand
pro
vin
ce-b
y-y
ear
fixed
effec
t.Sourc
e:P
eru
DH
S2006-2
014.
54

Table 13: The Effect of WJC centers on Domestic Violence - (2006-2014)
Dep. variable Domestic Violence in last 12 monthsSample All women All women Only urban Ever WJC
clusters in districtControls Standard District trends Standard Standard
(1) (2) (3) (4)
Panel A: WJC center within a distance buffer from the cluster of residence
WJC within 1km -0.022** -0.018* -0.029*** -0.017(0.010) (0.011) (0.010) (0.012)
Observations 64,363 64,363 38,395 27,996Number of districts 1167 1167 485 215Mean dep. var 0.390 0.390 0.399 0.397
Panel B: WJC center in the district of residence
WJC in district -0.024** -0.060*** -0.023* -0.032*(0.011) (0.020) (0.014) (0.018)
Observations 96,560 96,560 58,579 42,393Number of districts 1293 1293 531 225Mean dep. var 0.387 0.387 0.397 0.394District FE YES YES YES YESProvince*Year FE YES YES YES YESCovariates YES YES YES YES
Robust standard errors in parentheses*** p<0.01, ** p<0.05, * p<0.1
Notes: The dependent variable is a dummy indicating whether the women suffered any type of domestic violence(less severe, severe or sexual violence) during the last 12 months. The independent variables measures the presenceof a WJC within a 1km Euclidean buffer of the women’s cluster of residence and presence of WJC center in thewomen’s district. Robust standard errors (in parentheses) are clustered at the district level. The sample includeswomen between the ages of 15 and 49. Women who were never married or never cohabited are excluded from thesample. Covariates include age, age at first marriage, number of children, years of education, number of householdmembers, number of households in the dwelling, maritual status (married=1), rural residence dummy, districtfixed-effects and province-by-year fixed effects. Source: Peru DHS 2006-2014.
55

Table 14: Impact of WJC centers on Emotional Violence - (2006-2014)
Dep. variables Emotional Spouse ever Spouse ever Spouse everviolence humiliated threatened threatened to
with harm take children(1) (2) (3) (4)
Sample A: All women 15-49 years old
WJC within 1km -0.010 -0.002 -0.003 -0.017*(0.010) (0.009) (0.006) (0.010)
Observations 64,364 64,364 64,364 64,364Number of districts 1167 1167 1167 1167Mean dep.var. 0.323 0.229 0.119 0.206
Sample B: Only women in urban clusters
WJC within 1km -0.018 -0.009 -0.007 -0.024**(0.011) (0.010) (0.007) (0.011)
Observations 38,396 38,396 38,396 38,396Number of districts 485 485 485 485Mean dep.var. 0.337 0.239 0.114 0.219District FE YES YES YES YESProvince*Year FE YES YES YES YESCovariates YES YES YES YES
Robust standard errors in parentheses*** p<0.01, ** p<0.05, * p<0.1
Notes: The dependent variable is a dummy indicating whether the women suffered any type of emotional violenceduring the last 12 months. The independent variables measures the presence of a WJC within a 1km Euclideanbuffer of the women’s cluster of residence. Robust standard errors (in parentheses) are clustered at the districtlevel. The sample includes women between the ages of 15 and 49. Women who were never married or nevercohabited are excluded from the sample. Covariates include age, age at first marriage, number of children, yearsof education, number of household members, number of households in the dwelling, maritual status (married=1),rural residence dummy, district fixed-effects and province-by-year fixed effects. Source: Peru DHS 2006-2014.
56

Table 15: Impact of WJC centers on Femicides and Female Hospitalization For Assault
Dep. var. # Femicides Log(# Female Hospitalizationsin department for Assault)
2009-2014 2007-2014(1) (2) (3) (4)
# WJC centers in the department -0.388** -0.418**(0.161) (0.185)
# WJC centers in the district -0.074** -0.075**(0.031) (0.031)
Log (Population) -19.132 -0.057(28.484) (0.051)
Observations 150 150 7,384 7,372Number of clusters 25 25 1846 1843Mean dep. var. 4.99 4.99 0.080 0.080Department FE YES YES NO NODistrict FE NO NO YES YESYear FE YES YES YES YESProvince-Year FE NO NO YES YES
Robust standard errors in parentheses*** p<0.01, ** p<0.05, * p<0.1
Notes: The dependent variable number of femicides at the department level was obtained from Peru’s CrimeObservatory at the Ministry of Public Affairs. Female hospitalization for assault at the district level was obtainedfrom the Peruvian Ministry of Health. The sample of female hospitalizations for assault includes women betweenthe ages of 18 and 59 and covers the rounds 2007, 2012, 2013 and 2014.
Table 16: The Effect of WJC centers on Femicides at the District Level - (2009-2015)
Dep. var Log(# Femicides)Sample All All Age 0-19 Age 20-39 Age 40-59 Age 60+
(1) (2) (3) (4) (5) (6)
# WJC centers in the district -0.008 -0.008 0.012 -0.021* 0.003 0.002(0.015) (0.015) (0.008) (0.012) (0.008) (0.001)
Log (District population) 0.023 -0.015 0.017 0.015 0.012*(0.036) (0.022) (0.026) (0.018) (0.007)
Observations 12,915 12,894 12,894 12,894 12,894 12,894Number of districts 1845 1842 1842 1842 1842 1842Mean dep. var 0.058 0.058 0.010 0.035 0.010 0.001District FE YES YES YES YES YES YESProvince-Year FE YES YES YES YES YES YES
Robust standard errors in parentheses*** p<0.01, ** p<0.05, * p<0.1
Notes: The dependent variable number of femicides at the district level was obtained from Peru’s Crime Obser-vatory at the Ministry of Public Affairs.
57

Tab
le17
:T
he
Eff
ect
ofW
JC
cente
rson
Typ
eof
Inst
itu
tion
Wom
enC
hoos
eto
See
kH
elp
from
Dom
esti
cV
iole
nce
Eve
nts
-(2
006-2
014)
Sou
ght
inst
ituti
on
al
help
aft
er
dom
est
icvio
len
ce
event
Pol
ice
Ju
stic
eD
istr
ict
DE
MU
NA
WJC
Om
bu
dsm
an
Hea
lth
NG
OO
ther
Sta
tion
Cou
rtA
ttorn
eyO
ffice
Cen
ter
Offi
ceF
aci
lity
(1)
(2)
(3)
(4)
(5)
(6)
(7)
(8)
(9)
Sam
ple
A:
All
Marr
ied
or
cohabi
tin
gw
om
en15-4
9ye
ars
old
WJC
wit
hin
1km
-0.0
19**
*-0
.001
-0.0
02
0.0
02
0.0
04*
-0.0
0009
-0.0
01
0.0
0008
0.0
02
(0.0
07)
(0.0
02)
(0.0
02)
(0.0
03)
(0.0
02)
(0.0
005)
(0.0
02)
(0.0
001)
(0.0
02)
Ob
serv
atio
ns
64,3
6364
,363
64,3
63
64,3
63
64,3
63
64,3
63
64,3
63
64,3
63
64,3
63
Nu
mb
erof
dis
tric
ts11
6711
671167
1167
1167
1167
1167
1167
1167
Mea
nd
ep.
var
0.08
90.
019
0.0
11
0.0
14
0.0
04
0.0
009
0.0
08
0.0
001
0.0
14
Sam
ple
B:
On
lym
arr
ied
or
cohabi
tin
gw
om
en15-4
9ye
ars
old
who
have
suff
ered
dom
esti
cvi
ole
nce
WJC
wit
hin
1km
-0.0
36*
-0.0
004
-0.0
08
0.0
04
0.0
09*
-0.0
002
0.0
0008
0.0
0008
-0.0
03
(0.0
20)
(0.0
04)
(0.0
06)
(0.0
09)
(0.0
05)
(0.0
02)
(0.0
04)
(0.0
001)
(0.0
05)
Ob
serv
atio
ns
25,0
9025
,090
25,0
90
25,0
90
25,0
90
25,0
90
25,0
90
25,0
90
25,0
90
Nu
mb
erof
dis
tric
ts11
1011
101110
1110
1110
1110
1110
1110
1110
Mea
nd
ep.
var
0.19
30.
043
0.0
26
0.0
33
0.0
11
0.0
02
0.0
19
0.0
003
0.0
29
Dis
tric
tF
EY
ES
YE
SY
ES
YE
SY
ES
YE
SY
ES
YE
SY
ES
Pro
vin
ce-Y
ear
FE
YE
SY
ES
YE
SY
ES
YE
SY
ES
YE
SY
ES
YE
SC
ovar
iate
sY
ES
YE
SY
ES
YE
SY
ES
YE
SY
ES
YE
SY
ES
Rob
ust
stan
dard
erro
rsin
pare
nth
eses
***
p<
0.0
1,
**
p<
0.0
5,
*p<
0.1
No
tes:
Sourc
e:P
eru
DH
S2006-2
014.
DE
MU
NA
isth
eacr
onym
for
”D
efen
sori
aM
unic
ipal
del
Nin
oy
elA
dole
scen
te”
or
”M
unic
ipal
Def
ense
Cen
ters
for
Childre
nand
Adole
scen
tes”
58

Table 18: Impact of WJC centers on Decision Making and Bargaining Power in the Household- (2006-2014)
Dep. variable Joint decision-makingscore (0-6) score (0-1) dummy(0/1)
(1) (2) (3)
Sample: Married or cohabiting women 15-49 years old
WJC within 1km 0.040 0.007 0.017*(0.047) (0.008) (0.009)
Observations 72,009 72,009 72,009Number of clusters 1168 1168 1168Mean dep.var. 2.238 0.373 0.798Dep. variable Earnings compared to husband
Earns more Earns Less Earns the samethan husband than husband as husband
Sample: Married or cohabiting women 15-49 years old
WJC within 1km 0.008 -0.034* 0.029**(0.011) (0.018) (0.014)
Observations 33,767 33,767 33,767Number of districts 1094 1094 1094Mean dep.var. 0.125 0.676 0.189District FE YES YES YESProvince*Year FE YES YES YESCovariates YES YES YES
Robust standard errors in parentheses*** p<0.01, ** p<0.05, * p<0.1
Notes: In the DHS women are asked who makes decisions on a variety of household issues. For instance, a womenis asked “who makes the final decision on your own health care?” “who makes the final decision on large householdpurchases?” etc. Responses include: respondent only, jointly with partner, and partner only. From these replies,we construct three measures of equal decision-making, that is, when the women makes decisions jointly withthe partner. Robust standard errors (in parentheses) are clustered at the district level. The sample includeswomen between the ages of 15 and 49. Covariates include age, age at first marriage, number of children, years ofeducation, number of household members, number of households in the dwelling, maritual status (married=1),rural residence dummy, district fixed-effects and province-by-year fixed effects. Source: Peru DHS 2006-2014.
59

Table 19: Impact of WJC centers on Women’s Labor Force Participation - (2006-2014)
Dep. variables Currently Works for Works for Self-working family someone else employed
(1) (2) (3) (4)
Sample A: All women 15-49 years old
WJC within 1km -0.010 -0.004 -0.010 0.005(0.010) (0.005) (0.008) (0.007)
Observations 113,785 113,786 113,786 113,786Number of clusters 1168 1168 1168 1168Mean dep.var. 0.646 0.211 0.305 0.236
Sample B: Married or cohabiting women selected for the DV module
WJC within 1km -0.009 -0.004 -0.024 0.017(0.014) (0.009) (0.017) (0.011)
Observations 64,354 64,354 64,354 64,354Number of districts 1167 1167 1167 1167Mean dep.var. 0.684 0.209 0.269 0.300District FE YES YES YES YESProvince*Year FE YES YES YES YESCovariates YES YES YES YES
Robust standard errors in parentheses*** p<0.01, ** p<0.05, * p<0.1
Notes: The dependent variable is a dummy indicating women’s labor force participation during the last 12 months.The independent variables measures the presence of a WJC within a 1km Euclidean buffer of the women’s clusterof residence. Robust standard errors (in parentheses) are clustered at the district level. The sample includeswomen between the ages of 15 and 49. Covariates include age, age at first marriage, number of children, years ofeducation, number of household members, number of households in the dwelling, maritual status (married=1),rural residence dummy, district fixed-effects and province-by-year fixed effects. Source: Peru DHS 2006-2014.
60

Table 20: Relationship between WJCs within 1km rollout and pre-program school enrollment
Schools matched to WJC within 1km, Pre-WJC period4 Log(Primary School 4 Log(Secondary School
Enrollment) Enrollment)(1) (2) (3) (4) (5) (6)498-00 498-05 498-10 498-00 498-05 498-10
WJC within 1km in 2002 0.028 0.060(0.032) (0.047)
WJC within 1km in 2003 -0.016 0.042(0.036) (0.050)
WJC within 1km in 2004 -0.021 -0.070(0.035) (0.054)
WJC within 1km in 2005 -0.054 -0.207***(0.156) (0.066)
WJC within 1km in 2006 -0.014 -0.048(0.031) (0.056)
WJC within 1km in 2007 -0.011 0.004 -0.020 0.013(0.029) (0.015) (0.046) (0.028)
WJC within 1km in 2008 -0.006 0.032 -0.032 0.041(0.029) (0.035) (0.045) (0.027)
WJC within 1km in 2009 - - - -
WJC within 1km in 2010 -0.034 0.008 0.003 0.036(0.028) (0.015) (0.045) (0.027)
WJC within 1km in 2011 -0.022 0.005 -0.052 0.032(0.027) (0.015) (0.045) (0.025)
WJC within 1km in 2012 0.002 0.017 0.005 -0.016 0.019 0.000(0.035) (0.017) (0.009) (0.043) (0.029) (0.013)
WJC within 1km in 2013 -0.029 0.017 0.009 -0.007 0.026 0.004(0.029) (0.016) (0.011) (0.045) (0.033) (0.018)
WJC within 1km in 2014 -0.021 0.007 0.004 -0.003 0.066** 0.031*(0.031) (0.020) (0.011) (0.043) (0.026) (0.016)
Observations 2,190 6,372 6,157 1,115 3,400 3,540Number of schools 1179 1247 678 607 710 404Year FE YES YES YES YES YES YESP-value joint test 0.536 0.275 0.925 0.001 0.148 0.197
Robust standard errors in parentheses*** p<0.01, ** p<0.05, * p<0.1
Notes: Standard errors that allow for clustering at the school level are reported in parentheses. The dependentvariable in columns 1-6 is the change in the logarithm of school enrollment plus one. The observations correspondto three windows of pre-WJC center period for each school. All regressions include year fixed-effects.
61

Table 21: Relationship between WJCs in the district rollout and pre-program school attendance
Districts matched to WJC locations, Pre-WJC 41996-20054 Primary School 4 Secondary School
Attendance Attendance(1) (2) (3) (4) (5) (6)496-00 496-05 496-10 496-00 496-05 496-10
WJC in the district in 2002 0.002 -0.071(0.036) (0.060)
WJC in the district in 2003 -0.056 0.032(0.060) (0.062)
WJC in the district in 2004 -0.005 0.041(0.036) (0.082)
WJC in the district in 2005 0.016 -0.051(0.036) (0.060)
WJC in the district in 2006 -0.057 -0.078(0.052) (0.087)
WJC in the district in 2007 -0.031 0.010 -0.065 0.033(0.040) (0.015) (0.109) (0.051)
WJC in the district in 2008 -0.011 0.012 -0.008 -0.013(0.039) (0.014) (0.098) (0.046)
WJC in the district in 2009 - - - - - -
WJC in the district in 2010 -0.026 0.011 -0.009 -0.062 0.015 -0.013(0.040) (0.014) (0.008) (0.071) (0.045) (0.028)
WJC in the district in 2011 -0.034 -0.002 -0.016 0.030 0.008 -0.029(0.041) (0.016) (0.009) (0.067) (0.036) (0.024)
WJC in the district in 2012 0.012 0.020 0.006 0.022 -0.040 -0.052(0.039) (0.014) (0.008) (0.076) (0.042) (0.041)
WJC in the district in 2013 -0.008 0.006 -0.012 0.055 0.002 -0.015(0.049) (0.021) (0.011) (0.101) (0.055) (0.030)
WJC in the district in 2014 -0.073 0.020 -0.007 -0.152 -0.049 -0.030(0.076) (0.054) (0.038) (0.125) (0.074) (0.054)
Observations 90 186 228 90 184 226Number of districts 90 106 102 90 106 102Year FE YES YES YES YES YES YESP-value joint test 0.000 0.676 0.222 0.000 0.712 0.778
Robust standard errors in parentheses*** p<0.01, ** p<0.05, * p<0.1
Notes: Standard errors that allow for clustering at the district level are reported in parentheses. The dependentvariable in columns 1-6 is the change in school attendance rate at the district level. The observations correspondto three windows of pre-WJC center period for each district. All regressions include year fixed-effects.
62
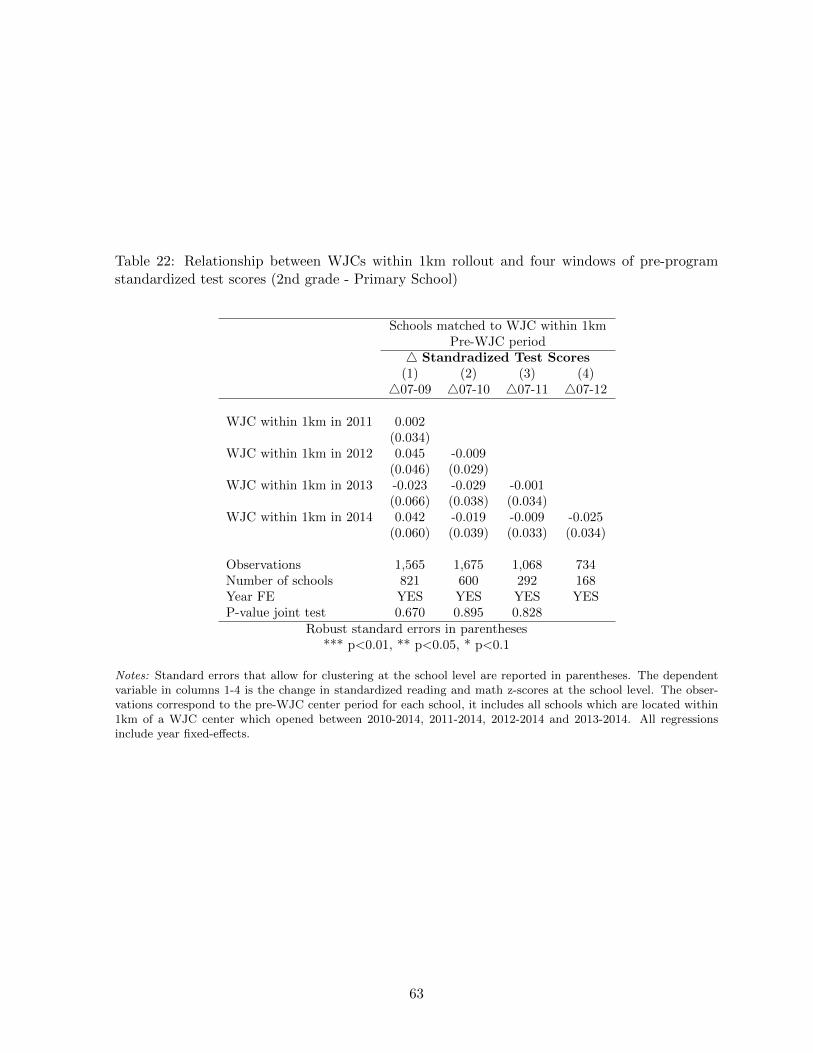
Table 22: Relationship between WJCs within 1km rollout and four windows of pre-programstandardized test scores (2nd grade - Primary School)
Schools matched to WJC within 1kmPre-WJC period
4 Standradized Test Scores(1) (2) (3) (4)407-09 407-10 407-11 407-12
WJC within 1km in 2011 0.002(0.034)
WJC within 1km in 2012 0.045 -0.009(0.046) (0.029)
WJC within 1km in 2013 -0.023 -0.029 -0.001(0.066) (0.038) (0.034)
WJC within 1km in 2014 0.042 -0.019 -0.009 -0.025(0.060) (0.039) (0.033) (0.034)
Observations 1,565 1,675 1,068 734Number of schools 821 600 292 168Year FE YES YES YES YESP-value joint test 0.670 0.895 0.828
Robust standard errors in parentheses*** p<0.01, ** p<0.05, * p<0.1
Notes: Standard errors that allow for clustering at the school level are reported in parentheses. The dependentvariable in columns 1-4 is the change in standardized reading and math z-scores at the school level. The obser-vations correspond to the pre-WJC center period for each school, it includes all schools which are located within1km of a WJC center which opened between 2010-2014, 2011-2014, 2012-2014 and 2013-2014. All regressionsinclude year fixed-effects.
63

Table 23: Relationship between WJCs in the district and four windows of pre-program domesticviolence
Districts matched to WJC locations, Pre-WJC period4 Domestic violence in last 12 months
(1) (2) (3) (4)42000-2005 42000-2008 42000-2010 42000-2013
WJC in the district in 2007 -0.021(0.088)
WJC in the district in 2008 -0.001(0.087)
WJC in the district in 2009 - -
WJC in the district in 2010 -0.018 -0.006(0.082) (0.035)
WJC in the district in 2011 0.013 0.007 -0.026(0.078) (0.034) (0.042)
WJC in the district in 2012 -0.025 0.060 -0.011(0.093) (0.041) (0.041)
WJC in the district in 2013 0.041 0.013 0.005(0.098) (0.061) (0.050)
WJC in the district in 2014 0.071 0.119** -0.036 -0.016(0.074) (0.078) (0.042) (0.020)
Observations 105 161 239 128Number of districts 78 99 83 38Year FE YES YES YES YESP-value joint test 0.416 0.103 0.433 -
Robust standard errors in parentheses*** p<0.01, ** p<0.05, * p<0.1
Notes: Standard errors that allow for clustering at the district level are reported in parentheses. The dependentvariable in columns 1-4 is the change domestic violence at the district level. The observations correspond to thepre-program period of the WJC center rollout for each district, it includes all districts that ever had a WJC centerwhich opened between 2006-2014, 2009-2014, 2010-2014 and 2013-2014. All regressions include year fixed-effects.
64

Figure 6: Effect of WJC center rollout on changes in pre-program outcomes-.0
4-.0
20
.02
.04
.06
Cha
nge
in L
og P
rimar
y En
rollm
ent (
1998
-200
5)
2006 2007 2008 2009 2010 2011 2012 2013 2014Year of WJC opening within 1km of the school
F-statistic for joint significance: 1.24p-value: [0.275]
-.1-.0
50
.05
.1.1
5C
hang
e in
Log
Sec
onda
ry E
nrol
lmen
t (19
98-2
005)
2006 2007 2008 2009 2010 2011 2012 2013 2014Year of WJC opening within 1km of the school
F-statistic for joint significance: 1.55p-value: [0.416]
a. Primary School Enrollment b. Secondary School Enrollment
-.1-.0
50
.05
.1.1
5C
hang
e in
Prim
ary
Atte
ndan
ce R
ate
(199
6-20
05)
2006 2007 2008 2009 2010 2011 2012 2013 2014Year of WJC opening in the district
F-statistic for joint significance: 0.70p-value: [0.676]
-.2-.1
0.1
.2C
hang
e in
Sec
onda
ry A
ttend
ance
Rat
e (1
996-
2005
)
2006 2007 2008 2009 2010 2011 2012 2013 2014Year of WJC opening in the district
F-statistic for joint significance: 0.65p-value: [0.712]
c. Primary School Attendance Rate d. Secondary School Attendance Rate
-.2-.1
0.1
.2C
hang
e in
sta
ndar
dize
d te
st s
core
s (2
007-
2009
)
2010 2011 2012 2013 2014Year of WJC opening within 1km of the school
F-statistic for joint significance: 0.43p-value: [0.672]
-.3-.2
-.10
.1.2
.3C
hang
e in
Dom
estic
Vio
lenc
e (1
996-
2005
)
2006 2007 2008 2009 2010 2011 2012 2013 2014Year of WJC opening in the district
F-statistic for joint significance: 1.03p-value: [0.416]
e. Test Scores (2nd Grade) f. Domestic Violence
Notes: Figure shows coefficient estimates from changes in the outcomes of interest during the pre-program periodon year of WJC center introduction indicators and year fixed effects.
65

Figure 7: Event Study: Pre-WJC and Post-WJC Trends in School Enrollment and Test Scores-.0
2-.0
10
.01
.02
.03
.04
Para
met
er e
stim
ate
- Log
(Prim
ary
Scho
ol E
nrol
lmen
t)
-3 -2 -1 0 1 2 3 4Years of exposure to a WJC within 1km
-.02
-.01
0.0
1.0
2.0
3.0
4Pa
ram
eter
est
imat
e - L
og(P
rimar
y Sc
hool
Enr
ollm
ent)
-3 -2 -1 0 1 2 3 4Years of exposure of WJC in the district
a. Primary School Enrollment - WJC <1km b. Secondary School Enrollment - WJC in the district
-.06
-.04
-.02
0.0
2.0
4Pa
ram
eter
est
imat
e - L
og(S
econ
dary
Sch
ool E
nrol
lmen
t)
-3 -2 -1 0 1 2 3 4Years of exposure to a WJC within 1km
-.06
-.04
-.02
0.0
2.0
4Pa
ram
eter
est
imat
e - L
og(S
econ
dary
Sch
ool E
nrol
lmen
t)
-3 -2 -1 0 1 2 3 4Years of exposure to WJC in the district
c. Secondary School Enrolment - WJC <1km d. Secondary School Enrollment - WJC in the district
-.1-.0
50
.05
.1Pa
ram
eter
est
imat
e - S
tand
ardi
zed
Test
Sco
res
-3 -2 -1 0 1 2 3 4Years of exposure to a WJC within 1km
-.05
0.0
5.1
Para
met
er e
stim
ate
- Sta
ndar
dize
d Te
st S
core
s
-3 -2 -1 0 1 2 3 4Years of exposure to a WJC in the district
e. Test Scores (2nd Grade) - WJC <1km f. Test Scores (2nd Grade) - WJC in the district
Notes: These graphs plot the coefficient obtained from a regression of the outcomes on the interation betweenpresence of WJC within 1km/in the district and dummies for the years leading up to the opening of the WJCcenters and years after the WJC introduction. Each bar represents the estimated coefficients and the capped,vertial line shows the estimated 95% confidence interval. Covariates include school fixed effects, year fixed effects,year-by-province fixed effects, and a vector of controls of baseline school characteristics interacted with academicyear.
66

Figure 8: Event Study: Pre-WJC and Post-WJC Trends in Children’s School Attendance andWomen’s Outcomes
-.03
-.01
.01
.03
Para
met
er e
stim
ate
- Prim
ary
scho
ol a
ttend
ance
-3 -2 -1 0 1 2 3 4Years of exposure to a WJC in the district
-.15
-.1-.0
50
.05
.1Pa
ram
eter
est
imat
e - S
econ
dary
Sch
ool A
ttend
ance
-3 -2 -1 0 1 2 3 4Years of exposure to a WJC in the district
a. Primary School Attendance b. Secondary School Attendance
-.15
-.1-.0
50
.05
.1Pa
ram
eter
est
imat
e - D
omes
tic v
iole
nce
-3 -2 -1 0 1 2 3 4Year of exposure to a WJC in the district
-.1-.0
50
.05
Para
met
er e
stim
ate
- Em
otio
nal V
iole
nce
-3 -2 -1 0 1 2 3 4Years of exposure to a WJC in the district
c. Domestic Violence d. Emotional Violence
-.05
0.0
5.1
Para
met
er e
stim
ate
- Joi
nt D
ecis
ion
Mak
ing
-3 -2 -1 0 1 2 3 4Years of exposure to a WJC in the district
-.1-.0
50
.05
Para
met
er e
stim
ate
- Lab
or F
orce
Par
ticip
atio
n
-3 -2 -1 0 1 2 3 4Years of exposure to a WJC in the district
e. Joint Decision Making f. Labor Supply
Notes: These graphs plot the coefficient obtained from a regression of the outcomes on the interation betweenpresence of WJC within 1km/in the district and dummies for the years leading up to the opening of the WJCcenters and years after the WJC introduction. Each bar represents the estimated coefficients and the capped,vertial line shows the estimated 95% confidence interval. Covariates include district fixed effects, year fixed effects,year-by-province fixed effects, and individual controls.
67

APPENDIX
68

Fig
ure
A-1
:G
eogr
aph
ical
Dis
trib
uti
onof
Pri
mar
yS
chool
san
dW
JC
cente
rs
69

Fig
ure
A-2
:G
eogr
aph
ical
Dis
trib
uti
onof
Sec
ond
ary
Sch
ool
san
dW
JC
cente
rs
70

Fig
ure
A-3
:G
eogr
aph
ical
Dis
trib
uti
onof
DH
Scl
ust
ers
and
WJC
cente
rs
71

Table A-1: School Enrollment Effects by Gender and Grade
Dep. variable School EnrollmentPrimary Schools Secondary Schools
WJC within WJC withinObs. Mean 1km Obs. Mean 1km(1) (2) (3) (4) (5) (6 )
Panel A: Results for Schools by GenderLog(Female enrollment) 315,221 46.9 0.033*** 102,685 84.42 0.009
(0.010) (0.017)Log(Male enrollment) 315,221 49.9 0.021 102,685 90.40 0.067***
(0.013) (0.014)
Panel B: Results for Schools by GradeGrade 1 enrollment 315,221 15.57 0.019* 102,685 40.97 0.027**
(0.010) (0.014)Grade 2 enrollment 315,221 17.08 0.030*** 102,685 38.18 0.034**
(0.009) (0.014)Grade 3 enrollment 315,221 16.55 0.026*** 102,685 35.18 0.023
(0.009) (0.015)Grade 4 enrollment 315,221 16.07 0.031*** 102,685 31.84 0.043**
(0.009) (0.018)Grade 5 enrollment 315,221 15.70 0.023** 102,685 28.64 0.044**
(0.009) (0.019)Grade 6 enrollment 315,221 14.97 0.033***
(0.009)School FE YES YESProvince*Year FE YES YESCovariates YES YES
Robust standard errors in parentheses*** p<0.01, ** p<0.05, * p<0.1
Notes: The dependent variable is the logarithm of enrollment plus one. The independent variables measures thenumber of WJC centers within a 1km Euclidean buffer from the school and presence of WJC center in school’sdistrict. Standard errors (in parentheses) are clustered at the school level. All regressions are weighted by initialschool enrollment level. Covariates include school fixed effects, year fixed effects, year-by-province fixed effects,and a vector of controls of baseline school characteristics interacted with academic year (including initial schoolenrollment, presence of electricity, presence of piped water, school language (spanish), urban and public schooldummy).Source: Peruvian School Census 2006-2014.
72

Table A-2: School Enrollment and Children’s School Attendance Status Effects by Gender
Dep. variable Currently Attending SchoolPrimary Level Secondary Level
Children 6-11 y.o. Children: 12-16 y.o.WJC within WJC within
Obs. Mean 1km Obs. Mean 1km(1) (2) (3) (4) (5) (6 )
Sample: FemaleSchool attendance 23,973 0.970 0.020** 14,855 0.891 0.022
(0.009) (0.019)Passed grade 23,573 0.917 0.033*** 12,808 0.781 0.031
(0.010) (0.024)Repeated grade 23,573 0.047 -0.010* 12,808 0.028 -0.020
(0.005) (0.009)Dropped out 23,573 0.022 -0.025** 12,808 0.088 -0.003
(0.010) (0.018)Left school 23,573 0.002 -0.0009 12,808 0.098 -0.006+2 year ago (0.001) (0.014)
Sample: MaleSchool attendance 24,646 0.970 0.015* 18,474 0.899 0.022
(0.008) (0.015)Passed grade 24,543 0.919 0.012 17,358 0.784 0.023
(0.009) (0.021)Repeated grade 24,543 0.050 -0.001 17,358 0.045 0.00007
(0.008) (0.008)Dropped out 24,543 0.021 -0.012* 17,358 0.091 -0.032*
(0.007) (0.018)Left school 24,543 0.002 0.001 17,358 0.074 0.009+2 year ago (0.001) (0.011)
District FE YES YESProvince*Year FE YES YESCovariates YES YES
Robust standard errors in parentheses*** p<0.01, ** p<0.05, * p<0.1
Notes: The dependent variable is a dummy indicating whether the child is currently attending primary or sec-ondary school. The independent variables measures the presence of a WJC within a 1km Euclidean buffer of thechild’s cluster of residence. Robust standard errors (in parentheses) are clustered at the district level. The samplefor primary level includes children between the ages of 6 and 11 and the sample for secondary level includes chil-dren between the ages of 12 and 16. Covariates include age, gender, household’s head years of education, numberof children in the household aged 0-18, number of children in the household aged 0-5, number of female adults,number of male adults, rural residence dummy, district fixed effect and province-by-year fixed effect. Source:Peru DHS 2006-2014.
73

Table A-3: The Effect of WJC Centers on Children’s Primary School Attendance - (2006-2014)- Alternative Euclidean Buffers
Dep. variable Currently Attending Primary LevelSample All children All children Only urban Ever WJC
6-11 y.o 6-11 y.o clusters in districtControls Standard District trends Standard Standard
(1) (2) (3) (4)
Panel A: WJC center within a distance buffer from the cluster of residence
WJC within 3km 0.007 0.004 0.015 0.010(0.011) (0.012) (0.014) (0.016)
Observations 48,703 48,703 25,391 19,563Number of districts 1159 1159 485 215Mean dep. var 0.970 0.970 0.971 0.969
Panel B: WJC center in the district of residence
WJC within 5km -0.007 -0.004 0.005 0.006(0.008) (0.008) (0.011) (0.007)
Observations 48,703 48,703 25,391 19,563Number of clusters 1159 1159 485 215Mean dep. var 0.970 0.970 0.970 0.967District FE YES YES YES YESProvince*Year FE YES YES YES YESCovariates YES YES YES YES
Robust standard errors in parentheses*** p<0.01, ** p<0.05, * p<0.1
Notes: The dependent variable is a dummy indicating whether the child is currently attending primary school.The independent variables measures the presence of a WJC within a 3km and 5km Euclidean buffer of thechild’s cluster of residence. Robust standard errors (in parentheses) are clustered at the district level. Thesample includes children between the ages of 6 and 11. Covariates include age, gender, household’s head years ofeducation, number of children in the household aged 0-18, number of children in the household aged 0-5, numberof female adults, number of male adults, rural residence dummy, district fixed effect and province-by-year fixedeffect. Source: Peru DHS 2006-2014.
74

Table A-4: The Effect of WJC Centers on Children’s Secondary School Attendance - (2006-2014)- Alternative Euclidean Buffers
Dep. variable Currently Attending Secondary LevelSample All children All children Only urban Ever WJC
12-16 y.o 12-16 y.o clusters in districtControls Standard District trends Standard Standard
(1) (2) (3) (4)
Panel A: WJC center within a distance buffer from the cluster of residence
WJC within 3km 0.008 0.009 0.016 0.012(0.012) (0.014) (0.014) (0.017)
Observations 33,519 33,519 18,266 13,570Number of clusters 1140 1140 480 215Mean dep. var 0.895 0.895 0.916 0.908
Panel B: WJC center in the district of residence
WJC within 5km -0.011 -0.001 -0.001 -0.003(0.013) (0.015) (0.016) (0.019)
Observations 33,519 33,519 18,266 13,570Number of clusters 1140 1140 480 215Mean dep. var 0.896 0.896 0.913 0.904District FE YES YES YES YESProvince*Year FE YES YES YES YESCovariates YES YES YES YES
Robust standard errors in parentheses*** p<0.01, ** p<0.05, * p<0.1
Notes: The dependent variable is a dummy indicating whether the child is currently attending secondary school.The independent variables measures the presence of a WJC within a 3km and 5km Euclidean buffer of the child’scluster of residence. Robust standard errors (in parentheses) are clustered at the district level. The sampleincludes children between the ages of 12 and 16. Covariates include age, gender, household’s head years ofeducation, number of children in the household aged 0-18, number of children in the household aged 0-5, numberof female adults, number of male adults, rural residence dummy, district fixed effect and province-by-year fixedeffect. Source: Peru DHS 2006-2014.
75

Table A-5: Domestic Violence Effects by Age, Education Level and Type of Domestic Violence- (2006-2014)
Dep. variable Domestic violence in last 12 monthsWJC within WJC in the
Obs. Mean 1km Obs. Mean district(1) (2) (3) (4) (5) (6)
Panel A: Results for Women by AgeWomen 15-33 years old 31,442 0.349 -0.004 47,136 0.355 -0.013
(0.018) (0.016)Women 34-49 years old 32,886 0.402 -0.038*** 49,380 0.418 -0.038***
(0.019) (0.018)
Panel B: Results for Women by Education LevelNo education 2,254 0.374 -0.102 3,380 0.374 0.134
(0.110) (0.119)Primary Level 22,198 0.402 -0.035 32,844 0.390 -0.025
(0.026) (0.024)Secondary Level 24,989 0.415 -0.018 37,834 0.394 -0.042**
(0.015) (0.016)Higher Level 14,033 0.331 -0.029* 21,435 0.316 0.013
(0.016) (0.025)
Panel C: Results for Women by Type of Domestic ViolenceLess severe violence 64,366 0.376 -0.029*** 96,560 0.373 -0.018
(0.010) (0.012)Severe violence 64,366 0.171 -0.014* 96,560 0.171 -0.006
(0.009) (0.009)Sexual violence 64,366 0.092 0.001 96,560 0.092 -0.007
(0.006) (0.007)
District FE YES YESProvince-Year FE YES YESCovariates YES YES
Robust standard errors in parentheses*** p<0.01, ** p<0.05, * p<0.1
Notes: The dependent variable is a dummy indicating whether the women suffered any type of domestic violence(less severe, severe or sexual violence) during the last 12 months. The independent variables measures thepresence of a WJC within a 1km Euclidean buffer of the women’s cluster of residence. Robust standard errors(in parentheses) are clustered at the district level. The sample includes women between the ages of 15 and 49.Women who were never married or never cohabited are excluded from the sample. Covariates include age, ageat first marriage, number of children, years of education, number of household members, number of householdsin the dwelling, maritual status (married=1), rural residence dummy, district fixed-effects and province-by-yearfixed effects. Source: Peru DHS 2006-2014.
76

Table A-6: Domestic Violence Effects by Childhood Domestic Violcence and Wealth - (2006-2014) (Continuation)
Dep. variable Domestic violence in last 12 monthsWJC within WJC in the
Obs. Mean 1km Obs. Mean district(1) (2) (3) (4) (5) (6)
Panel A: Results for Women by Childhood Domestic ViolenceFather beat mother 29,052 0.475 -0.042** 43,686 0.473 -0.014
(0.018) (0.018)Father did not beat mother 32,104 0.310 0.002 48,408 0.308 -0.022
(0.015) (0.018)
Panel B: Results for Women by Wealth IndexPoorest 14,599 0.357 0.016 21,672 0.352 -0.014
(0.046) (0.030)Poorer 16,540 0.418 -0.009 25,069 0.417 0.011
(0.030) (0.031)Middle 14,592 0.429 -0.037* 21,855 0.425 -0.035
(0.020) (0.032)Richer 10,425 0.392 -0.008 15,862 0.390 -0.007
(0.029) (0.027)Richest 7,416 0.310 -0.040 11,186 0.308 -0.053
(0.029) (0.033)
District FE YES YESProvince-Year FE YES YESCovariates YES YES
Robust standard errors in parentheses*** p<0.01, ** p<0.05, * p<0.1
Notes: The dependent variable is a dummy indicating whether the women suffered any type of domestic violence(less severe, severe or sexual violence) during the last 12 months. The independent variables measures thepresence of a WJC within a 1km Euclidean buffer of the women’s cluster of residence. Robust standard errors(in parentheses) are clustered at the district level. The sample includes women between the ages of 15 and 49.Women who were never married or never cohabited are excluded from the sample. Covariates include age, ageat first marriage, number of children, years of education, number of household members, number of householdsin the dwelling, maritual status (married=1), rural residence dummy, district fixed-effects and province-by-yearfixed effects. Source: Peru DHS 2006-2014.
77

Table A-7: Relationship between WJCs centers within 1km and pre-program school enrollment
Schools matched to WJC within 1km, Pre-WJC 41998-20054 Log(Primary School 4 Log(Secondary School
Enrollment) Enrollment)(1) (2) (3) (4) (5) (6)All Female Male All Female Male
WJC within 1km in 2006 (excluded group)
WJC within 1km in 2007 0.004 0.023 -0.001 0.013 -0.015 -0.030(0.015) (0.021) (0.016) (0.028) (0.032) (0.035)
WJC within 1km in 2008 0.032 0.036 0.005 0.041 0.039 -0.012(0.029) (0.022) (0.019) (0.027) (0.027) (0.037)
WJC within 1km in 2009 - - - - - -
WJC within 1km in 2010 0.008 0.027 -0.003 0.036 0.035 -0.018(0.015) (0.020) (0.015) (0.027) (0.027) (0.034)
WJC within 1km in 2011 0.005 0.020 -0.006 0.032 0.024 -0.028(0.015) (0.020) (0.016) (0.025) (0.026) (0.034)
WJC within 1km in 2012 0.017 0.032 0.012 0.019 0.016 -0.035(0.017) (0.022) (0.017) (0.029) (0.028) (0.037)
WJC within 1km in 2013 0.017 0.023 0.003 0.026 0.014 -0.028(0.016) (0.023) (0.020) (0.033) (0.032) (0.042)
WJC within 1km in 2014 0.007 0.024 0.005 0.066** 0.062** -0.013(0.020) (0.023) (0.020) (0.026) (0.026) (0.038)
Observations 6,372 6,372 6,372 3,400 3,400 3,400Number of schools 1247 1247 1247 710 710 710Year FE YES YES YES YES YES YESP-value joint test 0.275 0.847 0.966 0.148 0.192 0.974
Robust standard errors in parentheses*** p<0.01, ** p<0.05, * p<0.1
Notes: The dependent variable in columns 1-6 is the change in the logarithm of school enrollment plus one between1998-2005. The observations correspond to the pre-WJC center period for each school (1998-2005), it includes allschools that are located within a 1km Euclidean buffer of a WJC center, which opened between 2006 and 2014.Standard errors that allow for clustering at the school level are reported in parentheses. All regressions includeyear fixed-effects, the excluded group is presence of a WJC center within 1km in 2006.
78

Table A-8: Relationship between WJC centers in the district rollout and pre-program schoolattendance
Districts matched to WJC locations, Pre-WJC 41996-20054 Primary School 4 Secondary School
Attendance Attendance(1) (2) (3) (4) (5) (6)All Female Male All Female Male
WJC in the district in 2006 (excluded group)
WJC in the district in 2007 0.010 -0.006 0.013 0.033 0.038 0.024(0.015) (0.029) (0.016) (0.051) (0.056) (0.063)
WJC in the district in 2008 0.012 -0.003 0.009 -0.013 -0.026 -0.001(0.014) (0.031) (0.013) (0.046) (0.067) (0.059)
WJC in the district in 2009 - - - - - -
WJC in the district in 2010 0.011 0.001 -0.004 0.015 -0.022 0.045(0.014) (0.028) (0.016) (0.045) (0.060) (0.055)
WJC in the district in 2011 -0.002 -0.015 -0.001 0.008 0.019 -0.001(0.016) (0.030) (0.016) (0.036) (0.042) (0.042)
WJC in the district in 2012 0.020 0.002 0.021 -0.040 -0.026 -0.064(0.014) (0.029) (0.013) (0.042) (0.049) (0.051)
WJC in the district in 2013 0.006 -0.011 -0.010 0.002 -0.048 0.037(0.021) (0.038) (0.032) (0.055) (0.081) (0.059)
WJC in the district in 2014 0.020 0.001 0.024 -0.049 -0.153 -0.004(0.054) (0.065) (0.048) (0.074) (0.109) (0.067)
Observations 186 182 183 184 180 179Number of districts 106 103 106 106 103 105Year FE YES YES YES YES YES YESP-value joint test 0.676 0.936 0.394 0.712 0.568 0.554
Robust standard errors in parentheses*** p<0.01, ** p<0.05, * p<0.1
Notes: The dependent variable in columns 1-6 is the change in school attendance rate at the district level between1996-2005. The observations correspond to the pre-WJC center period for each district (1996-2005), it includes alldistricts which have a WJC cener that opened between 2006 and 2014. Standard errors that allow for clusteringat the district level are reported in parentheses. All regressions include year fixed-effects, the excluded group ispresence of a WJC center in the district in 2006.
79

Figure A-4: WJC center and CCT Juntos presence in the district
0
200
400
600
800
1,000
1,200
1,400N
umbe
r of d
istri
cts
(#)
1999
2000
2001
2002
2003
2004
2005
2006
2007
2008
2009
2010
2011
2012
2013
2014
CCT Juntos & WJC Center Presence
Districts with CCT Districts with WJC Districts with CCT & WJC
Figure A-5: WJC center and CCT Juntos entry in the district
0
100
200
300
400
Num
ber o
f dis
trict
s (#
)
1999
2000
2001
2002
2003
2004
2005
2006
2007
2008
2010
2011
2012
2013
2014
CCT Juntos & WJC Center Expansion
Districts with CCT Districts with WJC Districts with CCT & WJC
80

Table A-9: Correlation between WJC center and CCT Juntos program implementation (2005-2014)
Dep. var. WJC center WJC centerentryd presenced
(1) (2) (3) (4)
CCT Juntos entryd 0.002 0.005(0.003) (0.004)
CCT Juntos presenced -0.027*** 0.001(0.008) (0.008)
Observations 18,390 18,390 18,390 18,390Number of districts 1839 1839 1839 1839
District FE NO YES NO YESYear FE NO YES NO YES
Robust standard errors in parentheses*** p<0.01, ** p<0.05, * p<0.1
Notes: Standard errors that allow for clustering at the district level level are reported in parentheses. Program(WJC or CCT) entry is equal to one only in the year of introduction in the district. Program presence is equalto one in every year beginning with the first year after the program entry.
81

Figure A-6: Rollout of the WJCs across Time and Space (1999-2014)
a. WJC centers and CCT - (1999-2006) b. WJC centers and CCT - (2007-2008)
c. WJC centers and CCT - (2010-2012) d. WJC centers and CCT - (2013-2014)
82

Table A-10: Domestic Violence by Children’s Primary Level School Attendance Status - (2006-2014)
Primary Level (6-11 y.o.) Children’s SchoolAttendance Status
Not Attending Attending Diff(1) (2) (3)
Domestic violence (All) 0.435 0.408 0.026**(0.010) (0.001) (0.010)
Observations 2,131 69,735
Domestic violence (Urban Areas) 0.469 0.430 0.038***(0.014) (0.002) (0.014)
Observations 1,149 37,185
Domestic violence (Rural Areas) 0.395 0.384 0.010(0.015) (0.002) (0.015)
Observations 982 32,550
Table A-11: Primary Level Attendance Rates by Proximity to WJC center and Presence of aWJC center in the district - (2006-2014)
Primary Level (6-11 y.o.) WJC within 1km WJC in the districtNo No
WJC WJC Diff WJC WJC Diff.(1) (2) (3) (4) (5) (6)
Attendance Rate (All) 0.971 0.962 0.008*** 0.972 0.965 0.007***(0.000) (0.002) (0.002) (0.000) (0.002) (0.001)
Observations 42,914 5,789 48,895 22,971
Attendance Rate (Urban Areas) 0.974 0.962 0.012*** 0.975 0.964 0.010***(0.001) (0.002) (0.002) (0.001) (0.001) (0.001)
Observations 19,654 5,740 19,250 19,084
Attendance Rate (Rural Areas) 0.968 1 -0.031 0.971 0.967 0.003(0.001) (0) (0.024) (0.000) (0.002) (0.002)
Observations 23,260 49 29,645 3,887
83

Table A-12: The Effect of WJC Centers on Child Labor - (2006-2014)
Dep. variable Child LaborSample All children All children Female Male
6-14 y.o 6-14 y.o(1) (2) (3) (4)
Panel A: All Children
WJC within 1km -0.021*** -0.008* -0.014** -0.003(0.005) (0.004) (0.006) (0.006)
Observations 97,933 97,933 48,108 49,816Number of districts 1169 1169 1162 1164Mean dep. var 0.070 0.070 0.064 0.075
Panel B: Children of the women selected for the DV module
WJC within 1km -0.024*** -0.012** -0.018** -0.006(0.006) (0.005) (0.008) (0.007)
Observations 71,410 71,410 35,162 36,215Number of districts 1163 1163 1145 1147Mean dep. var 0.065 0.065 0.059 0.070District FE YES YES YES YESProvince*Year FE YES YES YES YESCovariates NO YES YES YES
Robust standard errors in parentheses*** p<0.01, ** p<0.05, * p<0.1
Notes: The dependent variable is a dummy indicating whether the child is currently working. The independentvariables measures the presence of a WJC within a 1km Euclidean buffer of the child’s cluster of residence. Robuststandard errors (in parentheses) are clustered at the district level. The sample includes children between the agesof 6 and 14 years old. Covariates include age, gender, household’s head years of education, number of childrenin the household aged 0-18, number of children in the household aged 0-5, number of female adults, number ofmale adults, rural residence dummy, district fixed effect and province-by-year fixed effect. Source: Peru DHS2006-2014.
84

Tab
leA
-13:
Th
eE
ffec
tof
WJC
cente
rson
Wom
en’s
Hea
lth
Ou
tcom
es-
(200
6-2014)
Dep
.va
riab
les
An
emic
Wei
ght
BM
IS
mokes
Nu
mb
erU
nw
ante
dT
een
inkil
os
of
cigare
tsla
stch
ild
pre
gn
an
cyS
amp
le15-4
9ye
ars
old
15-1
9ye
ars
old
(1)
(2)
(3)
(4)
(5)
(6)
(7)
Sam
ple
A:
All
wom
en
WJC
wit
hin
1km
-0.0
08
0.6
21***
0.1
56*
0.0
03
-0.0
09
-0.0
21**
-0.0
10**
(0.0
08)
(0.1
91)
(0.0
84)
(0.0
03)
(0.0
14)
(0.0
09)
(0.0
05)
Ob
serv
atio
ns
74,6
52
73,1
83
73,1
01
79,1
86
79,1
71
35,8
48
21,0
44
Nu
mb
erof
dis
tric
ts11
351135
1135
1168
1167
1151
1077
Mea
nd
ep.
var
0.26
161.7
226.8
60.0
37
0.0
54
0.2
73
0.0
38
Sam
ple
B:
On
lyw
om
enin
urb
an
clu
ster
s
WJC
wit
hin
1km
-0.0
10
0.6
42***
0.1
67*
0.0
04
-0.0
12
-0.0
24**
-0.0
09*
(0.0
09)
(0.2
29)
(0.1
00)
(0.0
05)
(0.0
19)
(0.0
10)
(0.0
05)
Ob
serv
atio
ns
46,2
11
45,1
72
45,1
15
48,8
63
48,8
51
20,3
13
13,4
92
Nu
mb
erof
dis
tric
ts47
8478
478
486
485
481
473
Mea
nd
ep.
var
0.25
163.7
27.4
0.0
51
0.0
79
0.2
10
0.0
30
Dis
tric
tF
EY
ES
YE
SY
ES
YE
SY
ES
YE
SY
ES
Pro
vin
ce-Y
ear
FE
YE
SY
ES
YE
SY
ES
YE
SY
ES
YE
SC
ovar
iate
sY
ES
YE
SY
ES
YE
SY
ES
YE
SY
ES
Rob
ust
stan
dard
erro
rsin
pare
nth
eses
***
p<
0.0
1,
**
p<
0.0
5,
*p<
0.1
No
tes:
Sourc
e:P
eru
DH
S2006-2
014.
85