Embed Size (px)
Citation preview

Inter-Agency Rapid Flood Assessment WFP-UNICEF-Save the Children Alliance
Nepal - August 2007
Executive summary Heavy rain for a period of two weeks caused major flooding in the Terai at the end of July. In mid-August, a second
period of rain resulted in renewed flooding in many areas. By the end of August most flood water had receded and areas
were accessible again, however continued rain since then may cause further flooding and hardship for poor Terai
communities. Flooding is a recurrent problem during the monsoon period in the plains of Nepal and there is an urgent
need for a longer-term solution to mitigate the impact of flood water in the these districts through river training
programmes, river drainage, embankments, building of higher shelter houses and disaster preparedness programmes for
the most vulnerable areas.
In order to assess the impact of the flood on people’s livelihoods, food security, education, health and nutrition status and
to formulate appropriate short- and longer-term responses, an inter-agency assessment was organized by WFP, UNICEF
and Save the Children Alliance with field level support provided by the Nepal Red Cross Society. Highlights of the findings
include the following:
• The flood affected a very large number of households. Across the 13 districts assessed, an estimated total of 25,254
households were severely affected, 40,000 were highly affected and 17,236 moderately affected. With an average
household size of 5.6 people per households, this translates in a total of almost half a million people affected by the
floods. Most of the affected are amongst the poorest, marginalized and landless Dalits, Madhesi, Tharu, Muslim and
Janajati groups.
• The flood had the biggest impact on housing, particularly those of poor households made of bamboo, straw and
mud. More than 23,000 houses were completely destroyed. Crop land near rivers and in low-lying areas was heavily
affected with high or total crop losses. In other areas the standing paddy crop has benefited from the temporary
immersion and an overall surplus production in these areas is expected. Vegetable production has suffered the biggest
impact with prices for green-leaf vegetables having more than doubled.
• The household food security status is expected to deteriorate in the coming months due to the impact of the flood.
Although food stocks could mostly be saved, the affected population is currently heavily borrowing to satisfy their food
needs and food intake has deteriorated with nutritious food such as vegetables and lentils out of reach for poor
households due to sharp increases in market prices.
• As per the Demographic and Health Survey (2006) data, malnutrition in the flood affected areas is acute and
widespread. The flood emergency has caused an additional risk for further deterioration in the nutritional status of the
already very vulnerable (child) population. However, beyond seasonal deterioration in malnutrition indicators, no increase
in the number of severely acute children can be observed as yet. The underlying causes to the very poor nutritional status
include food insecurity, poor child feeding and care practices, very poor sanitation and hygiene conditions, and poor
health environment. These issues have been compounded by the impact of the floods which have caused increased food
insecurity with a change in food composition towards less nutritious foods, concentration of defecation area on foot paths
near to communities and a high incidence of diarrhoea among the population.
• No epidemics are reported as yet. The government health system seems to be quite well prepared and is sending
rapid response teams to areas with diarrhoea outbreaks to quickly contain further contamination. The potential spread in
vector-born diseases needs to be closely monitored as stagnant flood water provides a perfect breeding ground for
mosquitoes.
- 1 -

• In almost all districts, health posts are functioning normally, although accessibility was a problem during the flood
and is still an issue in some heavily affected areas. Most schools affected by the flood are functioning again. Where
schools and classrooms were destroyed or damaged by the flood, there is a lack of adequate classrooms and teaching
materials which is likely to have a long-term impact on the ability to provide education to children in these areas.
A series of recommendations regarding response options based on the findings of the assessment is provided in the final
section of this report.
Objectives of Rapid Assessment Two weeks of incessant rains beginning in mid-July and
continuing into August, resulted in heavy flooding in the
plain areas of Nepal, known as the Terai, at the end of
July and beginning of August 2007. Although the flood
water started to recede in most areas by mid-August, a
second period of rain resulted in renewed flooding
especially in areas that suffered the most damage from
previous flooding. Over the next few weeks, more rain
is expected which is likely to lead to further flooding
and continued hardship for the affected population.
Minor floods are a recurrent phenomenon in the Terai
during the monsoon period, which normally lasts from
June until September. However, this year’s flood was
more intensive, covered a much wider area, caused
more widespread damage to houses and had an
extensive impact on people’s livelihoods compared to
the impact of flooding typical in these areas.
In order to assess the impact of the flood on people’s
livelihoods, food security, education, health and
nutrition status and to formulate appropriate short and
longer-term responses, an inter-agency assessment
was organized by WFP, UNICEF and Save the Children
Alliance with field level support provided by the Nepal
Red Cross Society.
Specific objectives of the rapid assessment were:
To identify and map out flood affected areas.
To collect and verify available data on the severity
of the flood impact in terms of numbers of
affected population and areas of crop loss.
To assess the impact of the flood on household
food security status, the nutrition and health
situation, agriculture and market conditions, and
education.
To collect information on the immediate response
and identify gaps.
Process and Methodology The assessment covered 13 of the most affected
districts in the Terai. Six teams covered 2 to 3 districts
each. The assessment in the Western districts of Kailali,
Banke, Bardiya, Rupandehi and Nawalparasi took place
from 14-18 August 2007. Due to security concerns in
the Central and Eastern Terai districts of Parsa, Bara,
Rautahat, Sarlahi, Mahottari, Dhanusha, Siraha and
Saptari, and lack of guarantee for unhindered access by
the different activist groups operating in this area, the
assessment mission could not take place until 21 to 25
August 2007.
In each district, two days were available to complete
the assessment. On the first day, consultation meetings
were held with relevant stakeholders, including staff
from the Nepal Red Cross Society (NRCS), Chief District
Officer (CDO), District Disaster and Response
Committee (DDRC), District Health Officer (DHO),
District Agricultural Department Officer (DADO) and
District Education Officer (DEO), and relevant (I)NGOs
working in the respective districts. The second day was
used for field visits to one or if possible two of the most
highly affected VDCs in the district.
A standardized checklist was used by all field teams for
the assessment (Annex I). This checklist was sent to
the districts prior to the arrival of the assessment
teams. In districts covered by the WFP Food Security
Monitoring and Analysis System (FSMAS), the locally
based WFP field monitor in collaboration with the NRCS
District Chapters compiled the required data and
prepared draft maps. This allowed the assessment
- 2 -

teams to focus on cross verification of the data and
information with various stakeholders. During DDRC
meetings an effort was made to find consensus on the
draft flood impact maps and solve issues based upon
inconsistent data.
In all districts the teams were accompanied to the field
by field staff of the NRCS. In affected communities,
interviews were held with displaced households,
women, VDC secretaries, police, teachers and health
workers. The crop conditions were observed in affected
areas and farmers were interviewed. At local markets,
traders were consulted about the current market
conditions.
Extent of the Flood Impact The NRCS has collected data on flood impact in most
VDCs. CDO and DDRC also compiled numbers on
affected households in some districts by ward. In
several districts (Dhanusa, Mahotarri, Banke, Bardiya)
additional data was available from NGOs working in the
area. Definitions of flood-affectedness varied across
various sources, resulting in inconsistent data when
compared. Data are mostly based on extent of damage
(fully or partially) to people’s homes, the overall area
submerged under water, estimated crop losses and the
number of people temporarily displaced. Some level of
data inflation is to be expected due to political pressure
and expectation for relief support by households. In
most districts, available NRCS data was closely aligned
to the observations of the assessment teams in the
field and are therefore the primary data used
throughout this report to estimate the extent of the
flood impact.
Area affected
Consensus was sought among different stakeholders at
the district level to develop a flood impact map
identifying the most flood-affected areas. The following
criteria were used to categorize the VDCs into worst
affected, highly affected, moderately affected, lightly
affected or not affected:
1. Percentage of households affected
2. Extent of crop loss
3. Area submerged under water and degree and
extent of water logging.
Although in general consensus was found at the district
level regarding the maps produced, further cross-
checking with available data afterwards showed that
the classification and the reported numbers of affected
households do not always correspond. Some VDCs with
high numbers of affected households have been
identified as moderately impacted areas while other
VDCs with low numbers of affected households were
identified as highly affected. It may be the case that in
these instances only some wards within the VDC are
heavily affected and not the whole VDC (as was the
case in one of the identified severely affected VDCs in
Sarlahi district and one VDC in Bara district visited by
the assessment mission)..Unfortunately, except in some
districts (e.g. Sarlahi) at this stage, ward level
information is not readily available.
Map 1 shows the flood affected areas. The most
affected districts include Siraha, Dhansusha and
Mohattari in the East and Kailali in the West of Nepal.
Detailed maps for each district can be found in Annex
II.
There are several highly affected areas which are
currently still not accessible by road either due to very
bad road conditions or water logging. These, often
remote VDCs, are marked with symbol in the maps
in Annex II.
Although there is a general security concern across the
Terai1, based on relief distributions successfully
conducted by NRCS, there is the expectation at the
district level that security issues will not affect the
overall provision of humanitarian assistance. However,
there have been incidences of UN vehicles being
obstructed by activists, hampering the transportation of
large amounts of food aid.
1 All Terai district (except for Chitwan) are currently in phase 3 of the UN security system.
- 3 -

Map 1 – Flood affected areas
- 4 -

Number of affected people
Table 1 summarizes the total number of affected
population in the 13 districts. Details by district and for
each affected VDC in that district can be found in the
tables presented in Annex III.
Based on the NRCS data, supplemented by data on
crop losses and information on vulnerable groups,
estimates were derived for three levels of affectedness:
severely, highly and moderately.
A household was classified as severely affected if the
household was landless (defined as owning less than 1
Kattha2), depending on wage labour and the flood had
completely damaged their house. Severely affected also
includes those households owning more than 1 Kattha,
but who had completely lost their standing crops and
house.
Highly affected households include landless households
whose house was partially damaged and landowners
whose houses were either partially or fully damaged
and all or part of their crops were lost.
Moderately affected households include those who lost
their transplanted paddy crops and whose house
suffered damage due to water logging.
Table 1 – Number of Affected Population
Severely Highly Moderately
1 Saptari 89 3,381 5,340 2,863
2 Siraha 83 2,334 1,952 5,718
3 Dhanusha 102 4,907 9,732 6,222
4 Mahottari 61 4,242 5,310 -
5 Sarlahi 42 1,321 3,619 -
6 Rautahat 95 1,481 1,166 2,406
7 Bara 62 864 598 -
8 Parsa 65 1,788 572 27
9 Nawalparasi 19 654 1,983 -
10 Rupandehi 32 922 * -
11 Banke 45 1,122 4,828 -
12 Bardiya 32 957 3,475 -
13 Kailali 27 1,281 1,429 -
754 25,254 40,004 17,236Total
Districts Name (East to West)
No. of affected
VDCs
Number of affected householdsSN
* For districts in the west (Kalaili, Banke, Bardiya, Rupandehi and Nawalparasi) estimated
numbers on severely and highly affected households are based only on fully and partially
destroyed houses.
Across the 13 districts an estimated total of 25,254
households were severely affected, 40,000 were highly
affected and 17,236 moderately affected.
2 One Kattha equals 0.034 hectare
Segregated data for specific population groups were
not available. However, in general there was consensus
that certain groups (Dalits, Janajatis, Muslims) and poor
landless households living in mud-constructed houses in
low-lying areas were the most severely affected. A
second highly affected group included small farmers
near main rivers whose land was washed away or
covered by huge amounts of sediment, causing loss of
income and livelihood.
As mentioned, there is inconsistency between different
available data sets. It is likely that to some extent
inflation in the number of flood affected people has
occurred. This was also confirmed by field visits to
severely affected communities where in some cases
less than the reported number of fully destroyed
houses was observed. The announcement by the
government to compensate flood affected people for
house damage and a supply of three months food
ration may have resulted in more people on the
affected list in anticipation of relief assistance. In
addition, pressure from political parties and other
constituencies may also have resulted in higher
numbers. Careful ground-level verification in affected
areas is therefore required to ensure that relief and
recovery assistance reaches those most in need.
Impact on Housing The flood had the biggest impact on housing,
particularly on mud-built houses of poor households in
low-lying areas. The incessant rain and the slow rising
water levels followed by days of inundation caused
many houses to eventually collapse or caused extensive
damage to floors and walls. The mission did not find a
concentration of damaged houses in one particular
area, except in some areas near main rivers. In
general, damage was scattered across the affected
areas with a somewhat higher concentration in low-
lying waterlogged areas and poor communities.
Table 2 shows the estimated number of houses fully or
partially damaged according to NRCS data by district.
- 5 -

Table 2 – Number of Affected Houses and IDPs
Number of affected houses
Districts Completely destroyed
Partly destroyed
No. of displaced families
Saptari 4000 1774 5000 Siraha 3367 5137 1680 Dhanusha 3272 7779 5311 Mahottari 4028 5588 2300 Sarlahi 1155 3276 1127 Rautahat 1206 1041 718 Bara 590 375 n/a Parsa 1600 687 n/a Nawalparasi 632 50 632 Rupandehi n/a n/a 700 Banke 1429 5009 n/a Bardiya 911 3113 595 Kailali 1332 428 440
Total 23518 34246 18503
Source: NRCS
It was observed by the assessment mission that most
households with damaged or destroyed houses had
already been provided with tarpaulins. The Government
is planning to compensate the families with NRs 10,000
if their house is completely destroyed and with NRs
5,000 in case their house is partially destroyed.
Financial support however has not yet materialized.
In general, flood affected families do have cooking
utensils and access to firewood or other fuel for
cooking purposes. In most cases, flood affected
families that have lost cooking and household goods
during the floods have received NFIs, including cooking
utensils from the NRCS or other agencies.
Internally Displaced People (IDP)
Table 2 shows the estimated number of displaced
people based upon available data. At the time of the
assessment most displaced people were no longer
residing in temporary IDP sites, except for those in
Bardiya and Kailali. In Kailali, more than 300 displaced
families coming from Thapapur, Bhajani, Lalbhoji and
Joshipur VDCs are in the Mohnyl Higher Secondary
School and in the nearby forest area. In Bardiya, NRCS
reported that there are about 235 displaced families
staying in temporary camps (see Table 3). Although no
exact figures of IDPs were made available in Dhanusha
and Mahottari, it was reported by the NRCS and DEOs
that several families were still residing in a number of
schools.
Table 3 – Displaced families
District Displaced from Temporary camp No. of families Dhanusa Inarwa VDC 2 schools in Inarwa n/a Mahottari n/a 5 – 7 schools n/a Kailali Thapapur,
Bhajani, Lalbhoji & Joshipur VDCs
Mohnyl Higher Secondary School and its nearby forest area
More than 300 families
Bhimapur VDCs Belasa, Bhimapur 30 Rajapur Chediya, Rajapur About 60
families Mohamadpur Bikri cotton farm 88 Thapuwa School 7 landless
families Padnaha Padnaha-8 10
Bardiya
Suryapatuwa Community forest, Bhagaraiya
40
Source: NRCS
During the height of the flood, many more people took
shelter in schools, public buildings or community relief
shelters. For example 40 out of 76 households from
ward no. 8 of Rampurkhadauna in Rupandehi, took
refuge in community shelters for two days.
With water levels decreasing, people have returned to
their houses. Those who have lost their house have
moved in with their neighbours or family members. In
several areas they are residing under makeshift shelters
made of tarpaulin or recovered remnants of their house
such as roof parts. For people still living in a makeshift
shelter, more permanent shelter is an urgent priority (in
ward 4 of Harine VDC, Dhanusha, at least 10 families
were found constructing and living in makeshift shelters
after recently having received tarpaulins).
Looking at the conditions of the temporary camps and
people living in makeshift shelters, insufficient food,
poor shelter conditions and lack of access to safe and
clean drinking water are major challenges faced by the
displaced. It is expected that people in the temporary
camps in Bardiya and Kailali will soon return to their
villages after the water level recedes. However, return
for the landless and homeless poor will be very difficult
without additional support.
Impact on Water and Sanitation
Water supply
According to data from WFP’s Food Security Monitoring
and Analysis System almost 70 percent of households
in the Terai are dependent on tubewells for their
drinking water supply. Less than 1 percent of
households get their water from unprotected wells and
about 28 percent depend on the use of public taps. As
drinking from unprotected wells and open source water
- 6 -

bodies is not common practice and most households
depend for their water supply on tubewells, access to
safe drinking water does not seem to have been
affected by the flood waters. However, no data were
available to the mission on the quality or infection load
of water from tubewells and this may well be a
problem. Also before flood waters receded, access to
safe drinking water was restricted as many tubewells
were submerged in water.
UNICEF and other organizations provided water
treatment like bottles of water guard, bleaching powder
or puro and aqua tablets for distribution to the flood
affected population. Distribution was handled by DPHO,
NRCS and other partner organizations, targeting areas
with an increased number of diarrhoea cases or areas
where the population depends on open wells for their
water supply. However, quantities were limited and not
enough to ensure access to sufficient safe drinking
water for an extended period of time.
Sanitation
Sanitation is very poor in the Terai districts. More than
80 percent of the people defecate in the open (77
percent report using open fields and 4 percent use
ponds, rivers or lakes). The mission visited a village in
Dhanusha without any latrines. Flood waters have
exacerbated sanitation problems by considerably
reducing the space available where people can go for
defecation. This particularly affects women and the
elderly. Footpaths leading to communities were covered
with human faeces. As most people, especially children
walk barefoot on these paths, this poses a serious
health hazard.
Impact on Agriculture and Markets Agriculture
A large area of agricultural land was submerged by
flood waters during the height of the flood. In some
districts, 80 percent of planted area was under water
for some period of time. Depending on the maturity of
the paddy plants, paddy can withstand up to 10 days of
submersion. Prolonged water logging however causes
anaerobic conditions that result in plant rot. Agricultural
land near the main rivers has been severely affected:
In many of these locations, crops were swept away and
heavy sand deposits have rendered the land useless for
the remaining of this agricultural season. Several rivers,
for example the Kamala and Rapti rivers, eroded large
areas of cultivated land in some areas and pose a
severe risk to communities alongside the rivers.
In many parts of the Terai, transplanting of paddy was
late and only part of the cultivable land was planted.
The prolonged period of the flood delayed planting
even further, resulting in over-mature paddy seedlings
which when transplanted are more vulnerable to
diseases and lead to lower production (about 20-30
percent less). In addition, late transplanting requires
denser planting of the seedlings, and therefore results
in higher seedling and labour costs. In Saptari and
Siraha, farmers informed the mission that cost of paddy
seedlings for transplanting is normally around NRs 160
per Kattha. Currently, the cost ranges between NRs 250
to 300 per kattha. In Dhanusha and Sarlahi cost were
estimated at NRs 500 per kattha. When cost of labour
and transportation is included total investment adds up
to around NRs 2,000 per Kattha.
Where damaged, farmers are replanting paddy in the
hopes of making up losses due to the flood. Because
farmers in low-lying areas traditionally cultivate
additional paddy seedbeds as insurance for crop loss,
paddy seedlings are mostly available. However, in
higher lying areas, seedlings are in short supply so
farmers must travel greater distances, adding to the
transportation cost. For some farmers, the cost of a
second or third planting is prohibitive, resulting in
fallow land.
Table 4 provides some preliminary estimates by DADO
on paddy areas planted and destroyed. Map 2 shows
preliminary estimates of crop losses at the VDC level in
9 districts for which data is available.
- 7 -

Map 2 – Crop loss
- 8 -

Table 4 – Crop losses (ha)
Source: DADO
It should be noted that the data that DADO collected
was gathered when much of the agricultural land was
submerged and inaccessible, which may have resulted
in higher levels of estimated crop loss. Observations by
the mission suggest that eventual crop losses may not
be as extensive as these preliminary figures indicate.
Much of the submerged paddy appears to not be as
affected as initially reported, and replanting is likely to
make-up for a significant portion of loss. For example,
in Parsa, affected VDCs in the south were reported to
have lost more than 60 percent of their paddy
production. However, when calculating the actual area
planted with paddy and the area damaged by floods it
became evident that these losses had only occurred in
5 percent of the area. Conversations with DADO staff
reveal that surplus production may be achieved in the
non-affected rain fed areas as a result of abundant
rainfall. This may well have a positive affect on the
total paddy production at the district level.
Vegetable production has been severely affected with
for example an estimated 80 percent of crop lost in
Banke district alone. Mahottari reported 180 ha of
vegetable crop lost.
Livestock and aquaculture loss
Livestock losses seem to be minimal mainly consisting
of small livestock such as goats and chickens. A total of
450 livestock was lost in Dhanusha (CDO data). In
Mahottari a total of 498 livestock, primarily goats, were
lost (DLO). In Saptari 226 livestock was reported lost.
Aquaculture was highly affected. In Bara, Parsa and
Rautahat districts combined about 70 Mt of fish was
lost from a total area of about 110 hectares of fish
ponds. Mahottari reported 260 ha of fish ponds
affected, losing up to 95% of fish production. In
Dhanusha, 627 ha out of 660 ha of fish ponds was
affected by the flood.
Markets
The main district markets were not affected by the
floods and supplies are moving at pre-flood levels.
Except for vegetables, no price increases specifically
related to the floods were observed. The local hatia-
bazaars were affected for a period of about 2 weeks
during the floods due to rain and problems of
accessibility. They have however been re-established
and are currently functioning as usual.
The price of coarse rice has risen slightly between NRs
2 to 4 per kg in flood affected Terai districts. Wheat
prices have increase by approximately NRs 1-2 per kg.
However, this is not unusual for this time of the year.
Table 5 compares current prices from several district
markets in the Terai with those of 2 months ago.
Table 5 – Market prices
June July Aug June July Aug June July Aug
Saptari 21 20 22 23 22 24 17 18 18.5
Siraha (Lahan) 20 20 23 22.5 22 25 17 18 19
Udayapur 20 23 25 24 26 30 14 15 18
Dhanusha 20 22 23 40 45 45 15 18 18
Parsa 20 22 24 35 40 40 14 16 18
Rupandehi 19 19 20 24 24 25 16 16 17
Banke 20 21 21 24 28 38 14.75 17 17
Green Vegetable
June July Aug June July Aug June July Aug
Saptari 16 19 20 54 56 60 12 20 26
Siraha (Lahan) 16 17 20 52 55 58 10 16 20
Udayapur 16 24 26 50 60 70 15 30 50
Dhanusha 15 24 28 40 50 55 12 25 45
Parsa 16 20 24 50 50 50 10 15 20
Rupandehi 14 17 20 50 50 50 18 20 40
Banke 20 21 22 50 52 54 20 22 25
Note: all price are DHQ prices unless otherwise mentioned in the parenthesis
Potato Lentil
Market prices in flood affected districts (NRs/kg)
Sellected commoditiesRice coarse Rice Fine Wheat
Source: WFP FSMAS
The major impact is noticed in the availability and price
of vegetables. Prices have doubled and for some items
even gone up fourfold. Onions now cost NRs 35 per kg
as compared to NRs 17 previously. In Dhanusha green
leafy vegetables cost as much as NRs 45 per kg
Districts Cultivable area
Area planted
Area destroyed
Saptari 70000 ha 63000 ha 1415 ha Siraha n/a n/a n/a Dhanusha n/a 31000 ha 14800 ha Mahottari n/a 27050 ha 13760 ha Sarlahi n/a 24647 7325 Rautahat 62,818 ha 44,891 ha 11,249 ha Bara 69,958 ha 62,818 ha 850 ha (?) Parsa 57723 ha 46700 ha 2500 ha Nawalparasi n/a n/a n/a Rupandehi n/a n/a n/a Banke n/a n/a 8208 ha Bardiya n/a 42000 n/a Kailali n/a n/a 46758 qtl
- 9 -

compared to NRs 10-15 two months ago. In Bardiya
and Kailali district, the price for 1 kg of bottle guard has
increased from NRs 10 to 30. These price increases are
not normal for the season.
Impact on Household Food Security and Livelihoods Food Stocks
The monsoon floods occurred at the start of the lean
season. For many of the poor households this meant
that food stocks were low or already depleted prior to
the floods. At the district level many claims were made
that food stocks had been completely lost. For
example, in Banke and Bardiya it was reported that
about half of the affected population had lost all of its
food stocks. However, at the household level there was
no evidence of such impact. Food stocks are kept in
special bamboo, mud and dung storage containers
(Bhakari) which are reasonably water-resistant. In most
areas the onset of the flood was gradual, so
households were able to save their remaining food
stocks. In Banke, Dhanusha and Mahottari, areas near
the main rivers (Rapti, Kamala, and Bagmati)
experienced sudden floods due to broken dams and
embankments and as a result a higher percentage of
households in these areas lost their existing food
stocks.
Vulnerable Groups and Livelihoods
The most affected population groups are the very poor,
marginalized and landless households, who depend on
daily wages for their income. Out of the total
population affected by flood, approximately 70 percent
are from Madheshi, Dalits, Janajati and Muslims
communities. Many of these poor households live from
hand to mouth, often facing difficulties in finding
enough work to meet their basic needs.
At the time of the assessment the demand for
agricultural labour had increased somewhat for
replanting activities. However, the reduction in the
overall planted area in the affected areas may result in
decreased labour demands for day labour from now
through the harvest period in November/December
2007. In addition to the landless, the livelihood of
marginal farmers who have lost part or all of their crops
have been severely affected. They are in need of
supplementary resources and/or employment to sustain
them until the next cropping season.
Migration
Labour migration is widely practiced in the Terai.
According to information from the WFP Food Security
Monitoring and Analysis System, more than 41 percent
of households have one or more family members away
for labour purposes during some period of the year. On
the one hand this secures a certain level of remittances
and therewith food security, on the other hand many of
these families may still be indebted for a loan taken out
to send a family member abroad to work. The money
required for house reconstruction will greatly decrease
the ability to repay any existing loans. Seasonal
migration normally peaks during the November –
January period, after harvesting of the paddy fields and
planting of the winter crop. There is some evidence of
early migration in some districts. For example, around
75-80 persons had already left an affected village in the
Rampurkhauda VDC in Rupandehi to find work outside
the VDC.
However, the flooding has not caused a widespread
increase in distress migration across the affected areas
in the Terai. At this stage, male family members opt to
stay at home to attend to rebuilding and securing their
housing before moving out. Food aid and the initial
relief support provided may also have reduced the need
to migrate. However, with the prospects of decreased
agricultural labour opportunities due to less land being
cultivated, the regular out-migration during the period
of November - January is expected to be higher than
usual.
Coping Strategies
In the Terai, the most used coping strategies in times
of food shortage are reliance on less preferred
(cheaper) food and borrowing. Other main coping
strategies, in order of prevalence, include spending
savings on food, reducing the frequency and amount of
food consumed and sale of small household assets.
The mission observed a shift in food composition
toward cheaper foods with many households simply
- 10 -
surviving on rice and bread complemented by salt and
chilies (see section on food intake). There were also
reports of reduced food intake. Borrowing food and
buying food on credit is currently heavily practiced. This
however, can be considered a normal coping practice
around this time of the year, the difference being that
the number of households doing so has dramatically
increased due to the impact of the floods.
No excessive distress sale of household assets (utensils,
jewellery, etc.) or agricultural assets (tools, livestock
etc.) was observed.
Food intake
As mentioned above, food composition has changed
considerably due to the flood. Normally, most families
consume green vegetables and/or daal (lentils) with
rice or roti3. As witnessed during the assessment, the
price of lentils has increased by about 20 percent from
NRs 50 to NRs 60 per kg. Because flood waters
destroyed most of the vegetable plots, the prices of
vegetables have more than doubled in the local food
markets, putting vegetables out of reach for most poor
families this season. This shift in food intake may have
longer-term affects on the nutritional status of the
population and especially children.
In the Western districts of Banke, Bardiya and Kailali
almost all flood affected populations have received
ready-to-eat food (RTE) for five days during the first
weeks of the flood. The RTE food contained beaten
rice, chow-chow, sugar, biscuits and salt. The existing
food basket and the quantity of food distributed should
be reviewed against the needs of the population. The
RTE package does not include food items well suitable
for young children or to meet the additional needs of
pregnant and lactating women. Hence, it would be
recommended to modify and accommodate items
suitable to meet the special requirements of these
vulnerable groups.
The food basket planned for general food ration
distribution consists of 4 food items (rice, lentils, oil,
and iodized salt) and provides almost 1900 kcal,
assuming additional food resources at the household
level. This is not enough to meet the nutritional needs
of vulnerable groups such as children under 5 years
and pregnant and lactating women.
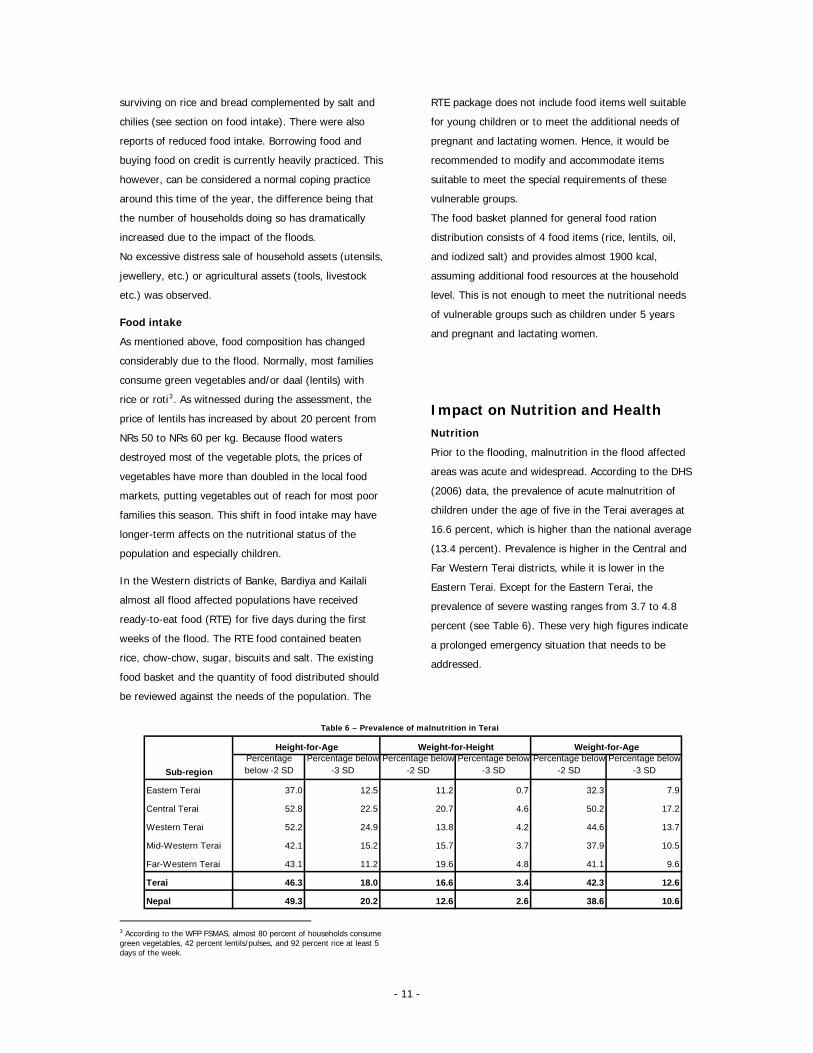
Impact on Nutrition and Health Nutrition
Prior to the flooding, malnutrition in the flood affected
areas was acute and widespread. According to the DHS
(2006) data, the prevalence of acute malnutrition of
children under the age of five in the Terai averages at
16.6 percent, which is higher than the national average
(13.4 percent). Prevalence is higher in the Central and
Far Western Terai districts, while it is lower in the
Eastern Terai. Except for the Eastern Terai, the
prevalence of severe wasting ranges from 3.7 to 4.8
percent (see Table 6). These very high figures indicate
a prolonged emergency situation that needs to be
addressed.
Table 6 – Prevalence of malnutrition in Terai
Percentage below -2 SD
Percentage below -3 SD
Percentage below -2 SD
Percentage below -3 SD
Percentage below -2 SD
Percentage below -3 SD
Eastern Terai 37.0 12.5 11.2 0.7 32.3 7.9
Central Terai 52.8 22.5 20.7 4.6 50.2 17.2
Western Terai 52.2 24.9 13.8 4.2 44.6 13.7
Mid-Western Terai 42.1 15.2 15.7 3.7 37.9 10.5
Far-Western Terai 43.1 11.2 19.6 4.8 41.1 9.6
Terai 46.3 18.0 16.6 3.4 42.3 12.6
Nepal 49.3 20.2 12.6 2.6 38.6 10.6
Height-for-Age Weight-for-Height Weight-for-Age
Sub-region
3 According to the WFP FSMAS, almost 80 percent of households consume green vegetables, 42 percent lentils/pulses, and 92 percent rice at least 5 days of the week.
- 11 -

The flood emergency has caused an additional risk for
rapid
n
,
d
ot yet reveal an
t the
l
s found that breastfeeding practices
d not
n
rn over possible replacement of
not
infant formula has been distributed as a part of the
relief efforts. However, NRCS in Kailali did consider
s
are the increased
cidence of viral fever, diarrhoea, skin diseases, and
tions. Main causes for morbidity include
s
s
hough data
orted, since not all cases
further deterioration in the nutritional status of the
already very vulnerable (child) population. No
anthropometric data were collected during this
assessment. However, beyond seasonal deterioration in
malnutrition indicators, no increase in the number of
severely acutely malnourished children was found by
the mission, based upon the limited data available.
According to the assistant DPHO in Dhanusha, under
normal conditions about 30% of hospitalized children i
Jaleshwar Hospital suffer from malnutrition and this has
not significantly increased since the floods. In
Rampurkhadauna and Bujawa VDCs of Rupandehi
growth monitoring sessions were conducted before an
immediately after the flood. Based on the community
records underweight rates were about 35% and have
not yet increased. The next growth monitoring session
was scheduled at the end of August and data needs to
be reviewed to check if malnutrition rates have
increased due to the impact of flood.
Observations by the mission also did n
increase in the number of malnutrition cases, however
with the worsening diet and deterioration in the
sanitation and health environment, it is likely tha
already existing problem of malnutrition in the Terai wil
be further exacerbated due to the impacts of flooding
on food consumption, health and hygiene. Changes in
food composition may further aggravate micronutrient
deficiencies like anaemia.
Breastfeeding
No indication wa
had been affected by the floods. Interviews with
mothers revealed that breastfeeding frequency ha
been affected by the flood. However, some mothers
reported that the quantity of their breast milk had
decreased due to poor diet, sickness, abdominal pai
and diarrhoea.
As for the conce
breastfeeding by the use of infant formula or milk
powder, or even practicing bottle feeding, this was
observed nor reported by any of the stakeholders. No
providing infant formula but discarded the idea based
on the unavailability in the market and lack of safe
water for the beneficiaries. This shows that awareness
on the inappropriateness of distribution of such supplie
needs to be strengthened.
Health
Major health concerns at the moment
in
eye infec
drinking of contaminated water, very poor sanitation
and hygiene practices, lack of nutritious food intake, a
well as consumption of small fish from paddy field
contaminated from open field defecation.
The potential spread in vector born diseases needs to
be closely monitored as stagnant flood water provides a
perfect breeding ground for mosquitoes. Alt
are incomplete the first cases of malaria for this season
have already been reported. In the Terai, among poor
households use of mosquito nets is not common. NRCS
received 2,000 mosquito nets from UNICEF. According
to NRCS, 1,000 will be distributed in Banke and 1,000
in Bardiya district. Further supplies of mosquito bed-
nets are being procured for distribution to affected
population by UNICEF.
In total 39 people died due to flood (see Table 7).
Main causes are drowning, snake bites and diarrhoea,
Mortality might be underrep
come to health facilities and are being registered.
Table 7- No. of deaths
Districts Dead Saptari 3 Siraha 3 Dhanusha 4 Mahottari 6 Sarlahi 1 Rautahat 6 Bara n/a Parsa 2 Nawalparasi n/a Rupandehi n/a Banke 5 Bardiya 6 Kailali 3
Total 39 Source: NRCS
- 12 -

No epidemics have been repo at the time of this
lth system s to be well prepared
nd is sending rapid response teams to areas with
uring
still an issue in some heavily affected
ra
o
s
r
e
uent bandhs. The worry of
e
ts and regions have
lth
Schools were closed for regular holidays during the
ight of the flood. They were scheduled to reopen
ailable data across
Schools rted
seemwriting. The hea
a
diarrhoea outbreaks to quickly contain further
contamination.
In almost all districts health posts are functioning
normally, although accessibility was a problem d
the flood and is
areas. In Saptari mothers of Sakarpura and Rampu
Malhaniya VDCs reported problems accessing the
health posts due to water logging and slippery paths.
In Kailali, the sub-health post of Lalbhoji VDC and the
health post of Thapapur VDC were damaged due t
flood, however services have been provided via school
within the catchment areas. In Banke, three health
facilities in Holiya, Gangapur, and Bethani VDC were
also affected. In Saptari, the health post of Sakarpura
VDC (one of the most flood affected VDC in this
district) was damaged as was the Public Health Cente
of Nawarjpur in Siraha.
Insufficient medicine stock was reported as an issu
due to irregular supply chains, further affected by bad
road conditions and freq
DPHO staff is focused around medicines (antibiotics,
ORS, IV saline fluid) required to contain outbreaks of
infectious diseases such as bacillius dysentery as
current stocks are not sufficient.
Each district has formed Rapid Response Teams for th
management of outbreaks in case of emergency.
Similarly, agencies working in distric
also provided technical and material supports for
regular health services and provision of mobile hea
camps.
Impact on Education
he
again from 11 August onwards. Av
the 13 flood affected districts on damage to school
buildings are presented in Table 8.
Table 8 – Number of Affected
Districts Number
of schools
Heavily affected
Partially affected
Total affected
Saptari n/a 1 4 5 Siraha n/a 0 5 5 Dhanusha 300 16 84 100* Mahottari 250 4 43 196* Sarlahi - n/a 1 n/a Rautahat n/a 1 30 31 Bara n/a n/a n/a - Parsa n/a 11 n/a 11 Nawalparasi n/a 11 n/a 11 Rupandehi n/a n/a - Banke Data currently being compiled by DEO Bardiya 7 7 77 Kailali n/a n/a 11 11
* Based on survey conducted by NGO Aasman. In Mahottari 149 schools
were lightly affected
Source: DEO
ools constructed from less durable material s
hools affected by the flood are
In some of the most
e
rinking water and compound walls. Student
educational material (books, notebooks, school bags
ly
text
ari
was
similar to the impact on primary schools. Two ECD
Sch h as uc
mud, straw and bamboo have suffered the brunt of the
damage. Most sc
however functioning again.
affected areas education delivery is affected due to lack
of class rooms and teaching materials. However,
teachers are expected to run classes in alternativ
locations.
Flood impact to schools did affect physical facilities
such as furniture, blackboards, playgrounds, toilet
facilities, d
and uniforms) was damaged. For instance, in the
Western districts of Banke and Bardiya. In Banke
preliminary information indicates that 1,796 children
have lost their education material. In Bardiya it was
reported that 1,500 school going children complete
lost their school uniform, educational material and
books. A further 6,105 children in Bardiya partially lost
their educational material and text books4. In Mahott
75 children lost their books and stationary.
The majority of Early Childhood Development (ECD)
centres are attached to government run schools.
Consequently, it is assumed the impact on ECDs
centres in Mahottari were reported to have been
destroyed.
4 Since these data are not consistent with reports from other districts,
they need to be further verified.
- 13 -

Non-formal education has not been affected by the
floods. Classes are normally run by the VDC and m
often take p
ost
lace in community buildings.
y effective in
elivering immediate relief assistance to the flood-
provided
ever,
ccording to the communities, the flood intensity has
ollection
by
hesi, Tharu and
ing
,
unities in affected areas are limited
Immediate Relief Provided The Nepal Red Cross Society has been ver
d
affected populations. Relief support was also
by the CDO through the DDRC, DADO, DEO and DPHO.
In addition, (I)NGOs and UN agencies such as Aasman,
CARE, CARITAS, World Vision, Save the Children, ICRC,
IRC, FNCCI, RRN, Fida International, Plan, LWF, ADRA,
UNDP, UNICEF and WFP have provided support. Details
are provided in the district tables in Annex III5.
Conclusion and Response Options Flooding in the Terai is a recurrent problem. How
a
been increasing over the last few years. There is an
urgent need for a longer-term solution to mitigate the
impact of flood water in the Terai districts through river
training programmes, river drainage, embankments,
building of higher shelter houses and disaster
preparedness programmes particularly. For immediate
relief programmes it is essential that the DDRCs
become more pro-active in standardized data c
in disaster-affected communities.
A very large number of households were affected
the flood this year. Most of the affected people are
marginalized, poor, landless, Dalits, Mad
Janajati. The flood had the biggest impact on housing,
particularly for poor people with houses made of
bamboo, straw and mud. Crop land near the main
rivers and in low-lying areas was heavily affected with
high or total crop losses. In other areas the stand
paddy crop has benefited from the temporary
immersion and an overall surplus production in these
areas is expected.
In most areas, the water level increased gradually
enabling households to save their food stocks.
Employment opport
5 For most up-to-date information on assistance provided see also OCHA’s flood and landslide updates at www.un.org.np
although the re-planting provides some alternative j
opportunities for the landless. Longer-term pros
are worrisome as less agricultural land has been
planted, translating into fewer employment
opportunities from now through the harvest period. A
surplus harvest in non-affected areas may offset t
a certain extent but it is likely that out-migra
higher than normally this year for highly affected VDCs
Prior to the floods, the nutrition situation in the Terai
was already at an emergency level with 17 percent of
children under 5 suffering from acute malnutrition. The
ob
pects
his to
tion will be
.
e
he
s an
to be addressed by the
PHO. The health emergency response system with
to
provided by the
RCS and others, it is essential that severely affected
t term food rations of
ed
ber
underlying causes to the very poor nutritional status
include food insecurity, poor child feeding and care
practices, very poor water, sanitation and hygiene
conditions, and poor health environment. These
problems have been exacerbated by the impact of th
floods on livelihoods, food composition, sanitation
practices, and the incidence of diarrhoea among t
population. Therefore, although there is no evidence
that these figures have further deteriorated, there i
increased risk of deterioration the near term without
immediate intervention.
On the positive side, the immediate health needs in
terms of outbreak control seem
D
rapid response teams and mobile health camps seem
be well organised. However, there is a concern about
adequate medical supplies and preposition of
emergency stocks at the district level to effectively
respond to any disease outbreaks.
Short term response options
• Following the RTE food ration
N
households be provided with shor
at least one to two months to cover their immediate
food needs and prevent further deterioration in the
nutrition status of vulnerable people, particularly
women and children. It is recommended to limit the
food assistance to only the severely and highly affect
VDCs (see Map 1) to prevent inflation in the num
of beneficiaries. Severely affected households in
moderately and lightly affected VDCs may need support
but this is best provided through local NGOs.
- 14 -

• The biggest impact of the flood was the dama
to or complete destruction of houses, especially those
constructed of poor building materials belongin
ge
g to the
or
is
h
r, conditions within temporary shelters
vestment that they have
oAC
isease outbreaks. Additional
ppl
ble
men are met, supplementary food ration
ns
tion
y signs of an increase in the
id
)
ifically on infant and young
ild ealth
ters affected
fl ns
Floods are a recurrent event causing misery and
oon. A food-for-
nage,
tion
of mother and children is most
ild
f food
n
s
ness
om
ffected
pul
po est segment of the population. To re-build these
houses will cost between NRs 4,000 – 10,000. The
government announced a provision of NRs 10,000 to
people who had completely lost their house and NRs
5,000 to those whose house was partly damaged. It
essential that this relief support reach the poor as soon
as possible to avoid further deterioration of their healt
and livelihoods.
• Most households who have lost their houses have
already been provided with tarpaulin or temporary
shelters. Howeve
are harsh and people are unprotected from rain and
sun. Many people have moved in with neighbours in
already crowded houses. A more permanent solution to
re-build houses is urgently required. The issue is
particularly relevant for landless people who do not
have a place to go back to.
• For small-farmers who have lost their crops,
subsidies for seeds and fertilizer are recommended to
reduce the huge additional in
to make for re-planting or land preparation. The M
has made an amount of NRs 5 million available for
immediate relief.
• The response of the health system has been
adequate and seems to be able to cope with the
situation in terms of d
su ies of medicine for pre-positioning to contain
potential outbreaks of water-born and vector born
diseases need to be made available, and distributed
effectively.
• To ensure that the nutritional needs of vulnera
groups such as children under five and pregnant and
lactating wo
co isting of fortified blended food is strongly
recommended for the worst and highly affected VDCs.
Those efforts should be combined with a nutrition
awareness programme.
• In the most affected areas the health surveillance
system should be strengthened to incorporate nutri
monitoring to detect earl
inc ence of malnutrition. The referral system for
children suffering from severe acute malnutrition (SAM
needs to be strengthened.
• Mass communication programmes providing
messages on nutrition, spec
ch feeding, water, sanitation and hygiene, and h
messages should be introduced soonest.
• In affected schools, there is a need to provide
education materials. The schools/ECD cen
by oods need physical improvements and renovatio
such as classroom, toilets, furniture, drinking water,
playground, and blackboard, etc.
Longer-term response options
•
damage each year during the mons
work or a cash-for-work or food-voucher programme is
recommended to address the longer-term
reconstruction and flood prevention needs. The priority
requirements include river training and drai
recovery and maintenance of embankments,
homestead raising, road re-construction and irriga
rehabilitation.
• As mentioned above, improvement in the
nutritional status
urgent. A longer-term integrated mother and ch
health nutrition programme, including elements o
security, nutrition promotion with particular attentio
on proper infant and young child feeding practices, as
well as interventions to increase awareness regarding
the use of clean water, sanitation and hygiene
awareness training is strongly recommended. The focu
of these efforts should be on disadvantaged
communities with high rates of acute malnutrition.
• Community disaster response and prepared
programmes in highly vulnerable areas should be
pr oted to mitigate the impact of floods.
• Support to DDRC in setting up a proper and
accountable system for rapid registration of a
po ations needs to be promoted.
- 15 -

Acknowledgment This inter-agency rapid flood assessment was conducted by the World Food Programme, UNICEF and Save the Children
Alliance with field level support provided by the Nepal Red Cross Society. This report was prepared by the following
mission members:
WFP:
Siemon Hollema, Pushpa Shrestha, Moti Thapa, Kanta Khanal, Krishna Kanal, Laxmi Chaudhary, Ramesh Sah, Raju
Chhetri, Birendra Shahi, Rajkumar Yadav, Digambar Dahal, Monika Shrestha
UNICEF:
Monique Beun, Pragya Mathema, Sunita Shrestha, Sabrita Kafle, Govind Chhetri, Sundar Gurung, Naveen Paudyal,
Eleonora Genovese, Silvia Kaufmann
Save the Children Alliance:
Punita Mandal, Rajendra Tuladhar
The mission team is grateful to NRCS for their excellent support provided and for making available and reorganizing the
flood impact data to the mission. The mission would also like to thank the support provided by the different CDOs, DDRC
committees, DADO staff, DHO and DEO.
Detailed reports prepared by assessment teams are available for the following districts:
• Saptari and Siraha
• Mahotarri and Dhanusha
• Rautahat, Bara and Parsa
• Rupandehi and Nawalparasi
• Banke, Bardiya and Kailali
- 16 -

Annex I – Field Check List
Inter-Agency Rapid Assessment Nepal - 2007 Flood
Field check-list
District ______________________
1 - Context
Map 1 Using a map of the district, identify the VDCs/Communities that are affected by the flood
Use the following criteria: 1. Worst affected (all hh affected) 2. Highly affected (> 50 % of HH affected) 3. Moderately affected (25 – 50% of HH affected) 4. Lightly affected ( < 25% of HH affected)
5. Not affected
See attached map template for each district
Map 2 On the same map indicate which of the affected VDCs/communities cannot be reached by vehicle due to flood.
Map 3 On the same map indicate which areas have serious security concerns and due to this are not accessible.
T 1 How many people are approximately affected/displaced? Use attached table format
2 – Nutritional status Note: this section, only based on health worker key informants and health records. If there is no health care system or health workers in this site, collect information from community members
Q 1 Are there cases of acute malnutrition?
Q 2 Has the number of acute malnutrition cases increased in the past 3 weeks?
Q 3 To what factors is increased acute malnutrition attributable? Provide details
Q 4 Are there individuals at higher risk of malnutrition? Infants
Children Elderly
Handicapped Women/mother
Socially excluded (specify)
Provide details
Q 5 Q 6 Q 7 Q 8
Is there indication of decreased/interrupted breastfeeding? If so, what are the reasons? What is replacing breastfeeding? Diluted cow/goat milk Infant formula Regular milk powder Littho/Jaulo Other Has there been any donation of distribution of Infant Formula? By whom?
___ ___
Age groups <6 months; 6-24 months Describe based on observations in highly and worst affected areas.
- 17 -

3 – Health status
Q 9 What are the main causes of morbidity and mortality Source: _______________________________ Period of reference: ______________________
Morbidity Mortality
Cause 1. ____________________ Cause 1. ____________________ Cause 2. ____________________ Cause 2. ____________________ Cause 3. ____________________ Cause 3. ____________________
Provide details
Q 10 Are there reports of outbreaks? Source: _______________________________ Period of reference: ______________________ Possible diseases: ______________________ ______________________ ______________________
Provide details
Q 11 Q 12
Are there non-operational health facilities due to the floods? What aspect of the health facility has been affected by the floods?
Building Staff
Supplies
___ ___ ___
Provide details
Q 13 Do people face physical problems to access the health posts?
4 – Housing, shelter, water and sanitation
Map 4 Indicate on the map location of temporary shelter camps and the approximate numbers of IDPs in each camp.
Q 14 Tick the main constraints in the IDPs camps in order of priority. Shelter
Clothing Blankets
Food Clean water
Overcrowding Sanitation ………….. ………….
1 is highest priority
Q 15 Is it likely that any off the above constraints will change in the short term? Provide details
Q 16 Are there safe place for mothers to breastfeed?
Q 17 Is access to clean water for people in affected areas a problem?
Q 18 Will this change in the short term?
Q 19 How many houses are completely / partially damaged? Fully
Partially
Use table 1
Q 20 Percentage of affected households that have access to cooking facility and cooking fuel? ___
Q 21 Percentage of affected households that have access to mosquito net? ___
5 - Agriculture and markets
Map 5 Using a map of the district, identify VDCs where crops have been affected by the flood. Use the following criteria: 1. Completely lost (More than 60% loss) 2. Highly affected (40-60 % loss) 3. Affected (20-40% loss) 4. Little affected (10 – 20% lost) 5. Not affected
See attached map template.
Q 22 Can paddy be replanted in affected areas?
Q 23 If yes, do people have the means to do so?
- 18 -

Seedlings Tools
Manpower
___ ___ ___
Provide details
Q 24 Have people lost their livestock? Cows/buffalos Goat / sheep
Chicken
___ ___ ___
% lost
Q 25 Are markets functioning?
Q 26 What are the problems faced by traders in bringing food to the markets? Roads are impassible
Lack of trucks Insecurity
Other
In order of priority. 1 being highest.
Q 27 Have prices of staple foods increased? Coarse rice
Wheat Lentils
Availability and prices of vegetables
___ ___ ___ ___
Provide current and last months price.
6 - Household Food Security
Q 28 In flood affected areas have people lost their food stocks?
Q 29 What percentage of households has access to food stocks? ___
Q 30 Are there social groups facing specific food access problems Socially excluded (specify)
Female-headed HH Elderly
Handicapped Land-less
Daily wages
Approximate percentage based on observations in highly and worst affected areas.
Q 31 Can people access their traditional means of earning an income? Agricultural activities
Sale of goods Remittances
Business etc. Daily wages
___ ____ ____ ____ ____
provide details
Q 32 Is there evidence of distress sale of assets? HH assets (jewellery etc.)
Agricultural assets Extensive borrowing
Q 33 Is there evidence of distress migration? Indicate % increase compared to normal migration pattern
Q 34 Has the size of daily meals decreased?
Q 35 Has composition of daily meals changed, e.g. number/type of aliments? specify
Q 36 Has the number of daily meals decreased? Adults
Children under 5
Q 37 Q 38 Q 39 Q 40
7 – Education What is the status of the schools?
Partially /fully damaged classroom facilities Partially /fully damaged sanitation facilities
How is the current condition of learning environment?
Classroom Teaching /learning material
Availability of teachers Playing Space
Are basic facilities available for all children?
Text books/note book School dress/bag
- 19 -

Q 41 Q 42
Is the Early Childhood Center (ECD) affected? Provide details Is there need for non formal education?
Are there particular issues related to different groups? Ethnic / Geographic
Gender
8 –Aid Provided
Provided Institution Description Q 43 What assistance is currently provided, by whom? 1. Shelter 2. Water 3. Sanitation 4. Hygiene promotion 5. Essential non-food items 6. Food distribution 7. Supplementary feeding 8. Therapeutic feeding 9. Infant and young child feeding 10. Health
9 - Response options
Q 44
Is a Feeding Programme required? Which beneficiaries?
How many? What type?
Where?
Q 45 Is food aid / cash / vouchers urgently required?
Which beneficiaries? How many?
Where? For how long?
Q 46 What are the urgent Wat-San requirements?
What is required? Which beneficiaries?
How many? Where? When?
Q 47 What are the urgent shelter needs?
What is required? How many?
Where? For who?
When?
Q 48 What are the most immediate health needs?
What is required? How many?
Where? For who?
When?
Q 49 Is agricultural assistance required?
What is required? How many?
Where? For who?
When?
Q 50 What is the long-term recovery assistance required? What is required?
How many? Where?
For who? When?
- 20 -

Annex II – District maps
- 21 -

- 22 -

- 23 -

- 24 -

- 25 -

- 26 -

- 27 -

- 28 -

- 29 -

- 30 -

- 31 -

- 32 -

- 33 -

Annex III – People affected
Households Population Households Population Households Population Households Duration (Days)
1 Dhansinghpur 1768 11224 123 1912 Narayanpur 2097 13466 30 1383 Tikapur 7324 45108 79 1674 Patharaiya 3432 22990 74 595 Durgauli 2553 15483 49 546 Chuha 2818 19095 22 447 Baliya 6838 37104 3 28 Bhajani 1905 13185 75 2149 Lalbhoji 2260 12611 5 210 Khailad 1590 11725 40 911 Munuwa 1979 13908 15 6712 Thapapur 2199 15795 448 31513 Bouniya 2097 15453 7 114 Joshipur 2981 22490 177 8815 Hasuliya 2190 16355 4 1616 Basauti 934 7270 5 717 Pavera 896 7241 14 518 Chaumala 3446 21782 3 119 Janakinagar 923 5998 9 1620 Dhangadhi 13674 78570 - 821 Dododhara 2537 17007 14 622 Darakh 1973 14178 4 -23 Kotatulashipur 1563 11848 17 424 Ramshikharjhala 2125 15796 7 325 Sandepani 3019 20917 4 926 Pratappur 2208 14947 38 327 Sugarkhal 2488 14867 15 -
79817 516413 1281 1429Total
Agencies involved in Food Aid distribution
CoverageHighly affected (B)
General Information (Affected VDCs and Population)
Name of Flood affected VDC
Flood affected Wards
Severely affected (A)
Nepal Red Cross Society
Remarks
Impact of Flood in Kailali District
Moderately affected (C)
Affected Households
SN.
Damaged community
Water Source (Types, location
and number)
Total numbers of Households
Total Population
Name of agency
* For Kailali severely and highly affected households are based only on fully or partial damage houses
Households Population Households Population Households Population Households Duration (Days)
1 Kanchanapur Tikulipur 1478 8996 1 242 Mahadevpuri 7 1429 8746 3 593 Baijapur NA 1473 12375 8 324 Binauna 9 981 7412 5 205 Fattepur Paneriya-8 2350 16698 3 476 Gangapur 1-9 1103 6088 57 2267 Matehiya 1,2,3,6 1331 7278 0 08 Laxmanpur NA 837 5191 0 09 Narainapur 862 5203 0 010 Kalaphanta 749 4299 0 011 Katkuina 995 5866 0 012 Holiya 1-9 1,063 5,799 183 57213 Betahani 1-9 1163 7306 39 7114 Bankatti 879 5,641 23 5015 Kamdi 4,7,9 1665 9544 3 816 Belahari 882 5235 8 2217 Manikapur Kapasi & Manikapur 1747 8849 34 5218 Ganapur Piprhawa 1,016 5,697 22 419 Karkando 1,454 6,927 11 -20 Kohalpur 4 4,364 22,674 4 1321 Naubasta 3,009 17,531 9 2022 Chisapani 999 5,552 2 1423 Rajhena 3,235 16,774 3 5124 Bankatawa 4, 6, 9 3,123 18,549 10 8225 Shamshergunj 1,342 7,840 7 2326 Bageshwori 2,682 13,976 28 927 Indrapur 1,389 7,551 22 628 Khajurakhurda 1,032 5,832 15 329 Sonpur 1,396 8,002 25 3430 Raniyapur Chamakdarpur 1,060 6,248 10 6931 Udharapur 1952 10186 32 4132 Sitapur 1-9 1747 9194 5 6333 Saingaun Shivarpuri 985 6082 2 1534 Radhapur 685 3742 3 635 Belbhar 840 5010 6 4236 Paraspur 7,8,9 751 4239 12 15737 Jaispur 1009 6606 7 438 Piprhawa 806 4672 13 1639 Bhawaniyapur 724 3913 7 2540 Hirminiya 1343 8058 73 19641 Udayapur 585 3406 10 2542 Puraina 1002 5539 10 1243 Puraini 719 3988 13 2344 Basudevpur 1 962 5369 13 4145 Nepalgunj Municipality 1-17 11926 64781 381 2651
73124 418464 1122 4828Total
Nepal Red Cross Society
Remarks
Impact of Flood in Banke District
Moderately affected (C)
Affected Households
SN.
Damaged community
Water Source (Types, location
and number)
Total numbers of Households
Total Population
Name of agency
Agencies involved in Food Aid distribution
CoverageHighly affected (B)
General Information (Affected VDCs and Population)
Name of Flood affected VDC
Flood affected Wards
Severely affected (A)
* For Banke severely and highly affected households are based only on fully or partial damage houses
- 34 -

Households Population Households Population Households Population Households Duration (Days)
1 Gulariya Muni. 8852 51305 86 1212 Mohammadpur 1742 11731 61 2773 Kalika 2020 11095 1004 Mainapokhar 1532 9489 4 225 Sorahawa 2461 14355 206 Jamuni 2423 12888 14 287 Padnaha 1257 9566 13 208 Baniyabhar 2128 16501 4 1159 Bagnaha 1834 13077 25 22310 Neulapur 1958 13080 169 55111 Suryapatuwa 1376 10248 152 48912 Dhodhari 1540 10157 13 4013 Magragadi 3208 20830 10 4814 Dhadhawar 2886 19713 24 7715 Motipur 3508 21619 8 1516 Belwa 2247 13642 9 2017 Deudakala 3068 18950 1 1118 Thakurdwara 1360 8608 10 15319 Shivapur 1102 8277 14 2220 Rajapur 2092 14113 247 75521 Bhimmapur 1516 11115 11 3822 ManpurTapara 1457 10587 823 Manau 1204 7866 17 11524 Khairichandanpur 1153 7695 12 4525 Gola 1024 7447 10 4326 Pashupatinagar 1078 6969 12 4627 Nayagaon 856 6484 528 Badalpur 1091 7513 6 1529 Sanoshree 3315 17598 5 2530 Taratal 1713 9505 2031 Patabhar 2152 15728 2232 Daulatpur 1210 8080 6
66363 425831 957 3475Total
Agencies involved in Food Aid distribution
CoverageHighly affected (B)
General Information (Affected VDCs and Population)
Name of Flood affected VDC
Flood affected Wards
Severely affected (A)
Nepal Red Cross Society
Remarks
Impact of Flood in Bardiya District
Moderately affected (C)
Affected Households
SN.
Damaged community
Water Source (Types, location
and number)
Total numbers of Households
Total Population
Name of agency
* For Bardiya severely and highly affected households are based only on fully or partial damage houses
Households Population Households Population Households Population Households Duration (Days)
1 Majhgawa 3-6,9 788 4648 162 Bairghat 1-9 803 4739 73 Bogadi 1418 8368 -4 Hati Bangai 1248 7362 -5 Betkuiya 1-9 784 4625 246 Roimihawa 1-9 678 3999 197 Devdaha 2996 17676 78 Kerwari 1823 10756 29 Siddarthanagar Municipality 2-6 10295 60735 1910 Raypur 1-9 1677 9893 15211 Semara 1-9 1023 6034 3312 Karauta 1-9 1460 8612 10913 Thumawa Piprahawa 1-9 670 3955 2514 Asuraina 1-9 1088 6420 14015 Farena 1-9 634 3738 5916 Bagauli 1-9 1326 7824 3317 Padsari 1258 7423 1218 Tikiligarh 1772 10453 619 Basantapur 933 5505 2420 Bagaha 705 4162 7521 Dhamauli 845 4983 122 Chhipagah 1016 5996 2023 Pazzerkatti 696 4107 424 Pokhabhini 811 4785 525 Patkhauli 800 4719 626 Siktahan 1608 9484 227 Chhotko Ramnagar 707 4526 328 Dhakdhai 895 5278 1629 Bodbar 1300 7669 -30 Bhagwanpur 1671 9859 3931 Ama 1497 8830 2232 Sitauliya 1279 7545 42
46504 274708 922
General Information (Affected VDCs and Population)
Name of Flood affected VDCFlood
affected Wards
Severely affected (A) Name of agency
Agencies involved in Food Aid distribution
CoverageHighly affected (B)
Total
Nepal Red Cross Society
Remarks
Impact of Flood in Rupandehi District
Moderately affected (C)
Affected Households
SN.Damaged community Water Source (Types,
location and number)Total
numbers of Households
Total Population
* For Rupandehi severely and highly affected households are based only on fully or partial damage houses
- 35 -

Households Population Households Population Households Population Households Duration (Days)
1 Ramgram Municipality 3893 22630 103 3252 Badhara Dubauliya 1072 6594 36 1513 Rampur Khadauna 668 4874 85 4624 Guthi Suryapura 739 4945 5 145 Baidauli 756 5036 3 126 Guthi Prasauni 984 6563 1 197 Sonamai 898 6022 94 918 Pratappur 991 6480 16 519 Makar 4003 20594 1 710 Jahada 1483 8122 1111 Jamuniya 1474 8505 212 Rupauliya 1494 8400 713 Harpur 856 5508 20 5214 Rampurwa 695 4402 4 5215 Kudiya (37 ha) 9 1533 9361 13 15316 Narsahi 863 5485 5 1617 Paklihawa (34 ha) 9 1371 9248 22 7318 Thulo Khairatwa 2,3 632 4155 18 5419 Kushma 955 6102 37 2820 Bhujahawa 1-9 889 6387 60 14821 Sukrauli 783 4937 18 8322 Haku 882 5770 12 12523 Sanai 978 6442 55 36624 Gairmi 869 5708 58 6225 Palhi 778 5216 22 3126 Manari 919 5697 1427 Sarwal 782 4862 26 6328 Devgawa 738 4815 44 127
32978 202860 758 2599Total
Nepal Red Cross Society
Remarks
Impact of Flood in Nawalparasi District
Moderately affected (C)
Affected Households
SN.Damaged community Water Source (Types,
location and number)Total
numbers of Households
Total Population
Name of agency
Agencies involved in Food Aid distribution
CoverageHighly affected (B)
General Information (Affected VDCs and Population)
Name of Flood affected VDC
Flood affected Wards
Severely affected (A)
* For Nawalparasi severely and highly affected households are based only on fully or partial damage houses
- 36 -

Households Population Households Population Households Population Households Duration (Days)
1 Birgunj Municipality 1-3, 9-10, 12-19 10628 74396 340 2380 105 735 12 84 NRCS 340 132 Sambhauta 1-9 850 5950 24 168 10 70 NRCS 24 13 Tulshibarwa 1-9 496 3472 35 245 16 112 5 35 NRCS 35 14 Dhobini 1-9 581 4067 19 133 NRCS 19 15 Auraha 1, 2 717 5019 10 70 NRCS 10 16 Bhabanipur 4 736 5152 4 28 NRCS 4 17 Prasauni Birta 1-9 608 4256 93 651 25 175 3 21 NRCS 93 18 Jagarnathpur Sira 1-9 846 5922 11 77 12 84 NRCS 11 19 Langdi 1-9 495 3465 19 133 NRCS 19 110 Hariharpur 1-9 625 4375 6 42 NRCS 6 111 Harpatganj 1-9 549 3843 11 77 7 49 NRCS 11 112 Shreepur Pachgwa 1 639 4473 2 14 NRCS 2 113 Bahuwari Pidari 1-9 746 5222 7 49 NRCS 7 114 Bhauratar 1-9 1075 7525 62 434 11 77 NRCS 62 115 Gamahariya 1-9 518 3626 25 175 28 196 NRCS 25 116 Nagardaha 1-9 436 3052 23 161 5 35 NRCS 23 117 Pakahamainpur 1-9 394 2758 26 182 NRCS 26 118 Bairiya Birta 1-9 743 5201 45 315 NRCS 45 119 Bisharampur 1-9 880 6160 61 427 40 280 NRCS 61 120 Supauli 5 464 3248 1 7 NRCS 1 121 Belwa 1-9 133 931 16 112 16 112 NRCS 16 122 Alau 3,4 998 6986 3 21 NRCS 3 123 Surjaha 1-9 513 3591 22 154 NRCS 22 124 Lakhanpur 4 660 4620 1 7 NRCS 1 125 Maniyari 3,4 1070 7490 8 56 NRCS 8 126 Lal Parsa 5 464 3248 11 77 NRCS 11 127 Shreesiya 1-9 442 3094 8 56 NRCS 8 128 Pokhriya 1-9 899 6293 20 140 20 140 NRCS 20 129 Seba Brwa 5,7 693 4851 2 14 NRCS 2 130 Bhedihari 2,3,7 739 5173 5 35 NRCS 5 131 Basantpur 1-9 1008 7056 10 70 33 231 NRCS 10 132 Biranchibarwa 4 409 2863 2 14 NRCS 2 133 Mirjapur 1-9 543 3801 22 154 15 105 NRCS 22 134 Bhishwa 1-9 627 4389 33 231 16 112 3 21 NRCS 33 135 Jayamangalapur 1-9 684 4788 26 182 12 84 2 14 NRCS 26 136 Bairiyabirta D.P. 1-9 613 4291 39 273 5 35 NRCS 39 137 Dewarbana 1-9 639 4473 15 105 5 35 NRCS 15 138 Sakhuwa Prasauni 1-9 1065 7455 43 301 2 14 NRCS 43 139 Kauwawan Kataiya 1-9 513 3591 30 210 3 21 NRCS 30 140 Mahuwan 1-9 658 4606 46 322 29 203 NRCS 46 141 Udayapur ghurmi 1-9 854 5978 20 140 18 126 NRCS 20 142 Sugauli Birta 1-9 848 5936 18 126 NRCS 18 143 Bindwashni 1-9 631 4417 26 182 NRCS 26 144 Pacharukhi 1-9 689 4823 26 182 38 266 NRCS 26 145 Bahuwarabhata 1-9 876 6132 7 49 NRCS 7 146 Remgadhwa 1-9 591 4137 77 539 56 392 NRCS 77 147 Khalwatola Sresiya 1-9 709 4963 5 35 NRCS 5 148 Lahawarthakari 3 492 3444 1 7 NRCS 1 149 Lipanibirta 8 862 6034 15 105 NRCS 15 150 Biruwathi 1-9 1826 12782 34 238 NRCS 34 151 Basdilwa 1-9 765 5355 18 126 NRCS 18 152 Harpur 1-9 789 5523 26 182 NRCS 26 153 Bagbana 1-9 1053 7371 13 91 NRCS 13 154 Amarpati 1-9 562 3934 60 420 15 105 NRCS 60 155 Prasaunibhata 1-9 656 4592 90 630 NRCS 90 156 Chorni 3 1266 8862 2 14 NRCS 2 157 Dhore 1-9 615 4305 13 91 NRCS 13 158 Bageshori Titrawana 4 822 5754 1 7 NRCS 1 159 Bhikhampur 1-9 601 4207 23 161 NRCS 23 160 Ghoddaudpipra 1-9 453 3171 25 175 5 35 NRCS 25 161 Mudali 1-9 732 5124 2 14 NRCS 2 162 Jhauwaguthi 1-9 837 5859 55 385 25 175 2 14 NRCS 55 163 Gobindapur 9 384 2688 3 21 NRCS 3 164 Dakaila Bahuri 9 477 3339 2 14 NRCS 2 165 Bagahi 1-9 762 5334 40 280 NRCS 40 1
55548 388836 1788 12516 572 4004 27 189 1788 77Total
Nepal Red Cross Society
Remarks
Impact of Flood in Parsa District
Moderately affected (C)
Affected Households
SN.
Damaged community
Water Source (Types, location
and number)
Total numbers of Households
Total Population
Name of agency
Agencies involved in Food Aid distribution
CoverageHighly affected (B)
General Information (Affected VDCs and Population)
Name of Flood affected VDC
Flood affected Wards
Severely affected (A)
- 37 -

Households Population Households Population Households Population Households Duration (Days)
1 Inarwamaal 1-9 1005 6140 55 399 - 55 22 K.N.P. 1-9 5113 32260 95 603 1233 Baghwan 1-8 638 4112 39 209 25 43 14 Dharmanagar 1,2,4,6,9 606 4460 14 81 1 51 15 Purainiya 1,2,3,4,6,9 734 5600 32 203 776 Hardiya 1,3,4,5,6,7,8,9 601 4236 33 196 7 33 27 Prasauni 6 1086 7321 2 17 -8 Basatpur 1,3,4,5,6,9 850 5867 25 153 109 Balirampur 1-8 781 5475 22 159 4310 Maheshpur 1,2,3,7,8 1043 7120 9 52 2711 Pipradhi 9 341 4337 5 56 - 4 212 Pheta 2,3,4,5,6,7 854 6000 16 96 2313 Raghunathpur 1,4,5,8,9 581 4130 18 135 614 Prastoka 3,4,5,7,8 1174 8248 8 40 -15 Telkuwa 2,3,7,9 665 4477 16 113 10 14 216 Bariyarpur 4,5,6,8,9 1413 9668 9 53 -17 Sisahaniya 1,2,6,7,8 398 2626 15 81 1018 Haraiya 3,6,7,8,9 1352 7763 8 37 -19 Karaiya 3,9 743 4414 2 14 -20 Laxmipur Kotwali 1,2,3 649 4388 10 89 - 10 221 Bisunpur 7,8,9 438 3354 9 75 - 9 222 Paterwa 1,4,5,6,8,9 527 3238 20 130 - 20 223 Amritganj 1,2,4,5,7,8,9 1211 7813 38 240 - 38 224 Golaganj 1,2,3,4,5,6,7, 530 3846 24 155 - 24 2225 Uchidiah 1,2,3,4,6, 550 3730 43 268 - 43 226 Shreenagar Bairiya 1 531 3748 2 16 - 2 227 Kachorwa 1,2,3,5,6,7,9 1418 9134 21 128 - 21 228 Hariharpur 1,2,3,6,7,8,9 655 4417 27 186 - 27 229 Bhatauda 1,7 748 5252 3 23 -30 Bhodaha 3,8 852 5461 4 26 -31 Batara 2,3,5 452 3055 7 45 3032 Rauwahi 1,2,5,7 428 2786 10 61 2133 Piparpati Jabdi 4, 5 338 2617 8 69 22 8 234 Babuaain 1,5,9 427 2728 4 21 -35 Barainiya 1,4,5,8,9 738 3973 14 82 2636 Chatawa 4,7,8,9 636 4660 8 58 5537 Tedhakatti 7 604 3808 4 23 - 4 238 Dewapur 7 509 3385 1 12 - 1 239 Mahendra Aadarsha 7 783 4016 1 6 - 1 240 Bhagawanpur 1,7 641 4181 2 13 - 2 241 Matiarwa 1,3,5,6,7,8,9 715 4959 14 85 -42 Bhaluhi Bharwaliya 1,6,7,8,9 782 5414 19 120 3143 Dohari 2,3,8 550 3872 16 190 944 Badaki Fulbariya 1,2,3,9 790 6147 9 71 - 8 245 Gadahal 9 488 2948 4 45 -46 Narahi 1,3,4,6,7 656 4072 9 56 -47 Itiyahi 1,4,5,7,9 762 5500 8 41 748 Umjan 2,4,6, 854 4839 15 73 -49 Sihorwa 7 620 3814 1 10 -50 Kabahi Goth 2,5,6,7 781 5291 13 70 12 11 251 Piprabirta 1,2,6 492 3335 11 74 - 11 252 Prashurampur 1,4,6,8,9 679 5091 7 53 3 1 253 Bagahi 1,2,3 548 2744 7 42 - 7 254 Madhuri jabdi 8,9 423 2824 6 47 -55 Kabahi Jabdi 5,6 530 3794 3 24 -56 Dakshin Jhitkaiya 4,5 1014 7335 3 29 - 3 257 Buniyad 1,4,6 621 4534 7 48 558 Bishrampur 8,9 717 4779 5 32 359 Ganjbhawanipur 1,2,3,8,9 896 5979 10 79 -60 Dahiyar 1,2,3,5,6,9 981 6260 1 6 -61 Fattepur 9 1178 7517 1 6 -62 Uttar Jhitkaiya 3,5,7 780 5132 12 63 12
49500 330024 864 5687 598Total
DDC, KNP, FNCCI,
NRCS Sub Branch
Amalekhganj, Kreepa
Daily, Janjagrity
Yuwa Summiti Jeetpur
Agencies involved in Food Aid distribution
CoverageHighly affected (B)
General Information (Affected VDCs and Population)
Name of Flood affected VDC
Flood affected Wards
Severely affected (A)
Nepal Red Cross Society
Remarks
Impact of Flood in Bara District
Moderately affected (C)
Affected Households
SN.
Damaged community
Water Source (Types, location
and number)
Total numbers of Households
Total Population
Name of agency
- 38 -

Households Population Households Population Households Population Households Duration (Days)
1 Auraiya 1-9 64 476 35 254 29 222 0 02 Rampurkhap 2,3,4,8 31 202 4 30 26 166 1 63 Mathiya 5,8 38 259 4 33 34 226 0 04 Jokaha 1, 4-9 54 341 6 40 22 145 26 1565 Narkatiya 1, 3-7, 9 41 302 3 24 29 224 9 546 Dumariya 3,4,1,2,6,7,8 43 261 2 14 10 61 31 1867 Jhunkhunwa 5,6,7,8,9,4 351 2118 10 53 9 73 332 19928 Karuniya 1,2,4,5,6,7,8 65 675 30 287 35 388 0 09 Banjaraha 1,2,3,4,5,8, 21 113 8 39 10 56 3 1810 Piprabhagwanpur 1,2,3,4,5,6,7,8,9 34 283 15 136 19 147 0 011 Jingadwabelbichhwa 1,2,3,4,5,6,7,8,9 124 797 30 217 42 268 52 31212 Phatuwa Maheshpur 2,3,4,7,8,9 26 214 26 214 0 0 0 013 Sharmujawa 4,5,7,8,9 19 103 15 81 3 16 1 614 Inrawa 1,2,3,4,5,6,7,9 77 480 10 75 18 111 49 29415 Tejapakad 3,5,6,8,9 6 47 4 36 2 11 0 016 Laukaha 1,3,7,8 6 40 4 27 2 13 0 017 Debahi 1,2,3,4,5,6,8 30 174 27 145 3 29 0 018 Basanpatti 2,3,4,8 53 305 2 8 6 27 45 27019 Chandranigahpur 3 16 91 13 73 0 0 3 1820 Dumariya Matiyon 2,3,6,7 188 1144 1 10 8 60 179 107421 Santpur Mathiyon 6 2 2 1 1 1 1 0 022 Bairiya 5,6,7,3,1 18 119 7 45 11 74 0 023 Akolwa 1,2,3,4,5,6,9 365 2218 8 52 21 150 336 201624 Rajpurpharhadwa 1,8,9,2,4,3,5,6,7 78 596 35 284 43 312 0 025 Bhediyahi 1,2,3,4,5,7,6,8 170 1166 11 142 24 214 135 81026 Laxmipur Belbichhawa 1,2,3,5,6,7,9,8 35 232 7 38 22 158 6 3627 Basatpur 7,3,8,6,2,1,9,4,5 88 619 12 94 40 309 36 21628 Rajpur Tulshi 1,2,3,4,5,6,8,9 22 200 7 51 15 149 0 029 Sakhuwaba 4 1 10 1 10 0 0 0 030 Jetharahiya 3,4,6,7,8 18 126 9 73 3 17 6 3631 Hajminiya 2,3,4,5,6 33 272 13 89 20 183 0 032 Ramauli Bairiya 8,9 10 63 10 63 0 0 0 033 Baluwamadanpur 1,2,3,9 16 108 5 37 3 23 8 4834 Samanpur 2,3,4,5,6,7,8 13 81 13 81 0 0 0 035 Haraiya Paltuwa 2,5,6,8 9 69 9 69 0 0 0 036 Gamariya Parsa 2,5,3,4,7,8,9,6 49 393 49 393 0 0 0 037 Dharampur 3,9,8,2,6,1 96 723 60 507 0 0 36 21638 Sangrampur 1,2,3,4,5, 16 103 16 103 0 0 0 039 Jatahara 7,8,9,1,2,3,4,5,6 46 339 12 106 22 161 12 7240 Mithuawa 1,3,4,6,5,2 22 179 17 141 4 32 1 641 Barharwa 1,2,3,6,8,4,5,9,7 47 373 25 185 22 188 0 042 Saruatha 1,3,4,5 76 457 7 32 3 29 66 39643 Rajdevi 1,4,5,6,7,8,9 32 249 18 128 14 121 0 044 Piprarajwada 5,2,7,8,6,4 29 264 10 95 19 169 0 045 Bhalohiya 6,7,8,1,4,5,9 30 194 20 109 10 85 0 046 Basbitijigadiya 1,2,3,4,7,8,9 84 526 11 88 0 0 73 43847 Gamahariyabirta 4,5,1,7,2 294 1753 15 79 0 0 279 167448 Bishrampur 2,5 10 65 10 65 0 0 0 049 Raghunathpur 5 6 38 6 38 0 0 0 050 Sakhuawadhamaira 6,7,8 10 70 6 46 0 0 4 2451 Mudwalwa 5,6,2,9,8,7,1,3,4 91 603 6 53 85 550 0 052 Barahampuri 1,2,3,5,6,7,9 51 310 6 39 3 19 42 25253 Gaur Municipality 1-13 106 676 29 185 77 491 0 054 Bishunpurwa 1,9,3,6,7,8,4,2 61 487 33 235 28 252 0 055 Jaynagar 1,2,3,4,5,6,7,8,9 147 1115 42 369 65 506 40 24056 Gangapipra 1,3,5,7,8,9 35 220 8 56 1 8 26 15657 Pachrukhi 6,7,8,9 7 28 7 28 0 0 0 058 Malahi 1,2,3,5,6,8,9 13 93 12 87 0 0 1 659 Gadudabairiya 7,6,9 136 822 1 3 6 45 129 77460 Gedahiguthi 1,5,6,8,9,7,4 20 152 6 48 14 104 0 061 Bariyarpur 5,6,8,9 156 938 24 136 22 142 110 66062 Madhopur 8,9,5,6,7,3,4,2,1 83 560 15 89 57 405 11 6663 Dharhari 2,1,8,3,4,5,7,9, 24 167 17 124 5 31 2 1264 Prempurgonahi 1,2,4,3,5,7,8 15 96 13 77 2 19 0 065 Pothiyahi 1,3,5 12 72 12 72 0 0 0 066 Hathiyahi 1,2,3,4 26 198 19 152 7 46 0 067 PipraPokhariya 1,2,3,8,9,4,5,6 43 273 38 252 5 21 0 068 Marydpur 2,3,4,8,9,5,6,1,7 68 503 44 243 24 260 0 069 Sitalpur Barganiya\ 1,2,4,5,3,6,7,8,9 59 406 59 406 0 0 0 070 Karkach Karmahiya 1,4,5,3,2,9,7,8 48 376 21 133 27 243 0 071 Tengraha 3,4,5,6,7,8,9 15 118 13 106 0 0 2 1272 Sonarniya 1,2,3,4,5,6,7,8,9 51 317 31 197 1 6 19 11473 Kankpur 1,2,3,4,5,6 36 184 23 128 13 56 0 074 Birti Prostaka 8,1,3,4,9,5,2,6,7 44 429 3 34 41 395 0 075 Katahariya 3,7,9,2,8,1,6,4,5, 47 294 39 242 8 52 0 076 Bhasherewa 3,6,9 10 66 10 66 0 0 0 077 Laxminiya 2,4,6,7,9 19 116 18 110 0 0 1 678 SantpurDostiya 3,4,5 7 50 7 50 0 0 0 079 PhatuhaHarsaha 1,2,3,4,7,8 17 111 17 111 0 0 0 080 Pautaura 1,3,4,5,6,7,8,9 58 386 31 195 16 125 11 6681 Bagahi 1,3,5,8 9 64 4 24 5 40 0 082 Ajagaibi 1,2,6,7 4 27 4 27 0 0 0 083 Inarwari 2,4,6,7,8,9 42 237 11 45 2 18 29 17484 Gaudhau 1,2,3,4 37 262 5 41 25 179 7 4285 Rangpur 1 1 20 1 20 0 0 0 086 Laxmipurdostiya 4,5,6,7,9 99 666 16 155 5 43 78 46887 Mahamadpur 3,4,8 26 177 15 111 0 0 11 6688 Pipariyadostiya 1,4,8 9 45 9 45 0 0 0 089 Pratpurpaltuwa 1,6,7,8,9 26 183 18 108 8 75 0 090 Simrabhawanii 1,4,5,6,7 22 134 19 120 3 14 0 091 Dipahi 5,6,8 97 588 8 54 0 0 89 53492 Khesarahiya 1,5,6 6 44 6 44 0 0 0 093 Matsari 9,7,6,4,1,3,8 99 610 23 154 7 42 69 41494 Pipariya paroha 3,2,5,4,1,6,9 17 137 17 137 0 0 0 095 Pathara Budharma 7,1,3,6,5,4,9 42 195 42 195
5053 33587 1481 10346 1166 8805 2406 14436Total
Nepal Red Cross Society
Remarks
Impact of Flood in Rautahat District
Moderately affected (C)
Affected Households
SN.
Damaged community
Water Source (Types, location
and number)
Total numbers of Households
Total Population
Name of agency
Agencies involved in Food Aid distribution
CoverageHighly affected (B)
General Information (Affected VDCs and Population)
Name of Flood affected VDC
Flood affected Wards
Severely affected (A)
- 39 -

Households Population Households Population Households Population Households Duration (Days)
1 Achalgadh 15 942 Arnaha 42 563 Atrouli 23 554 Balara 62 155 Belhi 69 1426 Bhadsar 15 1187 Chhataul 50 1008 Chhatona 39 1509 Dhungrekhola 21 6710 Dhurkauli 7 6611 Fulparasi 24 6812 Gamhariya 24 6513 Godeta 17 2714 Gourishankar 12 2615 Haripur 28 2516 Hathiyol 100 17517 Karmaiya 23 4518 Khirwa 75 17519 Khutauna 24 7520 Kodena 45 11721 LaxmipurSu. 42 7722 Madhubani 13 7523 Mahinathpur 75 10224 Malangawa N.P. 50 7525 Manpur 25 55626 Mirjapur 45 16227 Noukailawa 5 1928 Pidariya 27 5429 Pipariya 15 6430 Rajghat 7 2131 RamnagarBahaur 40 15032 Sakraul 18 6433 Salempur 21 4234 Sasapur 9 3535 Shreepur 37 8236 Sikhauna 35 6537 Simara 14 5438 Sisotiya 17 5539 Sisout 25 6040 Sudama 25 1941 Sundarpur 27 6442 TribhuwanNagar 34 63
0 0 1321 0 3619
General Information (Affected VDCs and Population)
Name of Flood affected VDC
Flood affected Wards
Severely affected (A) Name of agency
Agencies involved in Food Aid distribution
CoverageHighly affected (B)
Total
Nepal Red Cross Society
Remarks
Impact of Flood in Sarlahi District
Moderately affected (C)
Affected Households
SN.Damaged community Water Source (Types,
location and number)Total
numbers of Households
Total Population
- 40 -

Households Population Households Population Households Population Households Duration (Days)
1 Gauribas 1 5732 1 3 0 02 KishanNagar 11 7943 9 49 2 113 Bijalpura 6 6924 6 33 0 04 Singyhi 23 7760 23 126 0 05 Banauta 24 6013 11 61 13 726 Bangaha 37 11745 4 22 33 1417 Laxminiya 92 9443 50 275 42 2318 Dhamaura 445 12116 150 825 295 16239 Harinmari 85 6217 36 198 49 27010 Hatisarwa 80 6676 64 352 16 8811 Dharampur 414 4830 178 979 236 129812 Mahadaiya 150 112 616 38 20913 Banaulidanauli 145 4969 53 292 92 50614 Pipara 52 7884 40 220 12 6615 Padaul 115 6014 40 220 75 41216 Matihani 337 7619 185 1017 152 83617 Sahodawa 150 5531 109 299 41 22618 Ekrahiya 315 9085 259 1424 56 30819 Nainhi 164 7112 164 1141 0 020 Simardahi 182 5072 30 165 152 83621 Sugabhawanipatti 142 5180 110 605 32 17622 Parsapataili 120 3322 48 264 72 39623 Badiyabanchauri 66 6568 22 121 44 24224 Dhirapur 112 8213 72 396 40 24025 Pigauna 59 3814 59 397 0 026 Mahottari 144 9815 104 572 40 24027 Prakaulifulhatta 125 5136 81 486 44 24228 Majhaurabisanpur 101 5638 34 187 67 36829 Jaleshwar nagar 1395 22046 342 1881 1053 579130 Bhamarpura 200 8239 97 533 103 56631 Ratauli 96 5405 65 357 31 17032 Sandha 95 4335 23 126 72 39633 Itaharwakatii 454 6508 80 440 374 205734 Siswakattaiya 92 7195 68 374 24 13235 Ankar 135 5228 39 214 96 52836 Halkhori 182 5867 142 781 40 22037 Gaidabhetpur 374 5217 79 429 295 162338 Damhimadai 202 9410 63 346 9064 190339 Bhatoliya 149 4490 131 720 18 9940 Gonarpura 417 102 561 315 173241 Sarpallo 183 8669 80 440 103 55742 Balwa 185 8104 97 533 88 44043 Samsi 112 6632 21 115 91 45544 Ramgopalpur 82 9705 67 368 15 9045 Ekdarabela 20 8341 15 83 5 3046 Kolhuwabagiya 275 6497 117 643 158 86947 Bathnaha 120 8138 92 506 28 15448 Pokharvinda 83 8816 44 242 39 21449 Manra 77 5740 45 247 32 17650 Sonaul 120 3678 69 389 51 30051 Shreepur 15 9598 14 77 1 652 Parsadewad 62 9527 62 508 0 053 Khopi 31 6940 26 143 5 3054 Belgachi 17 5542 11 61 6 3255 Nigaul 8 6419 0 0 8 4556 Gaushlla 18 13655 7 38 11 6057 Khairbanni 118 6870 45 247 73 40158 Raghunathpur 145 5060 50 275 95 52259 Baspitti 105 5497 82 451 23 12660 Bharatpur 15 8323 3 19 12 7261 Aurahi Phulvariya 10 7068 10 55 0 0
9289 429130 4242 23547 13972 28833
Agencies involved in Food Aid distribution
CoverageHighly affected (B)
General Information (Affected VDCs and Population)
Name of Flood affected VDC
Flood affected Wards
Severely affected (A) Name of agency
Total
Nepal Red Cross Society
Remarks
Impact of Flood in Mahottari District
Moderately affected (C)
Affected Households
SN.
Damaged community
Water Source (Types, location
and number)
Total numbers of Households
Total Population
- 41 -

Households Population Households Population Households Population Households Duration (Days)
1 Singiyahi Madan 1-9 496 2776 295 1550 201 12262 Bala Bakhar 1-9 280 1665 175 1067 105 5983 Balaha Saghara 1-9 458 2864 205 1271 253 15934 Balaha Goth 1-9 320 1963 125 774 195 11895 Balaha Kathal 1-9 338 2111 135 877 203 12346 Lakker 1-9 389 2492 180 1134 209 13587 Chora Koilpur 1-9 261 1637 66 409 195 12288 Inaruwa 1-9 182 1032 56 302 126 7309 Raghunath pur 1-9 125 732 42 243 83 489
10 Dhanuji 1-9 273 1634 101 585 172 104911 Dewari Parbaha 1-9 182 1049 58 330 124 71912 Aurahi 1-9 92 529 42 239 50 29013 Sabaila 1-9 60 369 29 182 31 18714 Lakhauri 1-9 123 700 42 231 81 46915 Sugamadhukari 1-9 77 474 24 142 53 33216 Lohana 1-9 113 720 29 182 84 53817 Jhoji Kataiya 1-9 192 1087 25 152 167 93518 Patnukka 1-9 75 438 24 143 51 29519 Itharwa 1-9 56 335 20 123 36 21220 Dhanusha Gobindpur 1-9 309 1808 57 347 252 146121 Jhatiyahi 1-9 161 926 36 208 125 71822 Anrudpatti Katrait 1-9 44 256 17 92 27 16423 Mansing patti 1-9 80 507 14 78 66 42924 Bafai 1-9 180 1128 56 347 124 78125 Bharatpur 1-9 83 486 15 92 68 39426 Labtoli 1-9 66 360 45 243 21 11727 Godar 1-9 74 425 27 153 47 27228 Kurtha 1-9 145 867 32 200 113 66729 Kharihani 1-9 161 964 76 463 85 50130 Chakkar 1-9 147 891 84 520 63 37131 Pachaharaba 1-9 149 907 54 318 95 58932 Mithileswormauhai 1-9 96 580 33 202 63 37833 Lauwakhor parsai 1-9 79 457 27 150 52 30734 Khajuri chanha 1-9 166 1029 31 192 135 83735 Pra.kheMahuwa 1-9 189 1123 35 199 154 92436 Ekrahi 1-9 95 591 32 201 63 39037 Mithileswor Nikas 1-9 79 498 28 174 51 32438 Gopal pur 1-9 68 413 23 138 45 27539 Yadukuha 1-9 141 838 63 386 78 45240 Dhabauli 1-9 97 595 35 217 62 37841 Harine 1-9 498 3124 235 1468 263 165642 Dhanusha Dham 1-9 164 991 52 307 112 68443 Sapahi 1-9 79 506 22 134 57 37244 Umaprempur 1-9 167 968 64 346 103 62245 Bhutahi Paterwa 1-9 69 403 22 136 47 26746 Satokher 1-9 86 533 30 183 56 35047 Thera Kachuri 1-9 71 418 23 140 48 27848 Hanspur Kathpulla 1-9 94 585 35 221 59 36449 Baghchaura 1-9 80 492 25 154 55 33850 Tarapatti Sirsiya 1-9 45 266 13 72 32 19451 Thadi jhijha 1-9 297 1747 105 634 192 111352 Ghorghas 1-9 110 650 35 209 75 44153 Depura Rupaitha 1-9 127 749 31 192 96 55754 Mukhiya patti 1-9 560 3489 178 1121 382 236855 Tulsiyahi Jabdi 1-9 440 2627 128 693 312 193456 Tulsiyahi Nikas 1-9 450 2964 123 774 327 219057 Bahera Bela 1-9 439 2752 135 837 304 191558 Fulgama 1-9 412 2589 62 384 350 220559 Basahiya 1-9 72 445 25 154 47 29160 Bindhi 1-9 78 513 21 189 57 32461 Basbitti 1-9 114 673 27 152 87 52162 Nagrain 1-9 327 1930 64 365 263 156563 Kanakpatti 1-9 269 1703 54 338 215 136564 Paureshwar 1-9 75 462 28 175 47 28765 Pra ko Mahuwa 1-9 164 1040 29 182 135 85866 Lagma Garha Guthi 1-9 125 806 27 169 98 63767 Nathpati Bisarbhora 1-9 148 933 35 217 113 71668 Puspwalpur 1-9 58 319 13 75 45 24469 Digambarpur 1-9 81 487 19 120 62 36770 Naktajhijh 1-9 33 201 11 67 22 13471 Laxminiwash 1-9 52 301 17 98 35 20372 Bateshwar 1-9 72 447 21 132 51 31573 Bahuarwa 1-9 75 451 28 157 47 29474 Hathipur Harbara 1-9 101 632 26 163 75 46975 Laxmipur Bagewa 1-9 63 404 17 111 46 29376 Santipur 1-9 46 284 25 152 21 13277 Suganikash 1-9 60 379 25 153 35 22678 Bengadawer(Lalgadh) 1-9 76 374 23 122 53 25279 Duhabi 1-9 175 969 117 643 58 32680 Nannupatti 1-9 79 444 28 154 51 29081 Goth Koilpur 1-9 150 955 45 293 105 66282 Ramdaiya 1-9 40 259 13 82 27 17783 Debdiha 1-9 177 996 32 176 145 82084 Machi Jhitkaiya 1-9 159 970 49 302 110 66885 Dubarkot Hatletwa 1-9 350 2187 125 781 225 140686 Hariharpur 1-9 38 226 13 72 25 15487 Baniniya 1-9 52 334 17 110 35 22488 Janakpur 1.2.4.7.8,10,11,16 432 2298 122 640 310 1658
14630 88531 4907 29405 9723 59126Total
Nepal Red Cross Society
Remarks
Impact of Flood in Dhanusha District
Moderately affected (C)
Affected Households
SN.
Damaged community
Water Source (Types, location
and number)
Total numbers of Households
Total Population
Name of agency
Agencies involved in Food Aid distribution
CoverageHighly affected (B)
General Information (Affected VDCs and Population)
Name of Flood affected VDC
Flood affected Wards
Severely affected (A)
- 42 -

Households Population Households Population Households Population Households Duration (Days)
1 Majhauliya 1-9 127 638 27 165 15 88 85 385 NRCS/SCF/ DAO/DDC 20 2 22
2 Bhediya 1-9 97 574 4 25 14 84 79 465 NRCS/SCF/ DAO/DDC 89 2 17
3 Chikna 1-9 384 2032 73 441 43 257 268 1334 NRCS/SCF/ DAO/DDC 382 2 46
4 Sikron 1-9 212 1212 6 35 20 122 186 1055 NRCS/SCF/ DAO/DDC 146 2 7
5 Bhokraha 16 92 5 32 0 0 11 60 NRCS/SCF/ DAO/DDC 15 2 5
6 Kalyanpur Jawdi 1-9 309 1655 63 378 51 304 195 973 0 0 297 Bishnupur (Pra.ra.) 1-9 213 1007 21 127 5 29 187 851 NRCS/SCF/
DAO/DDC 65 2 23
8 Lagdi Goath 1-9 219 1432 34 204 37 224 148 1004 NRCS/SCF/ DAO/DDC 69 2 21
9 Lagdi Gadiyani 1-9 285 1997 67 345 35 610 183 1042 NRCS/SCF/ DAO/DDC 103 2 23
10 Harkatti 1-9 411 1509 58 345 101 610 252 554 NRCS/SCF/ DAO/DDC 0 0 35
11 Itatar 1-9 291 1913 22 134 44 265 225 1514 NRCS/SCF/ DAO/DDC 104 1 48
12 Aurhi 1-9 268 1800 39 234 51 308 178 1258 2513 Gautari 1-9 65 325 18 105 15 91 32 129 NRCS/SCF/
DAO/DDC 19 2
14 Bariyarpatti 1-9 300 1954 66 394 62 371 172 1189 NRCS/SCF/ DAO/DDC 44 2 50
15 Hakapada 1-9 194 1077 65 390 39 231 90 456 NRCS/SCF/ DAO/DDC 194 2
16 Siraha Municipality 1-9 579 2618 155 860 91 540 333 1218 NRCS/SCF/ DAO/DDC 145 2 11
17 Barchhawa 1-9 159 916 36 215 6 34 117 667 NRCS/SCF/ DAO/DDC
18 Thalha Kataha 1-9 106 614 30 182 25 148 51 284 NRCS/SCF/ DAO/DDC 31 2
19 Inarwa 1-9 451 2670 115 688 101 600 235 1382 NRCS/SCF/ DAO/DDC 2 2
20 Madar 1-9 180 1155 53 315 37 223 90 61721 Badaharamal 59 310 17 105 9 53 33 152 NRCS/SCF/
DAO/DDC 23 222 Sitapur 8 38 4 18 4 20 0 023 Siswani 41 310 18 130 17 122 6 5824 Itari parsahi 1-9 133 772 5 29 6 35 122 708 NRCS/SCF/
DAO/DDC 123 2 3325 Kurwa Hanuman Nagar 27 192 8 47 2 11 17 13426 Hanumannagar Pra.m. 1-9 268 1059 61 256 19 84 188 71927 Maheshpur Gamahariya 30 162 0 0 3 25 27 13728 Ramnagar Mirchaiya 1-9 120 577 21 125 10 61 89 391 NRCS/SCF/
DAO/DDC 28 2
29 Rampur Birta 1-9 83 410 14 86 18 111 51 213 NRCS/SCF/ DAO/DDC 19 2
30 Raghopur 30 154 8 45 7 41 15 6831 Malhaniyakhori 23 102 7 29 9 43 7 30 NRCS/SCF/
DAO/DDC 10 2
32 Krishnapur 1-9 141 830 60 362 16 98 65 370 NRCS/SCF/ DAO/DDC 79 2
33 Tenuwapatti 38 263 18 126 10 68 10 6934 Belaha 46 248 11 67 9 56 26 12535 Sarshwar 62 304 15 87 12 68 35 14936 Sonamati Majhaura 15 99 6 42 2 13 7 4437 Bhadaiya 33 204 16 96 14 85 3 2338 Bashtipur 10 39 3 14 7 25 0 039 Bishnupur Katti 12 49 3 14 4 16 5 19 NRCS/SCF/
DAO/DDC 12 240 Gauripur 66 444 9 64 29 195 28 18541 Arnama Pra. Pi. 1-9 343 2140 112 698 71 439 160 100342 Sukhachaina 1-9 132 867 14 90 40 252 78 52543 Malhniya Gamhriya 73 448 23 142 18 111 32 19544 Chatari 1-9 212 955 48 275 10 51 154 629 55 245 Khirauna 1-9 121 734 48 291 14 85 59 35846 Kabilashi 78 526 12 79 19 127 47 32047 Bhagabanpur 103 809 9 75 31 220 63 51448 Silorwa Pachhwari 70 427 21 129 15 95 34 20349 Pipra Pra. Pi. 1-9 208 1565 46 325 89 621 73 61950 Tulsipur 1-9 67 460 41 256 16 106 10 9851 Laxmipur 1-9 144 908 60 381 25 161 59 366 NRCS/SCF/
DAO/DDC 1 2
52 Phulabariya 32 155 14 71 6 26 12 58 NRCS/SCF/ DAO/DDC 18 2
53 Karjanaha 6 34 2 14 0 0 4 20 NRCS/SCF/ DAO/DDC 2 2
54 Laxaminiya 1-9 132 720 7 45 60 366 65 309 NRCS/SCF/ DAO/DDC 3 2
55 Sanhaitha 1-9 336 1398 56 265 76 360 204 77356 Bhagawatiur 97 725 9 70 32 240 56 41557 Naharararigol 40 245 9 58 13 84 18 10358 Gadha 28 170 9 53 18 110 1 759 Itaharwa kalyanpur 98 825 10 78 10 76 78 67160 Sakhuwanankar katti 28 154 11 63 8 45 9 4661 Bhawanipur kalabanjr 1-9 94 532 23 140 6 38 65 35462 Mahadeva portaha 82 545 14 86 43 302 25 15763 Brahman Gaurchhari 72 405 23 136 6 41 43 22864 Padariya 23 126 16 90 1 6 6 3065 Bhawanipur Pra. Dha. 16 67 8 34 2 9 6 2466 Mahanaur 56 373 7 35 46 322 3 1667 Arnama baniniya 1-9 109 552 28 168 5 31 76 35368 Ashanpur 52 310 39 224 13 86 0 0 NRCS/SCF/
DAO/DDC 1 2
69 Betauna 38 230 6 37 31 186 1 7 NRCS/SCF/ DAO/DDC
70 Devipur 1-9 121 697 80 468 36 204 5 2571 Durgapur 48 286 29 172 14 86 5 2872 Chandraudaypur 12 70 8 52 0 0 4 1873 Chandralalpur 4 18 2 7 1 6 1 574 Chandraayodhyapur 49 298 27 164 10 58 12 7675 Nahara Ballkawa 1-9 106 606 13 72 23 123 70 41176 Sothiyain 1-9 143 921 31 180 37 216 75 52577 Dhangadhi 45 226 14 74 0 0 31 15278 Lahan municipality 1-9 254 1413 77 371 30 160 147 88279 Janakinagar 16 93 4 26 12 67 080 Kharukyahi 16 66 0 0 7 28 9 3881 Mauwahi 20 140 9 63 2 14 9 6382 Jijhaul 1-9 107 575 28 168 37 218 42 18983 Kachanari 62 467 26 162 20 138 16 167
10004 57037 2334 13743 1952 12283 5718 31011 1802 55 395Total
Nepal Red Cross Society
Remarks
Impact of Flood in Siraha District
Moderately affected (C)
Affected Households
SN.Damaged community Water Source (Types, location and number)
Total numbers of Households
Total Population
Name of agency
Agencies involved in Food Aid distribution
CoverageHighly affected (B)
General Information (Affected VDCs and Population)
Name of Flood affected VDC
Flood affected Wards
Severely affected (A)
- 43 -

Households Population Households Population Households Population Households Duration (Days)
1 Badgama 1-9 150 689 30 182 40 246 80 261 9 Tubewell2 Bakduwa 1-9 192 1392 25 150 64 385 105 857 5 Tubewell3 Baghangama Katti 1-9 150 643 17 105 49 300 85 238 13 Tubewell4 Baunula 1-9 154 924 11 68 74 448 72 408 4 Tubewell5 Banarjhula 1-9 30 129 6 37 9 56 15 36 19 Tubewell6 Barhi Sirpur 1-9 305 1517 98 588 55 335 151 594 4 Tubewell7 Barmajhiya 1-9 200 998 18 108 72 438 105 452 6 Tubewell8 Baswalpur 1-9 55 335 9 53 23 140 25 142 10 Tubewell9 Basbitti 1-9 54 297 7 40 7 46 28 211 Tubewell10 Bathnaha 1-9 46 289 3 18 6 22 27 249 3 Tubewell11 Belhi 1-9 65 397 5 30 27 166 33 201 Tubewell12 Belhi Chapena 1-9 136 531 17 105 34 225 85 201 50 Tubewell13 Bhangha 1-9 91 459 13 65 13 75 55 319 10 Tubewell14 Bhagwatpur 1-9 25 112 2 15 11 69 12 28 5 Tubewell15 Bhardah 1-9 268 1678 12 72 132 795 74 811 20 Tubewell16 Bhutahi 1-9 198 892 30 185 83 499 85 208 25 Tubewell17 Bbjshhariya 1-9 275 2475 35 209 58 350 92 1916 22 Tubewell18 Bode Barsain 1-9 105 633 13 78 31 186 61 369 5 Tubewell19 Boriya 1-9 30 177 17 103 27 165 86 91 6 Tubewell20 Barahmpur 1-9 41 173 9 52 14 86 18 35 10 Tubewell21 Chhinmasta 1-9 70 434 15 91 25 160 30 183 5 Tubewell22 Dadha 1-9 46 241 6 36 18 108 22 97 17 Tubewell23 Daulatpur 1-9 97 598 31 184 32 192 34 222 10 Tubewell24 Deuri 1-9 200 1081 16 92 89 534 95 455 8 Tubewell25 Deuri Bharuwa 1-9 81 377 4 23 37 220 40 134 33 Tubewell26 Dhangadhi 1-9 115 667 9 51 51 304 55 312 Tubewell27 Digwa 1-9 195 919 21 124 85 511 89 184 Tubewell28 Farsaith 1-9 25 145 3 12 10 66 12 67 10 Tubewell29 Fulkahi 1-9 15 87 2 10 5 35 8 42 12 Tubewell30 Gamhariya Parwaha 1-9 135 702 11 64 59 355 65 283 5 Tubewell31 Gobargadha 1-9 195 897 81 482 55 336 59 79 5 Tubewell32 Goithi 1-9 103 529 17 105 41 246 45 178 9 Tubewell33 Hanumannagar 1-9 198 997 18 110 38 528 92 359 15 Tubewell34 Hardiya 1-9 85 595 7 45 38 232 40 318 8 Tubewell35 Haripour 1-9 75 457 11 62 31 185 33 210 Tubewell36 Inwara 1-9 95 683 13 78 40 245 42 360 7 Tubewell37 Inwarwa Fulwariya 1-9 21 105 17 95 Tubewell38 Ithari Bishnupur 1-9 210 1277 7 40 98 600 105 637 9 Tubewell39 Jagatupur 1-9 119 714 9 66 110 600 Tubewell40 Jamuni Madhepura 1-9 71 418 3 18 68 400 5 Tubewell41 Jandoul 1-9 91 546 9 54 42 252 40 240 6 Tubewell42 Joginia-1 1-9 67 402 11 65 56 300 3 Tubewell43 Joginia-2 1-9 107 642 7 42 100 600 4 Tubewell44 Kabilasa 1-9 105 630 14 84 91 546 Tubewell45 Kalyanpur 1-9 69 414 4 24 65 390 3 Tubewell46 Kanchanpur 1-9 177 1082 21 126 156 936 8 Tubewell47 Kataiya 1-9 240 1198 26 156 214 780 13 Tubewell48 Khadakpur 1-9 65 380 7 40 58 340 Tubewell49 Khojpur 1-9 27 165 7 45 20 120 Tubewell50 Khoksar Prawaha 1-9 12 73 5 32 7 41 3 Tubewell51 Kochabakhari 1-9 268 1142 60 360 55 330 153 452 Tubewell52 Koiadi 1-9 460 2858 115 690 90 540 255 1628 Tubewell53 Kushaha 1-9 77 472 40 250 37 222 5 Tubewell54 Lalapati 1-9 16 94 12 65 4 26 Tubewell55 Loniya 1-9 2 15 2 15 6 Tubewell56 Loizara 1-9 17 104 11 66 6 38 Tubewell57 Malwapur 1-9 5 32 5 32 Tubewell58 Mandewa 1-9 205 1120 75 460 130 660 7 Tubewell59 Malekhpur 1-9 25 150 15 90 10 60 Tubewell60 Maleth 1-9 50 305 32 192 18 113 10 Tubewell61 Malahania 1-9 340 2040 57 342 283 1698 Tubewell62 Malwaha 1-9 84 500 39 230 45 270 Tubewell63 Manraja 1-9 25 150 9 54 16 96 Tubewell64 Mohanpur 1-9 92 565 41 250 51 315 7 Tubewell65 Nargho 1-9 25 150 14 84 11 66 Tubewell66 Odraha 1-9 325 1948 209 1250 116 698 3 Tubewell67 Pakari 1-9 201 1267 108 652 102 615 Tubewell68 Paterwa 1-9 120 725 98 590 22 135 Tubewell69 Pathargada 1-9 104 613 16 99 28 175 60 330 27 Tubewell70 Pato 1-9 223 1343 98 591 125 752 Tubewell71 Fakira 1-9 25 160 20 125 5 35 5 Tubewell72 Fatepur 1-9 310 1860 198 1188 112 672 6 Tubewell73 Piprapurw 1-9 105 630 76 456 29 174 Tubewell74 Patha 1-9 322 1932 201 1208 121 726 38 Tubewell75 Pipra Pachim 1-9 145 870 86 516 59 354 15 Tubewell76 Rajbiraj Municipality 1-9 143 870 109 660 34 210 48 Tubewell77 Ramnagar 1-9 35 217 12 75 23 142 5 Tubewell78 Rampur Jamuwa 1-9 210 1277 85 525 125 752 3 Tubewell79 Rampur Malahaniya 1-9 410 2478 109 658 301 1820 53 Tubewell80 Rauthat 1-9 23 143 11 68 12 75 Tubewell81 Nakti Raypur 1-9 55 340 15 95 40 245 8 Tubewell82 Sakarpura 1-9 335 2010 243 1458 92 552 16 Tubewell83 Sarswar 1-9 171 1029 96 579 75 460 Tubewell84 Sambhunath 1-9 98 627 35 215 56 340 72 7 10 Tubewell85 Simraina Sigiyoun 1-9 305 2104 56 336 212 1272 37 496 Tubewell86 Tarhi 1-9 42 259 6 39 36 220 7 Tubewell87 Tikuliya 1-9 255 2014 98 588 109 654 48 772 Tubewell88 Tilathi 1-9 85 510 25 150 22 135 38 225 Tubewell89 Ko-Barsain 1-9 120 735 55 335 65 400 Tubewell
11539 67853 3381 20260 5340 31241 2863 15897 703Total
Agencies involved in Food Aid distribution
CoverageHighly affected (B)
General Information (Affected VDCs and Population)
Name of Flood affected VDC
Flood affected Wards
Severely affected (A)
Nepal Red Cross Society
Remarks
Impact of Flood in Saptari District
Moderately affected (C)
Affected Households
SN.
Damaged community
Water Source (Types, location
and number)
Total numbers of Households
Total Population
Name of agency
- 44 -