Embed Size (px)
Citation preview
WAGENINGEN UNIVERSITY – DEPARTMENT OF SOCIAL SCIENCES
DETERMINANTS OF COCOA FARMER’S INVESTMENT DECISION IN GHANA:
INTENSIFICATION OR EXPANSION
An MSc Thesis in International Development Studies (DEC-80436)
Development Economics Group
By
Mildred F. Delos Reyes
Under the supervision of
Kees Burger, DEC
August 2013
i
WAGENINGEN UNIVERSITY – DEPARTMENT OF SOCIAL SCIENCES
DETERMINANTS OF COCOA FARMER’S INVESTMENT DECISION IN GHANA:
INTENSIFICATION OR EXPANSION
An MSc Thesis in International Development Studies (DEC-80436)
Development Economics Group
By
Mildred F. Delos Reyes
Under the supervision of
Kees Burger, DEC
August 2013
ii
ABSTRACT
Growth of cocoa production in Ghana particularly in period 2002 to 2006 gave particular
interest to different researchers to analyse the reasons behind the booming sector. The two
main strategies, intensification or expansion, that a famer can take are the main focus of this
study. Using OLS, Random-effect and fixed-effect estimator, the study investigates the factors
that significantly influence their decision and how this strategy contributes to the growth in
cocoa production. The study used panel data of 356 farmers sourced from Ghana Cocoa Farmer
Survey (GCFS) collected by the Centre for the Study of African Economies (CSAE) in 2002, 2004,
and 2006. Results show that fertilizer and insecticide use significantly and positively affect
yields of cocoa. It was also found out that percentage of area planted with mature trees and
geographical location of farmer significantly influence farmers decision to increase fertilizer
and insecticide application while other variables such as household size, farm size, and
previous yield were found to significantly influence area expansion but it varies depending on
the period.

iii
ACKNOWLEDGEMENT
I would like to express my gratitude to the following: First of all, I would like to express my deepest gratitude to my supervisor, Dr. Kees Burger, for helping and giving me valuable advice and inputs specially at the moment of confusion and for making me see things seemed to be impossible become possible. To the Centre for the Study of African Economies (CSAE) for sharing data on Ghana Cocoa Farmer Survey (GCFS). To my family specially my nanay, whom become my inspiration for pursuing my masteral degree. To Ate Mona, Kuya Marlon and Mel for their support, love and encouragement. To Mikyle, who is my source of joy and inspiration specially during difficult times. To Netherlands Organization for International Cooperation and Netherland Fellowship Programme for opening the opportunity to pursue my dream to study at Wageningen University. Also, I would like to express my appreciation to my study adviser, Sudha Loman, for giving support and valuable advice and to all my friends here in Netherlands whom became my second family. Lastly, to God for giving me unconditional love, continuous blessings, enlightenment and for making a way when there seems to be no way. Mildred F. Delos Reyes Development Economics Group Wageningen University and Research Centre
iv
TABLE OF CONTENTS
CHAPTER 1 ........................................................................................................................................................... 1
1. Introduction ............................................................................................................................................. 1
1.1. Cocoa production in Ghana ................................................................................................................. 1
1.2. Research problem ................................................................................................................................ 4
1.3. Research objectives ............................................................................................................................. 5
1.4. General and specific research questions ............................................................................................. 5
General research questions ......................................................................................................................... 5
Specific research questions ......................................................................................................................... 5
1.5. Thesis outline ....................................................................................................................................... 5
CHAPTER 2 ........................................................................................................................................................... 7
2. Literature review ..................................................................................................................................... 7
2.1. Theory of farm decision making .......................................................................................................... 7
2.2. Concept of Intensification and Expansion ........................................................................................... 7
2.3. Factors that influence farmer’s decision ............................................................................................. 8
2.4. Opportunities and constraints for intensification and expansion ....................................................... 9
2.5. The model .......................................................................................................................................... 10
CHAPTER 3 ......................................................................................................................................................... 13
3. Methodology ......................................................................................................................................... 13
3.1. Description of study area .................................................................................................................. 13
3.2. Data source and data selection ......................................................................................................... 14
3.3. Data Analysis ..................................................................................................................................... 16
CHAPTER 4 ......................................................................................................................................................... 18
4. Results and Discussion ........................................................................................................................... 18
CHAPTER 5 ......................................................................................................................................................... 40
5. Summary and conclusion ...................................................................................................................... 40
REFERENCES ...................................................................................................................................................... 41
APPENDIX A ....................................................................................................................................................... 42
APPENDIX B ....................................................................................................................................................... 48
1
CHAPTER 1
1. Introduction
Cocoa is one of the major crops in Ghana and it serves as the major source of export
revenue of the country (Dormon, Van Huis et al. 2004). From 1990-1999, it has
contributed about 29% of the total export revenue of the country and about 3.4% of the
total GDP while cocoa production contributed to 30% of agricultural growth from 1984
to 2008 (Ozden and Santos). Thus, cocoa deserves an important focus of the government
to combat poverty and food insecurity. The cocoa sector is widely considered as one of
the drivers of poverty reduction in the country (Ozden and Santos) and about 700,000
farmers in the southern tropical zone of Ghana depend on cocoa for their livelihood
(Kolavalli and Vigneri 2011).
1.1. Cocoa production in Ghana
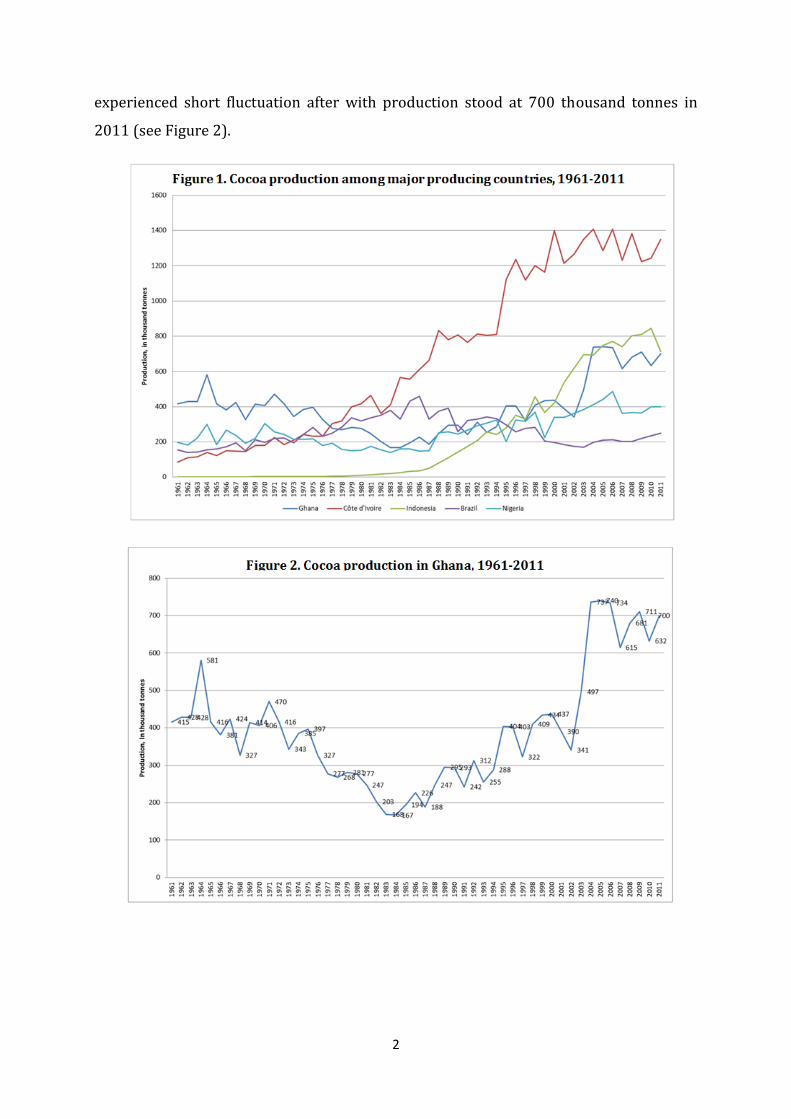
Ghana was once the largest producer of cocoa in the world from the early 1960s to the
mid-1970s (Dormon, Van Huis et al. 2004; Kolavalli and Vigneri 2011)but it is now on
the third place among the major producers (Fig. 1). Its cocoa production has undergone
a series of ups and downs (Fig 2). A decline was recorded from mid-1960s to mid-1980s
with its lowest value at 167 thousand tonnes in 1987 which can be explained partly by
the overvalued exchange rate and heavy taxes passed on to cocoa producer due to
monopsonic nature of the cocoa marketing board (Ozden and Santos ; Teal and Vigneri
2004). Towards the 1990s, cocoa production started to increase again with short
fluctuation in between. Increase in cocoa production became more steady starting 2001
which can be attributed to increasing world prices, high price enjoyed by the farmers as
a result of some liberalization by the marketing board, various government programs
aimed at increasing production and reported smuggled cocoa bean from Côte d’Ivoire
(Vigneri and Santos 2009). Between 2002 and 2004, a dramatic increase in production
was observed of about 89% and the country reached its highest production level
recorded since 1961 by producing 740 thousand tonnes in 2005. Then again, it
2
experienced short fluctuation after with production stood at 700 thousand tonnes in
2011 (see Figure 2).
3
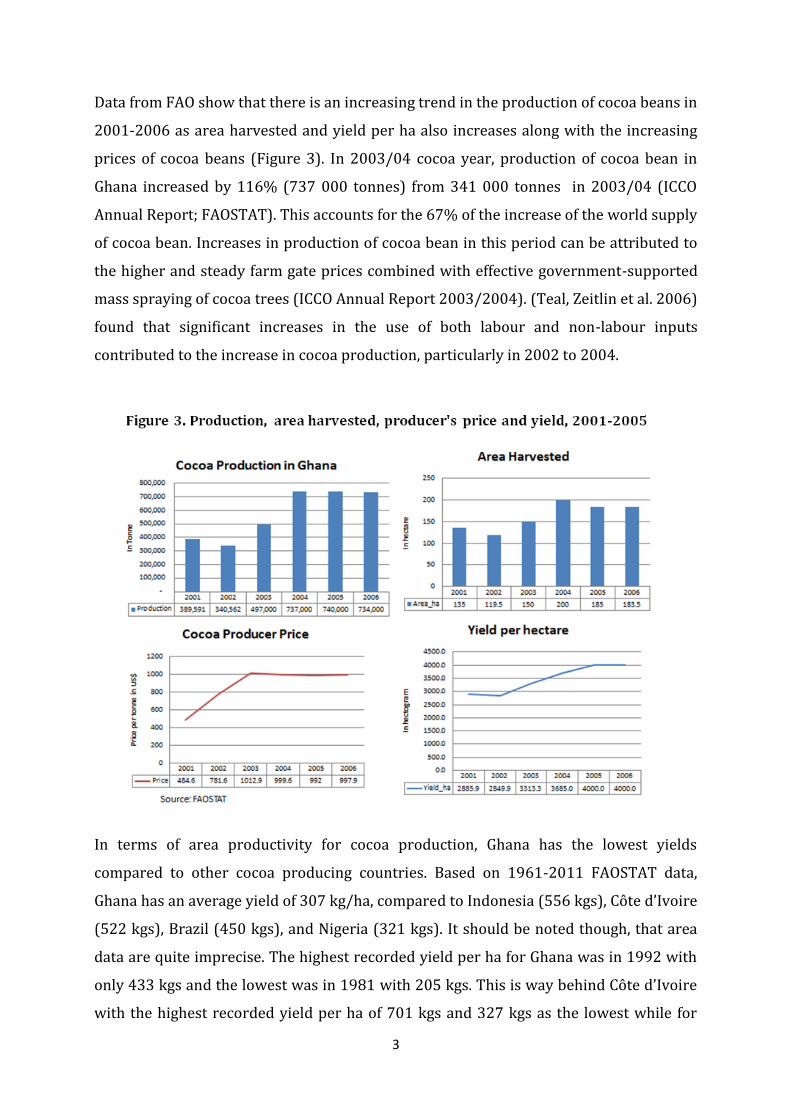
Data from FAO show that there is an increasing trend in the production of cocoa beans in
2001-2006 as area harvested and yield per ha also increases along with the increasing
prices of cocoa beans (Figure 3). In 2003/04 cocoa year, production of cocoa bean in
Ghana increased by 116% (737 000 tonnes) from 341 000 tonnes in 2003/04 (ICCO
Annual Report; FAOSTAT). This accounts for the 67% of the increase of the world supply
of cocoa bean. Increases in production of cocoa bean in this period can be attributed to
the higher and steady farm gate prices combined with effective government-supported
mass spraying of cocoa trees (ICCO Annual Report 2003/2004). (Teal, Zeitlin et al. 2006)
found that significant increases in the use of both labour and non-labour inputs
contributed to the increase in cocoa production, particularly in 2002 to 2004.
In terms of area productivity for cocoa production, Ghana has the lowest yields
compared to other cocoa producing countries. Based on 1961-2011 FAOSTAT data,
Ghana has an average yield of 307 kg/ha, compared to Indonesia (556 kgs), Côte d’Ivoire
(522 kgs), Brazil (450 kgs), and Nigeria (321 kgs). It should be noted though, that area
data are quite imprecise. The highest recorded yield per ha for Ghana was in 1992 with
only 433 kgs and the lowest was in 1981 with 205 kgs. This is way behind Côte d’Ivoire
with the highest recorded yield per ha of 701 kgs and 327 kgs as the lowest while for
4
Indonesia, the highest is 1132 kgs and the lowest is 122 kgs. It only suggest that there is
still room for improvement for cocoa production in Ghana which can be done through
application of fertilizer, pesticide, use of yielding variety, and proper maintenance which
estimated to increase productivity of about 30% (Kolavalli and Vigneri 2011).
1.2. Research problem
In an effort to revive the strong performance of cocoa production, the Ghanaian
government introduced different reforms in the cocoa sector such as mass-spraying of
cocoa farms under Cocoa Disease and Pest Control Programme at no direct cost to
farmers starting 2001, provision of fertilizers and pesticides under interest-free credit
scheme called Cocoa ‘High-Tech’ Programme since 2003 (Dormon, Van Huis et al. 2004),
liberalization of marketing board of cocoa to induce producer prices (Teal and Vigneri
2004) and introduction of hybrid cocoa varieties through Cocoa Rehabilitation Project in
1984 (Kolavalli and Vigneri 2011), among others. However, these efforts seemed
insufficient as Teal and Vigneri (Teal and Vigneri 2004) argued that yield are still far
below the experimental frontier established in Ghana and elsewhere. This can be
explained by low productivity due low farm investment that could further lead to poor
maintenance practices, planting low-yielding varieties, and incidence of pests and
diseases. For example, despite reports of successful adoption of fertilizer application and
other inputs under the package provided by Cocoa Abrabopa Association, a group of
farmer with mature trees, about 40% of 11,000 farmers who participated in 2008
dropped out of the programme (Kolavalli and Vigneri 2011). Ozden and Santos found
that productivity increased by 80% in the sample of cocoa farmers surveyed in 2004 and
2006. The increase was mainly attributed to the increases in technical efficiency and
scale efficiency though the former was smaller than the later. Meanwhile, another study
(Teal, Zeitlin et al. 2006) showed that farmers in Western region of the country were
using extensive way of production (expanding area for production) while farmers in
both Ashanti and Brong Ahafo were characterized by intensive means of production.
This is where farmers employ new innovative technology such as the use of hybrid
varieties, fertilizer, pesticide, etc. on same areas. These findings were based on panel
data of 443 farmers participating in both 2002 and 2004 Ghana Cocoa Farmer Survey.
5
These two production systems that a farmer can adopt to increase production play a
vital role in achieving increasing productivity.
Therefore it is important to understand the factors that influence farmers to move
toward extensive or intensive production.
1.3. Research objectives
The main objective of this study is to establish at a micro-level which factors, expansion
or intensification, contributed most to production increase and to assess which strategy
is more rewarding in the conditions in which the farmers found themselves.
1.4. General and specific research questions
In order to achieve the research objectives and contribute in finding solutions to above
problems, the following general and specific research questions will be used as a guide.
General research questions
1. What are the factors that have a significant influence on farmer’s decision to adopt
intensive or extensive way of increasing production?
2. What strategy is more rewarding in the conditions in which the farmers find
themselves?
Specific research questions
1. Did input costs (e.g. labour, fertilizer, pesticide, seedlings, etc.,) significantly influence
farmer’s investment decision to adopt intensive or extensive way of increasing
production?
2. Under which condition is the intensive or the extensive way of increasing production
more rewarding for the farmer?
1.5. Thesis outline
The research report will be organized into five parts. The first part will be the
introduction consisting of general background of the study, problem statement, research
6
objectives and research questions. The second part will focus on a literature review of
past studies including some economic theories related to my research. The third part
will discuss about the methodology on how to achieve the objective of the research.
Fourth part will be the discussion and presentation of the results. Last part will dwell on
the findings and give conclusions, and suggest possible recommendation for further
study.
7
CHAPTER 2
2. Literature review
This chapter discusses the theory of farm production decision and explains the concepts
of intensification and expansion strategy as the two available options for the farmer. It
also presents a summary of factors influencing farmer’s decision on which strategy to
adopt to increase production in response to price changes including its opportunities
and constraints.
2.1. Theory of farm decision making
Production is a process of combining inputs to produce certain output (Colman and
Young 1989) and in doing so the farmer, as a decision maker, is usually faced with
various considerations such as how much output to produce, which combination of
inputs to choose, and when is the best time to do it, among others. Following the
neoclassical theory of the farm production, farmer as a firm is assumed to be a profit
maximizer and he is expected to choose to produce an output with the highest possible
return. However, these production decisions for profit maximization depend on the
conditions farmers are facing such as price of output, availability and cost of land, labour
and non-labour inputs such as fertilizer, pesticide, seeds, etc.
2.2. Concept of Intensification and Expansion
As prices of cocoa go up, the incentive for farm to expand its production is high. One way
that farmers follow is to use more inputs such as fertilizer and pesticide on his existing
farm to improve the condition of the soil as well as its crop in order to increase the
expected yield. This strategy is called intensification. On the other hand, the farmer can
choose to take uncultivated or new area into cultivation in addition to the existing farm.
This strategy is called expansion. Combination of both strategies is expected to give the
highest impact of increasing production level in response to price increase. Effect of
intensification is expected within a short period of time. For example, if the farmer
8
increases the use of fertilizer and pesticide, it is expected that the next harvest would be
good since it could prevent possible disease and will also make crop healthy. This will
make the trees bear more fruit and produce good harvest for the current or upcoming
cropping season. While on the other hand, effect of expansion will take some time since
growing a new cocoa tree takes at least 3 years before it bears fruit and more years to
become fully mature. Effect of intensification on yield may be observed quicker than
expansion.
2.3. Factors that influence farmer’s decision
There are several factors that possibly influence farmer’s decision. Among the factors
are profitability, access to land, access to capital to acquire technology, farmer’s origin,
cost of labour, cost of inputs, and technical know-how. First is profitability or expected
return to cocoa farming. When a farmer sees that the return is higher due to high prices,
(s)he will consider investing into cocoa production, and consider intensification or
expansion depending on how the expected future net benefit would be, otherwise (s)he
may consider looking for alternative crops to grow. Second factor is the access to land in
terms of availability and the degree of control over the land they till affects farmer’s
decision to adopt intensification or expansion. It affects the decision of the farmer to
invest since cocoa is a tree which requires more time and space compared to other cash
crops. When access is just temporary or not secure, a farmer might only follow an
intensification strategy but not expand due to the risk of not benefiting from the
investment if owner were to reclaim the land. In terms of availability, even if the farmer
finds it profitable to invest on cocoa production, there may no more land be available for
growing cocoa, as land becomes scarce with population growing rapidly. The farmer will
only be left with the option of intensification on the land currently cultivated. The same
is true if the price of land would be too high, making it impossible to acquire new land.
The third factor is access to capital. This also affects the decision of the farmer on
whether to do intensification or expansion. If farmer finds that cocoa production is
profitable and access to land is not a problem but (s)he has no or limited access to
capital to acquire inputs that enhance yields like as fertilizer and pesticides, she or he
may consider adopting expansion strategy. Fourth factor is the farmer’s origin. This can
also affect farmer’s decision particularly in Africa where the land rights are found to be
9
strengthened by clearing and tilling the land. This factor influences farmers particularly
migrants to adopt expansion to establish claim over the land (Kolavalli and Vigneri 2011)
and increasing cocoa production becomes secondary objective. Fifth factor is cost of
labour. Intensification increases the need for more labour days. If the cost of labour is
high, farmers may just rely on family labour and since intensification may need more
labour than expansion, there is less scope for intensification compared to expansion
where farmers can just employ family labour. Sixth factor that influences decision of
farmer is the cost of inputs. Even though fertilizer and insecticide increase yield, farmer
may not adopt intensification due to high cost of inputs and may only limit himself in
increasing production though expansion. The seventh factor, technical know-how about
the available technology, also affects the farmer’s decision making. Even when the
abovementioned factors are not a problem but if farmer doesn’t know how to use the
available technology in relation to these, he may still remain expanding land he uses
instead of doing the intensification.
2.4. Opportunities and constraints for intensification and expansion
Opportunities
Planting cocoa trees on new land can be considered an investment and means to some
farmer to strengthen their claim over the land they till and later on to establish land
ownership (Kolavalli and Vigneri 2011). This is common in African countries where
property right is weak. Thus, expansion provides an opportunity for farmers especially
for those who do not own land to strengthen their claims over the land they till. Strong
security of tenure provides farmer to invest on land through use of appropriate
technology and farm techniques that could enhance productivity. Meanwhile
intensification strategy increases yield per hectare and permits to reach the full yield
potential of the crop. In addition, it can address the constraints caused by limited
resources like land and through the use of appropriate technology it can improve soil
fertility. Combination of such strategy, depending on the condition faced by farmer, will
enable them to reach the optimum benefit.
10
Constraints
Both expansion and intensification are strategy to increase production. Most of the
literature found that intensification increased production through increasing yield per
hectare as a result of improved practices while expansion also increase production
through the use of uncultivated or barren area for production and that combination of
these strategies could bring the optimum benefit. However, despite positive association
of these strategies, there are still some farmers who do not use yield enhancing
technology and farm techniques. Meanwhile, the price of, and difficulty to find suitable
area to grow cocoa limits famers to increase production through expansion. Taher
(Taher 1996) discussed some factors that constrain small farmers to move toward cocoa
development. One constraint is their limited spending capacity. Since cocoa is a long-
term investment crop which takes years before it bears fruit, the farmer has limited
capacity to spend money on this. Another constraint he mentioned is income
uncertainty. Since cocoa prices fluctuate depending on policy and world cocoa prices.
This makes farmers uncertain about their income and they can’t take too much risk.
Another constraint that prevents farmers from maximizing production through a
strategy of intensification is the high input prices and limited access to technology due
to high price, lack of capital, remoteness and lack of knowledge.
2.5. The model
In this section, we will discuss the models that will be used to show how much increase
in yield can be attributed to expansion and intensification. We will start by discussing
the dependent and independent variables in the models and what is the expected
relationship. We start using a standard Cobb Douglas production function to show the
yield which is expressed by:
(eq. 1)
Where:
= total kilo of cocoa produced per ha of full production in each year
= total labour (family and hired) used expressed in person-hours
worked per ha of full production in each year
11
= total non-labour inputs used (fertilizer used expressed in a 50-kg
bag and insecticide used expressed in liter) per ha of full
production in each year
A = total factor productivity
The α and β (and possibly more betas for more X variables) represent the output
elasticities of labour and non-labour inputs, respectively. These values are constant and
determined by the available technology. It measures the responsiveness of output with
respect to a one unit change on either labour or non-labour inputs.
Profits ( from selling their harvest are expressed by:
(eq. 2)
where:
= Price of Cocoa Bean per kilo
= Price of non-labour inputs
= wage of labour input used
In order to determine the optimal value of L and X that would give the highest possible
return for farmer, we take the derivatives of profit function (eq. 2).
The more unit of X and L used per area, the higher the Y is expected. Since X and L
increase as increases, the return per area increases through the volume and the price.
Using more land to increase output may also be attractive to farmer as increases.
However, increasing Y through planting new trees in new area entails investment cost
such as additional labour for clearing the land as well a new planting materials and cost
of land if there is. This can be express by: . Assuming that farmer is
a profit maximizer, he will only consider increasing production through expansion if the
expected benefits exceed the costs:
∑
- (eq. 3)
12
Here the summation is over the future life of the trees and
NB = Net benefit (revenue minus cost)
= labour input per ha for clearing new area
= wage of labour input used, discount rate
= Price of planting material used such as seedlings
= quantity of material used per ha
= Price of new area (A) used
In fact, the expected net benefits should also exceed that of other potential investment
projects. We disregard these, as for most farmers subsistence farming is the only
alternative to cocoa. Higher cocoa prices thus induce greater use of inputs. At given
prices, the incentive to take new land into cultivation depends on how the current prices
are translated into (expected) future price. If these expectations are not affected, higher
cocoa prices will not lead to more new planting. In some case, higher prices may even
discourage expansion, as the increased demand for labour may lead to higher wages.
These higher wages make investments in new plantations, which typically are very
labour-intensive, more expensive. The other side of the coin is that lower cocoa prices
may induce more new planting.
13
CHAPTER 3
3. Methodology
The study aims to investigate the factors that influenced the decision to adopt extensive
or intensive way of increasing production given the price of cocoa, availability of labour
(family and hired), land, and non-labour (fertilizer and pesticide) inputs. Specifically,
this study would like to establish which factor contributed most and assess which
strategy is more rewarding in the conditions in which the farmers find themselves. This
section discusses the general methodology to achieve these objectives. The general
methodology includes description of the study area, data source and data selection, and
data analysis.
3.1. Description of study area
This study will cover three regions in Ghana namely: Western, Ashanti, and Brong Ahafo.
These are the regions where the secondary data to be used in this research were
collected. Short description of the three regions is given below.
Ashanti Region
Ashanti Region is located in the middle belt of Ghana and shares boundaries with four of
the ten political regions, Brong-Ahafo in the north, Eastern region in the east, Central
region in the south and Western region in the south west. It has a total land area of
24,389 square kilometres and the third largest region of the country (10 %). As of 2010
census (______ 2012), the region has a population of 4,725,046 with population density of
194 persons per square kilometre, the third after Greater Accra and Central Regions.
More than half of the region lies within the wet, semi-equatorial forest zone. Due to
human activities and bushfires, the forest vegetation of parts of the region, particularly
the north-eastern part, has been reduced to savannah. The region is endowed with a
spectacular geography: lakes, scarps, forest reserves, waterfalls, national parks, birds
and wildlife sanctuaries.
14
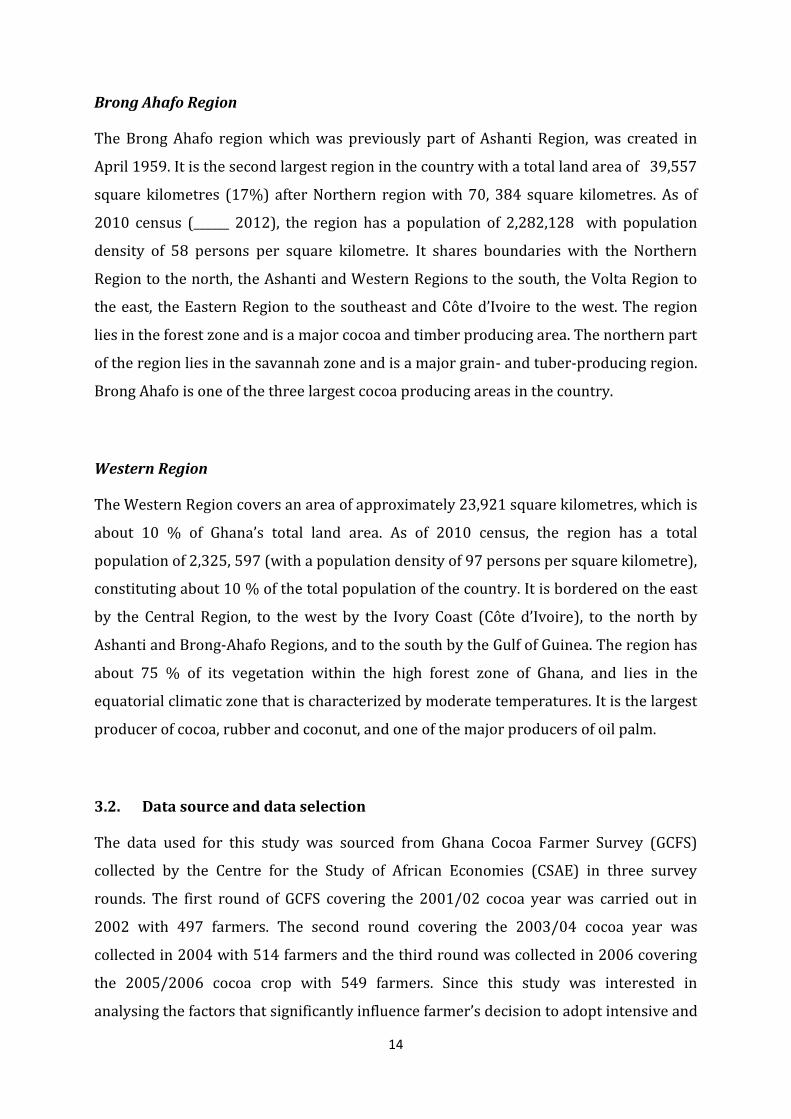
Brong Ahafo Region
The Brong Ahafo region which was previously part of Ashanti Region, was created in
April 1959. It is the second largest region in the country with a total land area of 39,557
square kilometres (17%) after Northern region with 70, 384 square kilometres. As of
2010 census (______ 2012), the region has a population of 2,282,128 with population
density of 58 persons per square kilometre. It shares boundaries with the Northern
Region to the north, the Ashanti and Western Regions to the south, the Volta Region to
the east, the Eastern Region to the southeast and Côte d’Ivoire to the west. The region
lies in the forest zone and is a major cocoa and timber producing area. The northern part
of the region lies in the savannah zone and is a major grain- and tuber-producing region.
Brong Ahafo is one of the three largest cocoa producing areas in the country.
Western Region
The Western Region covers an area of approximately 23,921 square kilometres, which is
about 10 % of Ghana’s total land area. As of 2010 census, the region has a total
population of 2,325, 597 (with a population density of 97 persons per square kilometre),
constituting about 10 % of the total population of the country. It is bordered on the east
by the Central Region, to the west by the Ivory Coast (Côte d’Ivoire), to the north by
Ashanti and Brong-Ahafo Regions, and to the south by the Gulf of Guinea. The region has
about 75 % of its vegetation within the high forest zone of Ghana, and lies in the
equatorial climatic zone that is characterized by moderate temperatures. It is the largest
producer of cocoa, rubber and coconut, and one of the major producers of oil palm.
3.2. Data source and data selection
The data used for this study was sourced from Ghana Cocoa Farmer Survey (GCFS)
collected by the Centre for the Study of African Economies (CSAE) in three survey
rounds. The first round of GCFS covering the 2001/02 cocoa year was carried out in
2002 with 497 farmers. The second round covering the 2003/04 cocoa year was
collected in 2004 with 514 farmers and the third round was collected in 2006 covering
the 2005/2006 cocoa crop with 549 farmers. Since this study was interested in
analysing the factors that significantly influence farmer’s decision to adopt intensive and
15
extensive strategy to increase production, two criteria were used in selecting farmers to
be included: (a) select only farmer that was present in all survey rounds and (b) has
complete information on the main variables such as number of hectare of cocoa farm
used and no of kilos of cocoa production. Only farmers who met these conditions were
included to form a balanced panel.
To be able to analyse the factors influencing farmer’s decision to adopt intensification
and expansion to increase production, the analysis focused the extent to which farmers
changed their input application and cocoa farm size from 2002 to 2004 and from 2004
to 2006. The farmers were grouped in three:
Group 1: farmers who did increase, decrease, remain constant in terms of cocoa
farm used; and,
Group 2: farmers who did increase, decrease, remain constant in terms of
fertilizer application.
Group 3: farmers who did increase, decrease, remain constant in terms of
insecticide application.
The change in area planted with cocoa and change in input used (fertilizer and
insecticide) per ha from 2002 to 2004 and from 2004 to 2006 were calculated. For
group 1, the difference between the size of cocoa farm used between 2002 and 2004,
and between 2004 and 2006 were computed. Then the farmers were grouped in those
that increased, decreased, and remained constant. Similarly for fertilizer use, and
insecticide use.
After farmers were selected and assigned into two groups, other variables (aside from
cocoa production and cocoa farm) were directly extracted or calculated using data from
the survey. The variables directly extracted include: fertilizer use, insecticide use, farmer
labour days, hired labour days, and farmer’s characteristic such as age, gender, civil
status, employment, education, and region. Meanwhile variables that were calculated
include: farm size, age of cocoa farm, portion of cocoa land with various ages of trees
(too young and too old to produce trees and mature).
16
3.3. Data Analysis
To be able answer the research questions mentioned above and eventually achieve the
research objectives, the following steps were carried out. First, descriptive analysis was
carried out to have an overview of production pattern among cocoa farmers and related
other variables based from 2002, 2004, and 2006 panel data. Variables observed include:
cocoa harvested, percent of farm owned, cocoa price, farm size, % of farm owned, area
planted with cocoa trees (cocoa farm), yield per ha, % of cocoa farm with mature trees,
percent of farmers using fertilizer, fertilizer used per ha, percent of farmer using
insecticide, insecticides used per ha, and labour used per ha. Then, using the two groups
identified earlier, attributes of farmers for each group were analysed.
To determine the factors that significantly influence farmer’s decision to adopt intensive
and extensive way of increasing production, the regression using Ordinary Least Square
method and cross-sectional regression were used for each farmers group category
mentioned earlier. The study used changes in values from period 2002 to 2004 and
period 2004 to 2006 for area expansion, fertilizer and insecticide intensification as the
dependent variables. Meanwhile the independent variables used include: household size
(hhsize), farmer’s origin (hhmigrant), size of cocoa farm, percentage of cocoa farm with
mature trees, yield, and dummy variable for regions (Ashanti, Brong Ahafo, and
Western).
Then, the study analyse the relationship of yield with the use of fertilizer, insecticide, in
addition to the variables mentioned above by running pooled OLS, fixed-effect and
random-effect regressions using panel data with the end goal of determining relationship
of farmer’s decision towards extension and/or intensification in relation to increasing
cocoa production. All 379 farmers present in all surveys were initially shortlisted but then
reduced to 356 farmers due to missing information on area planted in some. As cited in
most econometric book, important feature of panel data analysis is that it can control for
individual heterogeneity and thereby give more accurate estimates of the effect of
independent variables on dependent variable. The study focused on the two techniques to
analyse the panel data. These are the random-effect model (RE) and the fixed-effect model
(FE). Hausman test was applied to determine which model gives the efficient estimates.
17
Four relationships were estimated using regression. First regression was carried out to
analyse the relationship of yield with the use of fertilizer, insecticide, labour, and
percentage share of cocoa farm planted with mature trees. Next, the study analysed the
relationship of the change in cocoa land with the original farm size, percentage of farm
owned, age, gender, education, access to credit, farmers’ status origin. Similar regressions
were done for changes in fertilizer and insecticide use.
18
CHAPTER 4
4. Results and Discussion
This chapter presents and discusses the results of carrying out the methodology
described in Chapter 3.
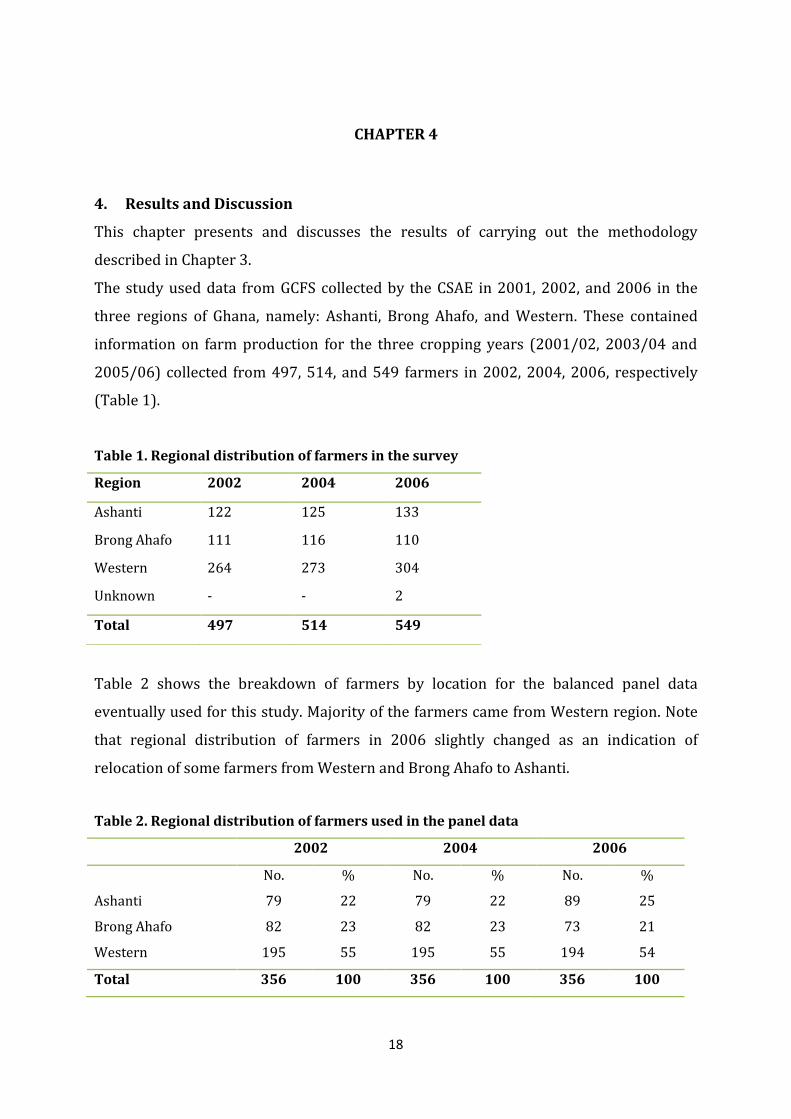
The study used data from GCFS collected by the CSAE in 2001, 2002, and 2006 in the
three regions of Ghana, namely: Ashanti, Brong Ahafo, and Western. These contained
information on farm production for the three cropping years (2001/02, 2003/04 and
2005/06) collected from 497, 514, and 549 farmers in 2002, 2004, 2006, respectively
(Table 1).
Table 1. Regional distribution of farmers in the survey
Table 2 shows the breakdown of farmers by location for the balanced panel data
eventually used for this study. Majority of the farmers came from Western region. Note
that regional distribution of farmers in 2006 slightly changed as an indication of
relocation of some farmers from Western and Brong Ahafo to Ashanti.
Table 2. Regional distribution of farmers used in the panel data
2002 2004 2006
No. % No. % No. %
Ashanti 79 22 79 22 89 25
Brong Ahafo 82 23 82 23 73 21
Western 195 55 195 55 194 54
Total 356 100 356 100 356 100
Region 2002 2004 2006
Ashanti 122 125 133
Brong Ahafo 111 116 110
Western 264 273 304
Unknown - - 2
Total 497 514 549
19
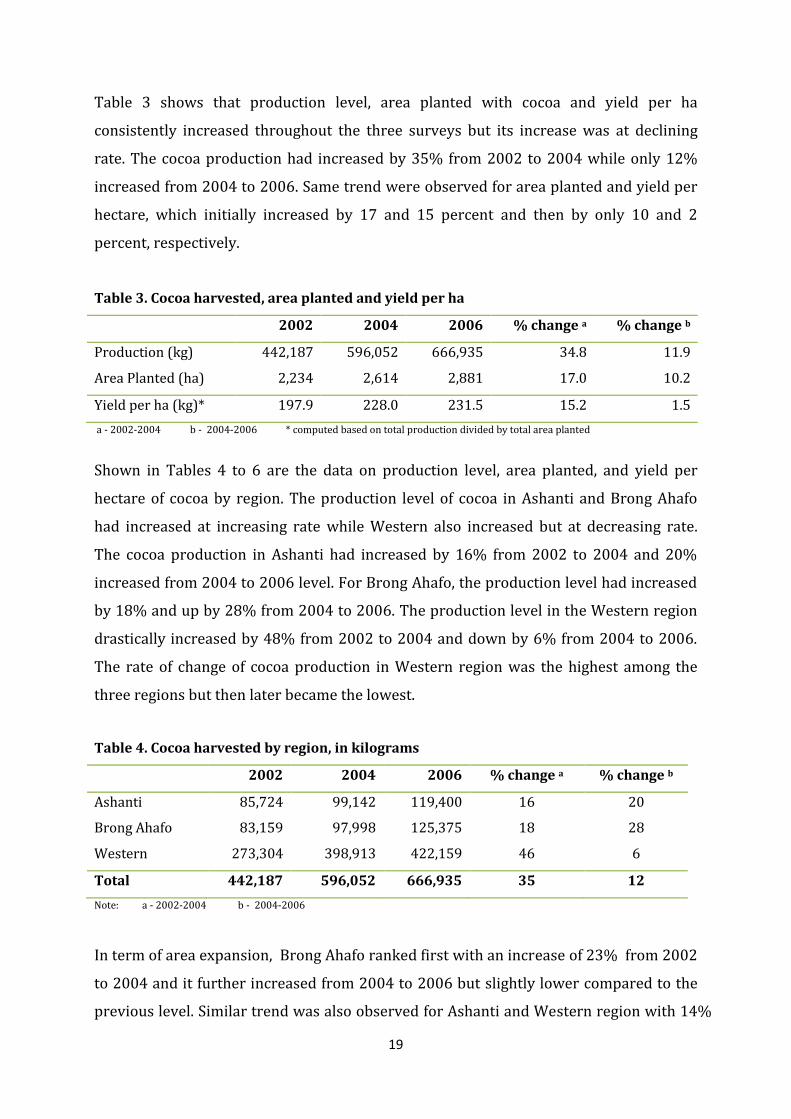
Table 3 shows that production level, area planted with cocoa and yield per ha
consistently increased throughout the three surveys but its increase was at declining
rate. The cocoa production had increased by 35% from 2002 to 2004 while only 12%
increased from 2004 to 2006. Same trend were observed for area planted and yield per
hectare, which initially increased by 17 and 15 percent and then by only 10 and 2
percent, respectively.
Table 3. Cocoa harvested, area planted and yield per ha
2002 2004 2006 % change a % change b
Production (kg) 442,187 596,052 666,935 34.8 11.9
Area Planted (ha) 2,234 2,614 2,881 17.0 10.2
Yield per ha (kg)* 197.9 228.0 231.5 15.2 1.5
a - 2002-2004 b - 2004-2006 * computed based on total production divided by total area planted
Shown in Tables 4 to 6 are the data on production level, area planted, and yield per
hectare of cocoa by region. The production level of cocoa in Ashanti and Brong Ahafo
had increased at increasing rate while Western also increased but at decreasing rate.
The cocoa production in Ashanti had increased by 16% from 2002 to 2004 and 20%
increased from 2004 to 2006 level. For Brong Ahafo, the production level had increased
by 18% and up by 28% from 2004 to 2006. The production level in the Western region
drastically increased by 48% from 2002 to 2004 and down by 6% from 2004 to 2006.
The rate of change of cocoa production in Western region was the highest among the
three regions but then later became the lowest.
Table 4. Cocoa harvested by region, in kilograms
2002 2004 2006 % change a % change b
Ashanti 85,724 99,142 119,400 16 20
Brong Ahafo 83,159 97,998 125,375 18 28
Western 273,304 398,913 422,159 46 6
Total 442,187 596,052 666,935 35 12
Note: a - 2002-2004 b - 2004-2006
In term of area expansion, Brong Ahafo ranked first with an increase of 23% from 2002
to 2004 and it further increased from 2004 to 2006 but slightly lower compared to the
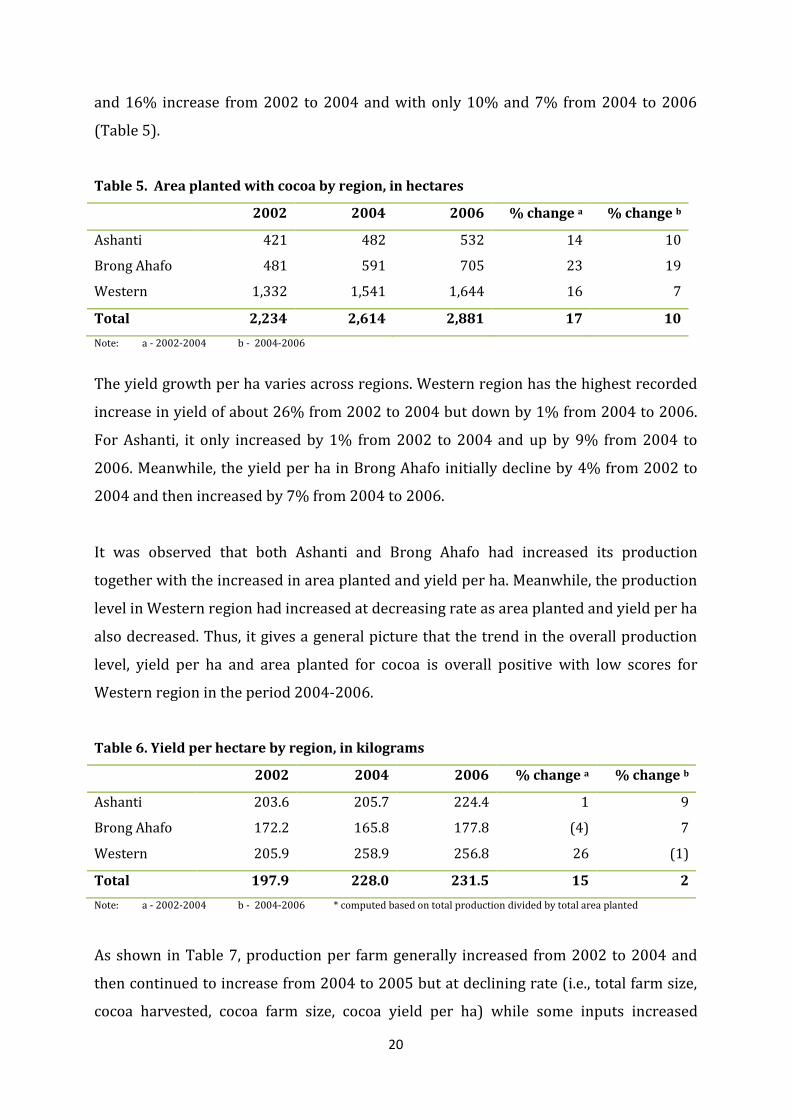
previous level. Similar trend was also observed for Ashanti and Western region with 14%
20
and 16% increase from 2002 to 2004 and with only 10% and 7% from 2004 to 2006
(Table 5).
Table 5. Area planted with cocoa by region, in hectares
2002 2004 2006 % change a % change b
Ashanti 421 482 532 14 10
Brong Ahafo 481 591 705 23 19
Western 1,332 1,541 1,644 16 7
Total 2,234 2,614 2,881 17 10
Note: a - 2002-2004 b - 2004-2006
The yield growth per ha varies across regions. Western region has the highest recorded
increase in yield of about 26% from 2002 to 2004 but down by 1% from 2004 to 2006.
For Ashanti, it only increased by 1% from 2002 to 2004 and up by 9% from 2004 to
2006. Meanwhile, the yield per ha in Brong Ahafo initially decline by 4% from 2002 to
2004 and then increased by 7% from 2004 to 2006.
It was observed that both Ashanti and Brong Ahafo had increased its production
together with the increased in area planted and yield per ha. Meanwhile, the production
level in Western region had increased at decreasing rate as area planted and yield per ha
also decreased. Thus, it gives a general picture that the trend in the overall production
level, yield per ha and area planted for cocoa is overall positive with low scores for
Western region in the period 2004-2006.
Table 6. Yield per hectare by region, in kilograms
2002 2004 2006 % change a % change b
Ashanti 203.6 205.7 224.4 1 9
Brong Ahafo 172.2 165.8 177.8 (4) 7
Western 205.9 258.9 256.8 26 (1)
Total 197.9 228.0 231.5 15 2
Note: a - 2002-2004 b - 2004-2006 * computed based on total production divided by total area planted
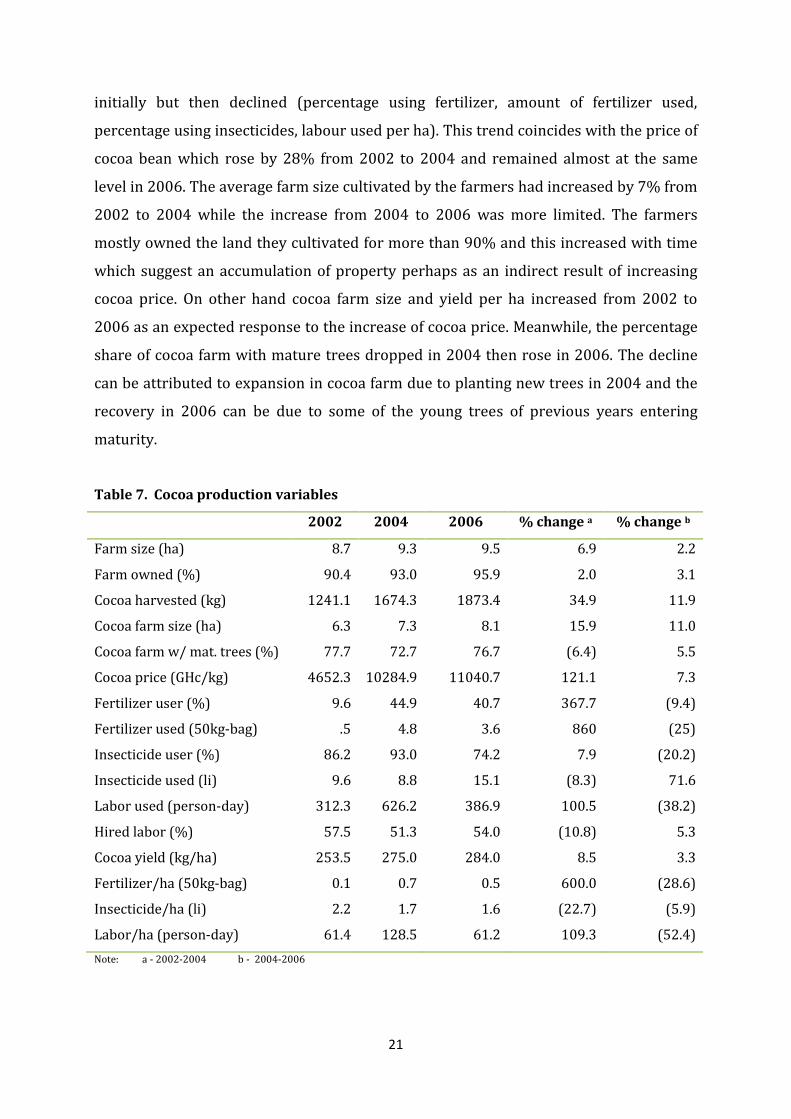
As shown in Table 7, production per farm generally increased from 2002 to 2004 and
then continued to increase from 2004 to 2005 but at declining rate (i.e., total farm size,
cocoa harvested, cocoa farm size, cocoa yield per ha) while some inputs increased
21
initially but then declined (percentage using fertilizer, amount of fertilizer used,
percentage using insecticides, labour used per ha). This trend coincides with the price of
cocoa bean which rose by 28% from 2002 to 2004 and remained almost at the same
level in 2006. The average farm size cultivated by the farmers had increased by 7% from
2002 to 2004 while the increase from 2004 to 2006 was more limited. The farmers
mostly owned the land they cultivated for more than 90% and this increased with time
which suggest an accumulation of property perhaps as an indirect result of increasing
cocoa price. On other hand cocoa farm size and yield per ha increased from 2002 to
2006 as an expected response to the increase of cocoa price. Meanwhile, the percentage
share of cocoa farm with mature trees dropped in 2004 then rose in 2006. The decline
can be attributed to expansion in cocoa farm due to planting new trees in 2004 and the
recovery in 2006 can be due to some of the young trees of previous years entering
maturity.
Table 7. Cocoa production variables
2002 2004 2006 % change a % change b
Farm size (ha) 8.7 9.3 9.5 6.9 2.2
Farm owned (%) 90.4 93.0 95.9 2.0 3.1
Cocoa harvested (kg) 1241.1 1674.3 1873.4 34.9 11.9
Cocoa farm size (ha) 6.3 7.3 8.1 15.9 11.0
Cocoa farm w/ mat. trees (%) 77.7 72.7 76.7 (6.4) 5.5
Cocoa price (GHc/kg) 4652.3 10284.9 11040.7 121.1 7.3
Fertilizer user (%) 9.6 44.9 40.7 367.7 (9.4)
Fertilizer used (50kg-bag) .5 4.8 3.6 860 (25)
Insecticide user (%) 86.2 93.0 74.2 7.9 (20.2)
Insecticide used (li) 9.6 8.8 15.1 (8.3) 71.6
Labor used (person-day) 312.3 626.2 386.9 100.5 (38.2)
Hired labor (%) 57.5 51.3 54.0 (10.8) 5.3
Cocoa yield (kg/ha) 253.5 275.0 284.0 8.5 3.3
Fertilizer/ha (50kg-bag) 0.1 0.7 0.5 600.0 (28.6)
Insecticide/ha (li) 2.2 1.7 1.6 (22.7) (5.9)
Labor/ha (person-day) 61.4 128.5 61.2 109.3 (52.4)
Note: a - 2002-2004 b - 2004-2006
22
The percentage share of farmers who used fertilizer remarkably increased from 2002 to
2004 and dropped by 9% from 2004 to 2006 while the amount used per ha increased
more than 800 fold then went down by 25%. The same trend was also observed for
insecticide. The number of farmers who used insecticides slightly increased from 2002
to 2004 then declined from 2004 to 2006. Percentage share of family, paid and exchange
labour to the total labour used did not show much variation. The main source of labour
came from paid and family labour and only a small percentage came from exchange
labour.
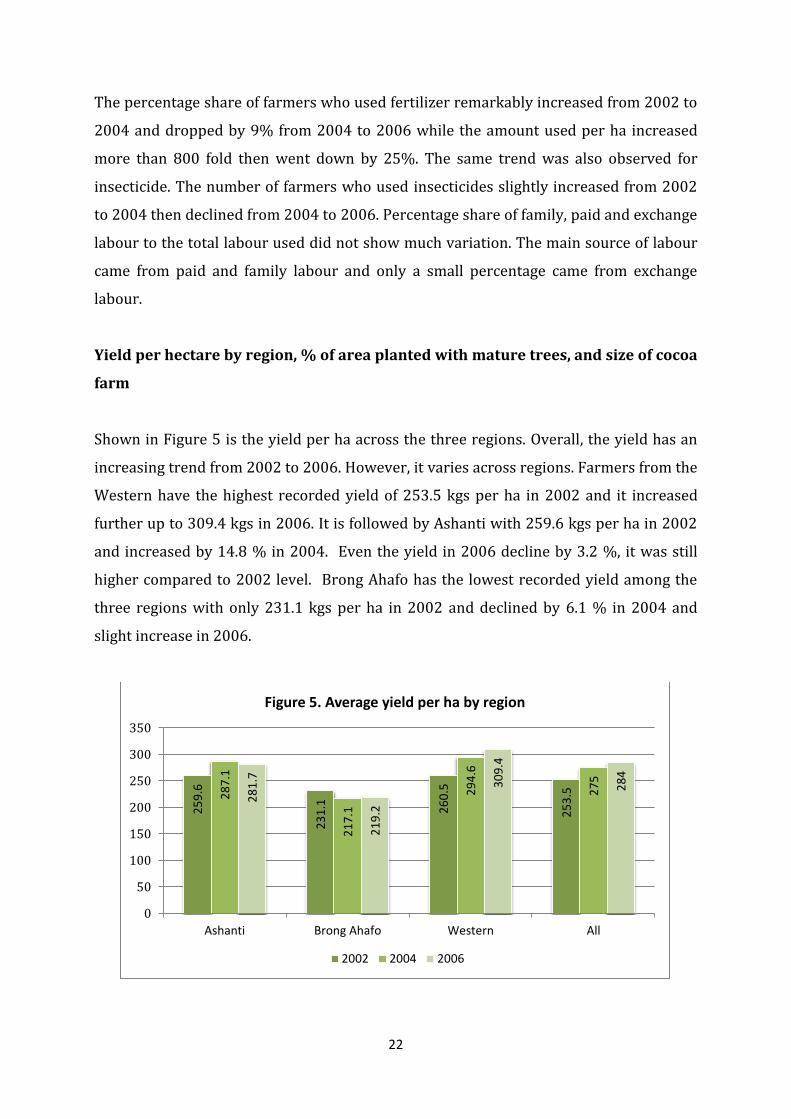
Yield per hectare by region, % of area planted with mature trees, and size of cocoa
farm
Shown in Figure 5 is the yield per ha across the three regions. Overall, the yield has an
increasing trend from 2002 to 2006. However, it varies across regions. Farmers from the
Western have the highest recorded yield of 253.5 kgs per ha in 2002 and it increased
further up to 309.4 kgs in 2006. It is followed by Ashanti with 259.6 kgs per ha in 2002
and increased by 14.8 % in 2004. Even the yield in 2006 decline by 3.2 %, it was still
higher compared to 2002 level. Brong Ahafo has the lowest recorded yield among the
three regions with only 231.1 kgs per ha in 2002 and declined by 6.1 % in 2004 and
slight increase in 2006.
25
9.6
23
1.1
26
0.5
25
3.5
28
7.1
21
7.1
29
4.6
27
5
28
1.7
21
9.2
30
9.4
28
4
0
50
100
150
200
250
300
350
Ashanti Brong Ahafo Western All
Figure 5. Average yield per ha by region
2002 2004 2006
23
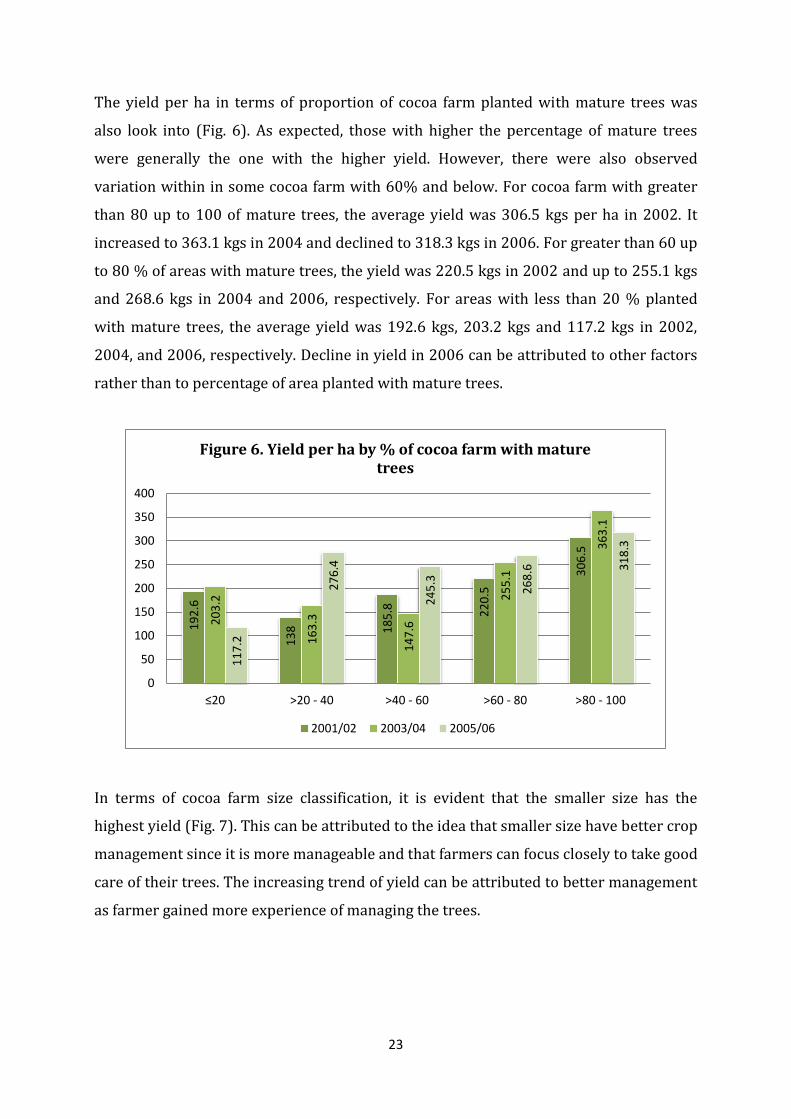
The yield per ha in terms of proportion of cocoa farm planted with mature trees was
also look into (Fig. 6). As expected, those with higher the percentage of mature trees
were generally the one with the higher yield. However, there were also observed
variation within in some cocoa farm with 60% and below. For cocoa farm with greater
than 80 up to 100 of mature trees, the average yield was 306.5 kgs per ha in 2002. It
increased to 363.1 kgs in 2004 and declined to 318.3 kgs in 2006. For greater than 60 up
to 80 % of areas with mature trees, the yield was 220.5 kgs in 2002 and up to 255.1 kgs
and 268.6 kgs in 2004 and 2006, respectively. For areas with less than 20 % planted
with mature trees, the average yield was 192.6 kgs, 203.2 kgs and 117.2 kgs in 2002,
2004, and 2006, respectively. Decline in yield in 2006 can be attributed to other factors
rather than to percentage of area planted with mature trees.
In terms of cocoa farm size classification, it is evident that the smaller size has the
highest yield (Fig. 7). This can be attributed to the idea that smaller size have better crop
management since it is more manageable and that farmers can focus closely to take good
care of their trees. The increasing trend of yield can be attributed to better management
as farmer gained more experience of managing the trees.
19
2.6
13
8
18
5.8
22
0.5
30
6.5
20
3.2
16
3.3
14
7.6
25
5.1
36
3.1
11
7.2
27
6.4
24
5.3
26
8.6
31
8.3
0
50
100
150
200
250
300
350
400
≤20 >20 - 40 >40 - 60 >60 - 80 >80 - 100
Figure 6. Yield per ha by % of cocoa farm with mature trees
2001/02 2003/04 2005/06
24
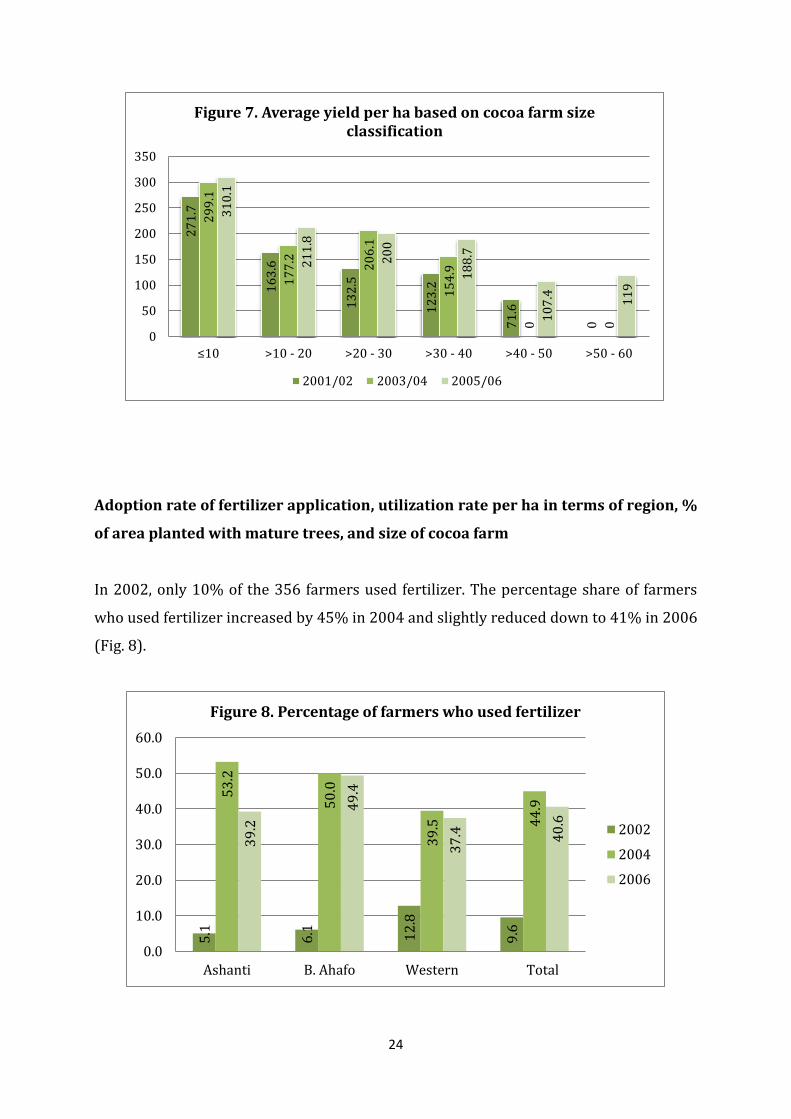
Adoption rate of fertilizer application, utilization rate per ha in terms of region, %
of area planted with mature trees, and size of cocoa farm
In 2002, only 10% of the 356 farmers used fertilizer. The percentage share of farmers
who used fertilizer increased by 45% in 2004 and slightly reduced down to 41% in 2006
(Fig. 8).
27
1.7
16
3.6
13
2.5
12
3.2
71
.6
0
29
9.1
17
7.2
20
6.1
15
4.9
0
0
31
0.1
21
1.8
20
0
18
8.7
10
7.4
11
9
0
50
100
150
200
250
300
350
≤10 >10 - 20 >20 - 30 >30 - 40 >40 - 50 >50 - 60
Figure 7. Average yield per ha based on cocoa farm size classification
2001/02 2003/04 2005/06
5.1
6.1
12
.8
9.6
53
.2
50
.0
39
.5
44
.9
39
.2
49
.4
37
.4
40
.6
0.0
10.0
20.0
30.0
40.0
50.0
60.0
Ashanti B. Ahafo Western Total
Figure 8. Percentage of farmers who used fertilizer
2002
2004
2006
25
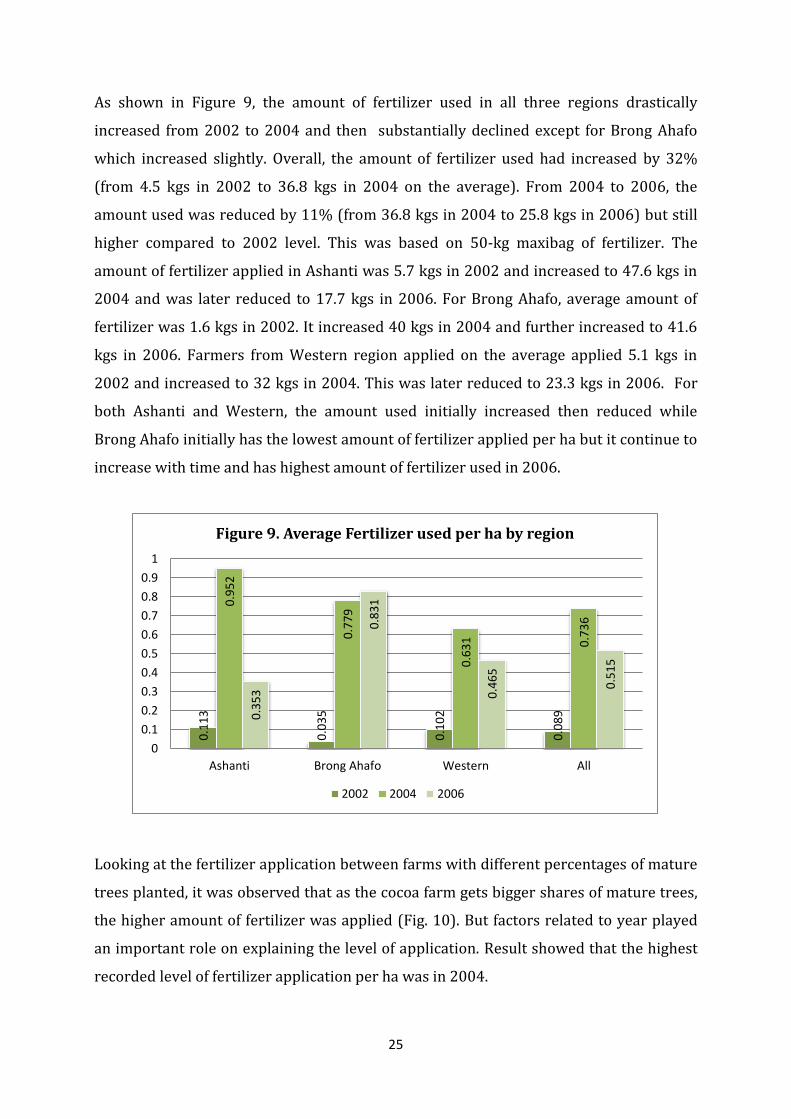
As shown in Figure 9, the amount of fertilizer used in all three regions drastically
increased from 2002 to 2004 and then substantially declined except for Brong Ahafo
which increased slightly. Overall, the amount of fertilizer used had increased by 32%
(from 4.5 kgs in 2002 to 36.8 kgs in 2004 on the average). From 2004 to 2006, the
amount used was reduced by 11% (from 36.8 kgs in 2004 to 25.8 kgs in 2006) but still
higher compared to 2002 level. This was based on 50-kg maxibag of fertilizer. The
amount of fertilizer applied in Ashanti was 5.7 kgs in 2002 and increased to 47.6 kgs in
2004 and was later reduced to 17.7 kgs in 2006. For Brong Ahafo, average amount of
fertilizer was 1.6 kgs in 2002. It increased 40 kgs in 2004 and further increased to 41.6
kgs in 2006. Farmers from Western region applied on the average applied 5.1 kgs in
2002 and increased to 32 kgs in 2004. This was later reduced to 23.3 kgs in 2006. For
both Ashanti and Western, the amount used initially increased then reduced while
Brong Ahafo initially has the lowest amount of fertilizer applied per ha but it continue to
increase with time and has highest amount of fertilizer used in 2006.
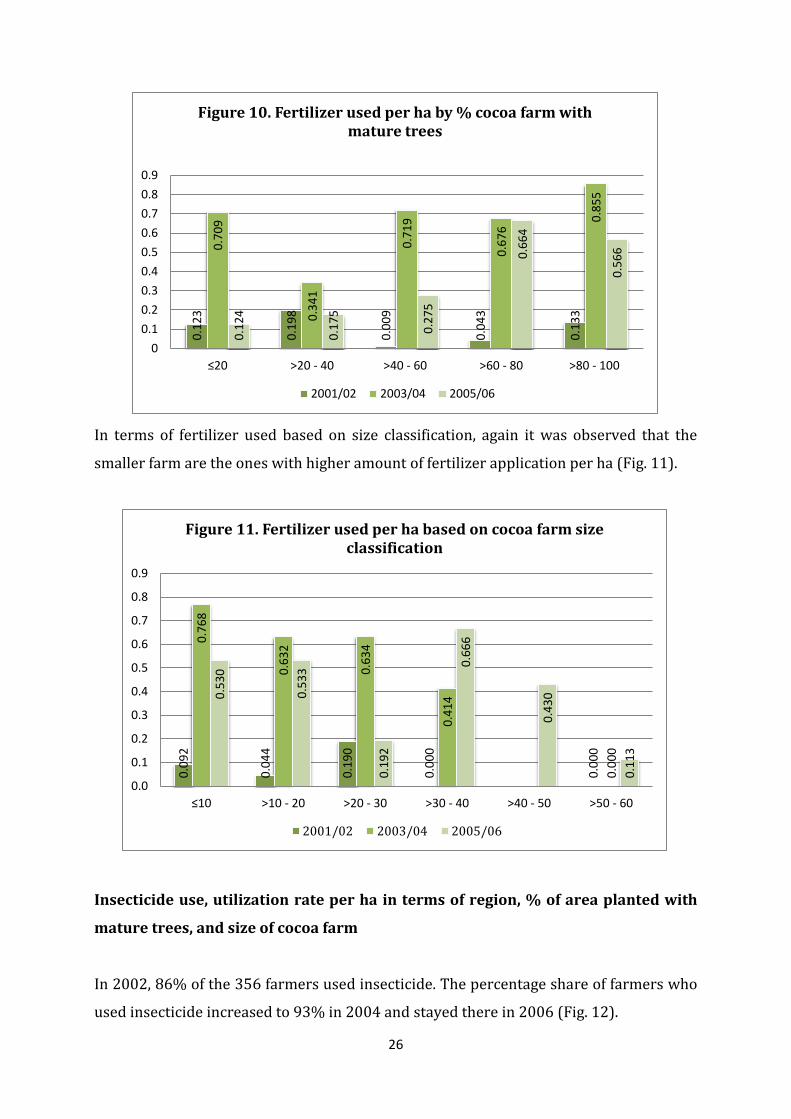
Looking at the fertilizer application between farms with different percentages of mature
trees planted, it was observed that as the cocoa farm gets bigger shares of mature trees,
the higher amount of fertilizer was applied (Fig. 10). But factors related to year played
an important role on explaining the level of application. Result showed that the highest
recorded level of fertilizer application per ha was in 2004.
0.1
13
0.0
35
0.1
02
0.0
89
0.9
52
0.7
79
0.6
31
0.7
36
0.3
53
0.8
31
0.4
65
0.5
15
0
0.1
0.2
0.3
0.4
0.5
0.6
0.7
0.8
0.9
1
Ashanti Brong Ahafo Western All
Figure 9. Average Fertilizer used per ha by region
2002 2004 2006
26
In terms of fertilizer used based on size classification, again it was observed that the
smaller farm are the ones with higher amount of fertilizer application per ha (Fig. 11).
Insecticide use, utilization rate per ha in terms of region, % of area planted with
mature trees, and size of cocoa farm
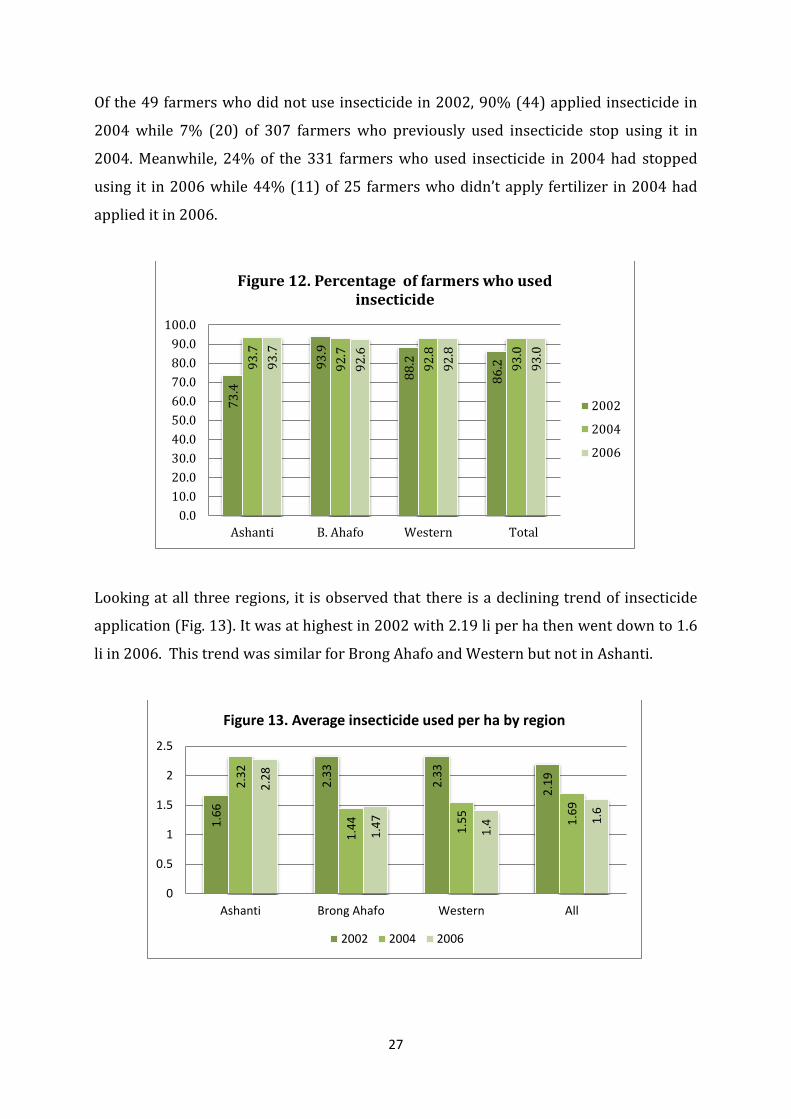
In 2002, 86% of the 356 farmers used insecticide. The percentage share of farmers who
used insecticide increased to 93% in 2004 and stayed there in 2006 (Fig. 12).
0.1
23
0.1
98
0.0
09
0.0
43
0.1
33
0.7
09
0.3
41
0.7
19
0.6
76
0.8
55
0.1
24
0.1
75
0.2
75
0.6
64
0.5
66
0
0.1
0.2
0.3
0.4
0.5
0.6
0.7
0.8
0.9
≤20 >20 - 40 >40 - 60 >60 - 80 >80 - 100
Figure 10. Fertilizer used per ha by % cocoa farm with mature trees
2001/02 2003/04 2005/06
0.0
92
0.0
44
0.1
90
0.0
00
0.0
00
0.7
68
0.6
32
0.6
34
0.4
14
0.0
00
0.5
30
0.5
33
0.1
92
0.6
66
0.4
30
0.1
13
0.0
0.1
0.2
0.3
0.4
0.5
0.6
0.7
0.8
0.9
≤10 >10 - 20 >20 - 30 >30 - 40 >40 - 50 >50 - 60
Figure 11. Fertilizer used per ha based on cocoa farm size classification
2001/02 2003/04 2005/06
27
Of the 49 farmers who did not use insecticide in 2002, 90% (44) applied insecticide in
2004 while 7% (20) of 307 farmers who previously used insecticide stop using it in
2004. Meanwhile, 24% of the 331 farmers who used insecticide in 2004 had stopped
using it in 2006 while 44% (11) of 25 farmers who didn’t apply fertilizer in 2004 had
applied it in 2006.
Looking at all three regions, it is observed that there is a declining trend of insecticide
application (Fig. 13). It was at highest in 2002 with 2.19 li per ha then went down to 1.6
li in 2006. This trend was similar for Brong Ahafo and Western but not in Ashanti.
73
.4
93
.9
88
.2
86
.2
93
.7
92
.7
92
.8
93
.0
93
.7
92
.6
92
.8
93
.0
0.0
10.0
20.0
30.0
40.0
50.0
60.0
70.0
80.0
90.0
100.0
Ashanti B. Ahafo Western Total
Figure 12. Percentage of farmers who used insecticide
2002
2004
2006
1.6
6
2.3
3
2.3
3
2.1
9
2.3
2
1.4
4
1.5
5
1.6
9
2.2
8
1.4
7
1.4
1.6
0
0.5
1
1.5
2
2.5
Ashanti Brong Ahafo Western All
Figure 13. Average insecticide used per ha by region
2002 2004 2006
28
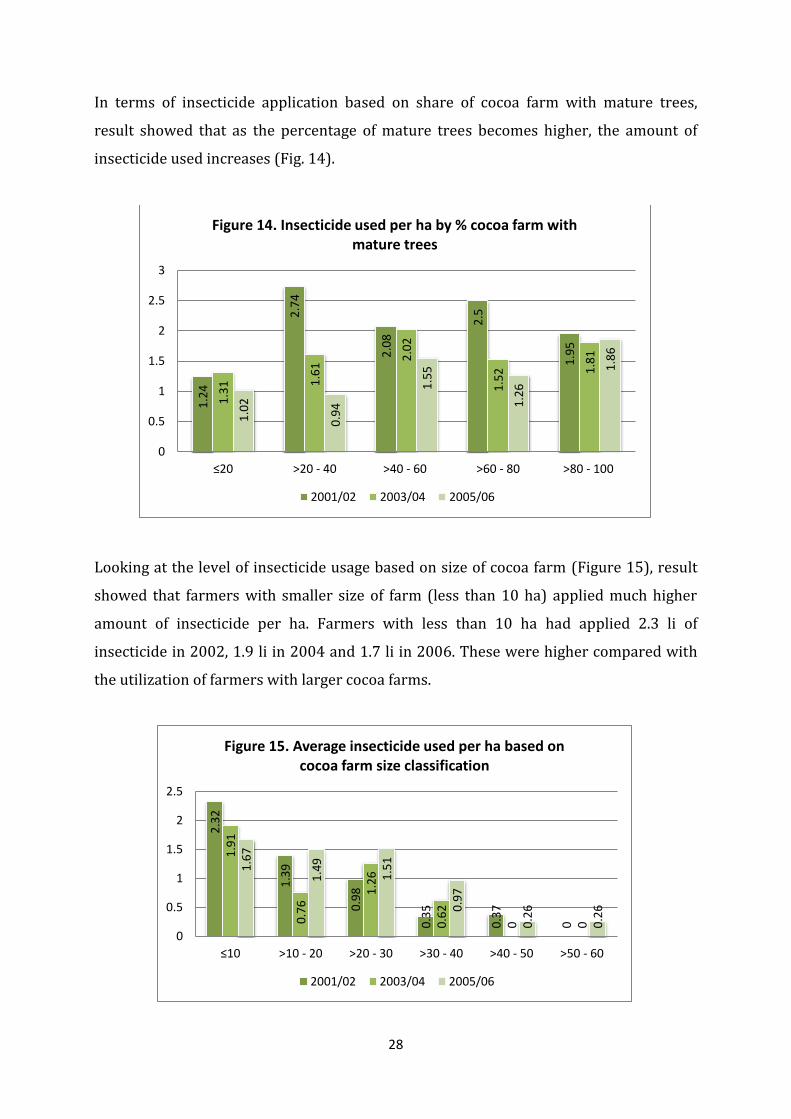
In terms of insecticide application based on share of cocoa farm with mature trees,
result showed that as the percentage of mature trees becomes higher, the amount of
insecticide used increases (Fig. 14).
Looking at the level of insecticide usage based on size of cocoa farm (Figure 15), result
showed that farmers with smaller size of farm (less than 10 ha) applied much higher
amount of insecticide per ha. Farmers with less than 10 ha had applied 2.3 li of
insecticide in 2002, 1.9 li in 2004 and 1.7 li in 2006. These were higher compared with
the utilization of farmers with larger cocoa farms.
1.2
4
2.7
4
2.0
8
2.5
1.9
5
1.3
1 1.6
1 2
.02
1.5
2 1.8
1
1.0
2
0.9
4
1.5
5
1.2
6
1.8
6
0
0.5
1
1.5
2
2.5
3
≤20 >20 - 40 >40 - 60 >60 - 80 >80 - 100
Figure 14. Insecticide used per ha by % cocoa farm with mature trees
2001/02 2003/04 2005/06
2.3
2
1.3
9
0.9
8
0.3
5
0.3
7
0
1.9
1
0.7
6 1
.26
0.6
2
0
0
1.6
7
1.4
9
1.5
1
0.9
7
0.2
6
0.2
6
0
0.5
1
1.5
2
2.5
≤10 >10 - 20 >20 - 30 >30 - 40 >40 - 50 >50 - 60
Figure 15. Average insecticide used per ha based on cocoa farm size classification
2001/02 2003/04 2005/06
29
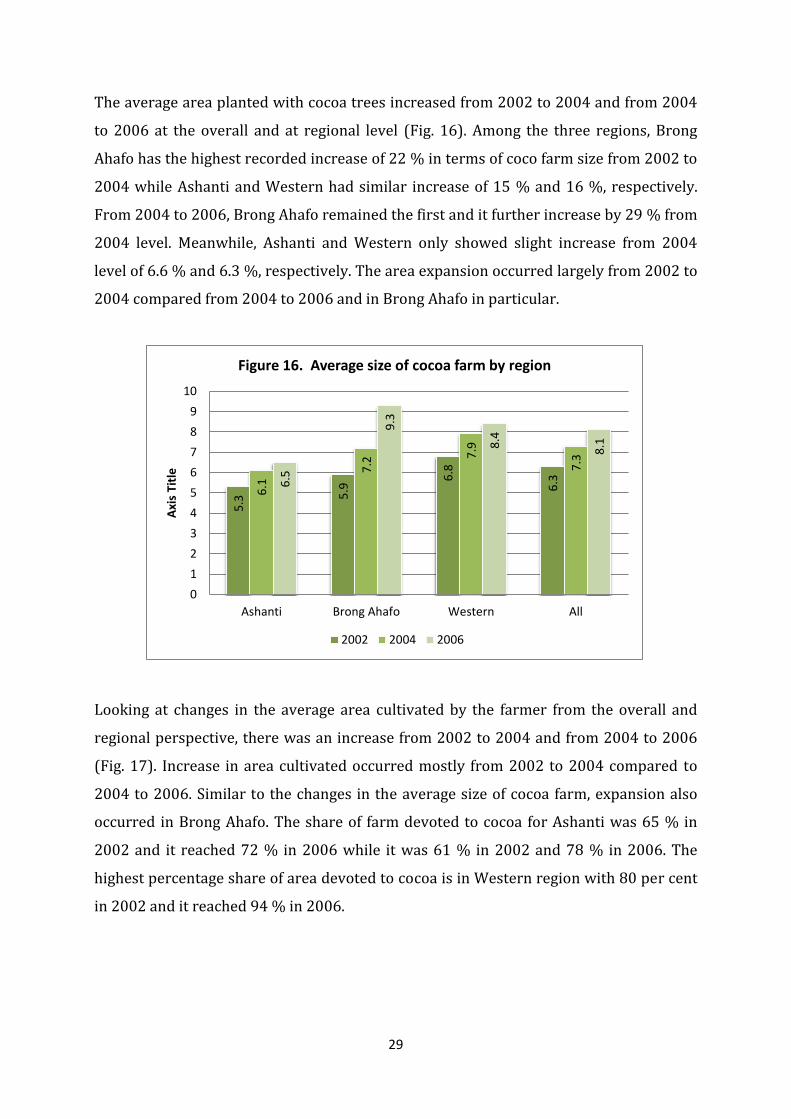
The average area planted with cocoa trees increased from 2002 to 2004 and from 2004
to 2006 at the overall and at regional level (Fig. 16). Among the three regions, Brong
Ahafo has the highest recorded increase of 22 % in terms of coco farm size from 2002 to
2004 while Ashanti and Western had similar increase of 15 % and 16 %, respectively.
From 2004 to 2006, Brong Ahafo remained the first and it further increase by 29 % from
2004 level. Meanwhile, Ashanti and Western only showed slight increase from 2004
level of 6.6 % and 6.3 %, respectively. The area expansion occurred largely from 2002 to
2004 compared from 2004 to 2006 and in Brong Ahafo in particular.
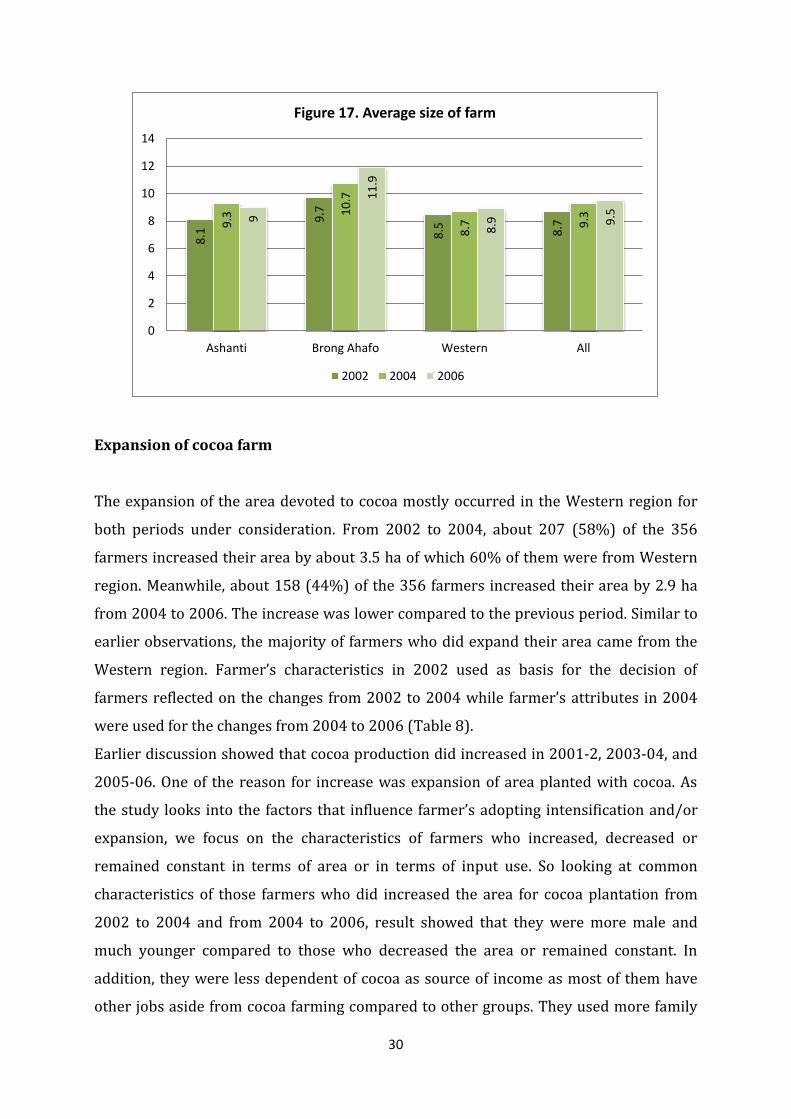
Looking at changes in the average area cultivated by the farmer from the overall and
regional perspective, there was an increase from 2002 to 2004 and from 2004 to 2006
(Fig. 17). Increase in area cultivated occurred mostly from 2002 to 2004 compared to
2004 to 2006. Similar to the changes in the average size of cocoa farm, expansion also
occurred in Brong Ahafo. The share of farm devoted to cocoa for Ashanti was 65 % in
2002 and it reached 72 % in 2006 while it was 61 % in 2002 and 78 % in 2006. The
highest percentage share of area devoted to cocoa is in Western region with 80 per cent
in 2002 and it reached 94 % in 2006.
5.3
5.9
6.8
6.3
6.1
7.2
7.9
7.3
6.5
9.3
8.4
8.1
0
1
2
3
4
5
6
7
8
9
10
Ashanti Brong Ahafo Western All
Axi
s Ti
tle
Figure 16. Average size of cocoa farm by region
2002 2004 2006
30
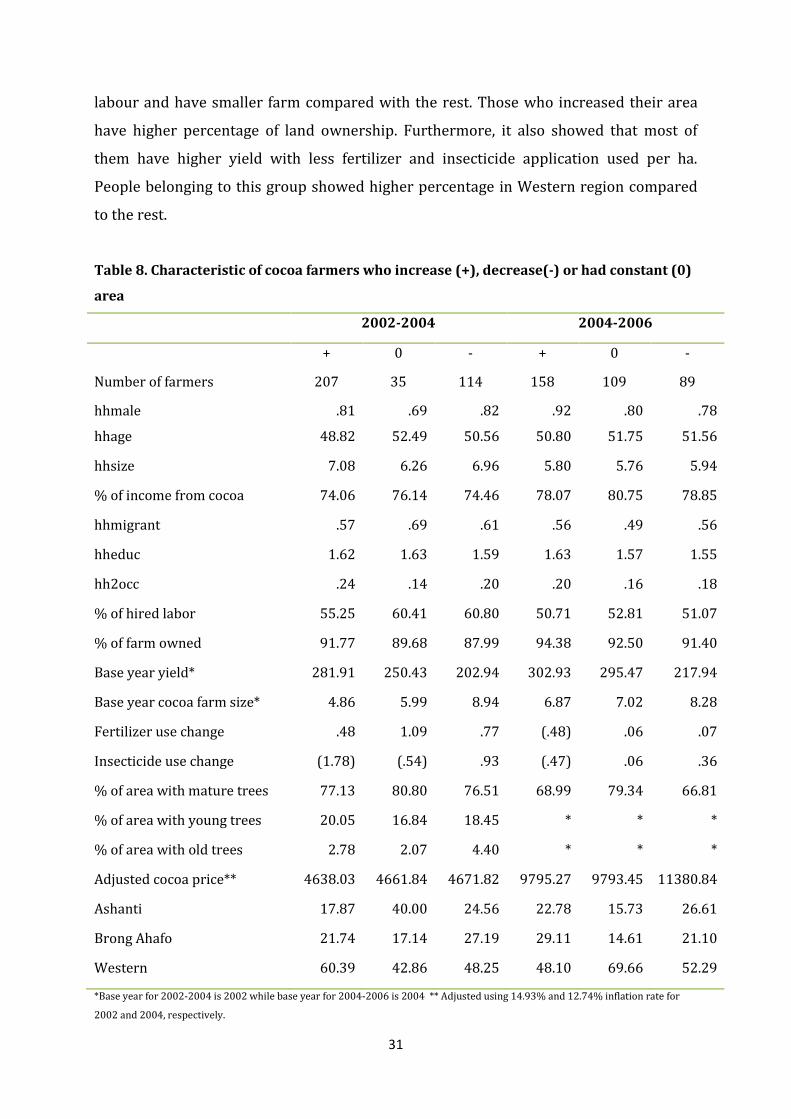
Expansion of cocoa farm
The expansion of the area devoted to cocoa mostly occurred in the Western region for
both periods under consideration. From 2002 to 2004, about 207 (58%) of the 356
farmers increased their area by about 3.5 ha of which 60% of them were from Western
region. Meanwhile, about 158 (44%) of the 356 farmers increased their area by 2.9 ha
from 2004 to 2006. The increase was lower compared to the previous period. Similar to
earlier observations, the majority of farmers who did expand their area came from the
Western region. Farmer’s characteristics in 2002 used as basis for the decision of
farmers reflected on the changes from 2002 to 2004 while farmer’s attributes in 2004
were used for the changes from 2004 to 2006 (Table 8).
Earlier discussion showed that cocoa production did increased in 2001-2, 2003-04, and
2005-06. One of the reason for increase was expansion of area planted with cocoa. As
the study looks into the factors that influence farmer’s adopting intensification and/or
expansion, we focus on the characteristics of farmers who increased, decreased or
remained constant in terms of area or in terms of input use. So looking at common
characteristics of those farmers who did increased the area for cocoa plantation from
2002 to 2004 and from 2004 to 2006, result showed that they were more male and
much younger compared to those who decreased the area or remained constant. In
addition, they were less dependent of cocoa as source of income as most of them have
other jobs aside from cocoa farming compared to other groups. They used more family
8.1
9.7
8.5
8.7
9.3
10
.7
8.7
9.3
9
11
.9
8.9
9.5
0
2
4
6
8
10
12
14
Ashanti Brong Ahafo Western All
Figure 17. Average size of farm
2002 2004 2006
31
labour and have smaller farm compared with the rest. Those who increased their area
have higher percentage of land ownership. Furthermore, it also showed that most of
them have higher yield with less fertilizer and insecticide application used per ha.
People belonging to this group showed higher percentage in Western region compared
to the rest.
Table 8. Characteristic of cocoa farmers who increase (+), decrease(-) or had constant (0)
area
2002-2004 2004-2006
+ 0 - + 0 -
Number of farmers 207 35 114 158 109 89
hhmale .81 .69 .82 .92 .80 .78
hhage 48.82 52.49 50.56 50.80 51.75 51.56
hhsize 7.08 6.26 6.96 5.80 5.76 5.94
% of income from cocoa 74.06 76.14 74.46 78.07 80.75 78.85
hhmigrant .57 .69 .61 .56 .49 .56
hheduc 1.62 1.63 1.59 1.63 1.57 1.55
hh2occ .24 .14 .20 .20 .16 .18
% of hired labor 55.25 60.41 60.80 50.71 52.81 51.07
% of farm owned 91.77 89.68 87.99 94.38 92.50 91.40
Base year yield* 281.91 250.43 202.94 302.93 295.47 217.94
Base year cocoa farm size* 4.86 5.99 8.94 6.87 7.02 8.28
Fertilizer use change .48 1.09 .77 (.48) .06 .07
Insecticide use change (1.78) (.54) .93 (.47) .06 .36
% of area with mature trees 77.13 80.80 76.51 68.99 79.34 66.81
% of area with young trees 20.05 16.84 18.45 * * *
% of area with old trees 2.78 2.07 4.40 * * *
Adjusted cocoa price** 4638.03 4661.84 4671.82 9795.27 9793.45 11380.84
Ashanti 17.87 40.00 24.56 22.78 15.73 26.61
Brong Ahafo 21.74 17.14 27.19 29.11 14.61 21.10
Western 60.39 42.86 48.25 48.10 69.66 52.29
*Base year for 2002-2004 is 2002 while base year for 2004-2006 is 2004 ** Adjusted using 14.93% and 12.74% inflation rate for
2002 and 2004, respectively.
32
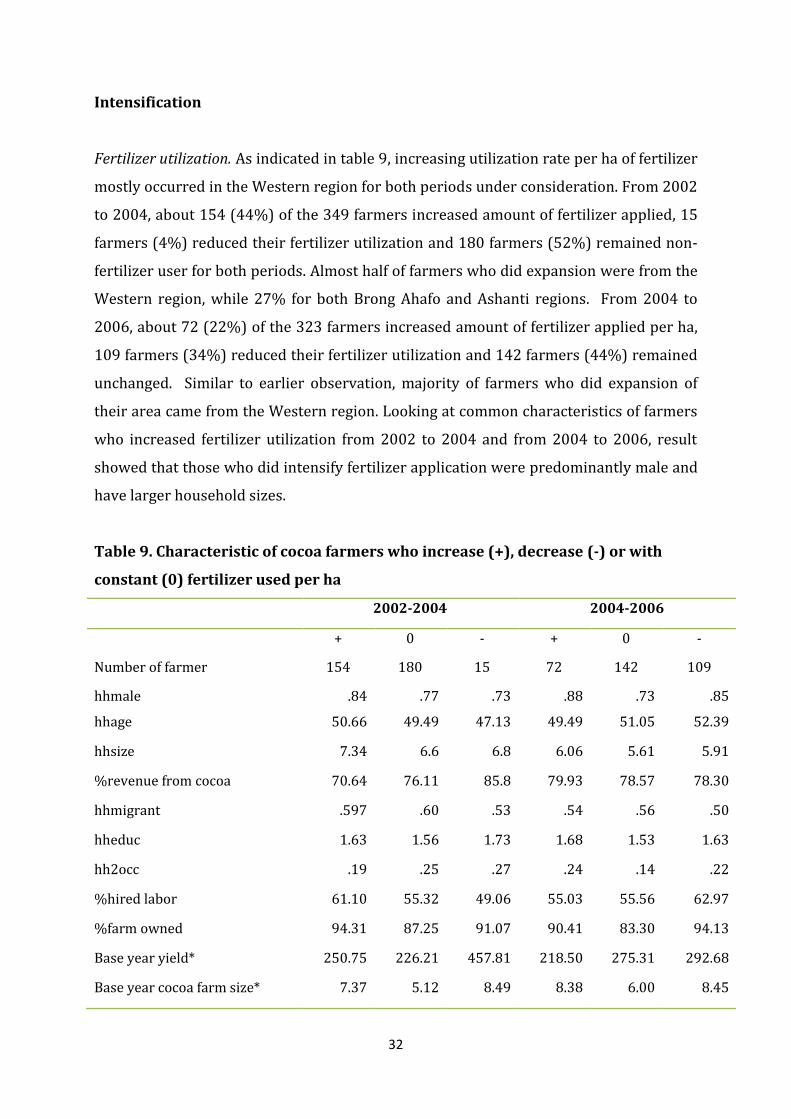
Intensification
Fertilizer utilization. As indicated in table 9, increasing utilization rate per ha of fertilizer
mostly occurred in the Western region for both periods under consideration. From 2002
to 2004, about 154 (44%) of the 349 farmers increased amount of fertilizer applied, 15
farmers (4%) reduced their fertilizer utilization and 180 farmers (52%) remained non-
fertilizer user for both periods. Almost half of farmers who did expansion were from the
Western region, while 27% for both Brong Ahafo and Ashanti regions. From 2004 to
2006, about 72 (22%) of the 323 farmers increased amount of fertilizer applied per ha,
109 farmers (34%) reduced their fertilizer utilization and 142 farmers (44%) remained
unchanged. Similar to earlier observation, majority of farmers who did expansion of
their area came from the Western region. Looking at common characteristics of farmers
who increased fertilizer utilization from 2002 to 2004 and from 2004 to 2006, result
showed that those who did intensify fertilizer application were predominantly male and
have larger household sizes.
Table 9. Characteristic of cocoa farmers who increase (+), decrease (-) or with
constant (0) fertilizer used per ha
2002-2004 2004-2006
+ 0 - + 0 -
Number of farmer 154 180 15 72 142 109
hhmale .84 .77 .73 .88 .73 .85
hhage 50.66 49.49 47.13 49.49 51.05 52.39
hhsize 7.34 6.6 6.8 6.06 5.61 5.91
%revenue from cocoa 70.64 76.11 85.8 79.93 78.57 78.30
hhmigrant .597 .60 .53 .54 .56 .50
hheduc 1.63 1.56 1.73 1.68 1.53 1.63
hh2occ .19 .25 .27 .24 .14 .22
%hired labor 61.10 55.32 49.06 55.03 55.56 62.97
%farm owned 94.31 87.25 91.07 90.41 83.30 94.13
Base year yield* 250.75 226.21 457.81 218.50 275.31 292.68
Base year cocoa farm size* 7.37 5.12 8.49 8.38 6.00 8.45
33
2002-2004 2004-2006
Fertilizer use change 1.56 0 (1.28) 1.41 0 (1.44)
Insecticide use change (.60) (.32) (2.34) (.06) .36 (.79)
% farmers used fertilizer 7.9 0 100 100 3.52 32.11
% of area with mature trees 78.55 75.60 82.44 74.22 68.05 71.07
% of area with young trees 18.02 20.54 16.59 * * *
% of area with old trees 3.29 3.47 .97 * * *
Adjusted cocoa price** 4638.53 4661.95 4661.84 9842.54 9796.32 11388.40
Ashanti 27.27 19.44 6.67 16.67 21.13 25.69
Brong Ahafo 27.27 21.67 0.00 25.00 17.61 25.69
Western 45.45 58.89 93.33 58.33 61.27 48.62
*Base year for 2002-2004 is 2002 while base year for 2004-2006 is 2004 ** Adjusted using 14.93% and 12.74% inflation rate for
2002 and 2004, respectively.
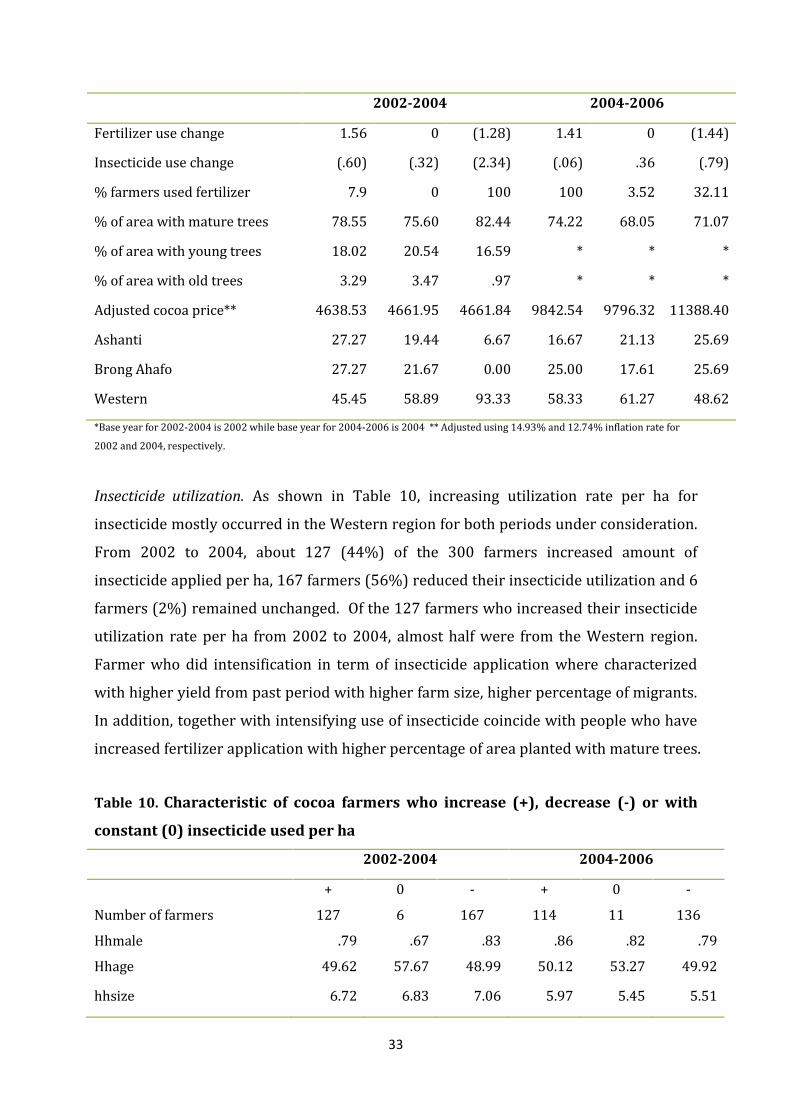
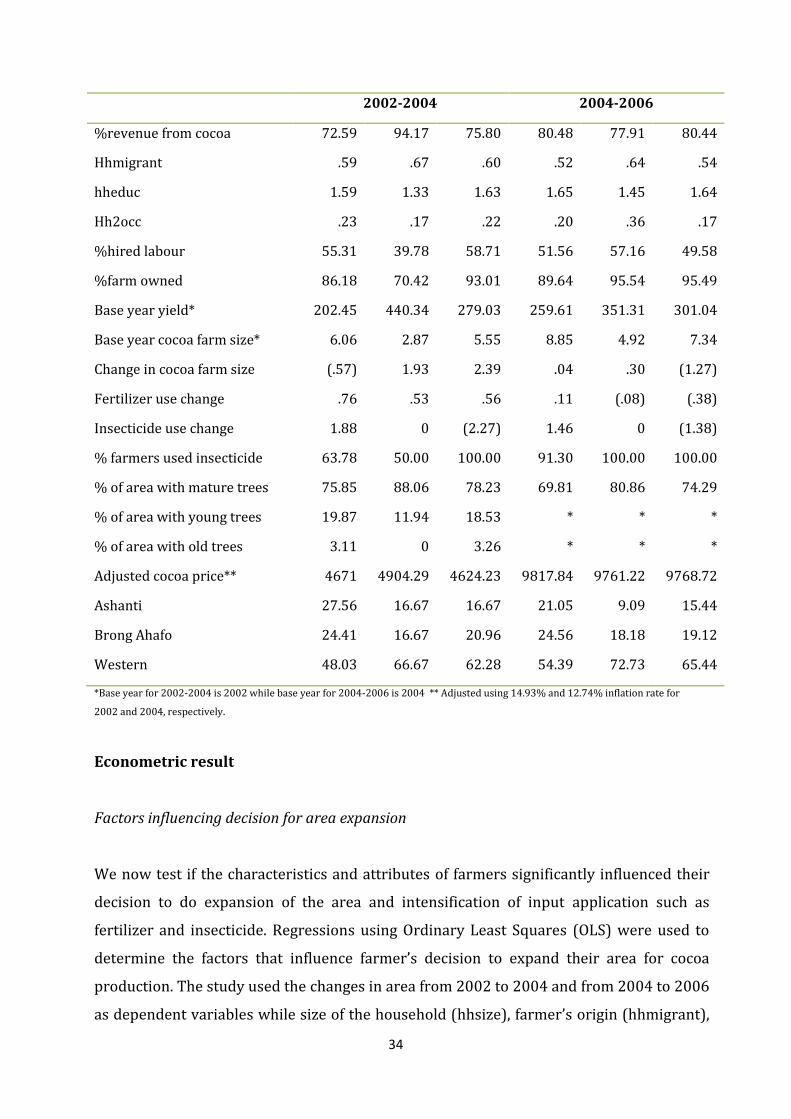
Insecticide utilization. As shown in Table 10, increasing utilization rate per ha for
insecticide mostly occurred in the Western region for both periods under consideration.
From 2002 to 2004, about 127 (44%) of the 300 farmers increased amount of
insecticide applied per ha, 167 farmers (56%) reduced their insecticide utilization and 6
farmers (2%) remained unchanged. Of the 127 farmers who increased their insecticide
utilization rate per ha from 2002 to 2004, almost half were from the Western region.
Farmer who did intensification in term of insecticide application where characterized
with higher yield from past period with higher farm size, higher percentage of migrants.
In addition, together with intensifying use of insecticide coincide with people who have
increased fertilizer application with higher percentage of area planted with mature trees.
Table 10. Characteristic of cocoa farmers who increase (+), decrease (-) or with
constant (0) insecticide used per ha
2002-2004 2004-2006
Number of farmers
+
127
0
6
-
167
+
114
0
11
-
136
Hhmale .79 .67 .83 .86 .82 .79
Hhage 49.62 57.67 48.99 50.12 53.27 49.92
hhsize 6.72 6.83 7.06 5.97 5.45 5.51
34
2002-2004 2004-2006
%revenue from cocoa 72.59 94.17 75.80 80.48 77.91 80.44
Hhmigrant .59 .67 .60 .52 .64 .54
hheduc 1.59 1.33 1.63 1.65 1.45 1.64
Hh2occ .23 .17 .22 .20 .36 .17
%hired labour 55.31 39.78 58.71 51.56 57.16 49.58
%farm owned 86.18 70.42 93.01 89.64 95.54 95.49
Base year yield* 202.45 440.34 279.03 259.61 351.31 301.04
Base year cocoa farm size* 6.06 2.87 5.55 8.85 4.92 7.34
Change in cocoa farm size (.57) 1.93 2.39 .04 .30 (1.27)
Fertilizer use change .76 .53 .56 .11 (.08) (.38)
Insecticide use change 1.88 0 (2.27) 1.46 0 (1.38)
% farmers used insecticide 63.78 50.00 100.00 91.30 100.00 100.00
% of area with mature trees 75.85 88.06 78.23 69.81 80.86 74.29
% of area with young trees 19.87 11.94 18.53 * * *
% of area with old trees 3.11 0 3.26 * * *
Adjusted cocoa price** 4671 4904.29 4624.23 9817.84 9761.22 9768.72
Ashanti 27.56 16.67 16.67 21.05 9.09 15.44
Brong Ahafo 24.41 16.67 20.96 24.56 18.18 19.12
Western 48.03 66.67 62.28 54.39 72.73 65.44
*Base year for 2002-2004 is 2002 while base year for 2004-2006 is 2004 ** Adjusted using 14.93% and 12.74% inflation rate for
2002 and 2004, respectively.
Econometric result
Factors influencing decision for area expansion
We now test if the characteristics and attributes of farmers significantly influenced their
decision to do expansion of the area and intensification of input application such as
fertilizer and insecticide. Regressions using Ordinary Least Squares (OLS) were used to
determine the factors that influence farmer’s decision to expand their area for cocoa
production. The study used the changes in area from 2002 to 2004 and from 2004 to 2006
as dependent variables while size of the household (hhsize), farmer’s origin (hhmigrant),
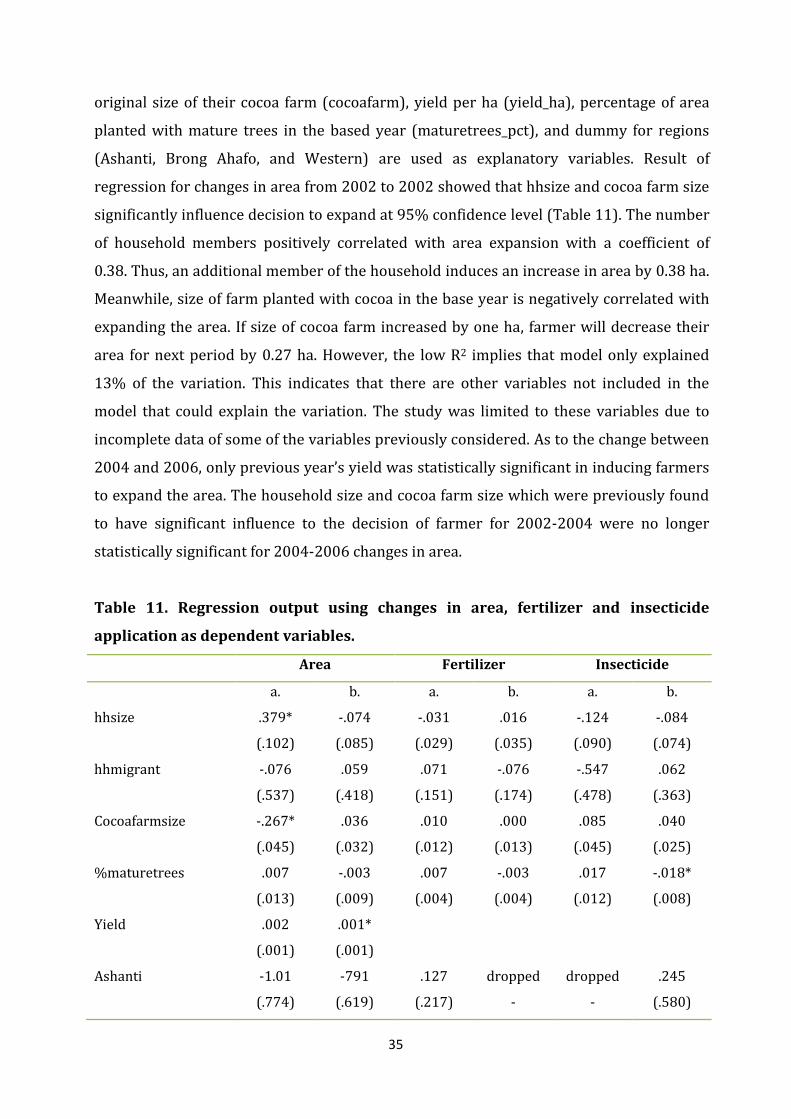
35
original size of their cocoa farm (cocoafarm), yield per ha (yield_ha), percentage of area
planted with mature trees in the based year (maturetrees_pct), and dummy for regions
(Ashanti, Brong Ahafo, and Western) are used as explanatory variables. Result of
regression for changes in area from 2002 to 2002 showed that hhsize and cocoa farm size
significantly influence decision to expand at 95% confidence level (Table 11). The number
of household members positively correlated with area expansion with a coefficient of
0.38. Thus, an additional member of the household induces an increase in area by 0.38 ha.
Meanwhile, size of farm planted with cocoa in the base year is negatively correlated with
expanding the area. If size of cocoa farm increased by one ha, farmer will decrease their
area for next period by 0.27 ha. However, the low R2 implies that model only explained
13% of the variation. This indicates that there are other variables not included in the
model that could explain the variation. The study was limited to these variables due to
incomplete data of some of the variables previously considered. As to the change between
2004 and 2006, only previous year’s yield was statistically significant in inducing farmers
to expand the area. The household size and cocoa farm size which were previously found
to have significant influence to the decision of farmer for 2002-2004 were no longer
statistically significant for 2004-2006 changes in area.
Table 11. Regression output using changes in area, fertilizer and insecticide
application as dependent variables.
Area Fertilizer Insecticide
a. b. a. b. a. b.
hhsize .379* -.074 -.031 .016 -.124 -.084
(.102) (.085) (.029) (.035) (.090) (.074)
hhmigrant -.076 .059 .071 -.076 -.547 .062
(.537) (.418) (.151) (.174) (.478) (.363)
Cocoafarmsize -.267* .036 .010 .000 .085 .040
(.045) (.032) (.012) (.013) (.045) (.025)
%maturetrees .007 -.003 .007 -.003 .017 -.018*
(.013) (.009) (.004) (.004) (.012) (.008)
Yield .002 .001*
(.001) (.001)
Ashanti -1.01 -791 .127 dropped dropped .245
(.774) (.619) (.217) - - (.580)
36
Area Fertilizer Insecticide
Brong Ahafo dropped dropped dropped .588* -1.68* dropped
- - - (.262) .702 -
Western .113 -968 -.317 .449* -1.865* -.081
(1.40) (.522) (.185) (.231) (.595) (.458)
Constant -.689 1.423 .365 -.356 .351 1.317
(1.40) (.941) (.391) (.373) (1.263) (.854)
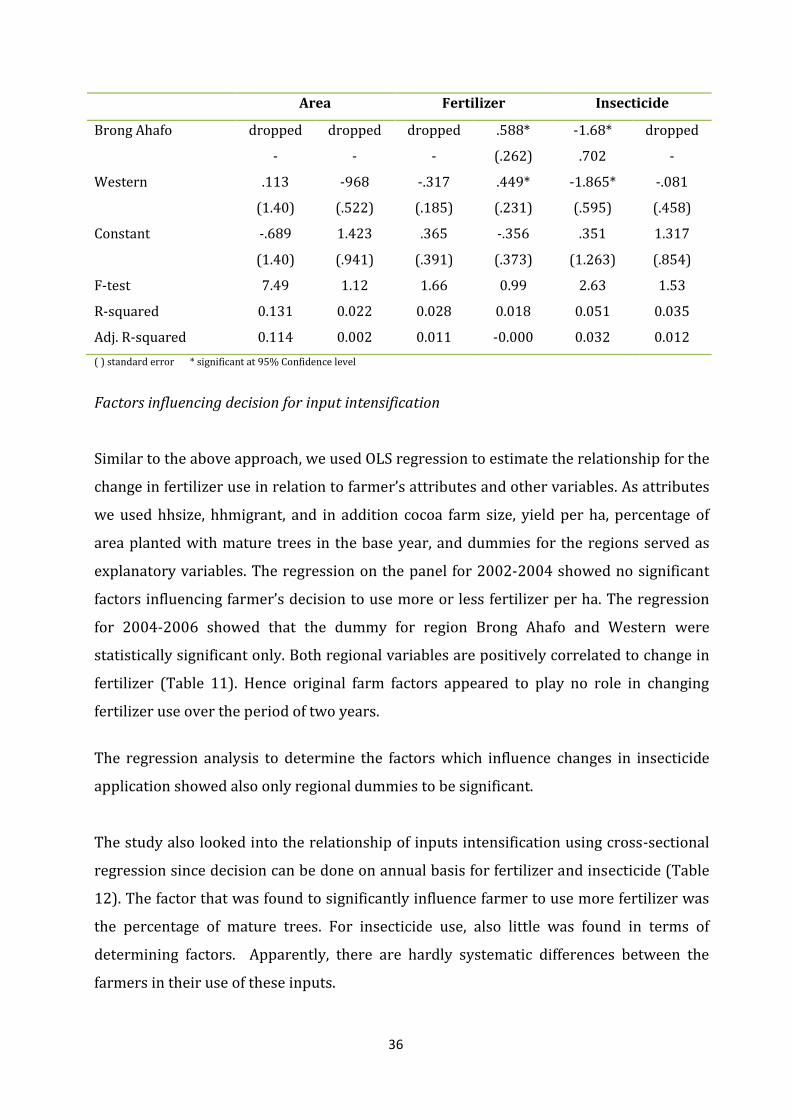
F-test 7.49 1.12 1.66 0.99 2.63 1.53
R-squared 0.131 0.022 0.028 0.018 0.051 0.035
Adj. R-squared 0.114 0.002 0.011 -0.000 0.032 0.012
( ) standard error * significant at 95% Confidence level
Factors influencing decision for input intensification
Similar to the above approach, we used OLS regression to estimate the relationship for the
change in fertilizer use in relation to farmer’s attributes and other variables. As attributes
we used hhsize, hhmigrant, and in addition cocoa farm size, yield per ha, percentage of
area planted with mature trees in the base year, and dummies for the regions served as
explanatory variables. The regression on the panel for 2002-2004 showed no significant
factors influencing farmer’s decision to use more or less fertilizer per ha. The regression
for 2004-2006 showed that the dummy for region Brong Ahafo and Western were
statistically significant only. Both regional variables are positively correlated to change in
fertilizer (Table 11). Hence original farm factors appeared to play no role in changing
fertilizer use over the period of two years.
The regression analysis to determine the factors which influence changes in insecticide
application showed also only regional dummies to be significant.
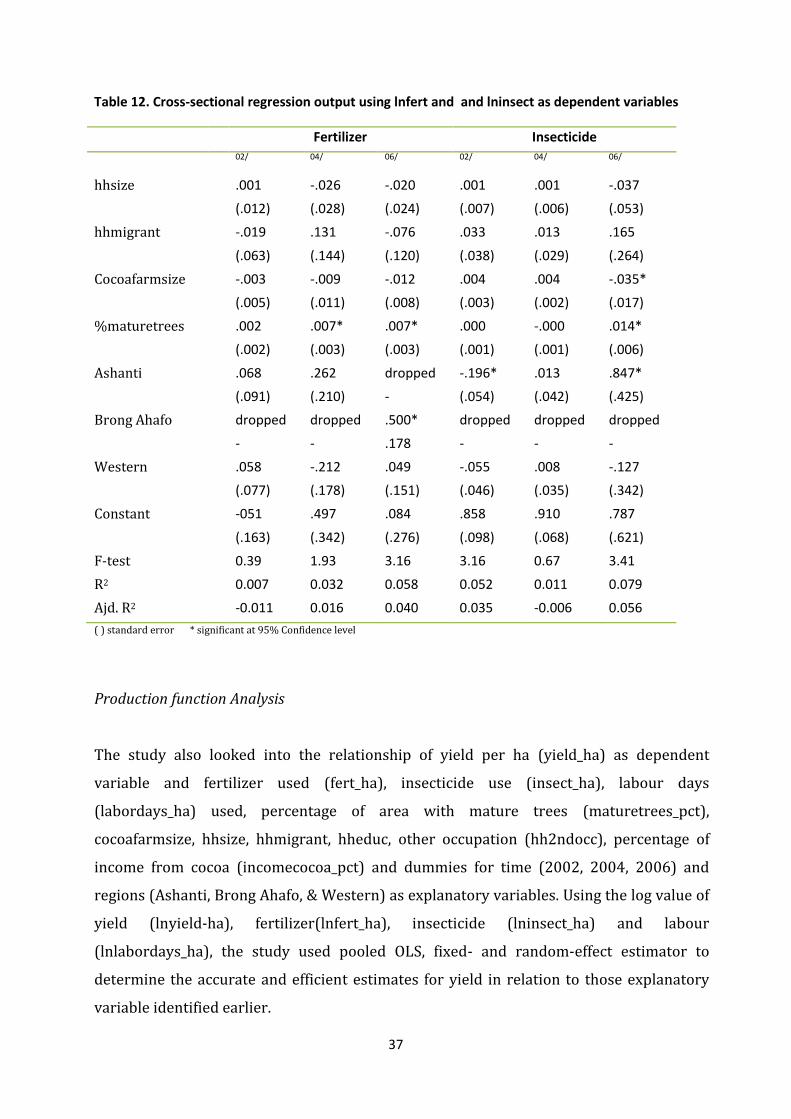
The study also looked into the relationship of inputs intensification using cross-sectional
regression since decision can be done on annual basis for fertilizer and insecticide (Table
12). The factor that was found to significantly influence farmer to use more fertilizer was
the percentage of mature trees. For insecticide use, also little was found in terms of
determining factors. Apparently, there are hardly systematic differences between the
farmers in their use of these inputs.
37
Table 12. Cross-sectional regression output using lnfert and and lninsect as dependent variables
Fertilizer Insecticide
02/ 04/ 06/ 02/ 04/ 06/
hhsize .001 -.026 -.020 .001 .001 -.037
(.012) (.028) (.024) (.007) (.006) (.053)
hhmigrant -.019 .131 -.076 .033 .013 .165
(.063) (.144) (.120) (.038) (.029) (.264)
Cocoafarmsize -.003 -.009 -.012 .004 .004 -.035*
(.005) (.011) (.008) (.003) (.002) (.017)
%maturetrees .002 .007* .007* .000 -.000 .014*
(.002) (.003) (.003) (.001) (.001) (.006)
Ashanti .068 .262 dropped -.196* .013 .847*
(.091) (.210) - (.054) (.042) (.425)
Brong Ahafo dropped dropped .500* dropped dropped dropped
- - .178 - - -
Western .058 -.212 .049 -.055 .008 -.127
(.077) (.178) (.151) (.046) (.035) (.342)
Constant -051 .497 .084 .858 .910 .787
(.163) (.342) (.276) (.098) (.068) (.621)
F-test 0.39 1.93 3.16 3.16 0.67 3.41
R2 0.007 0.032 0.058 0.052 0.011 0.079
Ajd. R2 -0.011 0.016 0.040 0.035 -0.006 0.056
( ) standard error * significant at 95% Confidence level
Production function Analysis
The study also looked into the relationship of yield per ha (yield_ha) as dependent
variable and fertilizer used (fert_ha), insecticide use (insect_ha), labour days
(labordays_ha) used, percentage of area with mature trees (maturetrees_pct),
cocoafarmsize, hhsize, hhmigrant, hheduc, other occupation (hh2ndocc), percentage of
income from cocoa (incomecocoa_pct) and dummies for time (2002, 2004, 2006) and
regions (Ashanti, Brong Ahafo, & Western) as explanatory variables. Using the log value of
yield (lnyield-ha), fertilizer(lnfert_ha), insecticide (lninsect_ha) and labour
(lnlabordays_ha), the study used pooled OLS, fixed- and random-effect estimator to
determine the accurate and efficient estimates for yield in relation to those explanatory
variable identified earlier.
38
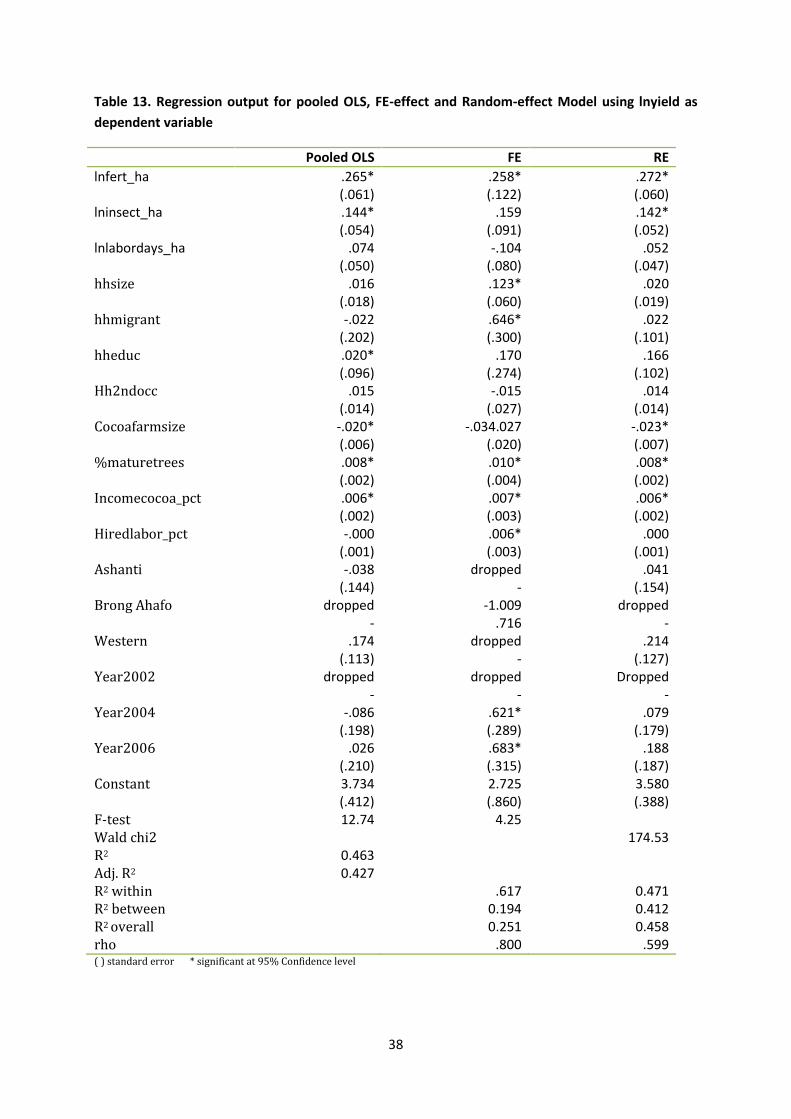
Table 13. Regression output for pooled OLS, FE-effect and Random-effect Model using lnyield as
dependent variable
Pooled OLS FE RE
lnfert_ha .265* .258* .272* (.061) (.122) (.060) lninsect_ha .144* .159 .142* (.054) (.091) (.052) lnlabordays_ha .074 -.104 .052 (.050) (.080) (.047) hhsize .016 .123* .020 (.018) (.060) (.019) hhmigrant -.022 .646* .022 (.202) (.300) (.101) hheduc .020* .170 .166 (.096) (.274) (.102) Hh2ndocc .015 -.015 .014 (.014) (.027) (.014) Cocoafarmsize -.020* -.034.027 -.023* (.006) (.020) (.007) %maturetrees .008* .010* .008* (.002) (.004) (.002) Incomecocoa_pct .006* .007* .006* (.002) (.003) (.002) Hiredlabor_pct -.000 .006* .000 (.001) (.003) (.001) Ashanti -.038 dropped .041 (.144) - (.154) Brong Ahafo dropped -1.009 dropped - .716 - Western .174 dropped .214 (.113) - (.127) Year2002 dropped dropped Dropped - - - Year2004 -.086 .621* .079 (.198) (.289) (.179) Year2006 .026 .683* .188 (.210) (.315) (.187) Constant 3.734 2.725 3.580 (.412) (.860) (.388) F-test 12.74 4.25 Wald chi2 174.53 R2 0.463 Adj. R2 0.427 R2 within .617 0.471 R2 between 0.194 0.412 R2 overall 0.251 0.458 rho .800 .599 ( ) standard error * significant at 95% Confidence level
39
Using the pooled OLS estimator, we find that fertilizer used, insecticide used, percentage
of area with mature trees, size of cocoa farm, percentage of income from cocoa and
educational level of farmers were significant variables that explain cocoa yield per ha
(Table 13). For fixed-effect estimator, the results showed a higher number of significant
factors. In addition to fertilizer used, percentage of area with mature trees, percentage of
income from cocoa and educational level of farmers, it also showed that whether farmer
was a migrant, size of the household, % of hired labour use against total, and dummy for
time year 2004 and 2006 were significant and positively correlated to lnyield. However,
insecticide used and size of cocoa farm, which was found to be significant using pooled
OLS were found insignificant using fixed-effect model. Meanwhile, only fertilizer used,
insecticide used, percentage of area with mature trees, size of cocoa farm and
percentage of income from cocoa were statistically significant using Random-effect
estimator. Except for size of cocoa farm which is found to be negatively correlated with
yield, the remaining variable found to be significant were positively correlated with
yield for both Random-effect and pooled OLS estimators. To see which estimate will give
efficient estimates a Hausman-test was used. Result of the test indicates that Fixed-effect
model gives inefficient estimates (chi2=18.13, p>0.15) compared with random-effect
model. Thus, Random-effect model turned to be more appropriate to use for estimating
the responsiveness of significant variables to yield. Meanwhile, random-effect and OLS
estimator were compared using Breusch-Pagan-Lagrange multiplier test. Result showed
that OLS is a more appropriate estimator, as the test indicated that it cannot reject the
null hypothesis (i.e., variance across observations is zero) with chi2=.63 at p-
value=0.1023.
The study used the estimate given in OLS regression to calculate the marginal value
product (MVP) of fertilizer used per ha. With a yield-elasticity of fertilizer equal to 0.264
(which is quite similar to Teal & Vigneri, 2004), and mean yield of 275 kg/ha and a mean
application of 36.8 kg/ha (i.e. 0.736 bags), a marginal product of fertilizer is derived of
close to 2 kg of cocoa for 1 kg of fertilizer. Present prices in Ghana are 3.3 (new) cedis
per kg of cocoa and only 1 cedi per kg of fertilizer, and increased use of this input is quite
attractive. In 2002, cocoa prices were quite low at 4652 cedis/kg, whereas fertilizer cost
2260 per kg (FAO, 2005). Even then, increased use of fertilizer was attractive.
40
CHAPTER 5
5. Summary and conclusion
Cocoa production in Ghana showed an increase from 2002 to 2006 along with an
increase in area used for cocoa plantation and intensification in terms of fertilizer and
insecticide application which can be attributed to massive intervention by the Ghanaian
government as well as private initiatives. The increase in production, in use of fertilizer
and insecticide including rate of utilization of these inputs was stronger in the period
from 2002 to 2004 compared to changes observed from 2004 to 2006. Based on FAO
data, the cocoa yield per ha of Ghana is still below that of other cocoa producing
countries like Indonesia and Cote d’Ivoire. Fertilizer and insecticide were found to be
the major contributing factors in increasing yield as they are significantly and positively
correlated with yield per ha. Thus, this gives much potential to use more fertilizer and
insecticide to improve productivity. Incentive for farmers to use more inputs largely
depend on its price as compared to the marginal value product of inputs used (fertilizer
and pesticide). The yield function showed that 1 extra kg of fertilizer leads to 2 extra kg
of cocoa, and the price ratios of cocoa and fertilizer (2:1 in 2002, and 3:1 at present) add
to this attractiveness.
As to the possible factors that significantly influence farmer’s decision to increase area,
it proved difficult to establish these firmly. The study found that size of household and
farm size significantly influence decision to expand the area in period 2002-2004 (with
positive effects for the household size and negative effect for the initial farm size), but
the effects did not come out in the analysis of the change 2004-2006, when only yield
was found to be correlated. The same applies to intensification by fertilizer and
insecticide application. Low values of R2 suggest that there are other factors that may
explain the decision behaviour of the farmers related to expansion and intensification in
order to increase productivity in cocoa sector. Those are not considered in this study
due to limitation of data and can be consider in further research.
41
REFERENCES
______ (2012). "Ghana Statistical Service 2010 Population & Housing Census Summary Report of Final Results."
Colman, D. and T. Young (1989). Principles of agricultural economics: markets and prices in less developed countries, Cambridge University Press.
Dormon, E., A. Van Huis, et al. (2004). "Causes of low productivity of cocoa in Ghana: farmers' perspectives and insights from research and the socio-political establishment." NJAS-Wageningen Journal of Life Sciences 52(3): 237-259.
Kolavalli, S. and M. Vigneri (2011). "Cocoa in Ghana: Shaping the success of an economy." Yes, Africa Can: Success Stories from a Dynamic Continent 201.
Ozden, E. and P. Santos "Decomposing Productivity Changes in the Ghanaian Cocoa Sector."
Taher, S. (1996). Factors influencing smallholder cocoa production: a management analysis of behavioural decision-making processes of technology adoption and application, Landbouwuniversiteit Wageningen.
Teal, F. and M. Vigneri (2004). "Production changes in Ghana cocoa farming households under market reforms."
Teal, F., A. Zeitlin, et al. (2006). "Ghana Cocoa Farmers Survey 2004: Report to Ghana Cocoa Board."
Vigneri, M. and P. Santos (2009). What Does Liberalization without Price Competition Achieve? The Case of Cocoa in Ghana. Contributed Paper presented at the International Association of Agricultural Economists, 2009 Conference, August.
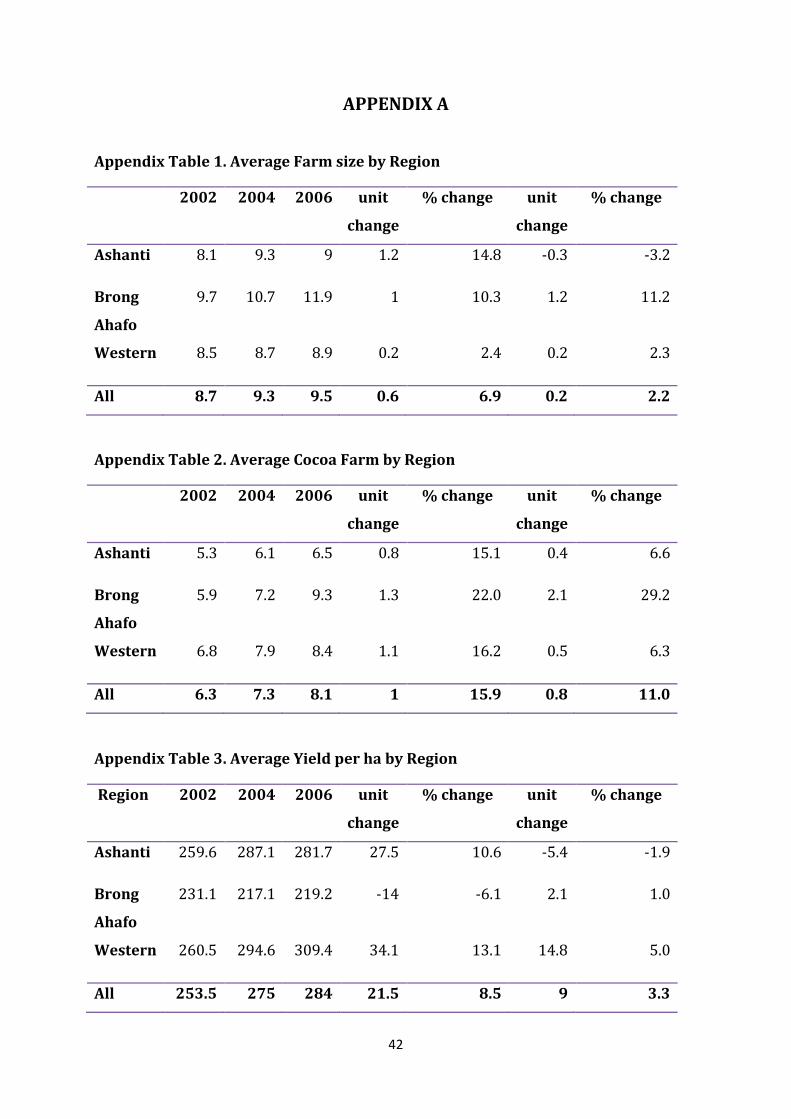
42
APPENDIX A
Appendix Table 1. Average Farm size by Region
2002 2004 2006 unit
change
% change unit
change
% change
Ashanti 8.1 9.3 9 1.2 14.8 -0.3 -3.2
Brong
Ahafo
9.7 10.7 11.9 1 10.3 1.2 11.2
Western 8.5 8.7 8.9 0.2 2.4 0.2 2.3
All 8.7 9.3 9.5 0.6 6.9 0.2 2.2
Appendix Table 2. Average Cocoa Farm by Region
2002 2004 2006 unit
change
% change unit
change
% change
Ashanti 5.3 6.1 6.5 0.8 15.1 0.4 6.6
Brong
Ahafo
5.9 7.2 9.3 1.3 22.0 2.1 29.2
Western 6.8 7.9 8.4 1.1 16.2 0.5 6.3
All 6.3 7.3 8.1 1 15.9 0.8 11.0
Appendix Table 3. Average Yield per ha by Region
Region 2002 2004 2006 unit
change
% change unit
change
% change
Ashanti 259.6 287.1 281.7 27.5 10.6 -5.4 -1.9
Brong
Ahafo
231.1 217.1 219.2 -14 -6.1 2.1 1.0
Western 260.5 294.6 309.4 34.1 13.1 14.8 5.0
All 253.5 275 284 21.5 8.5 9 3.3

43
Appendix Table 4. Number of farmer who use fertilizer by region
2002 2004 2006
Y N Y N Y N
Ashanti 4 75 42 37 31 48
B. Ahafo 5 77 41 41 40 41
Western 25 170 77 118 73 122
Total 34 322 160 196 144 211
Appendix Table 5. Average Fertilizer used per ha by Region
Region 2002 2004 2006 unit
change
% change unit
change
% change
Ashanti 0.113 0.952 0.353 0.839 742.5 -0.599 -62.9
Brong
Ahafo
0.035 0.779 0.831 0.744 2125.7 0.052 6.7
Western 0.102 0.631 0.465 0.529 518.6 -0.166 -26.3
All 0.089 0.736 0.515 0.647 727.0 -0.221 -30.0
Appendix Table 6. Number of farmer who use insecticide by region
2002 2004 2006
Y N Y N Y N
Ashanti 58 21 74 5 74 5
B. Ahafo 77 5 76 6 75 6
Western 172 23 181 14 181 14
Total 307 49 331 25 330 25
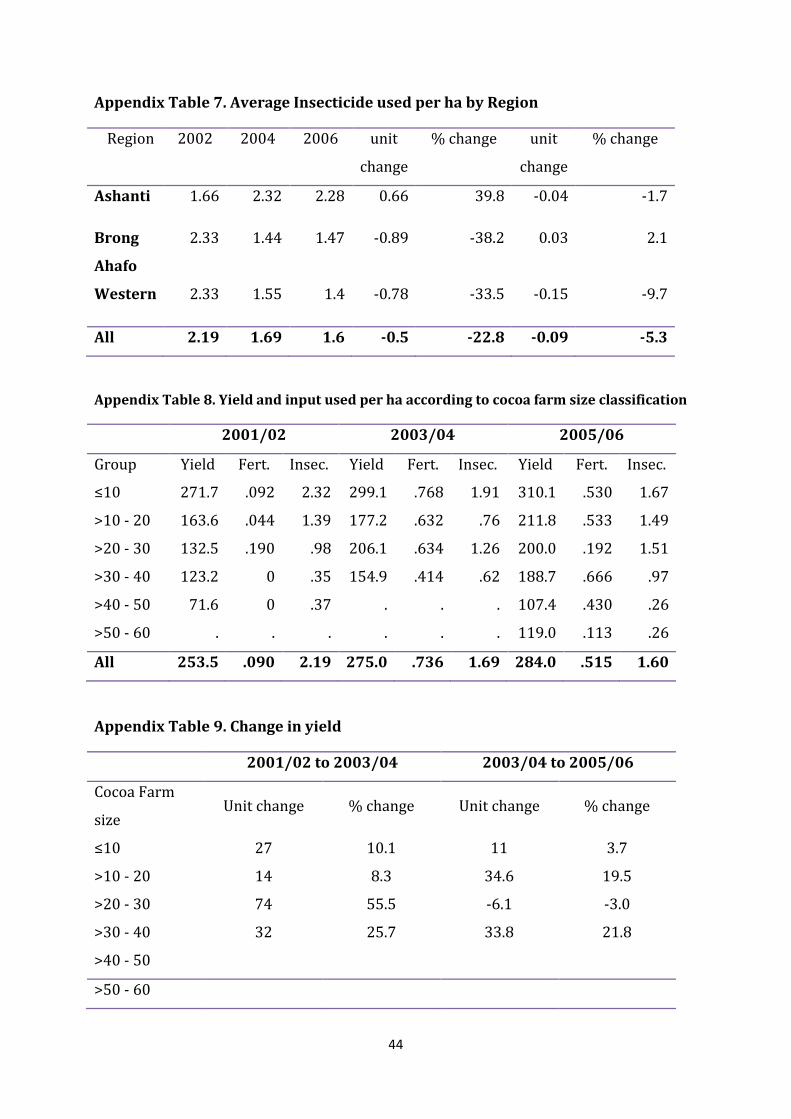
44
Appendix Table 7. Average Insecticide used per ha by Region
Region 2002 2004 2006 unit
change
% change unit
change
% change
Ashanti 1.66 2.32 2.28 0.66 39.8 -0.04 -1.7
Brong
Ahafo
2.33 1.44 1.47 -0.89 -38.2 0.03 2.1
Western 2.33 1.55 1.4 -0.78 -33.5 -0.15 -9.7
All 2.19 1.69 1.6 -0.5 -22.8 -0.09 -5.3
Appendix Table 8. Yield and input used per ha according to cocoa farm size classification
2001/02 2003/04 2005/06
Group Yield Fert. Insec. Yield Fert. Insec. Yield Fert. Insec.
≤10 271.7 .092 2.32 299.1 .768 1.91 310.1 .530 1.67
>10 - 20 163.6 .044 1.39 177.2 .632 .76 211.8 .533 1.49
>20 - 30 132.5 .190 .98 206.1 .634 1.26 200.0 .192 1.51
>30 - 40 123.2 0 .35 154.9 .414 .62 188.7 .666 .97
>40 - 50 71.6 0 .37 . . . 107.4 .430 .26
>50 - 60 . . . . . . 119.0 .113 .26
All 253.5 .090 2.19 275.0 .736 1.69 284.0 .515 1.60
Appendix Table 9. Change in yield
2001/02 to 2003/04 2003/04 to 2005/06
Cocoa Farm
size Unit change % change Unit change % change
≤10 27 10.1 11 3.7
>10 - 20 14 8.3 34.6 19.5
>20 - 30 74 55.5 -6.1 -3.0
>30 - 40 32 25.7 33.8 21.8
>40 - 50
>50 - 60
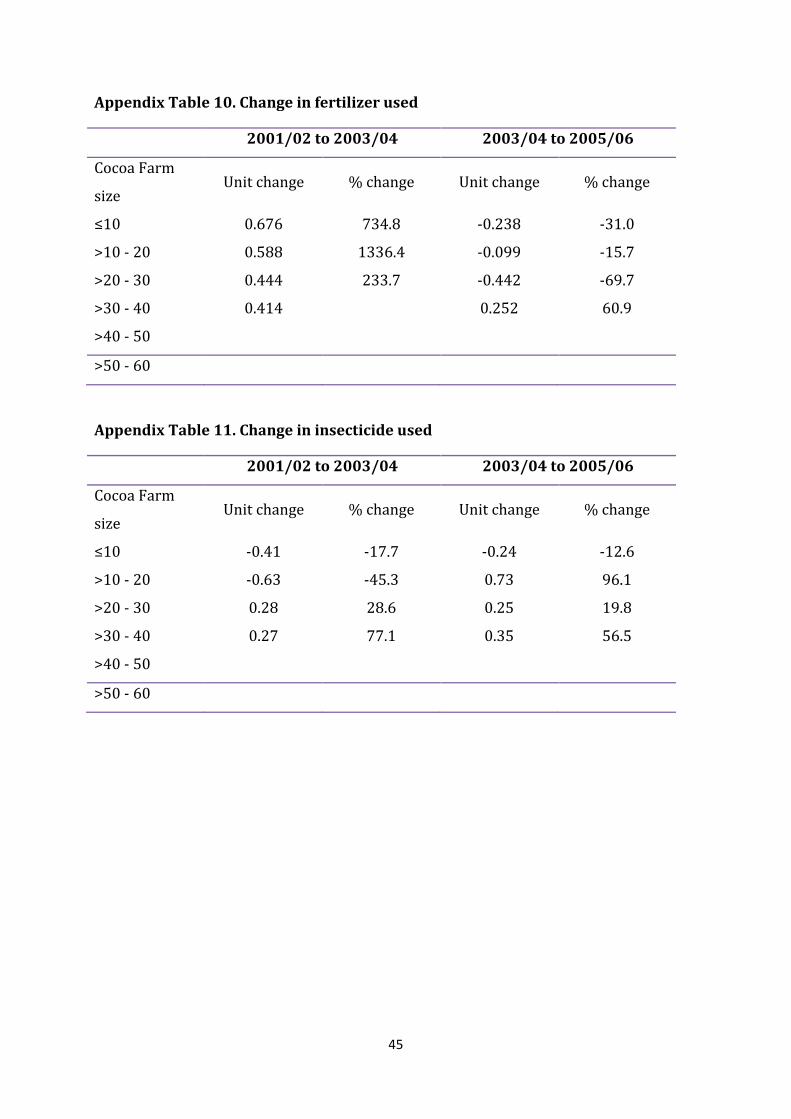
45
Appendix Table 10. Change in fertilizer used
2001/02 to 2003/04 2003/04 to 2005/06
Cocoa Farm
size Unit change % change Unit change % change
≤10 0.676 734.8 -0.238 -31.0
>10 - 20 0.588 1336.4 -0.099 -15.7
>20 - 30 0.444 233.7 -0.442 -69.7
>30 - 40 0.414 0.252 60.9
>40 - 50
>50 - 60
Appendix Table 11. Change in insecticide used
2001/02 to 2003/04 2003/04 to 2005/06
Cocoa Farm
size Unit change % change Unit change % change
≤10 -0.41 -17.7 -0.24 -12.6
>10 - 20 -0.63 -45.3 0.73 96.1
>20 - 30 0.28 28.6 0.25 19.8
>30 - 40 0.27 77.1 0.35 56.5
>40 - 50
>50 - 60

46
Appendix Table 12. Yield and inputs used based on the percentage of cocoa farm planted with mature trees
2001/02 2003/04 2005/06
Group Yield Fert. Insec. Yield Fert. Insec. Yield Fert. Insec.
≤20 192.6 .123 1.24 203.2 .709 1.31 117.2 .124 1.02
>20 - 40 138.0 .198 2.74 163.3 .341 1.61 276.4 .175 .94
>40 - 60 185.8 .009 2.08 147.6 .719 2.02 245.3 .275 1.55
>60 - 80 220.5 .043 2.50 255.1 .676 1.52 268.6 .664 1.26
>80 - 100 306.5 .133 1.95 363.1 .855 1.81 318.3 .566 1.86
All 253.5 .089 2.19 275.0 .736 1.69 284.3 .525 1.61
Appendix Table 13. Change in yield
2001/02 to 2003/04 2003/04 to 2005/06
% Mat. unit change % change unit change % change
≤20 10.6 5.5 -86 -42.3
>20 - 40 25.3 18.3 113.1 69.3
>40 - 60 -38.2 -20.6 97.7 66.2
>60 - 80 34.6 15.7 13.5 5.3
>80 - 100 56.6 18.5 -44.8 -12.3
All 21.5 8.5 9.3 3.4
Appendix Table 14. Change in fertilizer used
2001/02 to 2003/04 2003/04 to 2005/06
% Mat. unit change % change unit change % change
≤20 0.586 476.4 -0.585 -82.5
>20 - 40 0.143 72.2 -0.166 -48.7
>40 - 60 0.71 7888.9 -0.444 -61.8
>60 - 80 0.633 1472.1 -0.012 -1.8
>80 - 100 0.722 542.9 -0.289 -33.8
All 0.647 727.0 -0.211 -28.7
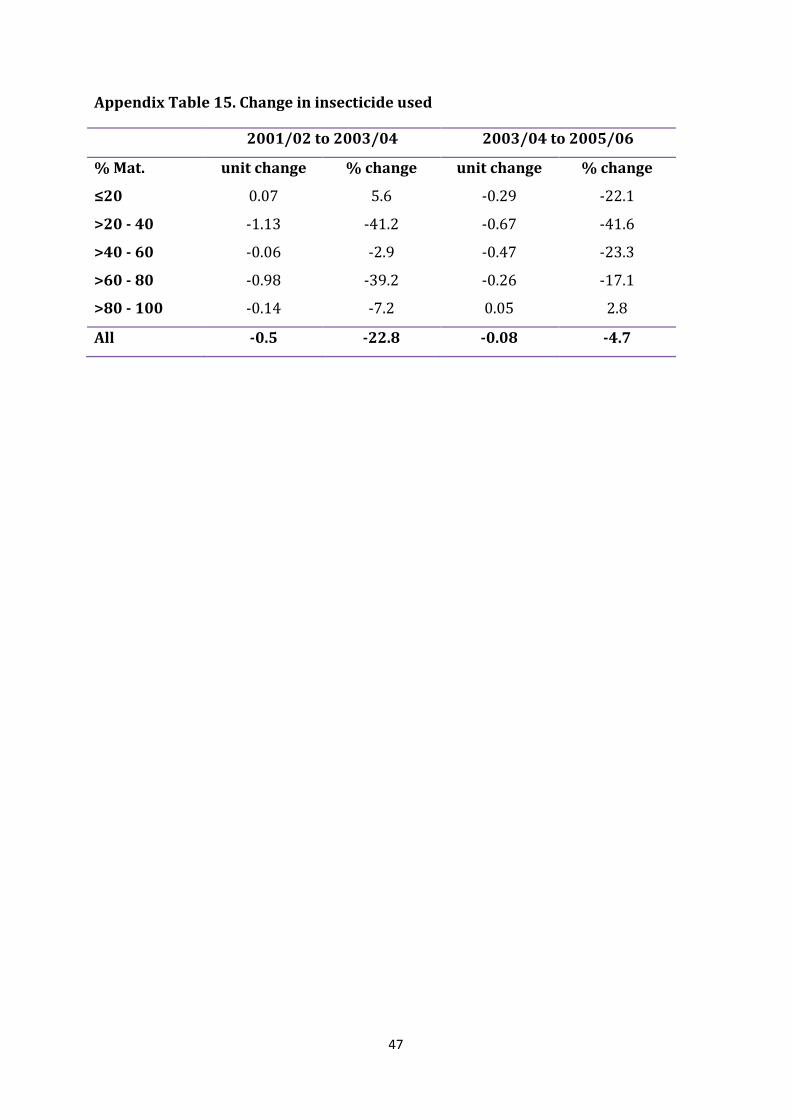
47
Appendix Table 15. Change in insecticide used
2001/02 to 2003/04 2003/04 to 2005/06
% Mat. unit change % change unit change % change
≤20 0.07 5.6 -0.29 -22.1
>20 - 40 -1.13 -41.2 -0.67 -41.6
>40 - 60 -0.06 -2.9 -0.47 -23.3
>60 - 80 -0.98 -39.2 -0.26 -17.1
>80 - 100 -0.14 -7.2 0.05 2.8
All -0.5 -22.8 -0.08 -4.7
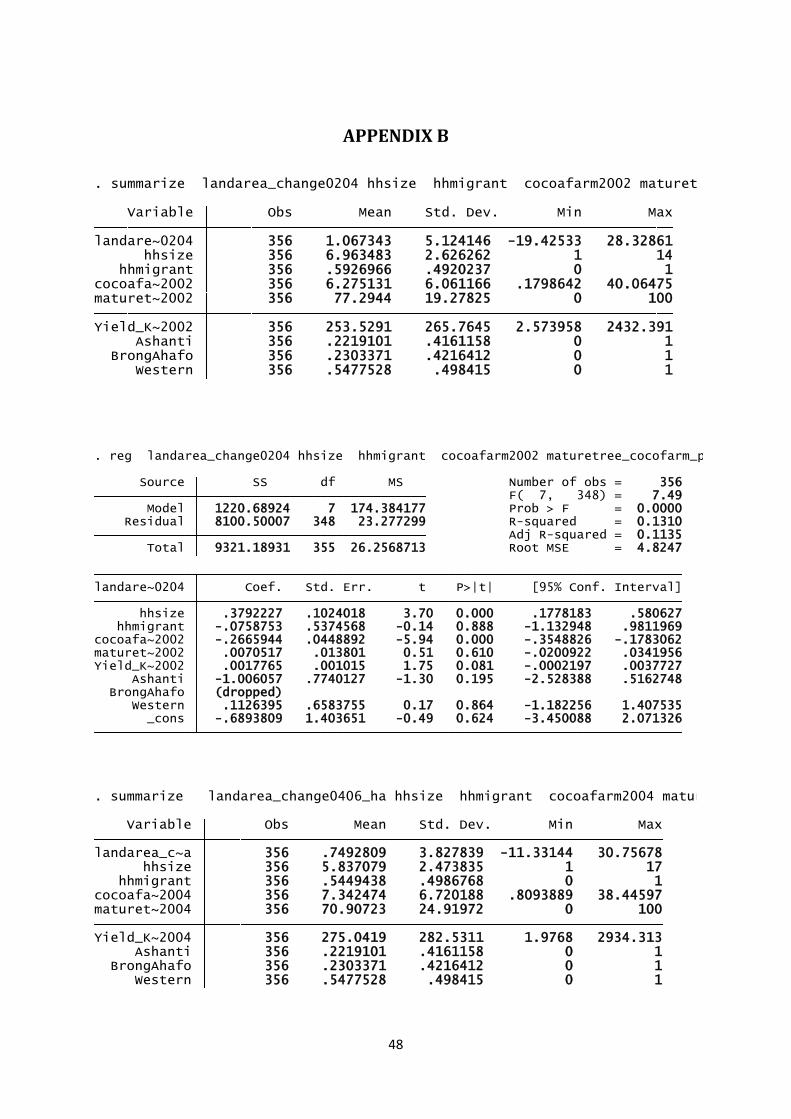
48
APPENDIX B
Western 356 .5477528 .498415 0 1 BrongAhafo 356 .2303371 .4216412 0 1 Ashanti 356 .2219101 .4161158 0 1Yield_K~2002 356 253.5291 265.7645 2.573958 2432.391 maturet~2002 356 77.2944 19.27825 0 100cocoafa~2002 356 6.275131 6.061166 .1798642 40.06475 hhmigrant 356 .5926966 .4920237 0 1 hhsize 356 6.963483 2.626262 1 14landare~0204 356 1.067343 5.124146 -19.42533 28.32861 Variable Obs Mean Std. Dev. Min Max
. summarize landarea_change0204 hhsize hhmigrant cocoafarm2002 maturetree_cocofarm_pct2002 Yield_KgHa2002 Ashanti BrongAhafo Western
_cons -.6893809 1.403651 -0.49 0.624 -3.450088 2.071326 Western .1126395 .6583755 0.17 0.864 -1.182256 1.407535 BrongAhafo (dropped) Ashanti -1.006057 .7740127 -1.30 0.195 -2.528388 .5162748Yield_K~2002 .0017765 .001015 1.75 0.081 -.0002197 .0037727maturet~2002 .0070517 .013801 0.51 0.610 -.0200922 .0341956cocoafa~2002 -.2665944 .0448892 -5.94 0.000 -.3548826 -.1783062 hhmigrant -.0758753 .5374568 -0.14 0.888 -1.132948 .9811969 hhsize .3792227 .1024018 3.70 0.000 .1778183 .580627 landare~0204 Coef. Std. Err. t P>|t| [95% Conf. Interval]
Total 9321.18931 355 26.2568713 Root MSE = 4.8247 Adj R-squared = 0.1135 Residual 8100.50007 348 23.277299 R-squared = 0.1310 Model 1220.68924 7 174.384177 Prob > F = 0.0000 F( 7, 348) = 7.49 Source SS df MS Number of obs = 356
. reg landarea_change0204 hhsize hhmigrant cocoafarm2002 maturetree_cocofarm_pct2002 Yield_KgHa2002 Ashanti BrongAhafo Western
Western 356 .5477528 .498415 0 1 BrongAhafo 356 .2303371 .4216412 0 1 Ashanti 356 .2219101 .4161158 0 1Yield_K~2004 356 275.0419 282.5311 1.9768 2934.313 maturet~2004 356 70.90723 24.91972 0 100cocoafa~2004 356 7.342474 6.720188 .8093889 38.44597 hhmigrant 356 .5449438 .4986768 0 1 hhsize 356 5.837079 2.473835 1 17landarea_c~a 356 .7492809 3.827839 -11.33144 30.75678 Variable Obs Mean Std. Dev. Min Max
. summarize landarea_change0406_ha hhsize hhmigrant cocoafarm2004 maturetree_cocofarm_pct2004 Yield_KgHa2004 Ashanti BrongAhafo Western
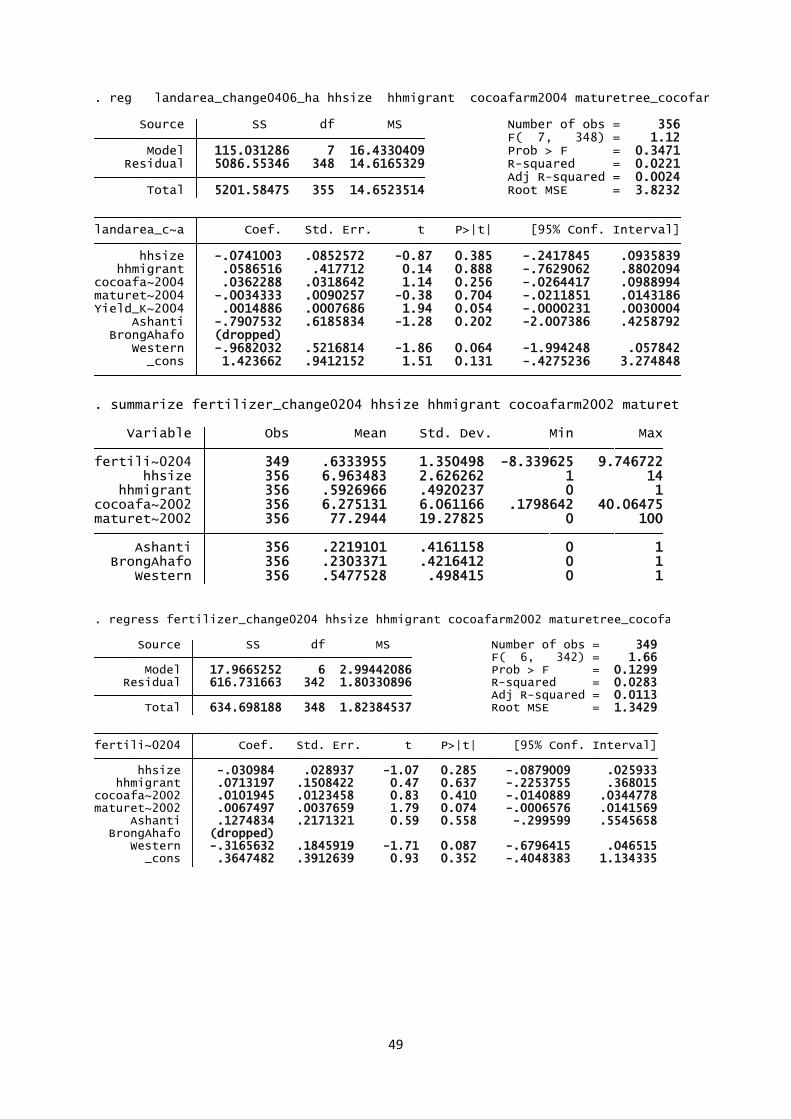
49
_cons 1.423662 .9412152 1.51 0.131 -.4275236 3.274848 Western -.9682032 .5216814 -1.86 0.064 -1.994248 .057842 BrongAhafo (dropped) Ashanti -.7907532 .6185834 -1.28 0.202 -2.007386 .4258792Yield_K~2004 .0014886 .0007686 1.94 0.054 -.0000231 .0030004maturet~2004 -.0034333 .0090257 -0.38 0.704 -.0211851 .0143186cocoafa~2004 .0362288 .0318642 1.14 0.256 -.0264417 .0988994 hhmigrant .0586516 .417712 0.14 0.888 -.7629062 .8802094 hhsize -.0741003 .0852572 -0.87 0.385 -.2417845 .0935839 landarea_c~a Coef. Std. Err. t P>|t| [95% Conf. Interval]
Total 5201.58475 355 14.6523514 Root MSE = 3.8232 Adj R-squared = 0.0024 Residual 5086.55346 348 14.6165329 R-squared = 0.0221 Model 115.031286 7 16.4330409 Prob > F = 0.3471 F( 7, 348) = 1.12 Source SS df MS Number of obs = 356
. reg landarea_change0406_ha hhsize hhmigrant cocoafarm2004 maturetree_cocofarm_pct2004 Yield_KgHa2004 Ashanti BrongAhafo Western
Western 356 .5477528 .498415 0 1 BrongAhafo 356 .2303371 .4216412 0 1 Ashanti 356 .2219101 .4161158 0 1 maturet~2002 356 77.2944 19.27825 0 100cocoafa~2002 356 6.275131 6.061166 .1798642 40.06475 hhmigrant 356 .5926966 .4920237 0 1 hhsize 356 6.963483 2.626262 1 14fertili~0204 349 .6333955 1.350498 -8.339625 9.746722 Variable Obs Mean Std. Dev. Min Max
. summarize fertilizer_change0204 hhsize hhmigrant cocoafarm2002 maturetree_cocofarm_pct2002 Ashanti BrongAhafo Western
_cons .3647482 .3912639 0.93 0.352 -.4048383 1.134335 Western -.3165632 .1845919 -1.71 0.087 -.6796415 .046515 BrongAhafo (dropped) Ashanti .1274834 .2171321 0.59 0.558 -.299599 .5545658maturet~2002 .0067497 .0037659 1.79 0.074 -.0006576 .0141569cocoafa~2002 .0101945 .0123458 0.83 0.410 -.0140889 .0344778 hhmigrant .0713197 .1508422 0.47 0.637 -.2253755 .368015 hhsize -.030984 .028937 -1.07 0.285 -.0879009 .025933 fertili~0204 Coef. Std. Err. t P>|t| [95% Conf. Interval]
Total 634.698188 348 1.82384537 Root MSE = 1.3429 Adj R-squared = 0.0113 Residual 616.731663 342 1.80330896 R-squared = 0.0283 Model 17.9665252 6 2.99442086 Prob > F = 0.1299 F( 6, 342) = 1.66 Source SS df MS Number of obs = 349
. regress fertilizer_change0204 hhsize hhmigrant cocoafarm2002 maturetree_cocofarm_pct2002 Ashanti BrongAhafo Western
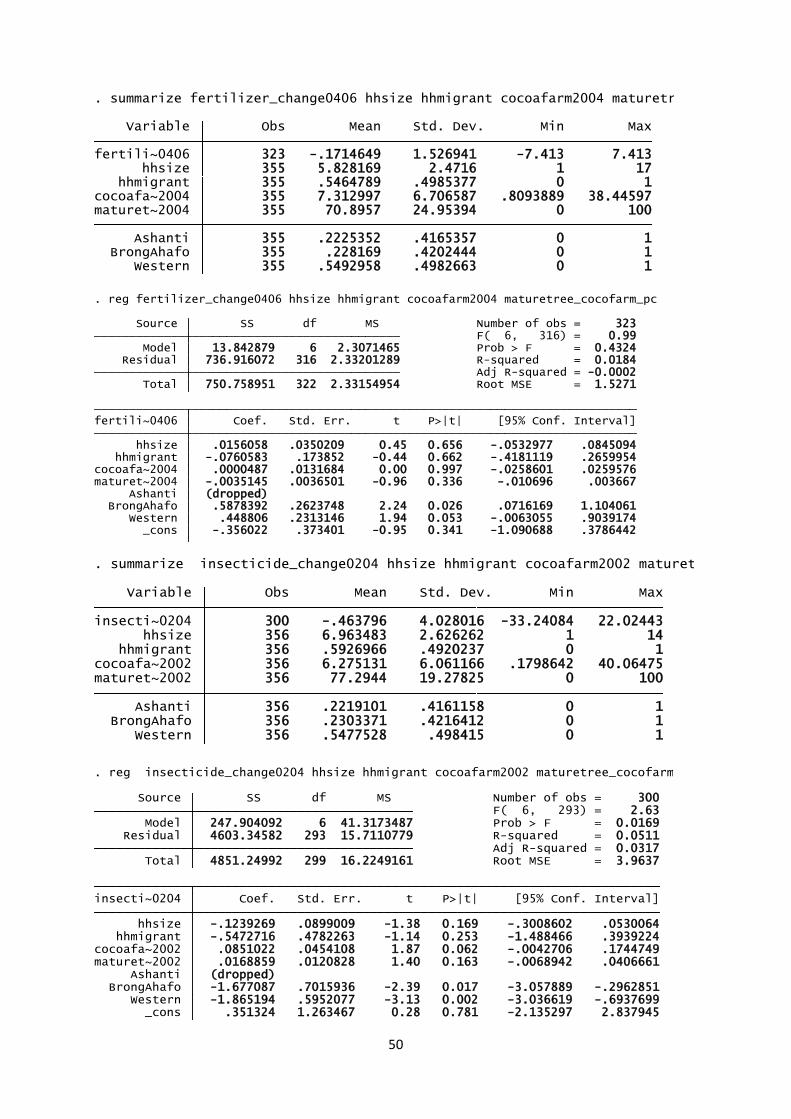
50
Western 355 .5492958 .4982663 0 1 BrongAhafo 355 .228169 .4202444 0 1 Ashanti 355 .2225352 .4165357 0 1 maturet~2004 355 70.8957 24.95394 0 100cocoafa~2004 355 7.312997 6.706587 .8093889 38.44597 hhmigrant 355 .5464789 .4985377 0 1 hhsize 355 5.828169 2.4716 1 17fertili~0406 323 -.1714649 1.526941 -7.413 7.413 Variable Obs Mean Std. Dev. Min Max
. summarize fertilizer_change0406 hhsize hhmigrant cocoafarm2004 maturetree_cocofarm_pct2004 Ashanti BrongAhafo Western
_cons -.356022 .373401 -0.95 0.341 -1.090688 .3786442 Western .448806 .2313146 1.94 0.053 -.0063055 .9039174 BrongAhafo .5878392 .2623748 2.24 0.026 .0716169 1.104061 Ashanti (dropped)maturet~2004 -.0035145 .0036501 -0.96 0.336 -.010696 .003667cocoafa~2004 .0000487 .0131684 0.00 0.997 -.0258601 .0259576 hhmigrant -.0760583 .173852 -0.44 0.662 -.4181119 .2659954 hhsize .0156058 .0350209 0.45 0.656 -.0532977 .0845094 fertili~0406 Coef. Std. Err. t P>|t| [95% Conf. Interval]
Total 750.758951 322 2.33154954 Root MSE = 1.5271 Adj R-squared = -0.0002 Residual 736.916072 316 2.33201289 R-squared = 0.0184 Model 13.842879 6 2.3071465 Prob > F = 0.4324 F( 6, 316) = 0.99 Source SS df MS Number of obs = 323
. reg fertilizer_change0406 hhsize hhmigrant cocoafarm2004 maturetree_cocofarm_pct2004 Ashanti BrongAhafo Western
Western 356 .5477528 .498415 0 1 BrongAhafo 356 .2303371 .4216412 0 1 Ashanti 356 .2219101 .4161158 0 1 maturet~2002 356 77.2944 19.27825 0 100cocoafa~2002 356 6.275131 6.061166 .1798642 40.06475 hhmigrant 356 .5926966 .4920237 0 1 hhsize 356 6.963483 2.626262 1 14insecti~0204 300 -.463796 4.028016 -33.24084 22.02443 Variable Obs Mean Std. Dev. Min Max
. summarize insecticide_change0204 hhsize hhmigrant cocoafarm2002 maturetree_cocofarm_pct2002 Ashanti BrongAhafo Western
_cons .351324 1.263467 0.28 0.781 -2.135297 2.837945 Western -1.865194 .5952077 -3.13 0.002 -3.036619 -.6937699 BrongAhafo -1.677087 .7015936 -2.39 0.017 -3.057889 -.2962851 Ashanti (dropped)maturet~2002 .0168859 .0120828 1.40 0.163 -.0068942 .0406661cocoafa~2002 .0851022 .0454108 1.87 0.062 -.0042706 .1744749 hhmigrant -.5472716 .4782263 -1.14 0.253 -1.488466 .3939224 hhsize -.1239269 .0899009 -1.38 0.169 -.3008602 .0530064 insecti~0204 Coef. Std. Err. t P>|t| [95% Conf. Interval]
Total 4851.24992 299 16.2249161 Root MSE = 3.9637 Adj R-squared = 0.0317 Residual 4603.34582 293 15.7110779 R-squared = 0.0511 Model 247.904092 6 41.3173487 Prob > F = 0.0169 F( 6, 293) = 2.63 Source SS df MS Number of obs = 300
. reg insecticide_change0204 hhsize hhmigrant cocoafarm2002 maturetree_cocofarm_pct2002 Ashanti BrongAhafo Western
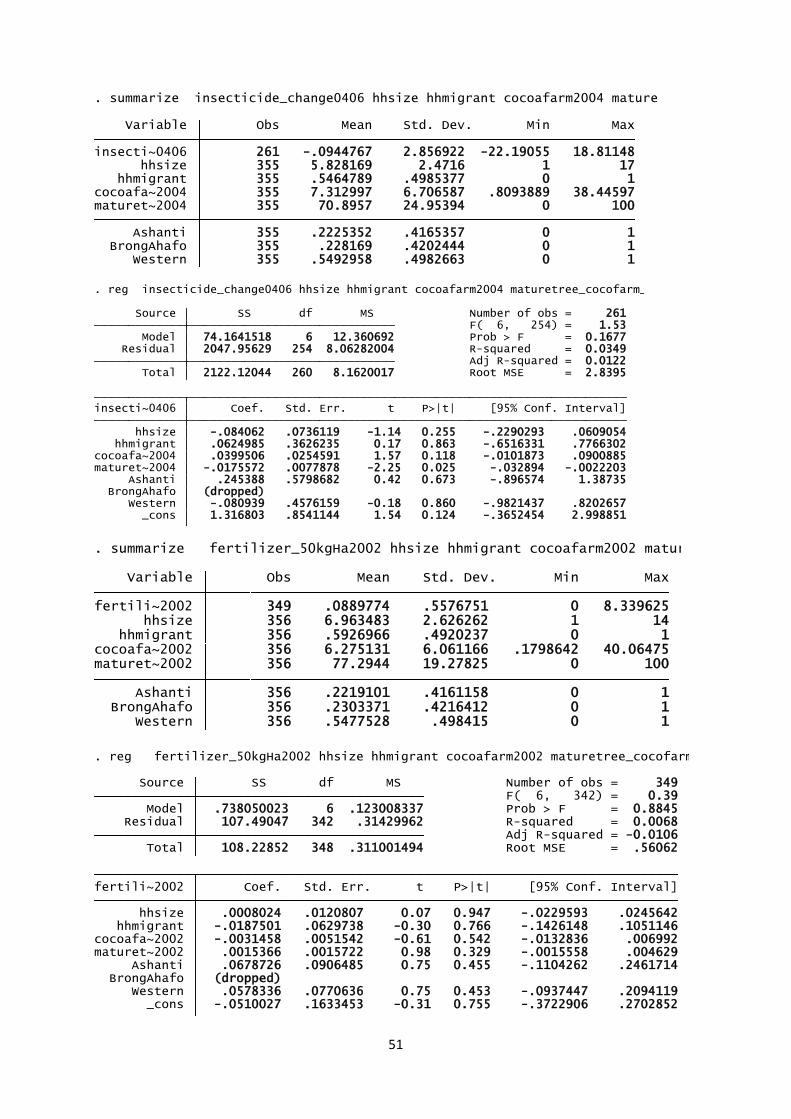
51
Western 355 .5492958 .4982663 0 1 BrongAhafo 355 .228169 .4202444 0 1 Ashanti 355 .2225352 .4165357 0 1 maturet~2004 355 70.8957 24.95394 0 100cocoafa~2004 355 7.312997 6.706587 .8093889 38.44597 hhmigrant 355 .5464789 .4985377 0 1 hhsize 355 5.828169 2.4716 1 17insecti~0406 261 -.0944767 2.856922 -22.19055 18.81148 Variable Obs Mean Std. Dev. Min Max
. summarize insecticide_change0406 hhsize hhmigrant cocoafarm2004 maturetree_cocofarm_pct2004 Ashanti BrongAhafo Western
_cons 1.316803 .8541144 1.54 0.124 -.3652454 2.998851 Western -.080939 .4576159 -0.18 0.860 -.9821437 .8202657 BrongAhafo (dropped) Ashanti .245388 .5798682 0.42 0.673 -.896574 1.38735maturet~2004 -.0175572 .0077878 -2.25 0.025 -.032894 -.0022203cocoafa~2004 .0399506 .0254591 1.57 0.118 -.0101873 .0900885 hhmigrant .0624985 .3626235 0.17 0.863 -.6516331 .7766302 hhsize -.084062 .0736119 -1.14 0.255 -.2290293 .0609054 insecti~0406 Coef. Std. Err. t P>|t| [95% Conf. Interval]
Total 2122.12044 260 8.1620017 Root MSE = 2.8395 Adj R-squared = 0.0122 Residual 2047.95629 254 8.06282004 R-squared = 0.0349 Model 74.1641518 6 12.360692 Prob > F = 0.1677 F( 6, 254) = 1.53 Source SS df MS Number of obs = 261
. reg insecticide_change0406 hhsize hhmigrant cocoafarm2004 maturetree_cocofarm_pct2004 Ashanti BrongAhafo Western
Western 356 .5477528 .498415 0 1 BrongAhafo 356 .2303371 .4216412 0 1 Ashanti 356 .2219101 .4161158 0 1 maturet~2002 356 77.2944 19.27825 0 100cocoafa~2002 356 6.275131 6.061166 .1798642 40.06475 hhmigrant 356 .5926966 .4920237 0 1 hhsize 356 6.963483 2.626262 1 14fertili~2002 349 .0889774 .5576751 0 8.339625 Variable Obs Mean Std. Dev. Min Max
. summarize fertilizer_50kgHa2002 hhsize hhmigrant cocoafarm2002 maturetree_cocofarm_pct2002 Ashanti BrongAhafo Western
_cons -.0510027 .1633453 -0.31 0.755 -.3722906 .2702852 Western .0578336 .0770636 0.75 0.453 -.0937447 .2094119 BrongAhafo (dropped) Ashanti .0678726 .0906485 0.75 0.455 -.1104262 .2461714maturet~2002 .0015366 .0015722 0.98 0.329 -.0015558 .004629cocoafa~2002 -.0031458 .0051542 -0.61 0.542 -.0132836 .006992 hhmigrant -.0187501 .0629738 -0.30 0.766 -.1426148 .1051146 hhsize .0008024 .0120807 0.07 0.947 -.0229593 .0245642 fertili~2002 Coef. Std. Err. t P>|t| [95% Conf. Interval]
Total 108.22852 348 .311001494 Root MSE = .56062 Adj R-squared = -0.0106 Residual 107.49047 342 .31429962 R-squared = 0.0068 Model .738050023 6 .123008337 Prob > F = 0.8845 F( 6, 342) = 0.39 Source SS df MS Number of obs = 349
. reg fertilizer_50kgHa2002 hhsize hhmigrant cocoafarm2002 maturetree_cocofarm_pct2002 Ashanti BrongAhafo Western
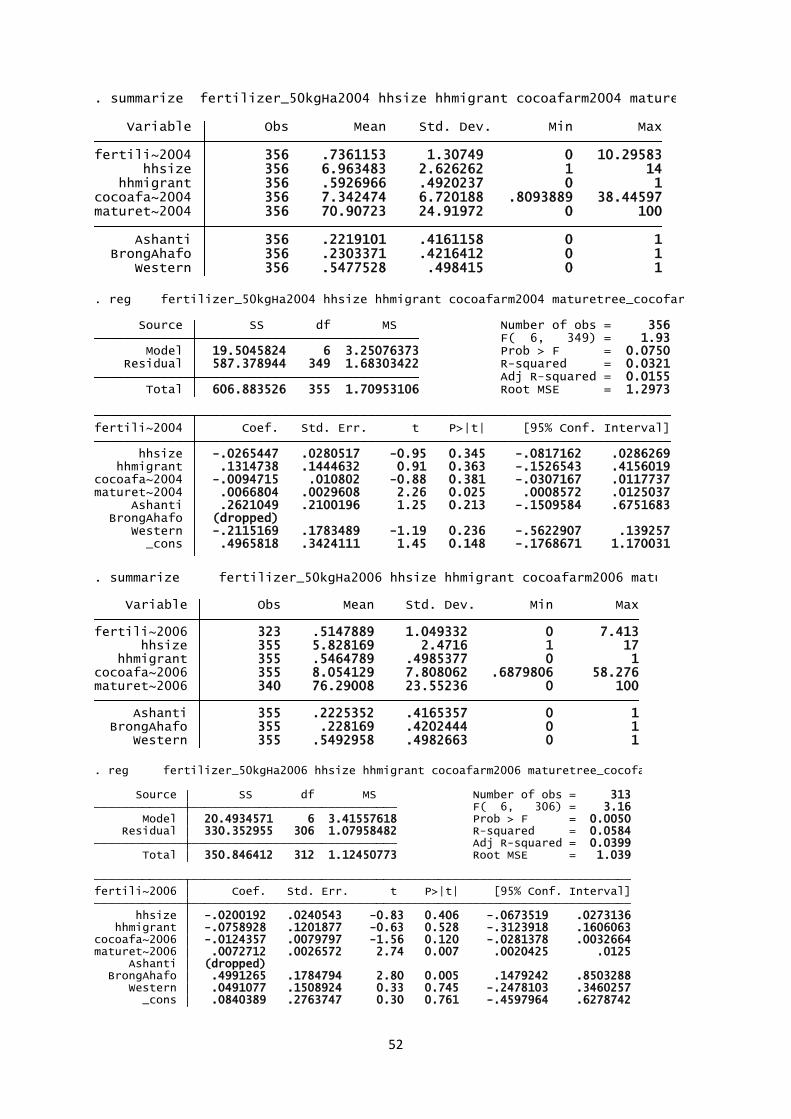
52
Western 356 .5477528 .498415 0 1 BrongAhafo 356 .2303371 .4216412 0 1 Ashanti 356 .2219101 .4161158 0 1 maturet~2004 356 70.90723 24.91972 0 100cocoafa~2004 356 7.342474 6.720188 .8093889 38.44597 hhmigrant 356 .5926966 .4920237 0 1 hhsize 356 6.963483 2.626262 1 14fertili~2004 356 .7361153 1.30749 0 10.29583 Variable Obs Mean Std. Dev. Min Max
. summarize fertilizer_50kgHa2004 hhsize hhmigrant cocoafarm2004 maturetree_cocofarm_pct2004 Ashanti BrongAhafo Western
_cons .4965818 .3424111 1.45 0.148 -.1768671 1.170031 Western -.2115169 .1783489 -1.19 0.236 -.5622907 .139257 BrongAhafo (dropped) Ashanti .2621049 .2100196 1.25 0.213 -.1509584 .6751683maturet~2004 .0066804 .0029608 2.26 0.025 .0008572 .0125037cocoafa~2004 -.0094715 .010802 -0.88 0.381 -.0307167 .0117737 hhmigrant .1314738 .1444632 0.91 0.363 -.1526543 .4156019 hhsize -.0265447 .0280517 -0.95 0.345 -.0817162 .0286269 fertili~2004 Coef. Std. Err. t P>|t| [95% Conf. Interval]
Total 606.883526 355 1.70953106 Root MSE = 1.2973 Adj R-squared = 0.0155 Residual 587.378944 349 1.68303422 R-squared = 0.0321 Model 19.5045824 6 3.25076373 Prob > F = 0.0750 F( 6, 349) = 1.93 Source SS df MS Number of obs = 356
. reg fertilizer_50kgHa2004 hhsize hhmigrant cocoafarm2004 maturetree_cocofarm_pct2004 Ashanti BrongAhafo Western
Western 355 .5492958 .4982663 0 1 BrongAhafo 355 .228169 .4202444 0 1 Ashanti 355 .2225352 .4165357 0 1 maturet~2006 340 76.29008 23.55236 0 100cocoafa~2006 355 8.054129 7.808062 .6879806 58.276 hhmigrant 355 .5464789 .4985377 0 1 hhsize 355 5.828169 2.4716 1 17fertili~2006 323 .5147889 1.049332 0 7.413 Variable Obs Mean Std. Dev. Min Max
. summarize fertilizer_50kgHa2006 hhsize hhmigrant cocoafarm2006 maturetree_cocofarm_pct2006 Ashanti BrongAhafo Western
_cons .0840389 .2763747 0.30 0.761 -.4597964 .6278742 Western .0491077 .1508924 0.33 0.745 -.2478103 .3460257 BrongAhafo .4991265 .1784794 2.80 0.005 .1479242 .8503288 Ashanti (dropped)maturet~2006 .0072712 .0026572 2.74 0.007 .0020425 .0125cocoafa~2006 -.0124357 .0079797 -1.56 0.120 -.0281378 .0032664 hhmigrant -.0758928 .1201877 -0.63 0.528 -.3123918 .1606063 hhsize -.0200192 .0240543 -0.83 0.406 -.0673519 .0273136 fertili~2006 Coef. Std. Err. t P>|t| [95% Conf. Interval]
Total 350.846412 312 1.12450773 Root MSE = 1.039 Adj R-squared = 0.0399 Residual 330.352955 306 1.07958482 R-squared = 0.0584 Model 20.4934571 6 3.41557618 Prob > F = 0.0050 F( 6, 306) = 3.16 Source SS df MS Number of obs = 313
. reg fertilizer_50kgHa2006 hhsize hhmigrant cocoafarm2006 maturetree_cocofarm_pct2006 Ashanti BrongAhafo Western
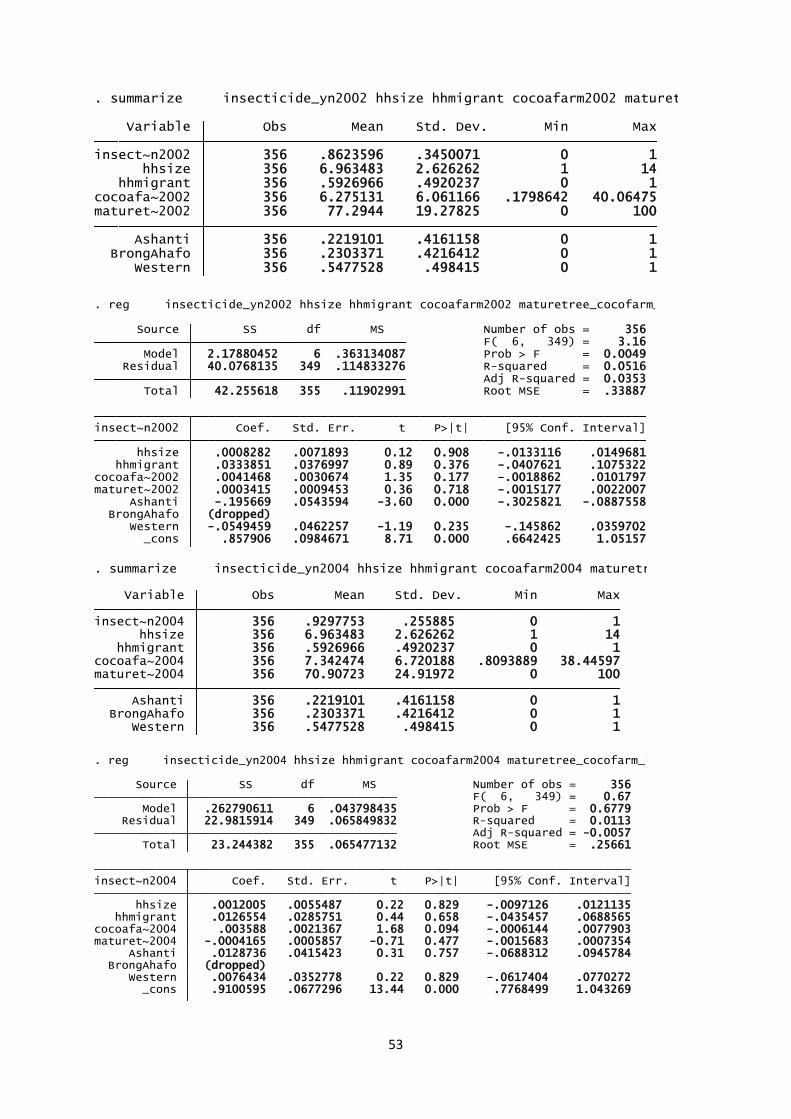
53
Western 356 .5477528 .498415 0 1 BrongAhafo 356 .2303371 .4216412 0 1 Ashanti 356 .2219101 .4161158 0 1 maturet~2002 356 77.2944 19.27825 0 100cocoafa~2002 356 6.275131 6.061166 .1798642 40.06475 hhmigrant 356 .5926966 .4920237 0 1 hhsize 356 6.963483 2.626262 1 14insect~n2002 356 .8623596 .3450071 0 1 Variable Obs Mean Std. Dev. Min Max
. summarize insecticide_yn2002 hhsize hhmigrant cocoafarm2002 maturetree_cocofarm_pct2002 Ashanti BrongAhafo Western
_cons .857906 .0984671 8.71 0.000 .6642425 1.05157 Western -.0549459 .0462257 -1.19 0.235 -.145862 .0359702 BrongAhafo (dropped) Ashanti -.195669 .0543594 -3.60 0.000 -.3025821 -.0887558maturet~2002 .0003415 .0009453 0.36 0.718 -.0015177 .0022007cocoafa~2002 .0041468 .0030674 1.35 0.177 -.0018862 .0101797 hhmigrant .0333851 .0376997 0.89 0.376 -.0407621 .1075322 hhsize .0008282 .0071893 0.12 0.908 -.0133116 .0149681 insect~n2002 Coef. Std. Err. t P>|t| [95% Conf. Interval]
Total 42.255618 355 .11902991 Root MSE = .33887 Adj R-squared = 0.0353 Residual 40.0768135 349 .114833276 R-squared = 0.0516 Model 2.17880452 6 .363134087 Prob > F = 0.0049 F( 6, 349) = 3.16 Source SS df MS Number of obs = 356
. reg insecticide_yn2002 hhsize hhmigrant cocoafarm2002 maturetree_cocofarm_pct2002 Ashanti BrongAhafo Western
Western 356 .5477528 .498415 0 1 BrongAhafo 356 .2303371 .4216412 0 1 Ashanti 356 .2219101 .4161158 0 1 maturet~2004 356 70.90723 24.91972 0 100cocoafa~2004 356 7.342474 6.720188 .8093889 38.44597 hhmigrant 356 .5926966 .4920237 0 1 hhsize 356 6.963483 2.626262 1 14insect~n2004 356 .9297753 .255885 0 1 Variable Obs Mean Std. Dev. Min Max
. summarize insecticide_yn2004 hhsize hhmigrant cocoafarm2004 maturetree_cocofarm_pct2004 Ashanti BrongAhafo Western
_cons .9100595 .0677296 13.44 0.000 .7768499 1.043269 Western .0076434 .0352778 0.22 0.829 -.0617404 .0770272 BrongAhafo (dropped) Ashanti .0128736 .0415423 0.31 0.757 -.0688312 .0945784maturet~2004 -.0004165 .0005857 -0.71 0.477 -.0015683 .0007354cocoafa~2004 .003588 .0021367 1.68 0.094 -.0006144 .0077903 hhmigrant .0126554 .0285751 0.44 0.658 -.0435457 .0688565 hhsize .0012005 .0055487 0.22 0.829 -.0097126 .0121135 insect~n2004 Coef. Std. Err. t P>|t| [95% Conf. Interval]
Total 23.244382 355 .065477132 Root MSE = .25661 Adj R-squared = -0.0057 Residual 22.9815914 349 .065849832 R-squared = 0.0113 Model .262790611 6 .043798435 Prob > F = 0.6779 F( 6, 349) = 0.67 Source SS df MS Number of obs = 356
. reg insecticide_yn2004 hhsize hhmigrant cocoafarm2004 maturetree_cocofarm_pct2004 Ashanti BrongAhafo Western
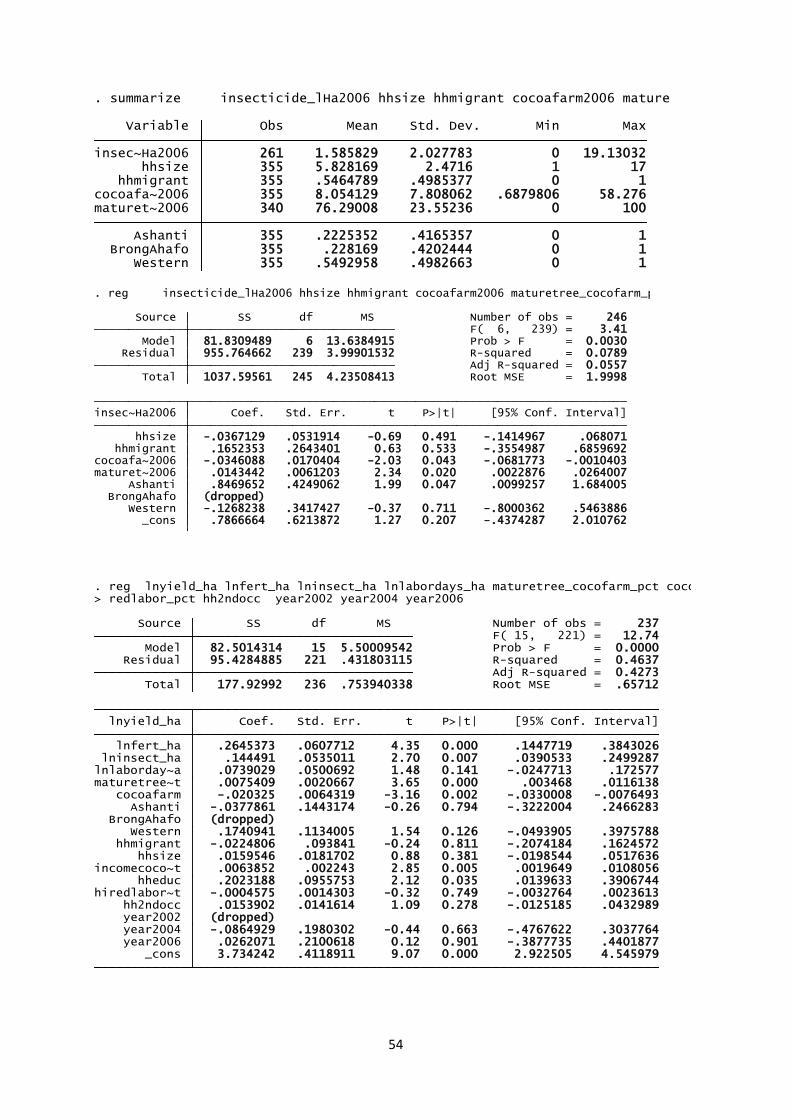
54
Western 355 .5492958 .4982663 0 1 BrongAhafo 355 .228169 .4202444 0 1 Ashanti 355 .2225352 .4165357 0 1 maturet~2006 340 76.29008 23.55236 0 100cocoafa~2006 355 8.054129 7.808062 .6879806 58.276 hhmigrant 355 .5464789 .4985377 0 1 hhsize 355 5.828169 2.4716 1 17insec~Ha2006 261 1.585829 2.027783 0 19.13032 Variable Obs Mean Std. Dev. Min Max
. summarize insecticide_lHa2006 hhsize hhmigrant cocoafarm2006 maturetree_cocofarm_pct2006 Ashanti BrongAhafo Western
_cons .7866664 .6213872 1.27 0.207 -.4374287 2.010762 Western -.1268238 .3417427 -0.37 0.711 -.8000362 .5463886 BrongAhafo (dropped) Ashanti .8469652 .4249062 1.99 0.047 .0099257 1.684005maturet~2006 .0143442 .0061203 2.34 0.020 .0022876 .0264007cocoafa~2006 -.0346088 .0170404 -2.03 0.043 -.0681773 -.0010403 hhmigrant .1652353 .2643401 0.63 0.533 -.3554987 .6859692 hhsize -.0367129 .0531914 -0.69 0.491 -.1414967 .068071 insec~Ha2006 Coef. Std. Err. t P>|t| [95% Conf. Interval]
Total 1037.59561 245 4.23508413 Root MSE = 1.9998 Adj R-squared = 0.0557 Residual 955.764662 239 3.99901532 R-squared = 0.0789 Model 81.8309489 6 13.6384915 Prob > F = 0.0030 F( 6, 239) = 3.41 Source SS df MS Number of obs = 246
. reg insecticide_lHa2006 hhsize hhmigrant cocoafarm2006 maturetree_cocofarm_pct2006 Ashanti BrongAhafo Western
_cons 3.734242 .4118911 9.07 0.000 2.922505 4.545979 year2006 .0262071 .2100618 0.12 0.901 -.3877735 .4401877 year2004 -.0864929 .1980302 -0.44 0.663 -.4767622 .3037764 year2002 (dropped) hh2ndocc .0153902 .0141614 1.09 0.278 -.0125185 .0432989hiredlabor~t -.0004575 .0014303 -0.32 0.749 -.0032764 .0023613 hheduc .2023188 .0955753 2.12 0.035 .0139633 .3906744incomecoco~t .0063852 .002243 2.85 0.005 .0019649 .0108056 hhsize .0159546 .0181702 0.88 0.381 -.0198544 .0517636 hhmigrant -.0224806 .093841 -0.24 0.811 -.2074184 .1624572 Western .1740941 .1134005 1.54 0.126 -.0493905 .3975788 BrongAhafo (dropped) Ashanti -.0377861 .1443174 -0.26 0.794 -.3222004 .2466283 cocoafarm -.020325 .0064319 -3.16 0.002 -.0330008 -.0076493maturetree~t .0075409 .0020667 3.65 0.000 .003468 .0116138lnlaborday~a .0739029 .0500692 1.48 0.141 -.0247713 .172577 lninsect_ha .144491 .0535011 2.70 0.007 .0390533 .2499287 lnfert_ha .2645373 .0607712 4.35 0.000 .1447719 .3843026 lnyield_ha Coef. Std. Err. t P>|t| [95% Conf. Interval]
Total 177.92992 236 .753940338 Root MSE = .65712 Adj R-squared = 0.4273 Residual 95.4284885 221 .431803115 R-squared = 0.4637 Model 82.5014314 15 5.50009542 Prob > F = 0.0000 F( 15, 221) = 12.74 Source SS df MS Number of obs = 237
> redlabor_pct hh2ndocc year2002 year2004 year2006. reg lnyield_ha lnfert_ha lninsect_ha lnlabordays_ha maturetree_cocofarm_pct cocoafarm Ashanti BrongAhafo Western hhmigrant hhsize incomecocoa_pct hheduc hi
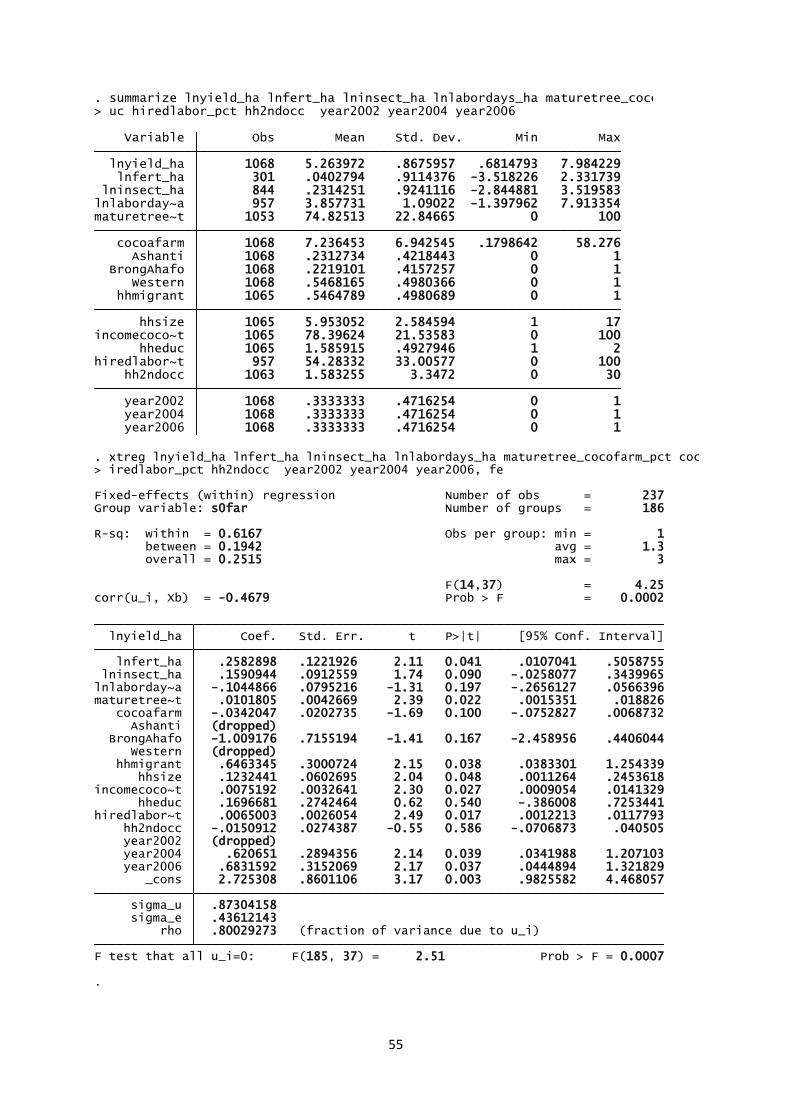
55
year2006 1068 .3333333 .4716254 0 1 year2004 1068 .3333333 .4716254 0 1 year2002 1068 .3333333 .4716254 0 1 hh2ndocc 1063 1.583255 3.3472 0 30hiredlabor~t 957 54.28332 33.00577 0 100 hheduc 1065 1.585915 .4927946 1 2incomecoco~t 1065 78.39624 21.53583 0 100 hhsize 1065 5.953052 2.584594 1 17 hhmigrant 1065 .5464789 .4980689 0 1 Western 1068 .5468165 .4980366 0 1 BrongAhafo 1068 .2219101 .4157257 0 1 Ashanti 1068 .2312734 .4218443 0 1 cocoafarm 1068 7.236453 6.942545 .1798642 58.276 maturetree~t 1053 74.82513 22.84665 0 100lnlaborday~a 957 3.857731 1.09022 -1.397962 7.913354 lninsect_ha 844 .2314251 .9241116 -2.844881 3.519583 lnfert_ha 301 .0402794 .9114376 -3.518226 2.331739 lnyield_ha 1068 5.263972 .8675957 .6814793 7.984229 Variable Obs Mean Std. Dev. Min Max
> uc hiredlabor_pct hh2ndocc year2002 year2004 year2006. summarize lnyield_ha lnfert_ha lninsect_ha lnlabordays_ha maturetree_cocofarm_pct cocoafarm Ashanti BrongAhafo Western hhmigrant hhsize incomecocoa_pct hhed
.
F test that all u_i=0: F(185, 37) = 2.51 Prob > F = 0.0007 rho .80029273 (fraction of variance due to u_i) sigma_e .43612143 sigma_u .87304158 _cons 2.725308 .8601106 3.17 0.003 .9825582 4.468057 year2006 .6831592 .3152069 2.17 0.037 .0444894 1.321829 year2004 .620651 .2894356 2.14 0.039 .0341988 1.207103 year2002 (dropped) hh2ndocc -.0150912 .0274387 -0.55 0.586 -.0706873 .040505hiredlabor~t .0065003 .0026054 2.49 0.017 .0012213 .0117793 hheduc .1696681 .2742464 0.62 0.540 -.386008 .7253441incomecoco~t .0075192 .0032641 2.30 0.027 .0009054 .0141329 hhsize .1232441 .0602695 2.04 0.048 .0011264 .2453618 hhmigrant .6463345 .3000724 2.15 0.038 .0383301 1.254339 Western (dropped) BrongAhafo -1.009176 .7155194 -1.41 0.167 -2.458956 .4406044 Ashanti (dropped) cocoafarm -.0342047 .0202735 -1.69 0.100 -.0752827 .0068732maturetree~t .0101805 .0042669 2.39 0.022 .0015351 .018826lnlaborday~a -.1044866 .0795216 -1.31 0.197 -.2656127 .0566396 lninsect_ha .1590944 .0912559 1.74 0.090 -.0258077 .3439965 lnfert_ha .2582898 .1221926 2.11 0.041 .0107041 .5058755 lnyield_ha Coef. Std. Err. t P>|t| [95% Conf. Interval]
corr(u_i, Xb) = -0.4679 Prob > F = 0.0002 F(14,37) = 4.25
overall = 0.2515 max = 3 between = 0.1942 avg = 1.3R-sq: within = 0.6167 Obs per group: min = 1
Group variable: s0far Number of groups = 186Fixed-effects (within) regression Number of obs = 237
> iredlabor_pct hh2ndocc year2002 year2004 year2006, fe. xtreg lnyield_ha lnfert_ha lninsect_ha lnlabordays_ha maturetree_cocofarm_pct cocoafarm Ashanti BrongAhafo Western hhmigrant hhsize incomecocoa_pct hheduc h
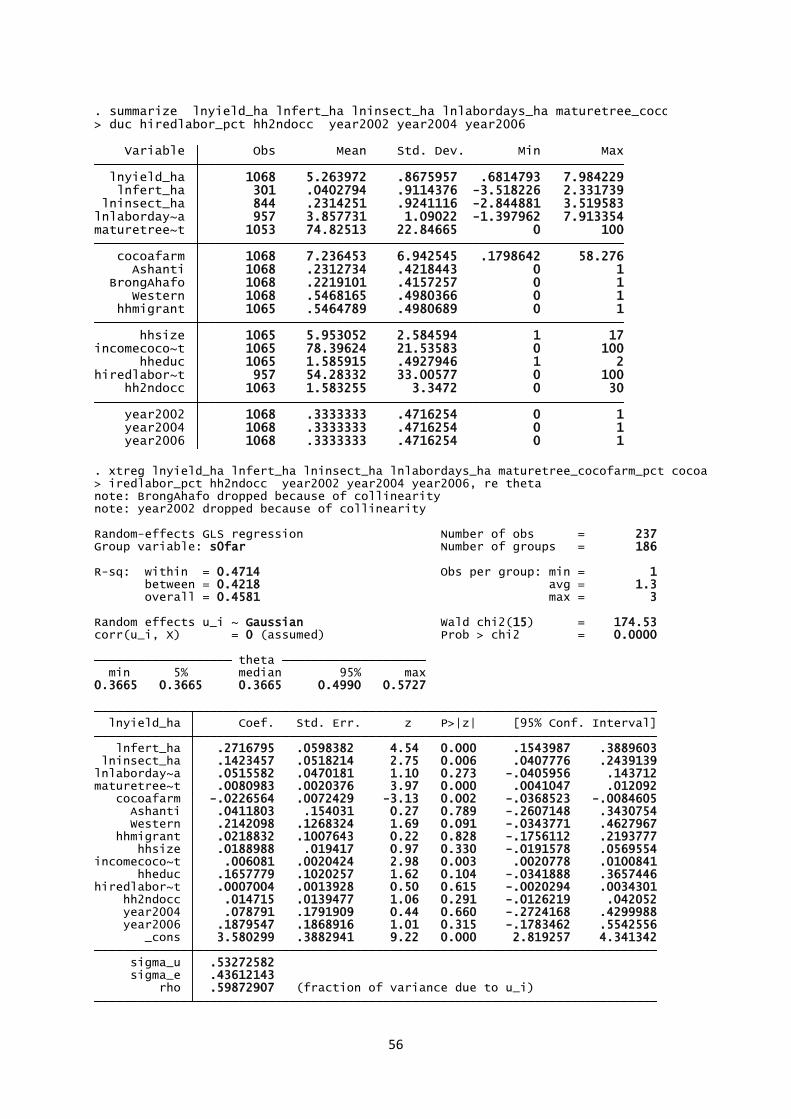
56
year2006 1068 .3333333 .4716254 0 1 year2004 1068 .3333333 .4716254 0 1 year2002 1068 .3333333 .4716254 0 1 hh2ndocc 1063 1.583255 3.3472 0 30hiredlabor~t 957 54.28332 33.00577 0 100 hheduc 1065 1.585915 .4927946 1 2incomecoco~t 1065 78.39624 21.53583 0 100 hhsize 1065 5.953052 2.584594 1 17 hhmigrant 1065 .5464789 .4980689 0 1 Western 1068 .5468165 .4980366 0 1 BrongAhafo 1068 .2219101 .4157257 0 1 Ashanti 1068 .2312734 .4218443 0 1 cocoafarm 1068 7.236453 6.942545 .1798642 58.276 maturetree~t 1053 74.82513 22.84665 0 100lnlaborday~a 957 3.857731 1.09022 -1.397962 7.913354 lninsect_ha 844 .2314251 .9241116 -2.844881 3.519583 lnfert_ha 301 .0402794 .9114376 -3.518226 2.331739 lnyield_ha 1068 5.263972 .8675957 .6814793 7.984229 Variable Obs Mean Std. Dev. Min Max
> duc hiredlabor_pct hh2ndocc year2002 year2004 year2006. summarize lnyield_ha lnfert_ha lninsect_ha lnlabordays_ha maturetree_cocofarm_pct cocoafarm Ashanti BrongAhafo Western hhmigrant hhsize incomecocoa_pct hhe
.
rho .59872907 (fraction of variance due to u_i) sigma_e .43612143 sigma_u .53272582 _cons 3.580299 .3882941 9.22 0.000 2.819257 4.341342 year2006 .1879547 .1868916 1.01 0.315 -.1783462 .5542556 year2004 .078791 .1791909 0.44 0.660 -.2724168 .4299988 hh2ndocc .014715 .0139477 1.06 0.291 -.0126219 .042052hiredlabor~t .0007004 .0013928 0.50 0.615 -.0020294 .0034301 hheduc .1657779 .1020257 1.62 0.104 -.0341888 .3657446incomecoco~t .006081 .0020424 2.98 0.003 .0020778 .0100841 hhsize .0188988 .019417 0.97 0.330 -.0191578 .0569554 hhmigrant .0218832 .1007643 0.22 0.828 -.1756112 .2193777 Western .2142098 .1268324 1.69 0.091 -.0343771 .4627967 Ashanti .0411803 .154031 0.27 0.789 -.2607148 .3430754 cocoafarm -.0226564 .0072429 -3.13 0.002 -.0368523 -.0084605maturetree~t .0080983 .0020376 3.97 0.000 .0041047 .012092lnlaborday~a .0515582 .0470181 1.10 0.273 -.0405956 .143712 lninsect_ha .1423457 .0518214 2.75 0.006 .0407776 .2439139 lnfert_ha .2716795 .0598382 4.54 0.000 .1543987 .3889603 lnyield_ha Coef. Std. Err. z P>|z| [95% Conf. Interval]
0.3665 0.3665 0.3665 0.4990 0.5727 min 5% median 95% max theta
corr(u_i, X) = 0 (assumed) Prob > chi2 = 0.0000Random effects u_i ~ Gaussian Wald chi2(15) = 174.53
overall = 0.4581 max = 3 between = 0.4218 avg = 1.3R-sq: within = 0.4714 Obs per group: min = 1
Group variable: s0far Number of groups = 186Random-effects GLS regression Number of obs = 237
note: year2002 dropped because of collinearitynote: BrongAhafo dropped because of collinearity> iredlabor_pct hh2ndocc year2002 year2004 year2006, re theta. xtreg lnyield_ha lnfert_ha lninsect_ha lnlabordays_ha maturetree_cocofarm_pct cocoafarm Ashanti BrongAhafo Western hhmigrant hhsize incomecocoa_pct hheduc h
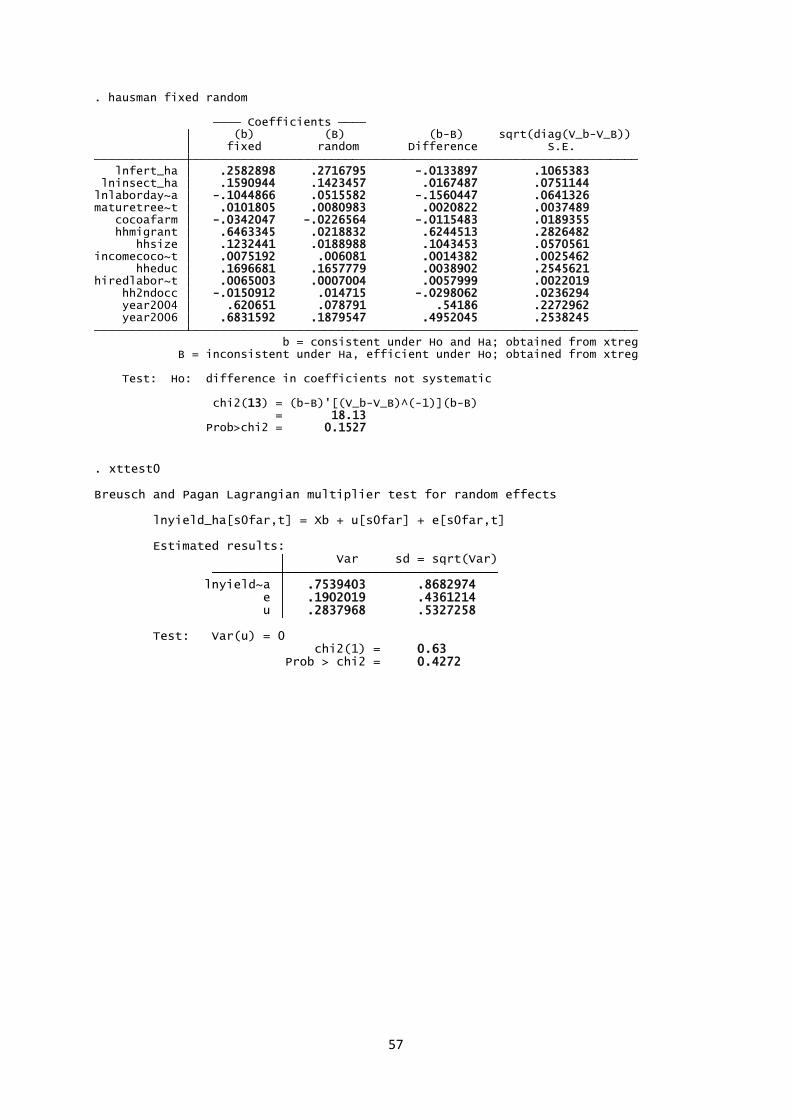
57
Prob>chi2 = 0.1527 = 18.13 chi2(13) = (b-B)'[(V_b-V_B)^(-1)](b-B)
Test: Ho: difference in coefficients not systematic
B = inconsistent under Ha, efficient under Ho; obtained from xtreg b = consistent under Ho and Ha; obtained from xtreg year2006 .6831592 .1879547 .4952045 .2538245 year2004 .620651 .078791 .54186 .2272962 hh2ndocc -.0150912 .014715 -.0298062 .0236294hiredlabor~t .0065003 .0007004 .0057999 .0022019 hheduc .1696681 .1657779 .0038902 .2545621incomecoco~t .0075192 .006081 .0014382 .0025462 hhsize .1232441 .0188988 .1043453 .0570561 hhmigrant .6463345 .0218832 .6244513 .2826482 cocoafarm -.0342047 -.0226564 -.0115483 .0189355maturetree~t .0101805 .0080983 .0020822 .0037489lnlaborday~a -.1044866 .0515582 -.1560447 .0641326 lninsect_ha .1590944 .1423457 .0167487 .0751144 lnfert_ha .2582898 .2716795 -.0133897 .1065383 fixed random Difference S.E. (b) (B) (b-B) sqrt(diag(V_b-V_B)) Coefficients
. hausman fixed random
Prob > chi2 = 0.4272 chi2(1) = 0.63 Test: Var(u) = 0
u .2837968 .5327258 e .1902019 .4361214 lnyield~a .7539403 .8682974 Var sd = sqrt(Var) Estimated results:
lnyield_ha[s0far,t] = Xb + u[s0far] + e[s0far,t]
Breusch and Pagan Lagrangian multiplier test for random effects
. xttest0