Embed Size (px)
Citation preview
Intelligent hemodialysis: Toys or tools?
Stewart LAMBIE,1 Graham WARWICK2
1Department of Renal Medicine, Raigmore Hospital, NHS Highland, Inverness, UK; 2Department ofNephrology, Leicester General Hospital, Leicester, UK
AbstractHemodialysis technology has advanced significantly in recent years, with a variety of new techni-
ques for optimizing treatment now available. It remains to be seen which of these techniques prove
to be of significant benefit and which are useful only within the confines of research projects. Some
of the recent developments in technology are examined here.
Key words: Hemodialysis, monitoring, vascular access, blood volume, adequacy
INTRODUCTION
Hemodialysis therapy is an excellent example of the use
of medical technology to sustain life from previously fatal
diseases.1 However, the treatment regimes are remarkablycrude and empirical. With older and more frail patients
starting renal replacement therapy, many patients experi-
ence problems (e.g., intradialytic symptoms, failure of
vascular access) for which further technological advances
may be able to offer solutions.
In this article, we present a narrative review of the
techniques and evidence of effectiveness for:
� access flow monitoring;
� blood volume monitoring; and
� ionic dialysance to measure urea clearance.
ACCESS FLOW MONITORING
The early prediction that vascular access would be the
Achilles’ heel of hemodialysis has proved to be depress-
ingly accurate. There is significant patient morbidity and
costs associated with problems relating to vascular access.
It is widely accepted that a native arteriovenous fistula(AVF) provides the best long-term access for dialysis but
the use of AVF among prevalent hemodialysis varies from
91% in Japan to 68% in the United Kingdom and only
31% in the United States. The low prevalence in the
United States reflects the high historical use of arteriove-
nous grafts (AVG), although this is changing. Arteriove-
nous grafts are more prone to thrombosis than AVF andthis has prompted interest in methods of monitoring
access devices to try to predict and prevent thrombosis.
The U.S. DOQI guidelines2 recommend monitoring of
vascular access by clinical assessment and a surveillance
program based on pressure or flow measurements with
diagnostic testing, followed by angioplasty or surgery if
there is evidence of a developing stenosis.
Surveillance can be carried out by measuring changesin static or dynamic venous pressure or by changes in
access flow. This article will only consider flow measure-
ments as recommended by the recently published Euro-
pean Best Practice Guidelines.3 A number of methods are
available for measuring flow in a vascular access device
(Table 1).
The technique that has been most widely used is based
on changes in ultrasound transit time through a columnof blood in the dialysis tubing.4 The rate of transmission
of the ultrasound wave through a medium is dependent
on the density of that medium. In blood, this is governed
by the hematocrit and the protein concentration. Changes
in the density induced by a saline bolus cause a change in
ultrasound transmission rate proportional to the dilution.
This technique is analogous to indicator dilution methods
used for many years for measurement of flow.This technique can be used to measure both recircu-
lation of blood in an access device and the total accessCorrespondence to: S. Lambie.E-mail: [email protected]
Hemodialysis International 2007; 11:S34–S38
r 2007 The Authors. Journal compilation r 2007 International Society for HemodialysisS34

flow (Qa) during dialysis (Figure 1). Two ultrasound
transmitters/receivers are clipped to the tubing taking
blood to and from the patient. With the conventional
setup, a bolus of saline is introduced into the return (‘‘ve-nous’’) line, which causes a change in the transmission
rate vs. time curve in the sensor. If there is no recircula-
tion, none of the saline bolus is drawn back to the ‘‘ar-
terial’’ needle and there is no signal at the second sensor.
If there is recirculation, the ratio of the integrated areas
under the curve gives a measure of the percentage recir-
culation. However, this is an insensitive way of detecting
imminent access failure as recirculation only occurswhere the pump speed is greater than the access flow,
by which time the access device is nearly failed.
By creating artificial recirculation by reversing the inlet
and outlet lines from the patient to the dialyzer, a measure
of Qa can be obtained. The saline bolus mixes completely
with the blood flowing in the access. At higher Qa, less of
the saline will be recirculated to the dialyzer. The ratio of
the signal at the 2 sensors can be used to measure theblood flow in the access device.
This technique for measuring access flow has been wellvalidated and is reproducible. However, care must be
taken in AVF where there are multiple collateral vessels
between needles. Hemodynamic changes during dialysis
with falling systemic blood pressure will also lead to
changes in access flow.
The rationale for systematic surveillance of vascular
access is based on 2 premises:
1. Serial measurement of access blood flow accurately
predicts future thrombosis.2. Prophylactic and timely intervention by angioplasty
(or surgery) can prolong the life of the vascular access
and result in fewer procedures and morbid events
and decrease costs.
Early studies suggested that flow measurements accu-
rately predicted thrombosis, particularly in AVG. How-
ever, an analysis of the published studies up to 1998
concluded that there was no convincing evidence that asingle access flow measurement could accurately predict
graft thrombosis or failure.5 McCarley6 reported that an
intensive serial monitoring with ultrasound dilution flow
measurements could improve graft survival compared
with historical data. But this was associated with a 6-fold
increase in intervention by angioplasty. Tessitore7 also
showed similar positive results in native AVF. Absolute
flow measurements of between 500 and 600 mL/min orreductions in flow of 25% to values o1000 mL/min were
proposed as indicators for further imaging of access.
However, more recently, other small randomized stud-
ies8,9 and cohort studies10 have failed to show a benefit of
Qa monitoring and this has led to uncertainty over the
role of flow monitoring. Unfortunately, there is no ade-
quately powered randomized study to guide clinical prac-
tice. As the technology is costly in terms of equipmentpurchasing and time to perform the measurements, this is
badly needed.
BLOOD VOLUME MONITORING
Intradialytic hypotension complicates up to 30% of
hemodialysis sessions. This is uncomfortable and poten-tially dangerous for patients. Many factors contribute to
falls in blood pressure (see Table 2) but a reduction in
intravascular blood volume due to ultrafiltration is an
important factor. The change in blood volume during di-
alysis is the net effect of the ultrafiltration rate and the
plasma refilling rate from the interstitial compartment.
Changes in relative blood volume can be calculated
from changes in the hematocrit or in the protein concen-
Table 1 Methods for measuring vascular access blood flow
Indirect measurementUltrasound velocity dilution (i.e., Transonics, Uxbridge,
UK)Ionic dialysanceThermal dilutionContinuous glucose infusion
Direct measurements of flow by doppler ultrasoundNewer techniques
TranscutaneousIntraaccess flow meters
Figure 1 Device for measuring access blood flow and recir-culation.
Intelligent hemodialysis
Hemodialysis International 2007; 11:S34–S38 S35
tration of the blood. A continuous readout of this can be
displayed by:
� optical methods based on the adsorption and scatter-ing of one or more light wavelengths by erythrocytes
(e.g., Crit-line);
� ultrasound transmission rate, which varies with the
density of the blood, mainly reflecting changes in
protein concentration (e.g., Fresenius blood volume
monitor).
The technique has been used now for many years and
much of the initial work focused on 2 areas. The Crit-linemachine was promoted with the idea that each patient
has a critical blood volume reduction that consistently
predicts a fall in BP independent of other factors, e.g.,
ultrafiltration rate, dialysis time, intradialytic weight
gain.11 However, this is surprising, given the range of
factors that may contribute to intradialytic hypotension
(Table 2).
Lopot et al.12 described a series of relative blood vol-ume vs. time curves that have been used to help the de-
termination of dry weight and to allow manual alteration
of ultrafiltration rate during dialysis. A flat or rising
relative blood volume curve suggests overhydration and
may be an indicator to reduce target weight. A rapidly
decreasing blood volume (48%/hr) suggests excessive
fluid removal and is likely to lead to hypotension. Lopot
suggested that the ideal curve demonstrates a more gentle
reduction in blood volume, with a final decrease of 10%to 15%.
These patterns were used in a pragmatic, multicenter
study to determine the effectiveness of blood volume
monitoring in everyday clinical practice.13 Four hundred
and forty-three patients in 10 North American dialysis
centers were randomized to conventional monitoring or
the use of Crit-line monitoring to guide fluid removal.
The Crit-line group had a significantly higher risk ofnonaccess-related hospitalization (relative risk 1.61) and
of death (standardized mortality rate 0.77 vs. 0.26).
These results were surprising and difficult to explain.
The conventional care arm had a much lower hospital-
ization and mortality rate compared with USRDS data.
This study provided dialysis staff with an algorithm for
manually adjusting the ultrafiltration rate in response to
changes in the blood volume vs. time curve. However, useof this was not mandated and staff could make other
changes at their own discretion.
There are now a number of systems produced by di-
alysis companies that incorporate algorithms linking
blood volume changes to alteration in ultrafiltration rate
and other parameters that are designed to minimize rapid
changes in blood volume. An example is the Fresenius
blood volume monitor (Bad Hamburg, Germany), whichis an optional module. This uses an inline cuvette in the
blood line and ultrasound dilution technology to measure
changes in blood volume. This is automatically linked to
ultrafiltration rate so that blood volume will not fall below
an operator-determined reduction in blood volume (anal-
ogous to the critical blood volume). The initial ultrafil-
tration rate starts at twice the required ultrafiltration to
achieve the desired weight loss in the prescribed time anddeclines to zero by the end of dialysis.
The concept of using biofeedback to prevent intradi-
alytic hypotension is taken a step further by the Hemo-
controlTM device (Hospal, Minandola, Italy). This also has
as its input the patient’s blood volume, but the desired
outcome is a trajectory of blood volume change over the
course of the hemodialysis session, the aim being to
produce a smooth blood volume trace, achieving thisby manipulating both the dialysate conductivity and
ultrafiltration rate. Several studies of this technique
have demonstrated a reduction in intradialytic hypo-
tensive episodes.14–16
ONLINE CLEARANCE
Small-molecule clearance on dialysis is known to corre-
late with mortality17 and also to have considerable vari-
ability between dialysis sessions,18 implying that more
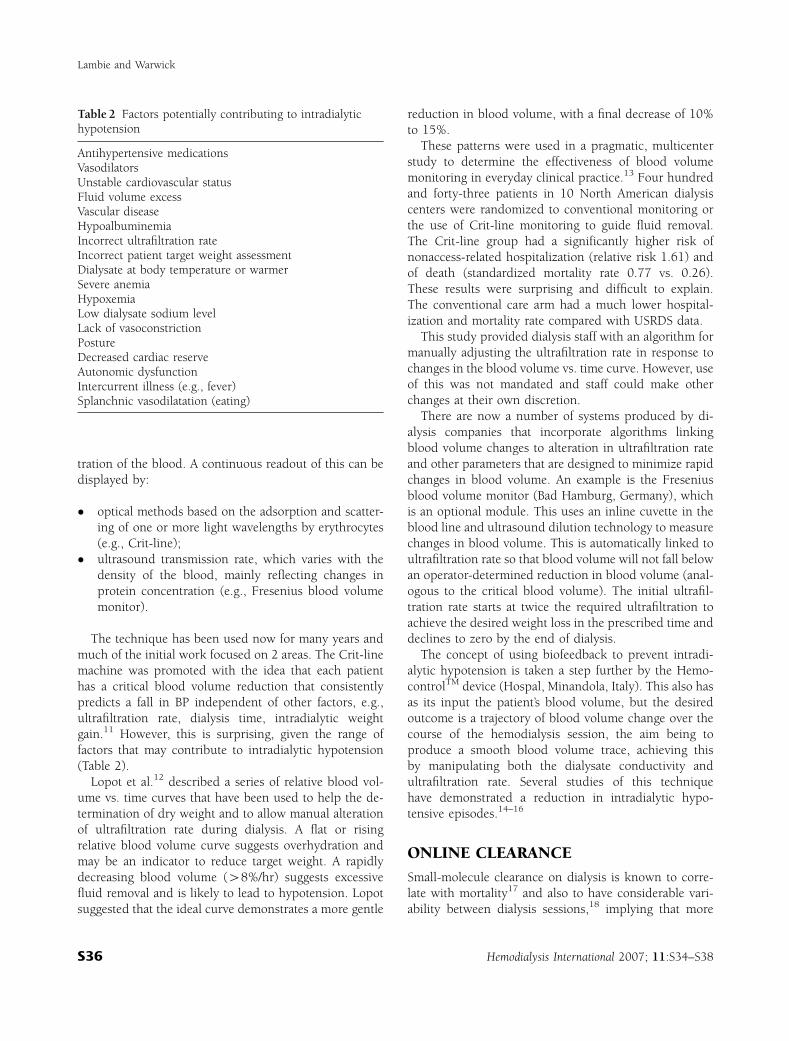
Table 2 Factors potentially contributing to intradialytichypotension
Antihypertensive medicationsVasodilatorsUnstable cardiovascular statusFluid volume excessVascular diseaseHypoalbuminemiaIncorrect ultrafiltration rateIncorrect patient target weight assessmentDialysate at body temperature or warmerSevere anemiaHypoxemiaLow dialysate sodium levelLack of vasoconstrictionPostureDecreased cardiac reserveAutonomic dysfunctionIntercurrent illness (e.g., fever)Splanchnic vasodilatation (eating)
Lambie and Warwick
Hemodialysis International 2007; 11:S34–S38S36
frequent online monitoring of urea clearance might beuseful.
One method for achieving this relies on ionic dial-
ysance (which is the value of the dialysance of electrolytes
corrected for ultrafiltration and recirculation) measure-
ments taken at repeated intervals throughout dialysis.
Two conductivity meters are required, monitoring inlet
and outlet dialysate conductivity, or alternatively a single
meter, operating alternately at the inlet and outlet. Thechanges in waste dialysate conductivity in response to
defined perturbations of inlet dialysate conductivity allow
ionic dialysance and plasma conductivity to be calculated.
Because conductivity is related to ion concentration, it is
possible to substitute one for the other in further calcu-
lations. As the transfer characteristics of sodium and urea
are similar, the ionic dialysance reflects the clearance of
urea (corrected for recirculation). This can then be ex-pressed as Kt/V using a value for V entered into the model
by the clinician. Diascan from Hospal and the Online
Clearance Monitor from Fresenius are both based on this
principle.19,20
Measurement of Kt/V with this method has been
shown to correlate closely with urea-based measure-
ments, with less than a 5% absolute difference.21
Furthermore, these methods provide a measurement ofsodium removal during dialysis, as well as a measurement
of plasma conductivity (directly related to plasma sodium
concentration) throughout dialysis. For these techniques,
however, V (patient urea distribution volume) must be
estimated to arrive at Kt/V, introducing a further element
of potential error, as current methods for measuring V are
either cumbersome and impractical on a routine basis,
such as measurement of the volume of distribution ofdeuterium, or they are derived from simple anthropo-
morphic data and are hence less accurate (e.g., the Wat-
son formula).22
A further criticism of conductivity-derived Kt/V mea-
surements is that the brief period of increased dialysate
conductivity may alter plasma conductivity, particularly if
there is a high degree of access recirculation. As the cal-
culation of ionic dialysance from these measurements re-lies on the assumption that plasma conductivity remains
stable during the measurement period, this alteration in
plasma conductivity could have a small but significant
impact on the accuracy of the measurement. Indeed, it
may be sufficient to account for a large proportion of the
5% discrepancy usually found between plasma-based
Kt/V and ionic dialysance-derived Kt/V. A refinement of
the technique using dynamic bolus measurement maycircumvent this problem and increase accuracy still
further.20
CONCLUSION
The techniques described above have all been shown to
achieve their primary aims. We can use online techniques
for monitoring vascular access function, monitoring rel-
ative blood volume changes, and tracking urea clearance.
The translation of these achievements into hard clinicaloutcomes that are beneficial to patients is more difficult to
demonstrate. Biofeedback control systems can reduce int-
radialytic hypotension, but otherwise the evidence is
lacking. On the other hand, these online systems have a
minimal increased cost of consumables, and many of the
systems do not need any increase in nursing time to im-
plement them. Increasing technical sophistication offers
hope of improving the quality of dialysis, reducing intra-dialytic symptoms, and maintaining vascular access. The
challenge for nephrologists and multidisciplinary dialysis
teams is to evaluate the technology more thoroughly
and learn how to use it optimally for the benefit of our
patients.
REFERENCES
1 Le Fanu J. The Rise and Fall of Modern Medicine. London:Abacus; 1999, p. 218.
2 National kidney foundation—K/DOQI clinical practiceguidelines for vascular access 2000. Am J Kidney Dis.2000; 37:S137–S180 (www.kidney.org/professionals/kdoqi/guidelines.cfm).
3 Tordoir J, Canaud B, Haage P, et al. European best prac-tice guidelines on haemodialysis. Nephrol Dial Transplant.2007; 22(Suppl 2):ii88–ii117.
4 Kritviski NM. Theory and validation of access flow mea-surements by dilution technique during haemodialysis.Kidney Int. 1995; 48:244–250.
5 Paulson WD, Ram SJ, Birk CG, Work J. Does blood flowaccurately predict thrombosis or failure of hemodialysissynthetic grafts? A meta-analysis. Am J Kidney Dis. 1999;34:478–485.
6 McCarley P, Wingaard R, Shyr Y, et al. Vascular accessblood flow monitoring reduces access morbidity andcosts. Kidney Int. 2001; 60:1164–1172.
7 Tessitore N, Bedogna V, Gammaro L, et al. Diagnosticaccuracy of ultrasound dilution access blood flowmeasurements and detecting stenosis and predict-ing thrombosis in native forearm arteriovenousfistulae for haemodialysis. Am J Kidney Dis. 2003; 42:331–341.
8 Moist LM, Churchill DN, House AA, et al. Regular mon-itoring of access flow compared with monitoring ofvenous pressure fails to improve graft survival. J AmSoc Nephrol. 2003; 14:2645–2653.
Intelligent hemodialysis
Hemodialysis International 2007; 11:S34–S38 S37

9 Ram SJ, Work J, Caldito GC, et al. A randomized con-trolled trial of blood flow and stenosis surveillance ofhemodialysis grafts. Kidney Int. 2003; 64:272–280.
10 Shahin H, Reddy G, Sharafuddin M, et al. Monthly accessflow monitoring with increased prophylactic angioplastydid not improve fistula patency. Kidney Int. 2005;68:2352–2361.
11 Steuer RR, Leypoldt JK, Cheung AK, et al. Reducingsymptoms during haemodialysis by continuously moni-toring the haematocrit. Am J Kidney Dis. 1996; 27:525–532.
12 Lopot F, Kotyk P, Blaha J, et al. Use of continuous bloodvolume monitoring to detect inadequately high dryweight. Int J Artif Org. 1996; 19:411–414.
13 Reddan DR, Szczech LA, Hasselblad V, et al. Intradialyticblood volume monitoring in ambulatory hemodialysispatients: A randomized trail. J Am Soc Nephrol. 2005;16:2162–2169.
14 Santoro A, Mancini E, Basile C, et al. Blood volume con-trolled haemodialysis in hypotension-prone patients: Arandomised multi-center controlled trial. Kidney Int.2002; 62:1034–1045.
15 McIntyre CW, Lambie SH, Fluck RJ. Biofeedback con-trolled haemodialysis (BF-HD) reduces symptoms andincrease both haemodynamic tolerability and dialysis
adequacy in non-hypotension prone stable patients. ClinNephrol. 2003; 60:105–112.
16 Ronco C, Brendolan A, Milan M, et al. Impact of biofeed-back-induced cardiovascular stability on haemodialysistolerance and efficiency. Kidney Int. 2000; 58:800–808.
17 Gotch FA, Sargent JA. A mechanistic analysis of thenational cooperative dialysis study (NCDS). Kidney Int.1985; 28:526–534.
18 Lambie SH, Taal MW, Fluck RJ, McIntyre CW. Analysisof factors associated with variability in haemodialysisadequacy. Nephrol Dial Transplant. 2004; 19:406–412.
19 Di Filippo S, Andrulli S, Manzoni C, et al. On-line assess-ment of delivered dialysis dose. Kidney Int. 1998;54:263–267.
20 Goldau R, Kuhlmann U, Samadi N, et al. Ionic dialysancemeasurement is urea distribution volume dependent: A newapproach to better results. Artif Organs. 2002; 26:321–332.
21 Petitclerc T, Goux N, Reynier AL, Bene B. A model fornon-invasive estimation of in vivo dialyzer performancesand patient’s conductivity during hemodialysis. Int J ArtifOrgans. 1993; 8:585–591.
22 Watson PE, Watson ID, Batt RD. Total body water vol-umes for adult male and females estimated from simpleanthropometric measurements. Am J Clin Nutr. 1980;33:27–39.
Lambie and Warwick
Hemodialysis International 2007; 11:S34–S38S38