Embed Size (px)
Citation preview

International Journal of Interactive Multimedia and Artificial Intelligence, Vol. 1, Nº 1, ISSN 1989-1660 31
Summary — IGC (Intelligent Garbage Classifier) is a system for visual classification and separation of solid waste products. Currently, an important part of the separation effort is based on manual work, from household separation to industrial waste management. Taking advantage of the technologies currently available, a system has been built that can analyze images from a camera and control a robot arm and conveyor belt to automatically separate different kinds of waste.
Keywords— Waste management, computer vision, object detection, object classification, robot control, robotics, recycling, garbage classification.
I.INTRODUCTION
The environmental problems and its treatment go back to the 15th century. Till then the rural society had not exceeded the capacity of the nature to be regenerated. It was necessary to wait until the 60s and 70s in order that the world began to arouse seriously on the real scope of the problem. The conference of Stockholm of the United Nations supposed a historical milestone, since it demonstrated for the first time the world worry for a problem related to the ecology. From then on, they did not stop repeating similar national and international manifestations. But it was in the 80s when the world realized the real problem: the migration of the field to the cities.
To work correctly a hectare of city needs hundreds of Ht of sea, rivers, forests and fields. In the last two centuries the world population has increased unstoppably, passing from 1 billion inhabitants in 1800 to more than 6 billion today. This situation has gone, undoubtedly, accompanied of a growth of the energetic consumption of 6,000 %.
At present, many countries and organizations carry out and support measures to correct the long-term situation. Is necessary to stand out the European model, which uses its power and representation to impose environmental obligations both to the member states and to the companies that act inside the area of the European Union. Among these obligations it emphasizes taking responsibility of the generated residues, being based on the principle: “the one who contaminates pays”
In spite of these efforts the problem of the accumulation of residues is still present. The average European generates 517 kilos of garbage a year. The immense majority of these residues will end up by being deposited in dumps or being incinerated. Only a small percentage will be destined for the recycling.
Meanwhile, 100 million tons of residues accumulate in the pacific forming a real soup of waste that doubles the surface of the USA.
II.STATE OF THE ART
The first step in the separation cycle is at home, the people should separate the garbage in different bags. The following step is to collect all the waste to a big recycling plant, that will complete the process of separation. And last the treatment and return of the materials.
On the image below we can appreciate the methodology of current separation.
Both automated sections are in the top right. The first one consists of a red pipe which is a big magnet, its function consists of separating the metals. The yellow pipe it is a blower, it is in charge of separating the papers. The rest of the
Alvaro Salmador, Javier Pérez Cid, Ignacio Rodríguez Novelle
Intelligent Garbage Classifier
IInternational Journal of Interactive Multimedia and Artificial Intelligence, Vol. 1, Nº 1, ISSN 1989-1660 32
process, as we can see, it is workmen who perform manual classification.
III.SYSTEM DESCRIPTION
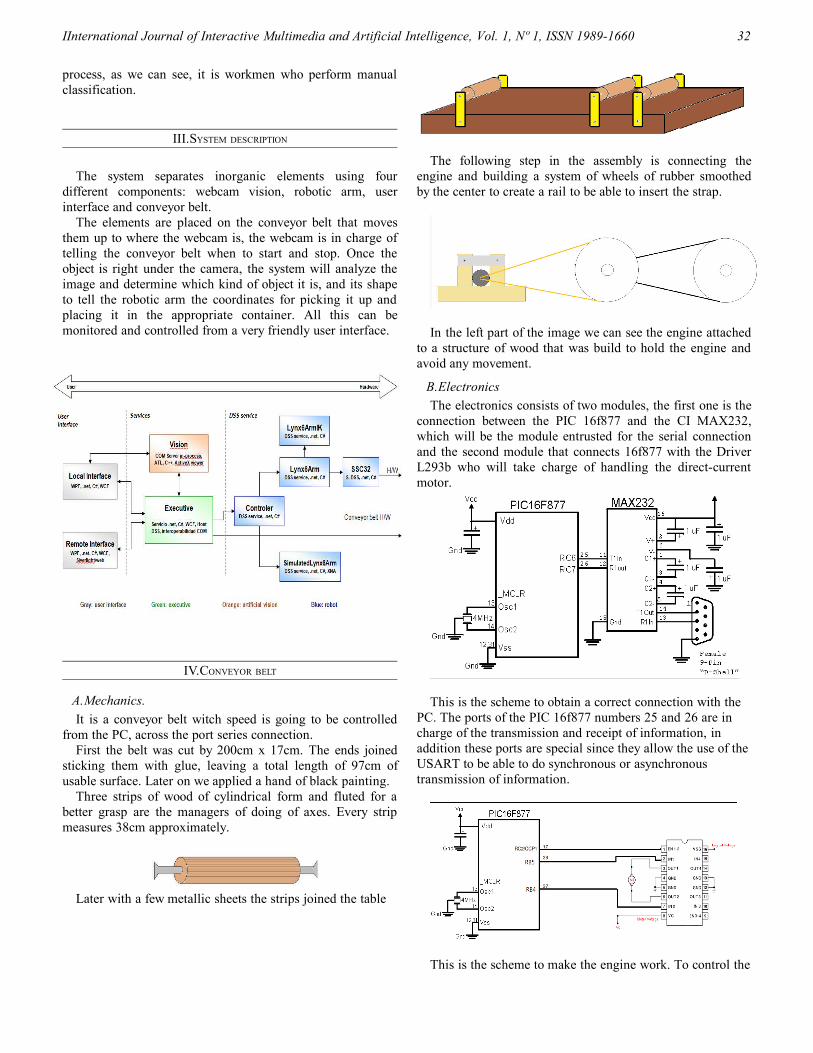
The system separates inorganic elements using four different components: webcam vision, robotic arm, user interface and conveyor belt.
The elements are placed on the conveyor belt that moves them up to where the webcam is, the webcam is in charge of telling the conveyor belt when to start and stop. Once the object is right under the camera, the system will analyze the image and determine which kind of object it is, and its shape to tell the robotic arm the coordinates for picking it up and placing it in the appropriate container. All this can be monitored and controlled from a very friendly user interface.
IV.CONVEYOR BELT
A.Mechanics.
It is a conveyor belt witch speed is going to be controlled from the PC, across the port series connection.
First the belt was cut by 200cm x 17cm. The ends joined sticking them with glue, leaving a total length of 97cm of usable surface. Later on we applied a hand of black painting.
Three strips of wood of cylindrical form and fluted for a better grasp are the managers of doing of axes. Every strip measures 38cm approximately.
Later with a few metallic sheets the strips joined the table
The following step in the assembly is connecting the engine and building a system of wheels of rubber smoothed by the center to create a rail to be able to insert the strap.
In the left part of the image we can see the engine attached to a structure of wood that was build to hold the engine and avoid any movement.
B.Electronics
The electronics consists of two modules, the first one is the connection between the PIC 16f877 and the CI MAX232, which will be the module entrusted for the serial connection and the second module that connects 16f877 with the Driver L293b who will take charge of handling the direct-current motor.
This is the scheme to obtain a correct connection with the PC. The ports of the PIC 16f877 numbers 25 and 26 are in charge of the transmission and receipt of information, in addition these ports are special since they allow the use of the USART to be able to do synchronous or asynchronous transmission of information.
This is the scheme to make the engine work. To control the

International Journal of Interactive Multimedia and Artificial Intelligence, Vol. 1, Nº 1, ISSN 1989-1660 33
speed it uses the port 17 of the PIC. To control the direction of the engine it uses ports 37 and 38. The driver L293b will be the manager of transforming the possible combinations into movements for the engine.
V.ROBOTIC ARM
The robotic arm divides in two clearly differentiated dimensions:
We have the physical dimension, with rigid pieces that simulate the human bones, and servo engines that realized the function of muscles and joints.
We also have the logic, or what a nervous system would be, which will give the orders to all the engines to shape a certain position and to behave as a human arm. This nervous system has been programmed by Microsoft Robotics Studio.
A.Microsoft Robotics Studio
Robotics Studio is an environment to create robotic applications in a simple way. It’s designed to work with the majority of robots and devices on the market. A robotic application in Robotics Studio it’s a group of coordinated and independent services that work and communicate with each other.
Let's imagine the example of an application for the control of airbags. We might have a service in the bumper that was detects impacts and sends messages to report about them. The bumper sends this info to the switchboard which only takes care of deciding the right airbag for that signal and the transmission of it, finally the airbag’s functionality will only be to inflate whenever it receives a signal. Each one is and independent and relatively simple service but the coordination of all produces the wished effect.
It is necessary to emphasize some of Robotics Studio's principal components:
The Concurrency and Coordination Runtime (CCR). This allows the services to work simultaneously without creating conflicts. If the services were the traffic of a city, CCR would be the system of traffic lights and signals.
The Decentralized Software Services, which entrusts the proper communication between the different services. In regard to the previous car/traffic analogy, DSS would be the regulation and legislation of driving.
There are other components of minor relevancy but equally useful like AGEIA's physical simulation, which allows us to test with virtual models (great to avoid crashing electronics), and the visual environment (VPL) that allows the construction of applications without a big knowledge of programming through a very friendly user interface.
B.Robotic Arm services
To make the robotic arm move in the desired direction we need five services:
Controller is the service that handles the other services. It
will receive the orders of the executive, and transform them in signals for the other services.
Lynx6Arm is the service for controlling the arm; it contains the logical structure and architecture of the arm with all its components and capacity of functioning, it will take care of the limits on all the variables and orders the service SSC32 to execute them. This service is directly connected to the Control service Lynx6ArmIK is a service that contains functions of utility for Cartesian three-dimensional coordinates in angles of the joints transformation, is a support service to Lynx6Arm. SimulatedLynx6Arm is a service for simulation, is analogous to Lynx6Arm and is signed to the messages sent to this one, so that it imitates all its movements. The simulation provided by Robotics Studio is based on XNA. SSC32 is the service that deals with the communication with the control hardware of the robot, it’s the one entrusts to construct the necessary orders and to transmit them to the circuitry of the robot.
VI.USER INTERFACE
Thanks to the use of the new technologies as WPF (Windows Presentation Foundation) there can be created among other things rich and really interactive User's interfaces. In IGC the user has an interface developed with WPF that follows the lines of design of Microsoft Office and Visual Studio. The interface divides in 2 clearly differentiated sections:
- Area of menus: where the user has all the options that as well as all the actions that he can realize with IGC. Organized strategically with the aim, that the user always has to scope all of his options.
- Area of work: where the user arranges all the information that he needs on the task that is being realized.
From the point of view of the functionality of the system, it offers 3 manners of functioning:
- Way of Classification: where the user sees the system work and classification it shows the images directly from the camera..
- Way of Training: where the user can train the system to add new objects that he wants to classify, in an easy and simple way. The interface puts to his disposition in the central panel, a window that shows him not recognized objects, in order that the user with a simple click could typify.
- Way of configuration: where the user can prepare the system.

IInternational Journal of Interactive Multimedia and Artificial Intelligence, Vol. 1, Nº 1, ISSN 1989-1660 34
VII.COMPUTER VISION
IGC’s aim is to analyze images captured by a camera in order to identify and classify different kinds of objects. We use a combined approach that utilizes several algorithms in various stages, in what constitutes a demonstration of the maturity of the technologies and methods we leverage for a particular application: classifying objects for recycling. The objects we classify are of four different kind of food and beverage containers, depending on material – metal, glass, plastic and paper. We thereby demonstrate the effectiveness of the system in a particularly relevant practical situation, as most garbage classifying facilities still use human labor to classify some kinds of residues. In order to properly classify the objects, we need to isolate them from the background and somehow characterize them. The most relevant characteristic we have considered and have decided to use is the objects’ shape, so the system can recognize objects by their shapes in a similar way as humans do. After this training, we can characterize an arbitrary object and compare it to known objects in order to determine what type of object it is.
A.Segmentation
The first processing step (segmentation) involves distinguishing objects from the background and from other objects. In this step, quite generic image processing methods are used, namely:
- Border detection (Canny algorithm) - Thresholding to isolate from the background and
eliminate noise- Gaussian blur to soften details and filter noise- Conversion from color to black and White and binary
image, use of the saturation cannel to help find borders- Contour detection in binary images to analyze objects
separately
1)ThresholdingThere are several alternatives for thresholding:
- Analysing the histogram- Using fixed values- Otsu algorithm
Histogram example: pixels with low values (left) have been detected as the background distribution. Details (right) vary much more their value/intensity.
Otsu’s algorithm consists on dividing the pixels in two classes or clusters, using a threshold value calculated as the one that provides the highest variance intra-class, defined as the weighted sum of the variances of each cluster:
δ2intra(T) = nB(T)·δB
2 (T) + nO(T)·δO2(T) [1]
Where nB y nO are the number of pixels below and above the threshold, and δB y δO their variances, respectively. T is the threshold value chosen.
An interesting variation we use, consists on considering only the pixels near the borders (detected with another algorithm), so the thresholding thus applied tends to maintain the separations on that borders.
2)Watershed segmentationEven if the objects to be analysed have been separated from
the background, it’s still possible that some of them are in contact, so it is necessary to separate them. In order to do this we use watershed segmentation.
Watershed algorithms [1], [7], [5], consist on processing the binary image to build a distance map to the object borders (that is, the value each pixel whose value was one becomes its distance to the nearest zero pixel), and then progressively filling each level from chosen seeds o that when different seeds finally meet, a barrier is established to create a separation. As the name watershed indicates, it’s like filling lakes with water and putting a fence when two masses of water touch.
Original image Distance map Watershed result
B.Characterization
In order to classify objects by shape, which is our objective, it will be first necessary to characterize and abstract that shape in some form we can mathematically operate and compare [5], [8]. We use two such shape descriptors: Hu moments and Fourier descriptor.

International Journal of Interactive Multimedia and Artificial Intelligence, Vol. 1, Nº 1, ISSN 1989-1660 35
1)MomentsMoments of an image are magnitudes of the form:
[2]
Where p and q indicate the order of the moment and f(x,y) is the pixel value at coordinates (x, y) in the image [4], [6].The name moments comes from its similarity to inertia moments of solids.
Cetral moments (referred to the center of the object), can also be calculated:
As well as normalized central moments, ηp,q, which are normalized using the area of the object.
The values thus obtained are particularly useful to characterize and reconstruct certain features of the analysed image, such as its center, semiaxis, area, orientation, etc. This will be very useful for us to determine the objects orientation and position in order to move it by mechanical means.
In addition, several of these moments can be transformed into seven values which are invariant to rotation, translation and scaling, which are Hu invariants [4]. We use them to characterize the object’s shape from its binary image:
As we are also interested in the object’s size, we can add an eighth value representing its size –be it area or elongation –
in order to achieve the final characterization that is an 8-dimensional vector.
2)Fourier descriptorFor this characterization, the contour of the object is
transformed into a Fourier function whose parameters will characterize the object as an n-dimensional vector (the number of dimensions depends on the detail chosen) [3], [10].
There are several ways of doing the transformation and point sampling from the contour (polar coordinates, Cartesian coordinates, first derivative, etc.). In our case, based on favorable results obtained [3], we use complex numbers to represent Cartesian coordinates of shapes and transform them with a discrete Fourier transform (DFT).
The sequence of N complex numbers, x0,... xN-1, is transformed in the sequence X0,... XN-1 according to the formula:
,
In order to make the Xk coefficients invariant to rotation and translation transformations, X0 is eliminated and all other coefficients are normalized by X1. In this manner, the vector that finally characterizes the shape is of dimension N-2. We have chosen the minimum value of N that allows for an effective characterization of the object.
C.Learning and classification
In order to classify the characterized objects, it’s necessary to compare them to previously known objects. We do so by searching points in the n-dimensional space corresponding to a certain image descriptor which are close to the image descriptor of the object we want to classify.
The simplest and probably most effective classifier for this problem would be a k-nearest neighbours classifier (k-NN). This algorithm finds the k nearest points to the one we want to classify and thus determines that it belongs to the same class most of those k points belong. Taking into account our classes can be quite heterogeneous (overlap, samples quite far apart and so on), partitioning algorithms like SVM are probably not a good option, so we have chosen an improvement on k-nn.
After both classifiers (Fourier descriptor and Hu moments) provide the distances to known classes, a set of fuzzy rules decide in which class to classify the object.
1)HKNN algorithmEven though the kNN algorithm can be effective enough,
we use an improvement of that algorithm, K-local
IInternational Journal of Interactive Multimedia and Artificial Intelligence, Vol. 1, Nº 1, ISSN 1989-1660 36
hyperplane nearest neighbours (HKNN) [9], which generates a local hyperplane for the K neareast neighbours of each class and then compares the distances to each one of the hyperplanes in order to determine which class is closest.
The advantage of this algorithm is that it “fills” the gaps in space that are not covered by sufficient samples gathered for a particular class. Nevertheless, in some cases it can happen that the point is very far from the sample points of the class but very close to the hyperplane. Because of this another parameter apart from K is introduced, λ, in order to penalize moving away from the centroid.
Formally, the local hyperplane of a class can be defined as:
,
where c refers to the class, K is the number of points and Nk is the vector for each local point.
2)Mahalanobis distanceThis method to find out the distance between two points is
particularly useful for our Hu moments descriptor, as this methods adjusts each vector component based on the statistical variation of the samples. Classes can be better separated in this fashion [2]
Given the matrices X and Y as the column matrices corresponding to the vectors of two different points and having a co-variance matrix C for the samples’ distribution, then the Mahalanobis distance d between X and Y is:
d = ((X-Y)t · C-1 · (X-Y)) 1/2
This method seems much less useful, on the other hand, for our Fourier classifier, as the covariance matrix in that case is huge and almost degenerate in most cases, which can cause problems with the numerical methods used (namely, Cholesky and LU factorization), besides it makes no sense to apply it to the Fourier descriptors, as the importance of each dimension decreases as the order increases (low-frequency versus high-frequency –small details- wave components).
VIII.CONCLUSION
Recycling is paramount for the preservation of the environment. Leveraging the latest technologies in computer vision, robot control and other fields and taking advantage of their maturity, a system has been built that makes it possible to visually classify and separate different types of waste effectively, a task that would normally require manual work.
REFERENCES
[1] S. Beucher, C. Lantejoul, "Use of watersheds in contour detection", in International workshop on image processing: real-time edge motion detection/estimation, 1979.
[2] A. Fraser, “Incorporating invariants in Mahalanobis distance based classifiers: Application to Face Recognition”.
[3] H. Kauppinen et al., "An Experimental Comparison of Autoregressive and Fourier-based Descriptors in 2-D Shape Classification", in IEEE
Transactions on Pattern Analysis and Machine Intelligence, vol. 17, pp. 201-207, 1995.
[4] J. Kilian, “Simple Image Analysis By Moments”, 2001.[5] V. Kindratenko, "Development and Application of Image Analysis
Techniques for Identification and Classification of Microscopic Particles", Ph.D. Thesis, University of Antwerp, Belgium, 1997.
[6] B. Morse, “Lecture 7: Shape Description (Contours)”, “Lecture 16: Segmentation (Edge Based)”, et cetera, Brigham Young University, 1998–2000.
[7] J. Roerdink, A. Meijster, "The Watershed Transform: Definitions, Algorithms and Parallelization Strategies", in Fundamenta Informaticae 41 187-228, 2001.
[8] C. Schmid, "Apparaiment d'images par invariants locaux de niveaux de gris", PhD thesis, Institut National Polytechnique de Grenoble, France, 1996.
[9] P. Vincent, Y. Bengio, “K-Local Hyperplane and Convex Distance Nearest Neighbor Algorithms”, in Neural Information Processing System, pp. 985-992, 2001.
[10] C. Zahn, R. Roskies, "Fourier Descriptors for Plane Closed Curves", 1971.