Embed Size (px)
Citation preview
INTERNATIONAL JOURNAL OF ACADEMIC RESEARCH IN ACCOUNTING, FINANCE AND
MANAGEMENT SCIENCES
Vol. 2 , No. 3, 2012, E-ISSN: 2225-8329 © 2012 HRMARS
169
Full Terms & Conditions of access and use can be found at
http://hrmars.com/index.php/pages/detail/publication-ethics
Intelligent Financial Forecasting, The key for a Successful Management Logica Banica, Daniela Pirvu, Alina Hagiu
To Link this Article: http://dx.doi.org/10.6007/IJARAFMS/v2-i3/9953 DOI:10.6007/IJARAFMS /v2-i3/9953
Received: 23 July 2012, Revised: 27 August 2012, Accepted: 17 August 2012
Published Online: 30 September 2012
In-Text Citation: (Banica et al., 2012) To Cite this Article: Banica, L., Pirvu, D., & Hagiu, A. (2012). Intelligent Financial Forecasting, The key for a
Successful Management. International Journal of Academic Research in Accounting Finance and Management Sciences, 2(3), 169–186.
Copyright: © 2012 The Author(s)
Published by Human Resource Management Academic Research Society (www.hrmars.com) This article is published under the Creative Commons Attribution (CC BY 4.0) license. Anyone may reproduce, distribute, translate and create derivative works of this article (for both commercial and non-commercial purposes), subject to full attribution to the original publication and authors. The full terms of this license may be seen at: http://creativecommons.org/licences/by/4.0/legalcode
Vol. 2, No. 3, 2012, Pg. 169 - 186
http://hrmars.com/index.php/pages/detail/IJARAFMS JOURNAL HOMEPAGE

INTERNATIONAL JOURNAL OF ACADEMIC RESEARCH IN ACCOUNTING, FINANCE AND
MANAGEMENT SCIENCES
Vol. 2 , No. 3, 2012, E-ISSN: 2225-8329 © 2012 HRMARS
170
Intelligent Financial Forecasting, The key for a Successful Management
Logica Banica, Daniela Pirvu, Alina Hagiu Faculty of Economics University of Pitesti
Email: [email protected], [email protected], [email protected] Abstract Given the prolonged economic crisis felt by entire business world, companies have turned to knowledge, processing and analyzing information as powerful tools of top management. IT market has provided business intelligence software, useful for companies in their effort to obtain current situation viewed from different angles, and projections that underpin decision-making strategy. In this article we focused on two goals: the presentation of the concept and the environment to realize a financial forecasting for a company, and the experiment itself which refers to the use of an existing software (trial free software GMDH Shell) to perform a case study of OMV company. Based on the financial consolidate statements of the OMV PETROM SA Company during 2005-2011, we applied various forecasting models in order to obtain a forecasting of financial indicators for 2012. We also made an assessment of the accuracy of predictions, comparing partial data published by the company in the first two semesters and we analyzed the mismatch causes. Keywords: Forecasting Software, Corporate Management, Financial Indicators, Time-Series Models Introduction
Given the prolonged economic crisis felt by entire business world, companies have turned to knowledge, processing and analyzing information as powerful tools of a top management. IT market has provided business intelligence software, useful for companies in their effort to obtain current situation viewed from different angles, and projections that underpin decision-making strategy.
To planning the future actions, the company management includes three financial statements: profit and loss, cash flow, balance sheet. These three documents collectively and separately demonstrate the impacts of profitability, liquidity and growth on business matter over the planning horizon chosen. In order to know the pulse of business it’s important to understand these financial management tools and the way they interact. Using financial forecasts is important for measuring the performance for previous period and making a new business plan, which may be presented to investors.
The concept of forecasting software refers to the software applications used for gathering and analyzing data about a company, in order to supply the best business decisions.

INTERNATIONAL JOURNAL OF ACADEMIC RESEARCH IN ACCOUNTING, FINANCE AND
MANAGEMENT SCIENCES
Vol. 2 , No. 3, 2012, E-ISSN: 2225-8329 © 2012 HRMARS
171
Based on the consolidated balance sheets data of the company OMV SA during the last 7 years (2005-2011) and using forecasting software, we analyzed key performance indicators and we applied various forecasting models in order to obtain a prediction of financial indicators for 2012. We also made an assessment of the accuracy of predictions, comparing partial data published by the company in the first two semesters and we analyzed the mismatch causes. Some Considerations about Forecasting Software
In the current competition context, deepened by the economic crisis, company’s managers must look at the past; they need reports on previous and current situation to improve the future operational efficiency – figure 1. The general goal is to make informed forecasts about the future in order to optimize resource allocation and consumption, and also to avoid possible problems that could have a negative impact on their business (Kotorov 2009).
Economists use forecasting also to extrapolate how trends will change in the next year or as a benchmark for a long-term perspective of business. The further out the forecast, the higher the chances that the estimate will be less accurate (Duell 2001).
Figure 1. Management expectations by analysis of the past and current trends
IT providers, interacting with these requests, have launched on market various systems and tools to support managers in making better business decisions, such as business intelligence platforms or forecasting software.
In this paper, we will discuss about the capabilities of forecasting software and will highlight the advantages of using this kind of tools to improve decision-making, thus increasing profits while reducing costs and risks.
Past
Analysis of
historical set of
data
Present
Analysis of real-
time data
Future
Predictive
modeling
Financial
forecasting Sales trend Customer
relationship
predictions
INTERNATIONAL JOURNAL OF ACADEMIC RESEARCH IN ACCOUNTING, FINANCE AND
MANAGEMENT SCIENCES
Vol. 2 , No. 3, 2012, E-ISSN: 2225-8329 © 2012 HRMARS
172
The Concept of Forecasting Because it is often confused with the notion of prediction, we will define forecasting according
to the business dictionary. According to business dictionary, forecasting is „a planning tool that helps management in its attempts to cope with the uncertainty of the future, relying mainly on data from the past and present and analysis of trends”.
Starting from certain assumptions, forecasting projects into the future the trends using different models, such as: Delphi method, exponential smoothing, moving averages, and regression analysis. An error in the input variables, due to the values of uncertain factors, will be reflected or magnified in forecasting.
The differences between forecasting and prediction are presented in Table 1. In a few words, forecasting is objective, scientific and reproducible, while prediction is subjective, generally intuitive and non-reproducible (Kucharavy, De Guio, 2005; http://www.transtutors.com 2012).
Table 1. Difference between Forecasting and Prediction
Forecasting Prediction
• Forecasting involves the projection of the past into the future.
• Prediction involves judgment in management after taking all available information into account.
• Forecasting is more scientific. • Prediction is more intuitive.
• Forecasting is relatively free from personal bias.
• Prediction is more governed by personal bias and preferences.
• Forecasting is more objective. • Prediction is more subjective.
• Forecasting allows error analysis. • Prediction does not contain error analysis.
• Forecasting is reproducible (every time same result would be obtained by any particular technique).
• Prediction is non-producible.
Source: (Kucharavy, D., De Guio, R. 2005; http://www.transtutors.com 2012).
Forecasting use predictive analytics as a variety of statistical techniques from modeling, that means analyze current and historical facts to find patterns and capture relationships among input factors and conditions in order to obtain predicted variables that describe the future trends and behavior patterns’ (Nyce 2007; Eckerson 2007). A known and approve fact in forecasting is that the accuracy of results depends on the level of data analysis and the quality of assumptions.
Our experiment is based on Time series model, used for forecasting the future behavior of variables. This model supposes that data points taken over time may have an internal structure (autocorrelation, trend or seasonal variation) that should be accounted for. The model was developed to decompose the trend, seasonal and cyclical component of the series. Modeling the dynamic path of a variable can improve forecasts since the predictable component of the series can be projected into the future (Nyce 2007; Eckerson 2007).
The most known forms of this model are: autoregressive model (AR) and moving average (MA) model, autoregressive moving average (ARMA) that combines the two previous models, using Box-Jenkins methodology.
INTERNATIONAL JOURNAL OF ACADEMIC RESEARCH IN ACCOUNTING, FINANCE AND
MANAGEMENT SCIENCES
Vol. 2 , No. 3, 2012, E-ISSN: 2225-8329 © 2012 HRMARS
173
Neural networks are nonlinear sophisticated modeling techniques that are able to model complex functions. They can be applied to problems of prediction, classification or control in a wide spectrum of fields such as finance, medicine, engineering, and physics.
Neural networks have been widely used as time series in forecasting: most often these are feed-forward networks which employ a sliding window over the input sequence.
The algorithm used in the case study presented is neural networks, usually choose when is known the exact nature of the relationship between inputs and output. A key feature of neural networks is that they learn the relationship between inputs and outputs through training, so we split the input variables on two groups, having the training/test ratio: 50% / 50%.
The accuracy of expectations which can be formulated about the future, allow managers to allocate resources in order to maximize profits. The precision of information depends on sources and volumes of collected data, the selection of descriptive variables for chosen predictive model. Even if some factors are not relevant, the model assesses the most important and assigns them much more weights.
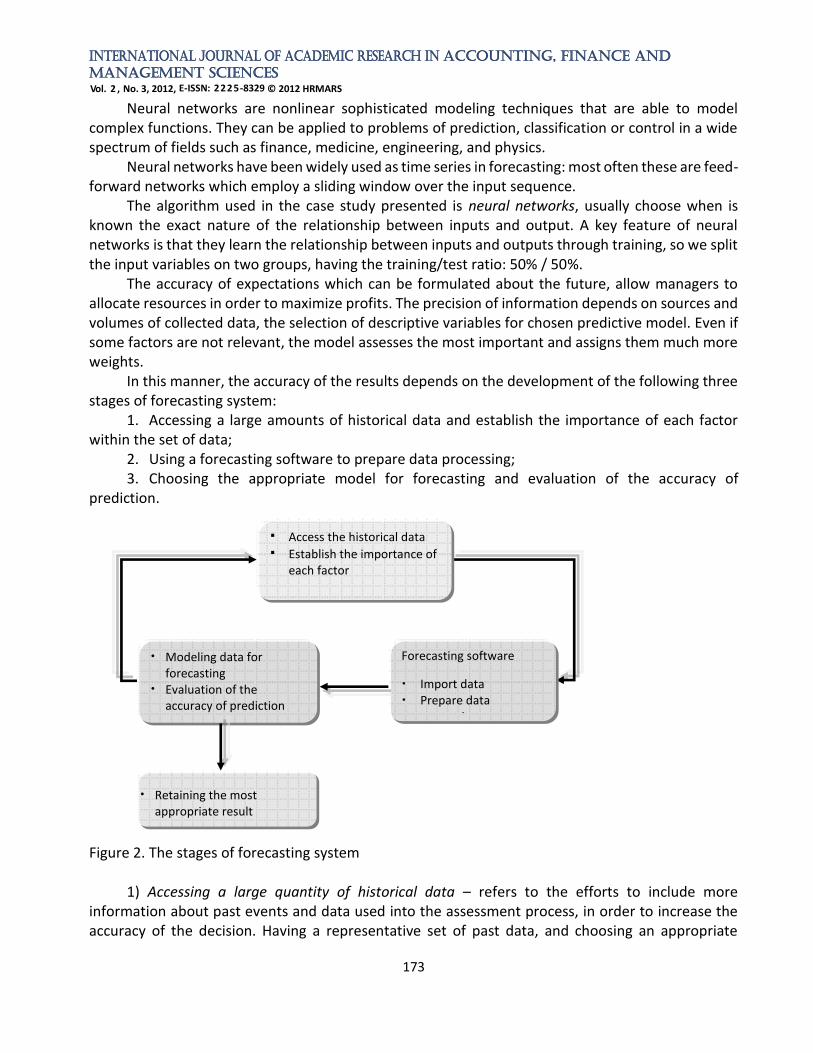
In this manner, the accuracy of the results depends on the development of the following three stages of forecasting system:
1. Accessing a large amounts of historical data and establish the importance of each factor within the set of data;
2. Using a forecasting software to prepare data processing; 3. Choosing the appropriate model for forecasting and evaluation of the accuracy of
prediction.
Figure 2. The stages of forecasting system
1) Accessing a large quantity of historical data – refers to the efforts to include more information about past events and data used into the assessment process, in order to increase the accuracy of the decision. Having a representative set of past data, and choosing an appropriate
Access the historical data
Establish the importance of each factor
Modeling data for forecasting
Evaluation of the accuracy of prediction
Forecasting software
Import data Prepare data
processing
Retaining the most appropriate result
INTERNATIONAL JOURNAL OF ACADEMIC RESEARCH IN ACCOUNTING, FINANCE AND
MANAGEMENT SCIENCES
Vol. 2 , No. 3, 2012, E-ISSN: 2225-8329 © 2012 HRMARS
174
model, makes easier the process to detect a pattern for better decisions, judgments and forecasting. Also, we must define at this stage the importance of each factor within the dataset. The indicators treated by the predictive process involve a number of factors, having different importance and therefore it is necessary to assign proper weights for each factor that influences a particular result.
Assessing the level of importance of each input variable will allow a better forecasting for each target, and ultimately, for the management.
2) Using forecasting software to prepare data processing - means the import of data into the application, establish the input and output variables, assessing the importance of each input variable. During this stage, the user spends most than 50% of the system time, to obtain the dataset from multiple data sources, and also to extract the input variables necessary for analysis and for building the forecast model environment.
In case of non-continuity or outliers of dataset, additionally, it must be specified a method for covering. If the software detects missing values, they must be replaced, by an interpolate value, by an average value or by zero etc. If outliers are uncovered, they must be removed.
Also the software must be able to convert data (text-to-number, integer-to-long integer, integer-to-double etc) to make possible the application of the model and to increase the predictive power of the model.
3) Choosing the appropriate model for forecasting and evaluation of the accuracy of prediction – the forecasting software can run models to make estimations and predictions about the future and use those forecasts for decision-making.
We will specify several models, some recommendations and advantages about their use in different cases in the experimental part of this paper.
It is a scientific act, influenced by experience and intuition in selecting a model, but also it’s a matter of observation and evaluation of the results.
Today's forecasting software gives enough information (graphs, reports, performance, indicators etc) to an experimented manager in order to make an evaluation of the accuracy of the results, but its first question is: Can I trust this evaluation? Can I build a new budget and run a company based on these predictions?
We can give some advice to future managers: first, to test the model by applying it to historical data and obtain results for the last time statistics recorded, in order to make a comparative analysis of actual data and forecast results. Secondly, it is recommended to try several models and compare the accuracy of results before choosing one of them.
It is not complicated to execute several models since the user doesn't change dataset and interacts with the software through a powerful graphical interface, so he can easily specify and create another model.
Current forecasts require a statistician or someone who has knowledge of business statistics, who understand and apply statistical techniques; simplifying, no need to know the mathematical formulas and technical details behind linear regression, but he must know the meaning of such a model. Next paragraphs briefly describe these steps recommended for building a forecasting system and which have been applied to the case study.
This paper presents the components, benefits, technology requirements and implementing of forecasting software. As experimental part, we choose to explore a data collection and analysis methods for a business using the forecasting software GMDH Shell.
INTERNATIONAL JOURNAL OF ACADEMIC RESEARCH IN ACCOUNTING, FINANCE AND
MANAGEMENT SCIENCES
Vol. 2 , No. 3, 2012, E-ISSN: 2225-8329 © 2012 HRMARS
175
We emphasize the advantages of using GMDH Shell for managers: for example, to apply various types of models on same input financial data in order to define the future values of performance financial indicators. Choosing GMDH Shell as Forecasting Software
Today’s predictive analytics tools need advanced skills to understand the results, but not to generate the models. As many companies adopt predictive analytics into decision-making processes and integrate it into their operations, business users want tools they can use on their own. Providers are responding by creating new software that implements the mathematical complexity, provides user-friendly graphic interfaces, recognize the kind of data available and suggest an appropriate predictive model (Korn, 2011). There are numerous tools available in the market that helps with the execution of predictive analytics. The difference between these tools is often in the level of customization and heavy data lifting allowed.
In our opinion, there are some important criteria for choosing forecasting software, such as: a) Forecast accuracy b) Costs c) Expertise of the analyst d) Availability of computer software e) The properties of the series being forecasted f) The way the forecast will be used After an analyze of the strengths and weaknesses of some forecasting software available on IT
market and offered as trial version, we consider that GMDH Shell platform is recommended due to several categories of functionality: data acquisition, integration, mathematical modeling, analysis and forecasting.
According with the documentation of the Group Method of Data Handling (GMDH): „GMDH Shell is an advanced but easy to use tool for predictive analytics and data mining, able to automatically detect usable data inside a file, transform data according to a problem type, drop irrelevant inputs and, finally, construct a set of predictive models at the base of optimal complexity detection and self-organization principals” (http://www.gmdhshell.com/docs/2012).
We made a summary of the features of this software environment: a. Graphical User Interface for Windows consists of multiple panels that can be configured by
user on two areas: tabs and the sidebar. The configuration refers to dataset, input variables and target (Data Manager), Solver options, view of Simulation results.
b. GMDH Shell accept dataset from CSV (text) and XLS files composed of columns and rows, mentioned as input variables and prediction targets.
c. GMDH Shell is able to solve different types of predictive analytics problems, to produce categorical and continuous value predictions that allow it to solve classification and regression problems. We must highlight its capacity to solve Time-series forecasting which a special type of continuous value prediction.
Applications of time-series forecasting include: economic planning, sales forecasting, production and capacity planning, financial management, evaluation of alternative economic strategies, budgeting. Time-series forecasting starts from the idea of extrapolation, in that it involves fitting a model to a set of data and then using that model outside the range of data to which it has been fitted. The usual method of analyzing such a series is to sample (or digitize) the series at equal
INTERNATIONAL JOURNAL OF ACADEMIC RESEARCH IN ACCOUNTING, FINANCE AND
MANAGEMENT SCIENCES
Vol. 2 , No. 3, 2012, E-ISSN: 2225-8329 © 2012 HRMARS
176
intervals of time to give a discrete time series. Little or no information is lost by this process provided that the sampling interval is small enough (Chatfield, 2000).
GMDH Shell time-series forecasting supposes that the recent data is more important for model training than other historical information. Time series preprocessor allows core algorithms to learn from a window of latest data. Another useful feature of Time series preprocessor is the ability to launch iterative step-back simulations for evaluation of method accuracy. The available algorithms are: GMDH-type neural networks and Combinatorial GMDH. The neural networks algorithm iteratively creates layers of neurons with two or more inputs, saves only a limited set of optimally neurons and every new layer is created using two or more neurons taken from any of previous layers (http://www.gmdhshell.com/docs/2012).
d. Viewing results as graphical and tabular presentation of model performance and the importance of each indicator (input variable), the model performance that helps to the accuracy assessment for the modeled dataset. The best model for the target variables is shown in visualization panels by default; also other models of the same target can be viewed using the Model browser panel (http://www.gmdhshell.com/docs/2012).
e. Saving the optimal forecasting obtained as a project in order to use it later by loading the model and applies it to other instances within the analyzed file or to a new data-file. The user has also the facility to export the model's formula to Excel.
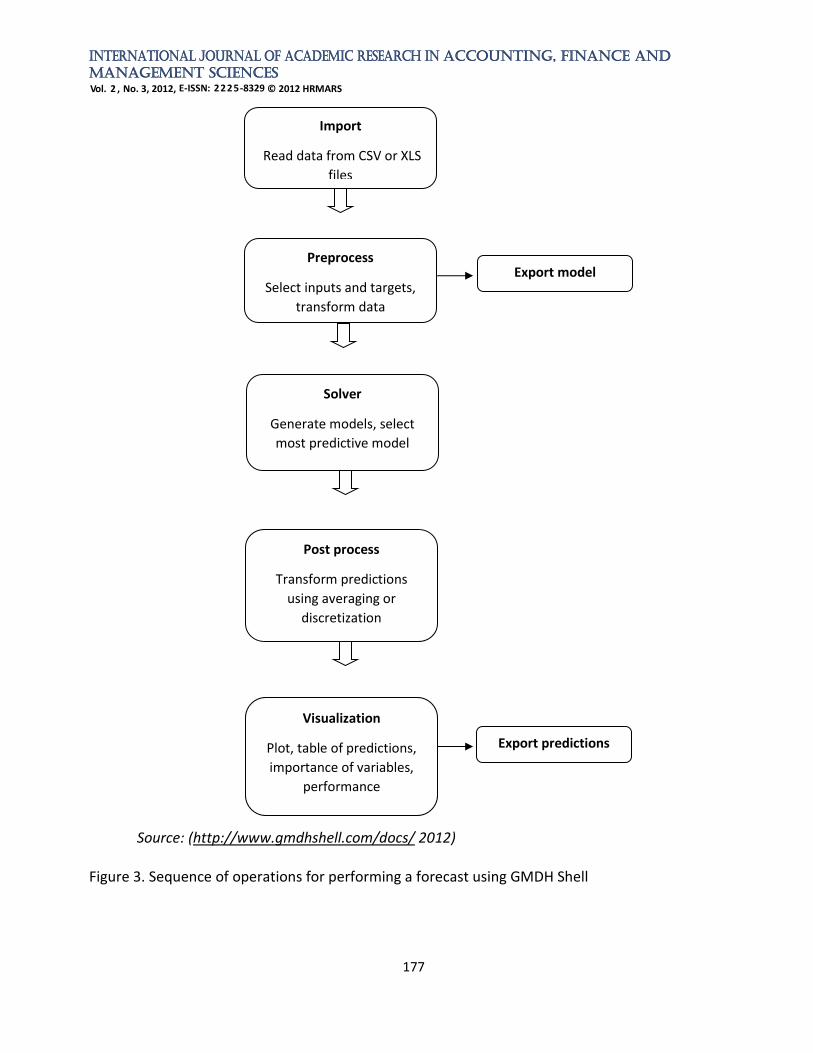
The sequence of operations for performing a forecast using GMDH Shell is given in figure 3:
INTERNATIONAL JOURNAL OF ACADEMIC RESEARCH IN ACCOUNTING, FINANCE AND
MANAGEMENT SCIENCES
Vol. 2 , No. 3, 2012, E-ISSN: 2225-8329 © 2012 HRMARS
177
Source: (http://www.gmdhshell.com/docs/ 2012)
Figure 3. Sequence of operations for performing a forecast using GMDH Shell
Import
Read data from CSV or XLS
files
Preprocess
Select inputs and targets,
transform data
Solver
Generate models, select
most predictive model
Export model
Post process
Transform predictions
using averaging or
discretization
Visualization
Plot, table of predictions,
importance of variables,
performance
Export predictions
INTERNATIONAL JOURNAL OF ACADEMIC RESEARCH IN ACCOUNTING, FINANCE AND
MANAGEMENT SCIENCES
Vol. 2 , No. 3, 2012, E-ISSN: 2225-8329 © 2012 HRMARS
178
Case Study: A Financial Forecasting for OMV PETROM SA Company Based on the consolidated financial statements of the OMV PETROM S.A. Company during
2005-2011, we applied various forecasting models in order to obtain a forecasting of financial indicators for 2012. We also made an assessment of the accuracy of predictions, comparing partial data published by the company in the first two semesters and we analyzed the mismatch causes.
OMV PETROM S.A. is one of the largest companies in Southern and Eastern Europe, thanks the coherent development strategy that majority investor -OMV Aktiengesellschaft - implemented it since 2004. The company shareholding consists of: OMV Aktiengesellschaft, with 51.01% of the shares, the Ministry of Economy in Romania (20.64% of shares), Property Fund SA (fund that is managing various stakes in several companies in Romania, created by the Romanian state to compensate individuals from expropriation of post-communist regime), which holds 20.11% of the shares, the European Bank for Reconstruction and Development (2.03% of shares) and other shareholders (approximately 500,000 individuals and businesses in Romania and abroad), which held 6.21% of the shares.
OMV PETROM S.A. is currently the largest oil group in South East Europe, with activities in areas such as Exploration and Production, Gas and Power, Refining and Marketing. The Group consolidated its position on the South East Europe oil market, as a result o a comprehensive process of modernization and efficiency, for its implementation were made investments of over EUR 7.7 billion in the last seven years.
The Group exploits in Romania and Kazakhstan oil and gas proved reserves estimated at 812 million barrel (in Romania 786 million barrel) and has a maximum annual refining capacity of 4.5 million tones at the end of 2011. On the petroleum products distribution market, OMV Petrom is present on the markets of Romania, Moldova, Bulgaria and Serbia, through a network of about 800 stations, operated under two brands, Petrom and OMV.
Oil trading activity in Romania is performed through OMV Petrom Marketing, which is wholly owned by OMV Petrom. For its sustainable development, OMV Petrom extended the gas value chain by addressing the electricity market. In this context, OMV Petrom develops a gas power plant of 860 MW at Brazi and began commercial operations in Dorobanţu wind farm with a capacity of 45 MW.
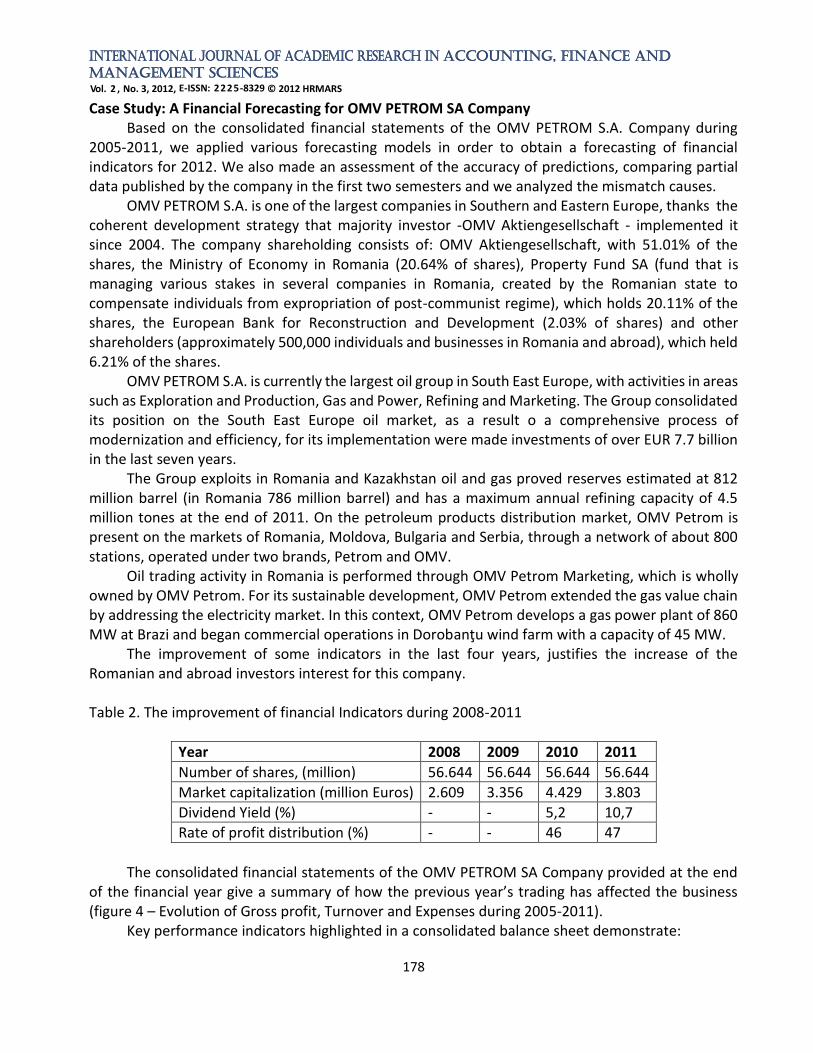
The improvement of some indicators in the last four years, justifies the increase of the Romanian and abroad investors interest for this company.
Table 2. The improvement of financial Indicators during 2008-2011
Year 2008 2009 2010 2011
Number of shares, (million) 56.644 56.644 56.644 56.644
Market capitalization (million Euros) 2.609 3.356 4.429 3.803
Dividend Yield (%) - - 5,2 10,7
Rate of profit distribution (%) - - 46 47
The consolidated financial statements of the OMV PETROM SA Company provided at the end
of the financial year give a summary of how the previous year’s trading has affected the business (figure 4 – Evolution of Gross profit, Turnover and Expenses during 2005-2011).
Key performance indicators highlighted in a consolidated balance sheet demonstrate:

INTERNATIONAL JOURNAL OF ACADEMIC RESEARCH IN ACCOUNTING, FINANCE AND
MANAGEMENT SCIENCES
Vol. 2 , No. 3, 2012, E-ISSN: 2225-8329 © 2012 HRMARS
179
Financial autonomy rate - express the company's financial independence. The increasing of the company equity share in its permanent capital has benefic effects on the total financial autonomy.
FAR = Equity/Permanent capital x100 (1) The company's total financial autonomy increased in 2011 compared to 2006. The general solvency ratio – expresses the extent the assets of the society contribute to its
forward total debt. Overall solvency rate – express the level in which the assets of the company contribute to its
total debt financing. OSR = Total assets/Total liabilities x 100 (2) During 2006-2009, all the company's debt could be settled by using the available assets. Since
2010 the general creditworthiness deteriorates due to the increasing of the current liabilities.
Figure 4. Evolution of Gross profit, Turnover and Expenses during 2005-2011
Rate of economic return - Express the efficiency of assets use, namely their contribution to achieving results.
RER = Gross profit/Total assets x 100 (3) Company economic profitability fell in the mentioned period with a minimum of 3.9% in 2009. This section will explains how to prepare data, choose model, make the configuration in GDHW
Shell to obtain a forecasting for three key performance indicators on 2012: return on equity, equity capital-share capital ratio, profit-turnover ratio.
Return on equity - reflects the efficiency of use shareholders invested capital. RE = Net Profit/Equity x 100 (4)
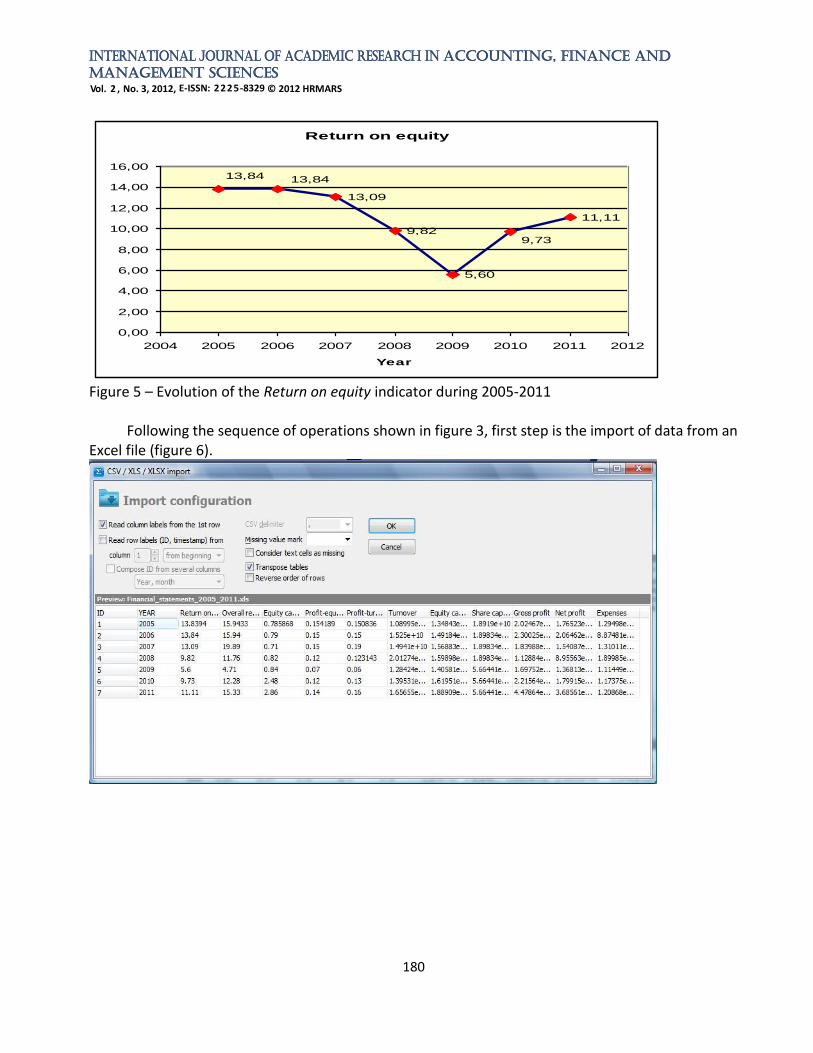
In the presented case study, it is observed that the rate of financial return was maintained at affordable levels (Figure 5), with the exception of 2009.
0
5.000.000.000
10.000.000.000
15.000.000.000
20.000.000.000
25.000.000.000
2004 2006 2008 2010 2012
Turnover
Gross profit
Expenses
INTERNATIONAL JOURNAL OF ACADEMIC RESEARCH IN ACCOUNTING, FINANCE AND
MANAGEMENT SCIENCES
Vol. 2 , No. 3, 2012, E-ISSN: 2225-8329 © 2012 HRMARS
180
Figure 5 – Evolution of the Return on equity indicator during 2005-2011
Following the sequence of operations shown in figure 3, first step is the import of data from an Excel file (figure 6).
Return on equity
13,09
9,82
5,60
11,11
9,73
13,8413,84
0,00
2,00
4,00
6,00
8,00
10,00
12,00
14,00
16,00
2004 2005 2006 2007 2008 2009 2010 2011 2012
Year
INTERNATIONAL JOURNAL OF ACADEMIC RESEARCH IN ACCOUNTING, FINANCE AND
MANAGEMENT SCIENCES
Vol. 2 , No. 3, 2012, E-ISSN: 2225-8329 © 2012 HRMARS
181
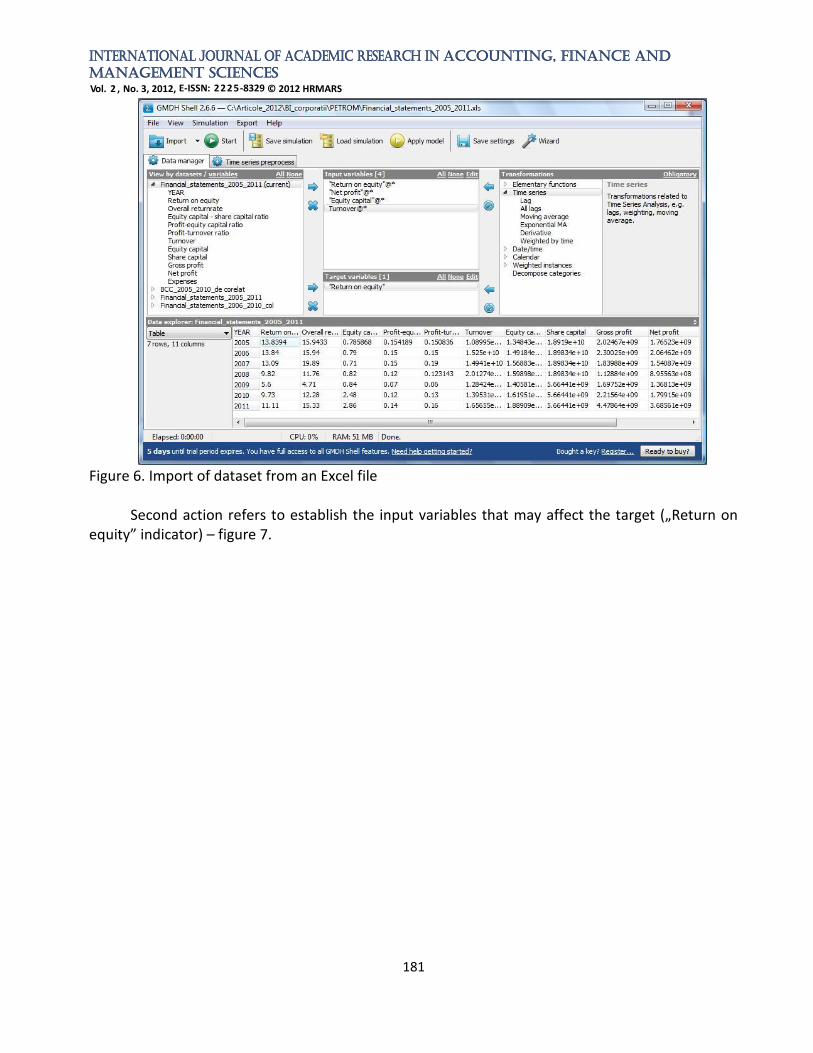
Figure 6. Import of dataset from an Excel file
Second action refers to establish the input variables that may affect the target („Return on
equity” indicator) – figure 7.
INTERNATIONAL JOURNAL OF ACADEMIC RESEARCH IN ACCOUNTING, FINANCE AND
MANAGEMENT SCIENCES
Vol. 2 , No. 3, 2012, E-ISSN: 2225-8329 © 2012 HRMARS
182
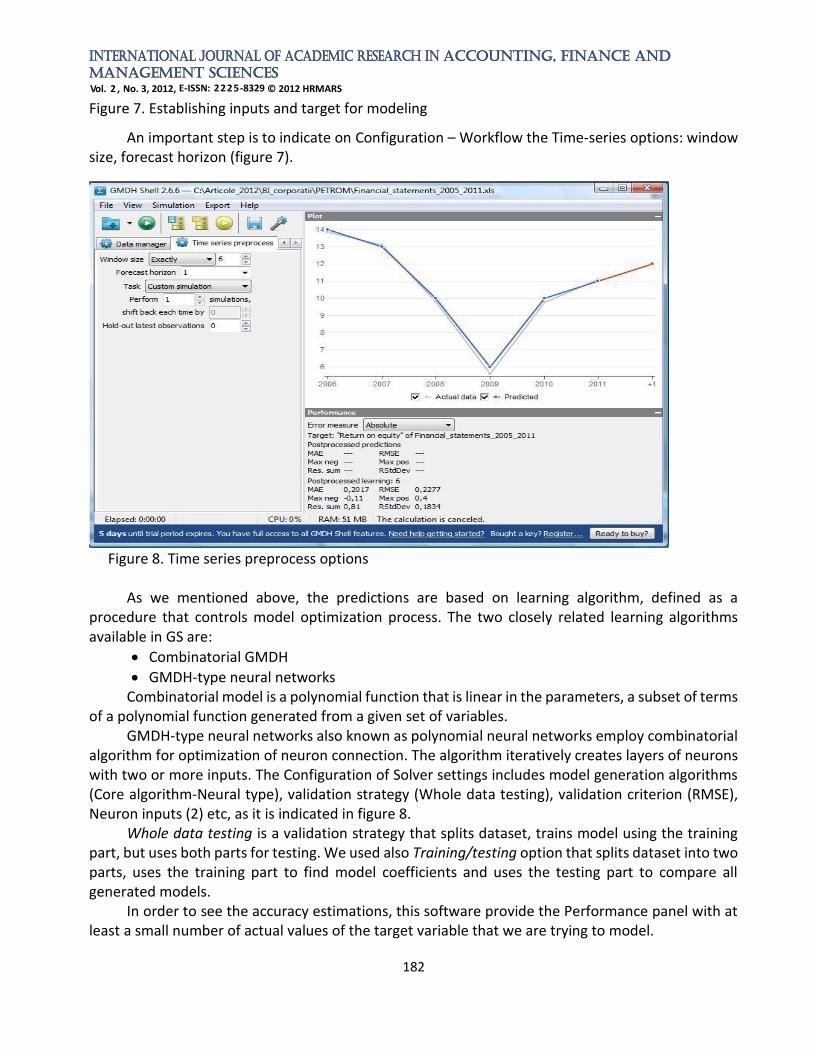
Figure 7. Establishing inputs and target for modeling
An important step is to indicate on Configuration – Workflow the Time-series options: window size, forecast horizon (figure 7).
Figure 8. Time series preprocess options
As we mentioned above, the predictions are based on learning algorithm, defined as a procedure that controls model optimization process. The two closely related learning algorithms available in GS are:
• Combinatorial GMDH
• GMDH-type neural networks Combinatorial model is a polynomial function that is linear in the parameters, a subset of terms
of a polynomial function generated from a given set of variables. GMDH-type neural networks also known as polynomial neural networks employ combinatorial
algorithm for optimization of neuron connection. The algorithm iteratively creates layers of neurons with two or more inputs. The Configuration of Solver settings includes model generation algorithms (Core algorithm-Neural type), validation strategy (Whole data testing), validation criterion (RMSE), Neuron inputs (2) etc, as it is indicated in figure 8.
Whole data testing is a validation strategy that splits dataset, trains model using the training part, but uses both parts for testing. We used also Training/testing option that splits dataset into two parts, uses the training part to find model coefficients and uses the testing part to compare all generated models.
In order to see the accuracy estimations, this software provide the Performance panel with at least a small number of actual values of the target variable that we are trying to model.
INTERNATIONAL JOURNAL OF ACADEMIC RESEARCH IN ACCOUNTING, FINANCE AND
MANAGEMENT SCIENCES
Vol. 2 , No. 3, 2012, E-ISSN: 2225-8329 © 2012 HRMARS
183
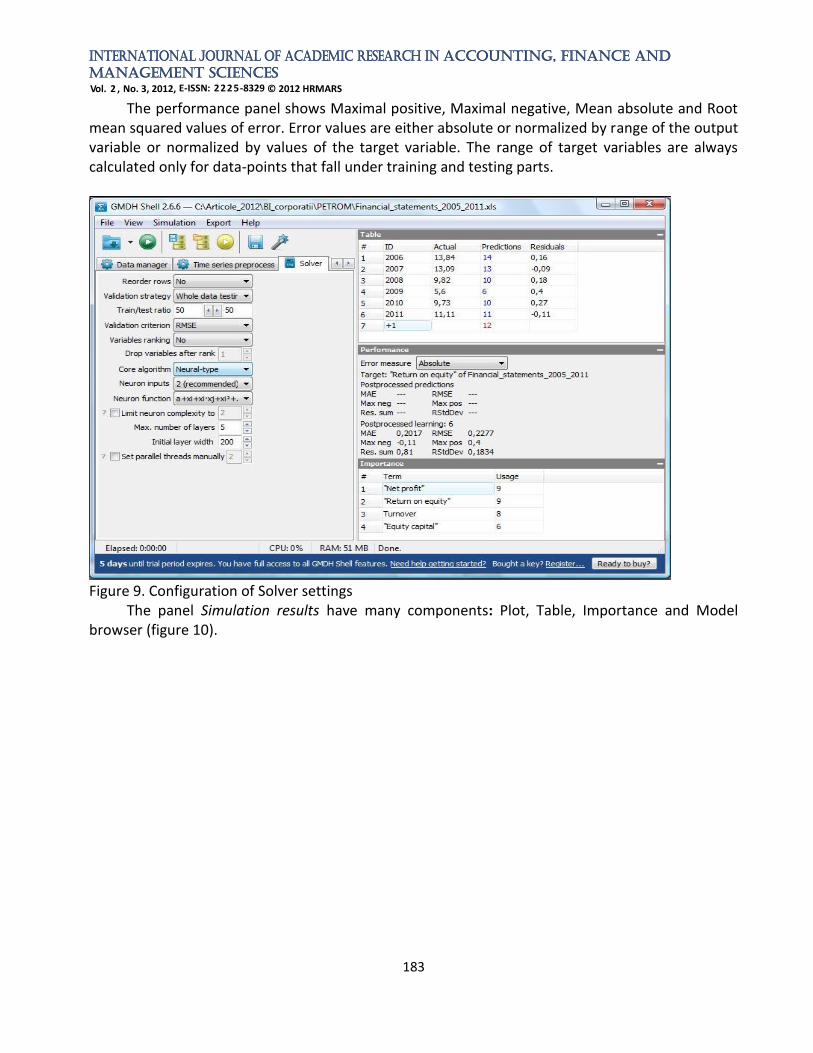
The performance panel shows Maximal positive, Maximal negative, Mean absolute and Root mean squared values of error. Error values are either absolute or normalized by range of the output variable or normalized by values of the target variable. The range of target variables are always calculated only for data-points that fall under training and testing parts.
Figure 9. Configuration of Solver settings
The panel Simulation results have many components: Plot, Table, Importance and Model browser (figure 10).
INTERNATIONAL JOURNAL OF ACADEMIC RESEARCH IN ACCOUNTING, FINANCE AND
MANAGEMENT SCIENCES
Vol. 2 , No. 3, 2012, E-ISSN: 2225-8329 © 2012 HRMARS
184
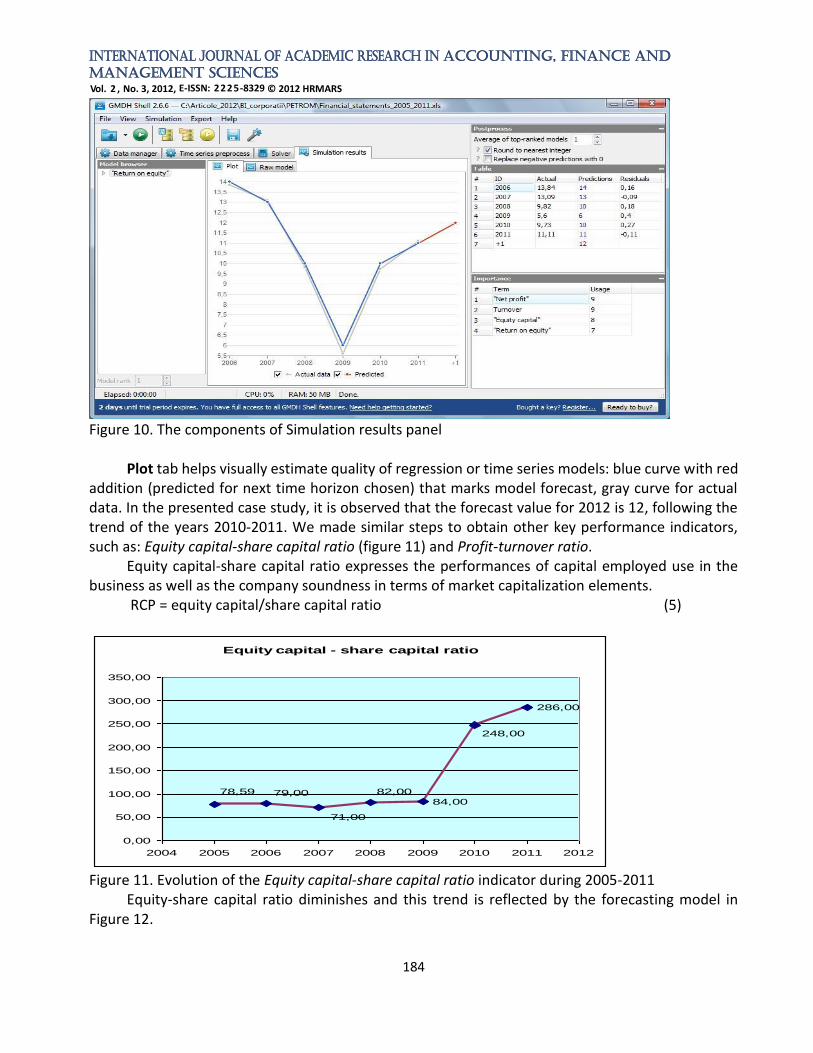
Figure 10. The components of Simulation results panel
Plot tab helps visually estimate quality of regression or time series models: blue curve with red addition (predicted for next time horizon chosen) that marks model forecast, gray curve for actual data. In the presented case study, it is observed that the forecast value for 2012 is 12, following the trend of the years 2010-2011. We made similar steps to obtain other key performance indicators, such as: Equity capital-share capital ratio (figure 11) and Profit-turnover ratio.
Equity capital-share capital ratio expresses the performances of capital employed use in the business as well as the company soundness in terms of market capitalization elements.
RCP = equity capital/share capital ratio (5)
Figure 11. Evolution of the Equity capital-share capital ratio indicator during 2005-2011
Equity-share capital ratio diminishes and this trend is reflected by the forecasting model in Figure 12.
Equity capital - share capital ratio
84,00
286,00
248,00
82,00
71,00
79,0078,59
0,00
50,00
100,00
150,00
200,00
250,00
300,00
350,00
2004 2005 2006 2007 2008 2009 2010 2011 2012

INTERNATIONAL JOURNAL OF ACADEMIC RESEARCH IN ACCOUNTING, FINANCE AND
MANAGEMENT SCIENCES
Vol. 2 , No. 3, 2012, E-ISSN: 2225-8329 © 2012 HRMARS
185
Figure 12. Simulation results for Equity capital-share capital ratio Conclusions
Forecast accuracy is a criterion which can be considered, obviously, decisive for a manager. Some of the ideas from these diagnostic checks, and from the related activity of forecast monitoring, are helpful in the study case presented, namely comparing the relative accuracy of several different forecasting methods on the same data.
Reaching this point the authors of this paper seems to be natural ask themselves: Is a forecast that will approach the reality? Which forecasting method should be used in this case? First, it is mandatory to do a comparative forecasting, using the initial dataset: from n samples,
we can choose a number m<n as historical data, while the second part of data, m-n, will be forecast and compared with real ones. After the analysis of comparison the forecast to actual, it is indicated to recommend the method that made the most accurate forecasts.
Secondly, it is necessary to make an assessment of the accuracy of predictions, comparing partial data published by the company in the first two semesters 2012 and we analyzed the mismatch causes. Obviously, forecasts must look at future trends; the real test of a forecasting method is whether it produces appropriate predictions for real data. In other words, we are interested to know if a method works for real-time conditions.
In our experiment, the forecast accuracy is affected by the reduced set of input data (only 7 samples, corresponding to the period 2005-2011) and ignoring clearly macroeconomic factors that influence forecasts.
As increasing pressure is put on managers to make better decisions and more accurate estimates, it becomes increasingly important to provide a decision support system that will allow

INTERNATIONAL JOURNAL OF ACADEMIC RESEARCH IN ACCOUNTING, FINANCE AND
MANAGEMENT SCIENCES
Vol. 2 , No. 3, 2012, E-ISSN: 2225-8329 © 2012 HRMARS
186
them to review, in detail, past and current performance, as well as predict future conditions and activities. As a result, the demand for the integration of advanced modeling and forecasting techniques into top management applications will rise to meet those needs. References Kotorov, R. (2009). Enhancing Decision-Making, Cost-Efficiency, and Profitability with Predictive
Analytics. Information Builders Elder, J. (2012). The Best and the Worst of Predictive Analytics: Predictive Modeling Methods and
Common Data Mining Mistakes, Elder Research, Inc. Workshop, http://docs.media.bitpipe.com/io_10x/io_105908/item_564128/ worst_practice_wp.pdf
Chatfield, C. (2000). Time-Series Forecasting, http://ccoms-imsuerj.org.br/capfts/wp-content/uploads/2011/08/ Chatfield_Ch_Tim_Series_Forecasting(2000)(1st%20edition)(280).pdf
Nyce, C. (2007), Predictive Analytics White Paper, American Institute for Chartered Property Casualty Underwriters/Insurance Institute of America, p. 1,
http://www.aicpcu.org/doc/predictivemodelingwhitepaper.pdf Eckerson, W. (2007), Extending the Value of Your Data Warehousing Investment, The Data
Warehouse Institute, http://tdwi.org/articles/2007/05/10/predictive-analytics.aspx?sc_lang=en
Korn, S. (2011), "The Opportunity for Predictive Analytics in Finance", HPC Wire, http://www.hpcwire.com/hpcwire/2011-04-21/the_opportunity_for_predictive_analytics_in_finance.html
Investment dictionary, Forecasting, http://investment_terms.enacademic.com/6683/Forecasting http://www.businessdictionary.com/definition/forecasting.html Duell, T. (2001), Forecasting Demand in a Changing Economy, A Formulations Pro, Inc. White Paper:
July 2001, http://www.formulationspro.com/ToddDuell/Articles/downloads/8.pdf Cave, W. (2011). Prediction Theory For Control Systems, http://www.predictsys.com/PredictionTheory.pdf Kucharavy, D., De Guio, R. (2005). Problems of Forecast, ETRIA TRIZ Future 2005 conference, Graz,
Austria, http://www.seecore.org/d/2005_01.pdf http://www.gmdhshell.com/docs/ (2012) Derby, N. (2008). Time series Forecasting Methods, Statis Pro Data Analytics, Seattle, USA, Victoria
SAS Users Group


![[StockDice] Application for Stock Exchange Monitoring And Business Intelligent Forecasting](https://img.dokumen.tips/doc/110x75/559822eb1a28aba1398b45dc/stockdice-application-for-stock-exchange-monitoring-and-business-intelligent-forecasting.jpg)