Embed Size (px)
Citation preview

74 INSIGHTS • AUTUMN 2016 www .willamette .com
Intellectual Property Valuation, Damages, and Transfer Price AnalysesRobert F. Reilly, CPA
Intellectual Property Insights
The analyst should be aware of the context in which the analysis is prepared. For example, most intellectual property valuation standards require that the analyst define certain
conditions under which the analysis is relevant. These conditions include the use of the analysis and the intended users, the intellectual property being analyzed, the standard of
value and the premise of value, and the effective date of the analysis. In a different context, many of these conditions can be different and those differences may render the conclusions of the analysis irrelevant. In a different context, the report describing the analysis conclusion
may be considered irrelevant. This is because that report doesn’t explain the analytical approaches within the appropriate context. This discussion considers different types of intellectual property, different contexts for analyzing intellectual property, and different
intellectual property valuation, damages, and transfer price methods.
inTroducTionThis discussion summarizes the various types of intellectual property and the primary reasons why owner/operators may need to analyze their intel-lectual property. This discussion describes the generally accepted intellectual property valuation, damages, and transfer price methods. Finally, this discussion presents an illustrative example of a trademark valuation, a patent economic damages analysis, and a trademark intercompany transfer price analysis.
Types of inTeLLecTuaL properTyThere are four (and only four) types of intellectual property:
n Patents
n Trademarks
n Copyrights
n Trade secrets
Patents, trademarks, and copyrights are created under, and protected by, federal statutes. Trade secrets are created under, and protected by, state statutes. Most states have either completely adopt-ed—or have adopted the essence of—the Uniform Trade Secret Act within their state statutes.
For valuation, damages, or transfer price analy-ses, the four intellectual property categories are sometimes expanded to include associated or con-tributory intangible assets. The patents category may include patent applications, the technology and designs encompassed in the patent, and the engineering drawings and other technical docu-mentation that accompanies the patent or patent application.
The trademarks category may include trade-marks (both registered and unregistered), trade names, service marks, service names, trade dress, product labeling that includes trademarks, institu-tional advertising (including signage), and promo-tional materials that include trademarks.
The copyrights category may include both regis-tered and unregistered copyrights on publications,

www .willamette .com INSIGHTS • AUTUMN 2016 75
manuscripts, white papers, musical compositions, plays, manuals, films, computer source code, blue-prints, technical drawings, and other forms of docu-mentation.
For most purposes, the trade secrets category includes any information or procedure that (1) the owner/operator keeps secret and (2) provides some economic benefit to the owner/operator.
Such trade secrets may include the following:
n Computer software source code
n Employee manuals and procedures
n Computer system user manuals and proce-dures
n Company operating manuals and proce-dures
n Chemical formulas
n Food and beverage recipes
n Product designs
n Engineering drawings and technical docu-mentation
n Plant or process schematics
n Financial statements
n Employee files and records
n Customer files and records
n Vendor files and records
n Contracts and agreements
An owner/operator may own two or more related intellectual properties. For example, the same prod-uct can have a utility patent and a design patent. The same product can have a patent and a trade-mark. The same software can hold a copyright and be a trade secret. The same procedure manuals can hold a copyright and be a trade secret. The same drawings and schematics can be included within a patent, have a copyright, and be a trade secret.
Because the owner/operator can own more than one intellectual property, the analyst may be asked to assign values for the individual intellectual prop-erty for fair value accounting, income tax account-ing, property tax accounting, and other purposes.
In disputes related to infringement or breach of contract, two or more intellectual property assets may be damaged by the wrongful action. In that case, the analyst may be asked to assign or allocate the damages amount among the affected intellectual property.
The damages analysis should consider each of the affected intellectual properties. And, the dam-ages analysis should not double count the amount of damages by assigning the same damages to two or more intellectual properties.
Within a multinational corporation, different busi-ness units in different juris-dictions can own different intellectual property. For example, a product design could benefit from a utility or design patent in county alpha, the product could be manu-factured with a trade secret in county beta, and a trademark could be assigned to the final product in county gamma. Such a multinational corpora-tion may retain the analyst to determine the intercompany transfer price for each intellectual property application.
reasons To anaLyze inTeLLecTuaL properTy
Analysts may be asked to perform intellectual prop-erty valuations for the following reasons:
1. Financial accounting: fair value acquisition accounting and intangible asset impairment testing
2. Income tax accounting: value of a contribu-tion from an owner to a company or of a distribution from a company to an owner, a charitable contribution, abandonment deduction, taxpayer solvency or insolvency analysis, or the purchase price allocation in a taxable acquisition
3. Property tax accounting: for intangible assets that are either subject to property tax or exempt from property tax
4. Bankruptcy: post-bankruptcy fresh start accounting, value of debt collateral, reason-ably equivalent value of assets transferred into or out of the bankruptcy estate, fair-ness of the price of a bankruptcy estate asset sale, and debtor solvency or insol-vency analysis
5. Fairness of transaction price: between any two arm’s-length parties, between a parent corporation and a less-than-wholly-owned subsidiary, and between a for-profit entity and a not-for-profit entity
Analysts may be asked to measure intellectual property economic damages for the following reasons:
1. Tort disputes: infringement claims, breach of a duty claims, and interference with business opportunity claims
“[T]he damages analysis should not double count the amount of damages by assigning the same damages to two or more intel-lectual properties.”

76 INSIGHTS • AUTUMN 2016 www .willamette .com
2. Breach of contract disputes: breach of a use license, development agreement, com-mercialization agreement, confidentiality agreement, or other license or contract
3. Expropriation and eminent domain claims: where the intellectual property is taken by some government agency or regulatory authority
4. Partnership or joint venture disputes: regarding an intellectual property holding company or a joint venture development or commercialization entity
Analysts may be asked to determine an arm’s-length price (ALP) for the following reasons:
1. International taxpayer intercompany trans-fer: transfer price for the use of an intan-gible property between multinational con-trolled entities of a single taxpayer in com-pliance with Internal Revenue Code Section 482
2. Domestic intercompany transfer: transfer price for the use of an intangible property between the multistate controlled entities of a single domestic taxpayer
3. Intercompany transfer within a consoli-dated entity: intercompany transfer price for an intellectual property use between a wholly owned subsidiary and a less-than-wholly-owned subsidiary
4. Transfer between third party entities: fair-ness of a use license ALP (or royalty rate) between independent third parties or fair market value price for a use license between a for-profit entity and a not-for-profit entity
VaLuaTion meThodsAll of the generally accepted valuation approach-es are applicable to intellectual property. Cost approach methods are particularly applicable to a contributory (sometimes called backroom) intellec-tual property. Market approach methods are appli-cable to an intellectual property that is (or could be) licensed. And, income approach methods are applicable to an intellectual property that produces a measurable amount of operating income for the owner/operator.
The cost approach may be applicable to the valu-ation of trade secret proprietary information and of copyrights on internal use software. For example,
the cost approach may be used to value procedure manuals, training manuals, technical documenta-tion and drawings, internal use training films, con-fidential books and records, confidential customer or supplier files, or the source code for internal use computer software.
For such intellectual property, it may be difficult for the analyst to assemble comparable uncontrolled transaction (CUT) sale or license data or to identify property-specific income measures.
The market approach may be applicable to the valuation of patents, trademarks, and certain copyrights. For such intellectual property, the asset owner/developer may license the use of the intellec-tual property to a third-party operator. The various forms of royalty payments from the licensee to the licensor (for example, royalty as a percent of rev-enue, as a percent of income, or on a per unit basis) may be used to estimate the intellectual property value.
The income approach may be applicable to the valuation of patented or unpatented (trade secret) processes or technologies. The income approach may also be applicable to the valuation of certain trademarks and copyrights.
For example, this approach may be applicable if the patented product or process (or the trade secret product formulation in process) allows the owner to generate increased revenue or experience decreased costs. This income measure may occur when the owner/operator experiences increased unit sales or increased unit selling prices due to the proprietary feature. Alternatively, it may occur if the owner/operator experiences decreased operat-ing expenses or decreased other expenses due to a property process.
The income approach may be used in the valu-ation of copyrights related to books, plays, musical compositions, or films and film libraries. This is because the analyst can often identify a measurable stream of income associated with the commercial-ization of the copyrighted work.
damages meThodsThe determination of the appropriate damages methods in an intellectual property dispute is often a legal decision. The analyst should consult with legal counsel as to the judicially allowable damages methods with respect to the intellectual property type, the damages claim type, and the particular jurisdiction.
With regard to trademarks, the damages meth-ods typically include the following:
www .willamette .com INSIGHTS • AUTUMN 2016 77
1. Lost profits
2. Reasonable royalty rate
3. Cost to cure (or decrease in trademark value)
4. Statutory damages
In order to measure lost profits, the analyst may apply the before and after method, the yardstick method, or the projections method. Each of these methods compares the owner/operator’s income to some measure of income that the owner/operator would have earned but for the damages event. The damages event could be a breach of contract, a tort, or some other wrongful action.
In some cases, a statutorily determined damages amount may be available to the trademark owner. The analyst should consult with counsel regarding the application and measurement of such statutory damages.
The reasonable royalty rate is often based on third-party CUT license agreements. The royalty rate could also be estimated based on a profit split method or a residual property split method.
The cost to cure is often based on the com-parison of a before-damages event value to an after-damages event value. That analysis often includes an opportunity cost component (that is, the owner/operator’s lost income during the intellectual prop-erty restoration [cure] period).
With regard to patents, the damages methods typically include the following:
1. Lost profits
2. Reasonable royalty
3. Cost to cure (or decrease in patent value)
These methods are often applied in a manner consistent with the trademark damages methods.
With regard to copyrights, the damages methods typically include the following:
1. Lost profits
2. Reasonable royalty rate
3. Cost to cure (or decrease in copyright value)
4. Unjust enrichment
5. Statutory damages
The application of the first three damages methods is consistent with the trademark and pat-ent methods. Unjust enrichment typically has two components. The first component relates to the
revenue generated by the damaging party that uses the copyright in any way. The second component relates to the variable costs to generate that measure of revenue. The damaging party’s revenue (using the copyright) minus the dam-aging party’s variable costs equals the unjust enrich-ment.
Unjust enrichment is calculated for each time period during the damages period. As with other dam-ages measures, prejudgment interest is often added to the actual unjust enrichment in order to conclude the amount of the legal claim. The unjust enrich-ment damages method involves the damaging party’s disgorgement of any and all “ill-gotten gains” related to the damages event.
Other damages measures are based on various economics and accounting concepts. The unjust enrichment damages measurement is based on a legal concept: the disgorgement of profits earned from the wrongful activity. The analyst should confirm with counsel that the unjust enrichment method is legally permissible in the instant circum-stances.
Specific statutory damages may also apply to certain wrongful actions related to copyrights. The analyst should consult with counsel regarding the application of such statutory damages amounts in any particular situation.
With regard to trade secrets, the damages meth-ods typically include the following:
1. Lost profits
2. Reasonable royalty
3. Cost to cure (or decrease in trade secret value)
4. Unjust enrichment
All of the “but for” damages measurements described here are available to the trade secret owner/operator. To apply these lost profits mea-surements, the damaged party is usually both the owner and operator of the trade secret because these methods measure the profits that the trade secret owner would have earned but for the wrong-ful action.
In applying such an analysis, the owner either operates the exact trade secret or a similar trade
“The unjust enrich-ment damages method involves the damaging party’s disgorgement of any and all ‘ill-gotten gains’ related to the damages event.”

78 INSIGHTS • AUTUMN 2016 www .willamette .com
secret. Therefore, the analyst can use alternative benchmarks of the owner’s financial performance to measure the owner’s damages. Those alternative benchmarks in the “but for” world include the following:
1. The owner’s actual financial performance before and after the damages event
2. The owner’s projection of financial performance without the damages event
3. An industry, economic, or other yardstick measurement of the owner’s financial per-formance in the “but for” world
If the owner never operated (that is, commercial-ized) the trade secret, then it may be difficult for the analyst to assemble the information needed to perform a lost profits analysis. Such instances occur when the trade secret owner (1) licensed out the trade secret use to a third-party operator or (2) sub-contracted with a third-party provider to supply the trade secret goods or services. In these instances, the analyst may have to apply a damages method other than the lost profits methods.
Even if the owner never outbound licenses the trade secret use to a third-party operator, the analyst often can use the reasonable royalty rate method. The analyst may conclude a reasonable royalty rate based on the following:
1. The owner’s other inbound or outbound license agreements
2. CUT licenses
3. A profit split analysis of the trade secret operator’s operations
4. A residual profit split analysis of the trade secret operator’s operations
5. A fair rate of return on the trade secret value (often estimated using a cost approach method)
Analysts should recognize that it is very difficult to obtain data regarding CUT trade secret licenses. Other intellectual property owners often outbound license their patents, trademarks, and copyrights.
Trade secret owners rarely outbound license their trade secrets so that they remain secret. Intellectual property license agreements generally include confidentiality provisions. Nonetheless, the outbound trade secret license involves the owner
sharing the secret with the operator. Accordingly, there are fewer trade secret CUT data than there are copyright, patent, or trademark CUT data.
As with the lost profits methods, it may be more difficult to apply the cost to cure method to a trade secret owner than to a trade secret owner/operator.
The cost to cure damages method typically involves some comparison of the (1) intellectual property value before the damages event and (2) the intellectual property value after the damages event. It is challenging to estimate the value (before or after) of the trade secret to the owner. This is because the owner (compared to the owner/opera-tor) only generates nonoperating license income. In contrast, the owner/operator generates all forms of income (both license income and operating income) associated with the trade secret. The analyst should include all of the trade secret income generation in the cost to cure or decrease in value damages analysis.
An unjust enrichment damages method is often used in cases in which the trade secret owner is not also the trade secret operator. In such instances, it may be straightforward to identify the damages event. It is also relatively straightforward to iden-tify the damaging party’s variable revenue, variable costs, and unjust enrichment related to the damages event.
The legal theory behind the unjust enrichment method is also straightforward: the damaging party should disgorge all of its ill-gotten gains associated with the wrongful action.
An unjust enrichment analysis is based more on legal principles than on economics or accounting principles. Therefore, the analyst should confirm with counsel that an unjust enrichment legal rem-edy is available to the trade secret owner in the subject jurisdiction.
Transfer price meThodsThis discussion focuses primarily on the intan-
gible property intercompany transfer price analy-sis for federal income tax purposes. Section 482 deals with the allocation of income and deductions among taxpayers. Section 482 applies to the transfer of intangible property between controlled entities within a common corporation. Specifically, Section 482 applies to the transfer of intangible prop-erty between two (or more) controlled entities and between two (or more) countries.
Section 482 applies to a domestic parent cor-poration when a domestic subsidiary develops an intangible property and transfers the use of that
“Analysts should recognize that it is very dif-ficult to obtain data regarding CUT trade secret licenses.”
www .willamette .com INSIGHTS • AUTUMN 2016 79
intangible property to a foreign subsidiary. In that case, the foreign subsidiary has to pay an arm’s-length royalty (or other type of transfer price) to the domestic subsidiary for the use of the domestic company’s intangible property. This type of transfer price represents foreign income being recognized by the domestic company.
Section 482 also applies to a foreign parent corporation when the foreign subsidiary develops an intangible property and transfers the use of that intangible property to the domestic subsidiary. In that case, the domestic subsidiary has to pay an arm’s-length royalty (or other type of transfer price) to the foreign subsidiary for the use of the foreign company’s intangible property. This type of transfer price represents a deduction being recognized by the domestic company.
The Section 482 regulations provide that all such intercompany transfer prices should be based on the arm’s-length standard.
Regulation 1.482-1(b)(1) relates to any intercom-pany transfer: “the standard to be applied in every case is that of a taxpayer dealing at arm’s length with an uncontrolled taxpayer. A controlled transac-tion meets the arm’s length standard if the results of the transaction are consistent with the results that would have been realized if uncontrolled taxpayers had engaged in the same transaction under the same circumstances (arm’s length result).”
Regulation 1.482-1(b)(2) explains that there are specific ALP methods related to the intercompany transfers of tangible property and intangible prop-erty: “Sections 1.1482-2 through 1.1482-6 provide specific methods to be used to evaluate whether transactions between or among members of the controlled group satisfy the arm’s length standard, and if they do not, to determine the arm’s length result.”
With regard to the allowable methods, the regu-lations require that the analyst select and apply a single best method. This procedure is called the best method rule. Regulation 1.482(c)(1) puts forth that “the arm’s-length result of a controlled transaction must be determined under the method that, under the facts and circumstances, provides the most reli-able measure of the arm’s length result.”
Regulation 1.482(c)(2) provides the criteria for the analyst’s selection of the single best method for measuring the ALP. The regulation indicates that “data based on the results of transactions between unrelated parties provides the most objective basis for determining whether the results of a controlled transaction are at arm’s length.” The criteria to select the best method are as follows:
1. Comparability. The analyst should consider the comparability between the controlled transaction or taxpayer and the uncon-trolled transaction or taxpayer.
2. Data and assumptions. The analyst should consider the completeness and accuracy of the underlying data, the reliability of the assumptions, and the sensitivity of the results to possible deficiencies in the data and assumptions.
3. Confirmation of the results by another method. “If the best method rule does not clearly indicate which method should be selected, an additional factor that may be taken into account in selecting a method is whether any of the competing methods produce results that are consistent with the results obtained from the appropriate appli-cation of another method” (See Regulation 1.482(c)(2)(iii)).
Regulation 1.482(d) discusses the comparability between the controlled and the uncontrolled tax-payer or transaction:
[F]or this purpose, the comparability of transactions and circumstances must be evaluated considering all factors that could affect prices or profits in arm’s length deal-ings (comparability factors). . . . Such fac-tors include the following:
(i) functions,
(ii) contractual terms,
(iii) risks,
(iv) economic conditions, and
(v) property or services.
Regulation 1.482-3 describes the allowable meth-ods for calculating the tangible property intercom-pany transfer price. These methods are beyond the scope of this discussion. Nonetheless, the analyst should be aware of these allowable tangible property intercompany transfer price methods:
1. The comparable uncontrolled price method (see Regulation 1.482-3(b))
2. The resale price method (see Regulation 1.482-3(c))
3. The cost plus method (see Regulation 1.482-3(d))
4. The comparable profits method (see Regulation 1.482-5)
5. The profit split method (see Regulation 1.482-6)

80 INSIGHTS • AUTUMN 2016 www .willamette .com
6. Unspecified (other) methods (see Regulation 1.482-3(e))
Regulation 1.482-4 describes the allowable methods for calculating the intangible property intercompany transfer price. Regulation 1.482-4 is titled “Methods to determine taxable income in connection with a transfer of intangible property.” Nonetheless, the regulations do not specifically define the term “intangible property.” However, Regulation 1.482-4(b) is titled “Definition of intan-gible.” This regulation defines the term “intangible” as follows:
For purposes of section 482, an intangible is an asset that comprises any of the following items and has substantial value indepen-dent of the services of any individual—
(1) Patents, inventions, formulae, process-es, designs, patterns, or know-how;
(2) Copyrights and literary, musical, or artistic compositions;
(3) Trademarks, trade names, or brand names;
(4) Franchises, licenses, or contracts;
(5) Methods, programs, systems, proce-dures, campaigns, surveys, studies, fore-casts, estimates, customer lists, or technical data; and
(6) Other similar items. For purposes of section 482, an item is considered similar to those listed in paragraph (b)(1) through (5) of this section if it derives its value not from its physical attributes but from its intellectual content or other intangible properties.
Regulation 1.482-4(c) describes the CUT meth-od. The CUT method is based on the selection and analysis of the arm’s-length sales or licenses of similar intangible property. As stated in Regulation 1.482-4(c)(1)
(t)he comparable uncontrolled transac-tion method evaluates whether the amount charged for a controlled transfer of intan-gible property was arm’s length by reference to the amount charged in a comparable uncontrolled transaction.
Regulation 1.482-4(c)(2) describes the compa-rability and reliability considerations related to the application of the CUT method. Reliability looks at whether the uncontrolled transaction involves the transfer of the same intangible property under the
same, or substantially the same, circumstances as in the controlled transaction.
The regulation also states that the degree of comparability of the controlled transaction and the selected uncontrolled transactions is based on a set of comparability factors. These comparability fac-tors include:
1. The comparability of the intangible prop-erty:
n Are the CUT intangible assets and the taxpayer intangible asset used in con-nection with similar products or pro-cesses within the same general industry or market?
n Do the CUT intangible assets and the taxpayer intangible asset have the same profit potential?
2. The comparability of the transfer circum-stances:
n Are the terms of the transfer (for exam-ple, exploitation rights, exclusivity, use restrictions, and geography restric-tions) similar?
n Is the stage of development (between the CUT intangible property and the taxpayer intangible property) similar?
n Are the rights to receive intangible property updates, modifications, and revisions similar?
n Is there a similar degree of uniqueness, including legal protection (between the CUT intangible assets and the taxpayer intangible property)?
n Is the duration of the license or other agreement similar?
n Are the product liability or other eco-nomic risks similar?
n Is the existence of ongoing business relationships (if any) between the transferor and the transferee similar?
n Are the functions performed by the transferor and the transferee similar?
Regulation 1.482-4(a)(1) describes the CUT method by providing illustrative examples of the selection, adjustment, and application of CUT intan-gible property license agreements and royalty rate data.
Regulation 1.482-5 describes and illustrates the application of the comparable profits method. When used in other (non-Section 482) contexts, this transfer price method is sometimes called the com-
www .willamette .com INSIGHTS • AUTUMN 2016 81
parable profit margin method. Whatever title the analyst uses, the methodology is the same:
1. The analyst selects uncontrolled companies (in the Section 482 case, uncontrolled tax-payers) that can be compared to the subject taxpayer. These uncontrolled companies either operate or don’t operate (depending on which side of the taxpayer intercompany transfer is tested) a similar intangible asset to the taxpayer’s intangible asset.
2. The analyst selects the appropriate profit level indicator (PLI) to use as the inter-company transfer price test metric. The common PLIs are listed in the regulation as follows:
n Rate of return on the amount of capital employed (that is, a measure of return on investment).
n Various profit margin financial ratios, including the ratio of operating profit margin to sales and the ratio of gross profit margin to sales (that is, measures of profit margin). The regulation also allows for other PLIs.
3. The analyst selects the tested party within the taxpayer intangible property transferor. The tested party can be either the trans-feror of the taxpayer intangible property or the transferee of the taxpayer intangible property. The selection of the tested party is based on which party has the most reli-able data and requires the least amount of adjustments.
4. The appropriate intercompany transfer price is the price that brings the tested party’s PLI (either a return on investment or a profit margin on sales) in line with the selected uncontrolled companies’ PLIs.
When selecting the uncontrolled comparable companies, the analyst should consider the compa-rability and reliability factors described above. In particular, the analyst should consider the function-al, risk, and resource comparability of the selected comparable companies compared to the taxpayer tested party.
Regulation 1.482-6 describes the profit split method for measuring the appropriate intercom-pany transfer price:
The profit split method evaluates whether the allocation of the combined operating profit or loss attributable to one or more controlled transactions is arm’s length by reference to the relative value of each
controlled taxpayer’s contribution to that combined operating profit or loss. The combined operating profit or loss must be derived from the most narrowly identifiable business activity of the controlled taxpayers for which data is available that includes the controlled transactions (relevant business activity).
To allocate the taxpayer’s profit under the profit split method (that is, to determine the appropriate profit split percentage), the analyst may use one of two allowable profit allocation methods: the com-parability profit split method or the residual profit split method.
The comparable profit split method compares the division (or split) of operating profits among the controlled taxpayer entities to the division (or split) of operating profits among the selected uncontrolled companies engaged in similar activities under simi-lar circumstances.
The comparable profit split method may not be used if the combined operating profit (as a percent-age of the combined assets) of the uncontrolled comparable companies varies significantly from the operating profit earned by the controlled taxpayer entities.
In the residual profit split method, first, the analyst identifies and applies a fair rate of return to the taxpayer’s routine (also called contributory) tangible assets and intangible assets. Second, the analyst provides a market-based rate of return on the taxpayer’s routine tangible and intangible assets.
The regulation looks at the contribution that these routine (or contributory) assets make to the uncontrolled taxpayer business. Therefore, the regulation uses the term “routine contributions.”
Routine contributions are contributions of the same or a similar kind to those made by uncon-trolled companies involved in similar business activities for which it is possible to identify market returns. They ordinarily include contributions of tangible property, services, and intangible property that are owned by uncontrolled companies engaged in similar activities.
The analyst performs a functional analysis to identify these contributions according to the functions performed, the risks assumed, and the resources employed by each of the controlled tax-payer entities. Market returns for the routine contri-butions are determined by reference to the returns achieved by uncontrolled companies engaged in similar activities.

82 INSIGHTS • AUTUMN 2016 www .willamette .com
Finally, an unspecified method (as described in Regulation 1.482-4(d)) for determining the intan-gible property intercompany transfer price is any method not described as an allowable method in the regulations. Such a method should meet the compa-rability and reliability criteria described above and should be the best method to measure the ALP of the intercompany transfer of the taxpayer intangible property.
Trademark VaLuaTion iLLusTraTiVe exampLe
In this illustrative example, the analyst is asked to estimate the fair market value of the Upsilon Company (Upsilon) trademarks and trade names as of January 1, 2014. Upsilon is a regional telecommu-nications company that provides land-line local and long distance telephone service, cellular telephone service, internet provider service, and data transfer services.
Upsilon is assessed for state ad valorem property tax purposes based on the unit valuation principle. That is, the entire assemblage of Upsilon tangible assets and intangible assets is valued as a single operating unit.
In the state in which Upsilon operates, identifi-able intangible assets are exempt from property taxation. Therefore, Upsilon management has to report the value of the company’s trademarks (and other identifiable intangible assets). Management then subtracts the value of the company’s intangible
assets from the Upsilon total unit (or business enterprise) value in order to conclude the value of the company’s tangible assets (real estate and tangible personal property) that are sub-ject to property taxation.
The valuation objective is to estimate the fair market value of the Upsilon trademarks and trade names. The valuation pur-pose is to assist management with its ad valorem property tax compliance as of the January 1, 2014, assessment date.
Upsilon Trademarks OverviewUpsilon owns over 200 U.S. trademarks (the “subject trade-marks”). The subject trade-
marks are registered and used in connection with Upsilon services and promoted to Upsilon customers or potential customers. The most important trade-marks are the Upsilon trademark and the U trade-mark, as they constitute the Upsilon principle brand marks and, combined, compose the corporate logo. These marks are used extensively across all of the Upsilon product lines and throughout the country, including inside and outside of the company build-ings, on the company website, and on the company’s consumer advertising.
Upsilon conducts extensive advertising in a variety of media including television, radio, print, and online. The Upsilon name appears on service vehicles, buildings, and employee uniforms. In addi-tion, Upsilon sponsors a variety of professional and collegiate-level sports.
Intellectual Property Valuation Analysis
The analyst considered all three generally accepted valuation approaches. Based on the quantity and quality of available data, the analyst selected the market approach—and the relief from royalty meth-od—to estimate the fair market value of the subject trademarks.
The relief from royalty method is based on the principle that the intellectual property owner would be willing to pay a reasonable royalty rate to license the intellectual property if that owner did not already own the property.
www .willamette .com INSIGHTS • AUTUMN 2016 83
License royalty rates are estimated from the analysis of market-derived empirical data with respect to arm’s-length licenses of guideline intellectual prop-erty assets.
The analyst considered the following royalty rate scenarios:
1. Royalty income that is earned—or could be earned—by the owner of the intellectual property (such as trademarks) by licensing the intel-lectual property to an independent party
2. Hypothetical roy-alty expense that is not paid to an independent third party licensor because the owner (a) in fact owns the intellectual property or the right to use the intellectual property and (b) does not have to license the intellectual property from a third-party licensor
This second analytical scenario is the basis for the analyst’s relief from royalty method analysis.
The avoided royalty expense measured in the relief from royalty method analyses may take many forms, such as (1) total royalty dollar payments per period, (2) royalty rate as a percentage of revenue, (3) royalty rate as a percentage of profits, (4) royalty dollar amount per unit sold, and (5) royalty dollar amount per unit allocated.
Upsilon (as the intellectual property operator) does not have to pay itself (as the intellectual prop-erty owner) a license fee for the right to use the subject trademarks. Therefore, the analyst calcu-lated the hypothetical royalty expense that would be paid if Upsilon had to license the subject trademarks from a third-party licensor. The analyst based this avoided royalty expense on a percentage of Upsilon revenue from the subject trademarks.
Royalty rates in the telecommunications indus-try vary depending on a variety of factors, including the popularity of the trademark and the amount of revenue attributable to each trademark.
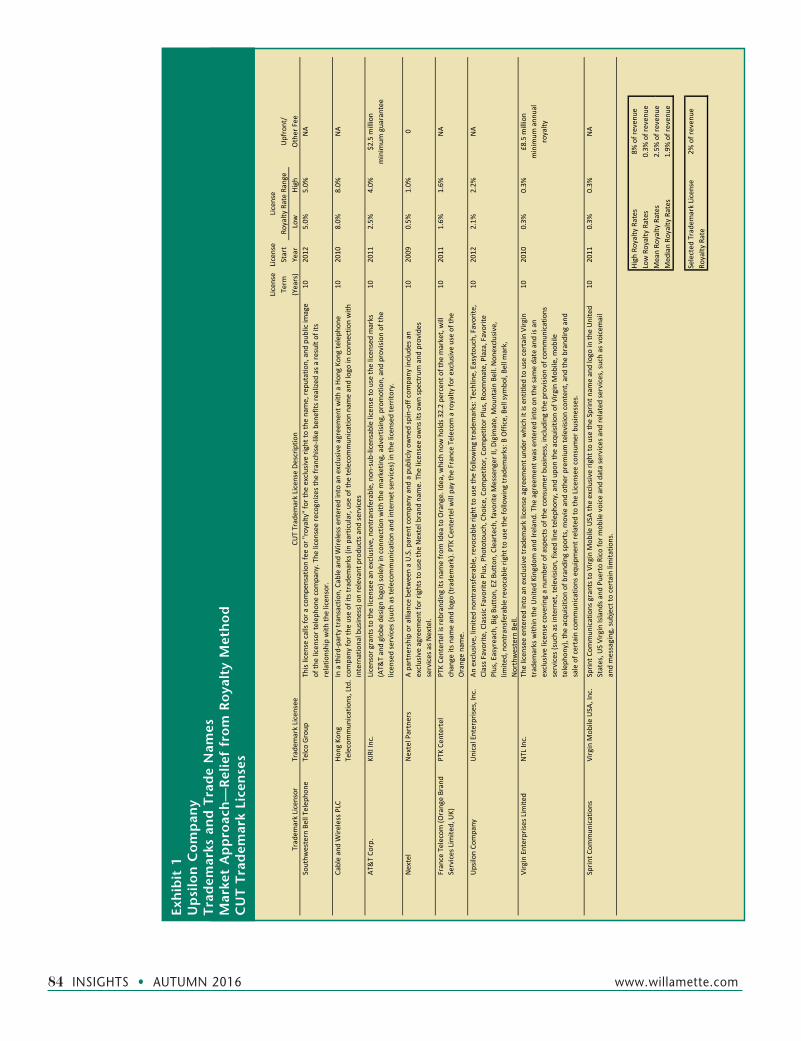
The analyst gathered publicly available data related to arm’s-length royalty or license agreements
and selected eight CUT trademark license agree-ments, which are summarized in Exhibit 1.
The analyst converted the actual arm’s-length royalty or license payments to a common-size roy-alty rate based on a percentage of revenue. This esti-mated fair royalty rate is multiplied by the projected Upsilon revenue to estimate the royalty expense avoided by reason of owning rather than licensing the subject trademarks.
The analyst tax-affected this avoided royalty expense in order to estimate the after-tax benefit associated with the avoided royalty payments.
The tax-affected avoided royalty expense is projected for a discrete projection period and then capitalized in the terminal year, discounting the avoided royalty expense to present value based on the Upsilon weighted average cost of capital. The analyst applies the yield capitalization method.
One of the eight CUTs is a license agree-ment between Upsilon, as the licensor, and Unical Enterprises, Inc. (Unical), as the licensee. This license agreement is for the use of various Upsilon trademarks in the telecommunications industry. The royalty rate that is actually being paid by Unical to Upsilon for the use of the subject trademarks ranged between 2.1 percent and 2.2 percent.
In applying an appropriate royalty rate to cal-culate the avoided royalty expense on the subject trademarks, the analyst also considered telecom-munication industry norms and the subject trade-marks’ brand awareness.
84 INSIGHTS • AUTUMN 2016 www .willamette .com
License
License
Term
Start
Upfront/
Tradem
ark Licensor
Tradem
ark Licensee
CUT Tradem
ark License De
scrip
tion
(Years)
Year
Low
High
Other Fee
Southw
estern Bell Telep
hone
Telco Group
This license calls fo
r a com
pensation fee or "royalty" for th
e exclusive rig
ht to
the name, re
putatio
n, and
pub
lic im
age
of th
e licen
sor telep
hone
com
pany. The
licensee
recognize
s the
franchise
‐like ben
efits re
alize
d as a re
sult of its
relatio
nship with
the licen
sor.
102012
5.0%
5.0%
NA
Cable and Wire
less PLC
Hong
Kon
g Telecommun
ications, Ltd.In
a th
ird‐party transaction, Cable and
Wire
less entered
into an exclusive agreem
ent w
ith a Hon
g Ko
ng te
leph
one
company
for the
use of its tradem
arks (in particular, use of the
telecommun
ication name and logo
in con
nection with
international business) on relevant produ
cts a
nd se
rvices
102010
8.0%
8.0%
NA
AT&T Co
rp.
KIRI Inc.
Licensor grants to the licen
see an
exclusive, non
transferable, non
‐sub
‐licensable license to use th
e licen
sed marks
(AT&
T and glob
e de
sign logo) solely in con
nection with
the marketin
g, advertising, promotion, and
provisio
n of th
e licen
sed services (such as te
lecommun
ication and internet se
rvices) in the licen
sed territo
ry.
102011
2.5%
4.0%
$2.5 m
illion
minim
um guarantee
Nextel
Nextel Partners
A partne
rship or alliance between a U.S. paren
t com
pany
and
a pub
licly owne
d spin‐off com
pany
includ
es an
exclusive agreem
ent for rights to
use th
e Nextel brand
nam
e. The
licensee
owns its o
wn spectrum
and
provide
s services as N
extel.
102009
0.5%
1.0%
0
France Telecom
(Orange Brand
Services Lim
ited, UK)
P TK Ce
ntertel
PTK Ce
ntertel is reb
rand
ing its nam
e from
Idea to
Orange. Idea, w
hich now
holds 32.2 pe
rcen
t of the
market, will
change
its n
ame and logo
(trade
mark). PTK
Cen
tertel will pay th
e France Telecom
a ro
yalty
for e
xclusive use of the
Orange name.
102011
1.6%
1.6%
NA
Upsilon Co
mpany
Unical Enterprise
s, Inc.
An exclusive, lim
ited no
ntransferable, re
vocable rig
ht to
use th
e following tradem
arks: Techline, Easytou
ch, Favorite
, Class F
avorite
, Classic Favorite
Plus, Pho
totouch, Cho
ice, Com
petitor, C
ompe
titor Plus, Roo
mmate, Plaza, Favorite
Plus, Easyreach, B
ig Button, EZ Bu
tton
, Cleartech, favorite
Messenger II, D
igim
ate, M
ountain Be
ll. Non
exclusive,
limite
d, non
transferable re
vocable rig
ht to
use th
e following tradem
arks: B
Office, B
ell sym
bol, Be
ll mark,
Northwestern Bell.
102012
2.1%
2.2%
NA
Virgin Enterprise
s Lim
ited
NTL Inc.
The licen
see en
tered into an exclusive tradem
ark licen
se agreemen
t und
er which it is entitled
to use certain Virg
in
tradem
arks with
in th
e United Kingdo
m and
Ireland. The
agreemen
t was entered
into on the same date and
is an
exclusive licen
se covering a nu
mbe
r of a
spects of the
con
sumer business, includ
ing the provision
of com
mun
ications
services (such as internet, television
, fixed
line
teleph
ony, and
upo
n the acqu
isitio
n of Virg
in M
obile, m
obile
teleph
ony), the
acquisition of brand
ing sports, m
ovie and
other premium te
levisio
n conten
t, and the branding
and
sale of certain com
mun
ications equ
ipmen
t related
to th
e Licensee
con
sumer businesses.
102010
0.3%
0.3%
£8.5 m
illion
minim
um ann
ual
royalty
Sprin
t Com
mun
ications
Virgin M
obile USA
, Inc.
Sprin
t Com
mun
ications grants to Virgin M
obile USA
the exclusive rig
ht to
use th
e Sprin
t nam
e and logo
in th
e United
States, U
S Virgin Island
s and
Pue
rto Rico fo
r mob
ile voice and
data services and
related services, such as voicemail
and messaging, sub
ject to
certain limita
tions.
102011
0.3%
0.3%
NA
High
Royalty Rates
8% of reven
ueLow Royalty Rates
0.3%
of reven
ueMeanRo
yalty
Rates
25%
ofrevenu
e
License
Royalty
Rate Ra
nge
Mean Ro
yalty
Rates
2.5%
of reven
ueMed
ian Ro
yalty
Rates
1.9%
of reven
ue
Selected
Trade
mark License
2% of reven
ueRo
yalty
Rate
Exh
ibit
1U
psi
lon
Co
mp
any
Tra
dem
arks
an
d T
rad
e N
ames
Mar
ket
Ap
pro
ach
—R
elie
f fr
om
Ro
yalt
y M
eth
od
CU
T T
rad
emar
k Li
cen
ses
www .willamette .com INSIGHTS • AUTUMN 2016 85
The factors that positively influence the value of the subject trademarks are as follows:
1. The consistency and broad use of the trade-marks
2. The positive connotation and reputation associated with the trademarks by custom-ers and potential customers
3. The association with a quality service
4. The Upsilon profitability compared to the telecommunications industry average prof-itability
5. The numerous means by which the subject trademarks are promoted
Based on the qualitative assessment of the attri-butes of the subject trademarks and the consider-ation of the CUT trademark licenses, the analyst selected a royalty rate of 2 percent.
The analyst calculated the discrete period pro-jection of avoided royalty expense by multiplying projected operating revenue for 2014–2017 by the selected royalty rate of 2 percent.
Next, the analyst subtracted the discrete period trademark licensee’s maintenance expense. This is the expense related to maintaining, refreshing, promoting, and protecting the trademark that would be necessary to allow Upsilon to use the subject trademarks for a 20-year remaining useful life (RUL) post 2017. This projection of the licensee’s expected intellectual property maintenance and protection expense was provided by Upsilon management.
Next, the analyst tax-affected the avoided net royalty expense to estimate the after-tax avoided royalty expense to Upsilon.
The analyst discounted this after-tax net avoided royalty expense to a present value at an appropriate discount rate.
The analyst calculated the projected 2018 avoid-ed net royalty expense by multiplying the 2017 pro-jected after-tax avoided net royalty expense by one plus the expected long-term growth rate (of nega-tive one percent). This avoided net royalty expense incorporates the licensee’s trademark maintenance and protection expense. The analyst assumed a 20-year RUL after 2017.
The analyst capitalized the projected 2018 avoid-ed net royalty expense by an appropriate direct capitalization rate (for a 20-year RUL) to estimate the trademark terminal value. Then, the analyst dis-counted the trademark terminal value to a present value at an appropriate discount rate.
Upsilon Trademarks Value ConclusionAs presented in Exhibit 2, adding the present value of the discrete period avoided net royalty expense to the present value of the terminal period avoided net royalty expense results in an indicated fair market value of the subject trademarks, as of January 1, 2014, of $840 million (rounded).
paTenT damages iLLusTraTiVe exampLe
In this illustrative example, the analyst is asked to measure the amount of damages related to a patent infringement claim.
Alpha Company (“Alpha”) manufactures and sells the product Beta. Alpha holds a utility patent on Beta. Gamma Company (“Gamma”) manufac-tures and sells the product Delta. Alpha manage-ment claims that the Delta product infringes on the Beta patent. Legal counsel for Alpha retained the analyst to measure the amount of damages suffered by Alpha as a result of the infringement of the Beta patent.
Based on the quantity and quality of available data, the analyst selected lost profits as the appro-priate measure of economic damages. Also, the analyst selected the projections method to measure the lost profits. The analyst selected the projections method because Alpha management had prepared a long-term financial plan for the Beta product prior to the patent infringement damages event.
Damages AnalysisIn this simple example, let’s assume that the pat-ent infringement starts on January 1, 2010. After Gamma is contacted by Alpha’s counsel, the patent infringement concludes on December 31, 2013. Therefore, the patent infringement period is 2010 through 2013.
To keep this illustrative example simple, let’s assume that there is no residual damages affect on the Beta product after the 2013 conclusion of the infringement period. And, let’s assume that Alpha did everything it could to mitigate the damages dur-ing the infringement period.
In this example, Alpha management had pre-pared a long-term financial plan encompassing the Beta product line. That long-term plan was prepared before the inception of the infringement period.
The analyst prepared the damages analysis in 2014, after the conclusion of the infringement period. Therefore, all of the Alpha’s actual results of

86 INSIGHTS • AUTUMN 2016 www .willamette .com
operations, including the total impact of the alleged patent infringement, were available to the analyst.
Damages ConclusionWith this information, the analyst prepared the lost profits analysis presented in Exhibit 3. This dam-ages analysis indicates that Alpha suffered total lost profits of $1,665,000 during the infringement period.
Of course, in determining the total damages claim, the analyst may also consider the income tax consequences of a $1,665,000 lost profits judi-cial award. That is, such a judicial award would
represent taxable income to Alpha. Therefore, the damages claim may also include the income tax liability associated with the lost profits award. In addition, the analyst would consider the calculation of prejudgment interest on the amount of lost profits for each time period up to the date of the judicial award.
Trademark Transfer price anaLysis iLLusTraTiVe exampLe
The analyst is retained to determine an intercom-pany transfer price for the controlled transfer of
2014 2015 2016 2017Discrete Projection Period Avoided Royalty Expense: $000 $000 $000 $000
Projected Revenue [a] 9,037,000 8,891,000 8,807,000 8,752,000
Arm's‐Length Trademark License Royalty Rate [b] ___ _____2% _______ _2% ____ ____2% ____ ____2%Projected Gross Avoided Trademark License Royalty Expense 180,740 177,020 176,140 175,040 Less: Trademark License Expense [c] 13,740 13,540 13,380 13,300 Projected Pretax Avoided Trademark License Net Royalty Expense 167,000 164,380 162,760 161,740 Less: Projected Income Tax Rate ____ ___41% ____ _ __41% ____ ___41% ____ ___41%Projected After‐Tax Avoided Trademark Net Royalty Expense 98,530 96,925 96,208 95,427
Discounting Periods [d] 0.5000 1.5000 2.5000 3.5000Present Value Factor @ 11% [e] 0.9492 0.8551 0.7704 0.6940 Present Value of Avoided Trademark Net Royalty Expense (rounded) 94,000 83,000 74,000 66,000
Terminal Period Avoided Royalty Expense:Fiscal 2018 Normalized Avoided Net Royalty Expense [f] 94,482$ Direct Capitalization Rate [g] _____ __12.5%Terminal Value 755,856 Present Value Factor @ 11% 0.694 Present Value of Terminal Period Avoided Trademark Net Royalty Expense (rounded) 525,000$
Valuation Summary:Present Value of Discrete Period Avoided Net Royalty Expense 317,000$ Present Value of Terminal Period Avoided Net Royalty Expense 525,000 Indicated Fair Market Value of Upsilon Trademarks and Trade Names (rounded) 840,000$
Footnotes:[a] Based on management projections.[b] Based on an analysis of CUT trademark license agreements.[c] Projected license expense related to maintaining, promoting, and protecting the subject trademarks into perpetuity.[d] Calculated as if royalty expense is paid at mid‐year.[e] Based on the Upsilon WACC.[f] B d h 2017 j d f id d d k l d h d l h f 1
Projected Calendar Year
[f] Based on the 2017 projected after‐tax avoided trademark royalty expense and the expected long‐term growth rate of ‐1 percent.[g] Calculated as the present value of an annuity factor for an 11% WACC and a 20‐year RUL.
Exhibit 2Upsilon CompanyTrademarks and Trade NamesMarket Approach—Relief from Royalty MethodValuation SummaryAs of January 1, 2014

www .willamette .com INSIGHTS • AUTUMN 2016 87
Damages
Analysis
FYE De
cembe
r 31 for E
ach Year
Varia
ble
2007
2008
2009
2010
2011
2012
2013
Actual (W
ith th
e Pa
tent Infringement) Operatin
g Re
sults
Num
ber o
f Beta Prod
uct U
nits Sold (000
)A
7080
9010
050
5560
Price Pe
r Beta Prod
uct U
nit ($)
B10
1010
108
88
Total Beta Prod
uct Line Re
venu
e ($00
0)C=
A×B
700
700
700
1,00
040
044
048
0
Varia
ble Co
st Per Beta Unit ($)
D4
44
45
55
Total Beta Prod
uct Line Va
riable Co
sts ($0
00)
E=A×
B28
032
036
040
025
027
530
0Be
ta Produ
ct Line Co
ntrib
ution Margin ($00
0)F=C ─
E42
048
054
060
015
016
518
0
Projected (W
ithou
t the
Patent Infrin
gement) Operatin
g Re
sults
Num
ber o
f Beta Prod
uct U
nits Sold (000
)G
100
110
120
130
Price Pe
r Beta Prod
uct U
nit ($)
H10
1010
10 Total Beta Prod
uct Line Re
venu
e ($00
0)I=G×H
1,00
01,10
0
1,20
0
1,30
0
Varia
ble Co
st Per Beta Unit (4)
J4
44
4To
talBetaProd
uctLineVa
riableCo
sts($0
00)
KG×J
400
440
480
520
Before th
e Patent
Durin
g the Patent
Infringemen
t Period
Infringemen
t Period
Total Beta Prod
uct Line Va
riable Co
sts ($0
00)
K=G×J
400
440
480
520
Beta Produ
ct Line Co
ntrib
ution Margin ($00
0)L=I─K
600
660
720
780
Lost Profits D
ue to
the Alleged Patent Infringemen
t ($0
00)
M=L─F
051
055
560
0
Total Lost P
rofits S
uffered by
Alpha
Com
pany
(be
fore calculatio
n of prejudgmen
t interest)
$1,665
,000
Exh
ibit
3A
lph
a C
om
pan
yB
eta
Pat
ent
Infr
ing
emen
t C
laim
Illu
stra
tive
Dam
ages
An
alys
isLo
st P
rofi
ts D
amag
es A
nal
ysis
Usi
ng
th
e P
roje
ctio
ns
Met
ho
d

88 INSIGHTS • AUTUMN 2016 www .willamette .com
intellectual property between the domestic and foreign subsidiaries of a domestic multinational cor-poration. The transfer price analysis is performed to assist the taxpayer Omicron, Inc. (“Omicron”) with its compliance with Section 482 for federal income tax purposes.
Purpose and Objective of the AnalysisThe analysis objective is to estimate the ALP, as of December 2, 2013 (the “analysis date”), for the fol-lowing intercompany transfer transactions between Omicron and certain Omicron wholly owned sub-sidiaries:
1. The license of the Omicron trademark (the “subject trademark”) by Omicron to Omicron of Europe BV (OE)
2. The license of the subject trademark by Omicron to Omicron of Canada, Ltd. (OC)
3. The license of the subject trademark by Omicron to Omicron of UK, Ltd. (OUK)
The analysis purpose is to assist Omicron man-agement in determining an intercompany transfer price in compliance with Section 482 and the asso-ciated regulations.
Section 482 RegulationsThe purpose of Regulation 1.482 is to ensure that taxpayers clearly reflect the income attributable to controlled transactions. The standard to be applied in every case is that of a taxpayer dealing at arm’s length with an uncontrolled taxpayer. A controlled transaction meets the arm’s-length standard if the results of the controlled transaction are consistent with the results that would have been realized if uncontrolled taxpayers had engaged in the same transaction under the same circumstances.
This ALP analysis relates to intercompany trans-actions between Omicron and certain of its interna-tional subsidiaries. For these intercompany transac-tions, the Omicron international subsidiaries intend to pay Omicron an ALP for a use license related to the subject trademark.
Regulation 1.482 stipulates that ALP consid-erations for intercompany transactions should be determined using the best method rule. The best method rule states that “the arm’s-length result of a controlled transaction must be determined under the method that, under the facts and circumstances, provides the most reliable measure of an arm’s-length result” (see Regulation 1.482-1(c)).
The analyst applied the best method rule to esti-mate an ALP for the transactions between Omicron and its international subsidiaries.
Section 482 states that the governing principle in determining the allocation of taxable income between related parties is the arm’s-length standard. This standard states that the price for a transaction between related parties should be the same as if unrelated taxpayers had engaged in the same trans-action under the same or similar circumstances. The determination of whether a transaction pro-duces an arm’s-length result is made by reference to results of comparable transactions under compa-rable circumstances.
Section 482 is applied by comparing the related-party transaction to a similar transaction between unrelated parties. The arm’s-length standard and the comparability test give Section 482 a market orientation that requires the examination of both the facts and circumstances relevant to the related transaction and the facts and circumstances rel-evant to unrelated transactions used to test the related transaction.
The comparison between related transactions and comparable transactions is performed on actual financial results over a similar period. The similar-ity of the related transactions to the comparable transactions in one period does not indicate that this similarity holds in other periods. Periodic com-parability tests are typically performed to confirm that the related transactions correctly reflect the economic and business realities of a given set of transactions.
The Section 482 regulations state that the “stan-dard to be applied in every case is that of a taxpayer dealing at arm’s length with an uncontrolled tax-payer” (Regulation 1.482-1(b)(1)). The regulations emphasize that it is more than just the ALPs that should be consistent with the uncontrolled transac-tion. The arm’s-length results should also be con-sistent.
The regulations also allow for an arm’s-length range that the results should fall within. If the actual financial results of the taxpayer fall within the arm’s-length range, which is derived from applying the same pricing method to two or more uncontrolled transactions that have a similar level of comparability and reliability, then no adjust-ment will be made to the income or deductions of that taxpayer.
The arm’s-length range consists of the results of all of the uncontrolled comparables that meet the following conditions:

www .willamette .com INSIGHTS • AUTUMN 2016 89
1. The information on the con-trolled transaction and the uncontrolled comparables is sufficiently complete that it is likely that all material differ-ences have been identified.
2. Each such difference has a definite and reasonably ascer-tainable effect on price or profit.
3. An adjustment is made by the analyst to eliminate the effect of each such difference.
If there are no uncontrolled com-parables that meet these conditions, then the arm’s-length range is derived from the results of all the uncontrolled comparables that achieve a similar level of comparability and reliabil-ity. In such cases, the reliability of the ALP analysis should be increased, where it is possible to do so.
This reliability is accomplished by adjusting the indicated range through the application of a valid statistical method to the results of all of the selected uncon-trolled comparables.
The reliability of the ALP analysis is increased when statistical methods are used to establish a range of results in which the limits of the range will be determined such that there is a 75 percent prob-ability of a result falling above the lower end of the range and a 75 percent probability of a result falling below the upper end of the range.
The interquartile range ordinarily provides an acceptable measure of this ALP range. The inter-quartile range is the range from the 25th percentile to the 75th percentile of the results derived from the uncontrolled comparables.
Selecting the Best MethodIn selecting the best method, the analyst followed the guidance provided by the regulations. The best method is defined as the method that produces the most reliable measure of an arm’s-length result for the subject transactions, considering all of the rel-evant facts and circumstances with regard to each transaction.
The analyst considered two primary factors in order to determine the best method. The first fac-tor was the degree of comparability between the subject transaction and the CUTs. The five consid-
erations to determine the degree of comparability are as follows:
n Functions performedn Contractual termsn Risks bornen Economic conditions
n Nature of the property or services
The second factor was the quality of the data and the assumptions used in the ALP analysis. There are several considerations to assess the quality of the data and the assumptions. The analyst considered each of these factors:
n Completeness and accuracy of the data
n Reliability of assumptions
n Sensitivity of the results to deficiencies in data and assumptions
The analyst assessed each of the relevant meth-ods to determine which is most reliable in consid-eration of the fact pattern and the availability and reliability of the data. Based on these factors, the analyst selected the CUT method to estimate the Omicron trademark ALP.
Subject Trademarks OverviewThe Omicron name was created in October 1960 for a millwork plant in Portland Falls, Oregon. Before

90 INSIGHTS • AUTUMN 2016 www .willamette .com
1960, the Omicron trademark had already been in use for a number of years by the Omicron family. Omicron holds approximately 250 registered trade-marks; approximately 100 issued patents, utility models, and design registrations; and approximately 65 pending patent applications.
Omicron sells doors under a variety of trade-marks throughout Europe. The company holds the first or second market position for doors in Germany, the United Kingdom, Denmark, Sweden, Norway, Switzerland, France, Spain, and Finland, which together accounted for 90 percent of European sales in 2013.
Omicron holds a leading position in the window market in Canada and the United Kingdom. Brand strength is particularly important in the global win-dow industry. The company manufactures and sells its windows exclusively under the Omicron brand in the United States, Canada, and the United Kingdom.
In Canada, Omicron is the largest manufacturer of residential windows and a leading manufacturer of doors. Products in Canada have been marketed exclusively under the Omicron brand since 2005. In 2002, the company sold its products under the Omicron brand and also under another local brand. Omicron is the only full-line door and window manufacturer in North America.
Omicron sells its products directly to customers around the world through the company’s market-ing and branding initiatives. The marketing initia-tives focus on increasing awareness of the Omicron brand. Omicron promotes its brand and products using print and television advertising and profes-sional athletic sponsorships.
According to the company’s corporate counsel, the Omicron brand is registered as a commu-nity trademark, which is a trademark registered in each member state of the European Union where Omicron has operations.
The Omicron trademark has limited registration outside of the United States. Although Omicron has been operating since 1960, the Omicron brand has a relatively short operating history outside of the United States.
Application of the CUT MethodThe trademark license agreements between Omicron and its international subsidiaries are referred to as the “subject transactions.” Omicron owns the subject trademark. Omicron plans to license the subject trademark to its international subsidiaries.
The analyst assembled comparable license agree-ments that grant a licensee the right to sell branded products within a designated territory.
The subject transfers are effective on or near the analysis date, and the transfers may be applied retroactively to the beginning of the 2013 calen-dar year. The analyst considered this factor in the selection of the CUT licenses. For the purposes of estimating a royalty rate, the analyst selected CUTs that were effective in the year approximating the analysis date (that is, calendar year 2013).
Identification of CUTsThe analyst identified CUT license agreements by searching the following sources:
1. RoyaltySource royalty rate database
2. ktMINE royalty rates and records database
3. U.S. Securities and Exchange Commission filings of companies that are classified in standard industry classification (SIC) code 2430 (millwork, veneer, plywood, and struc-tural wood) and SIC code 5030 (lumber and other construction materials)
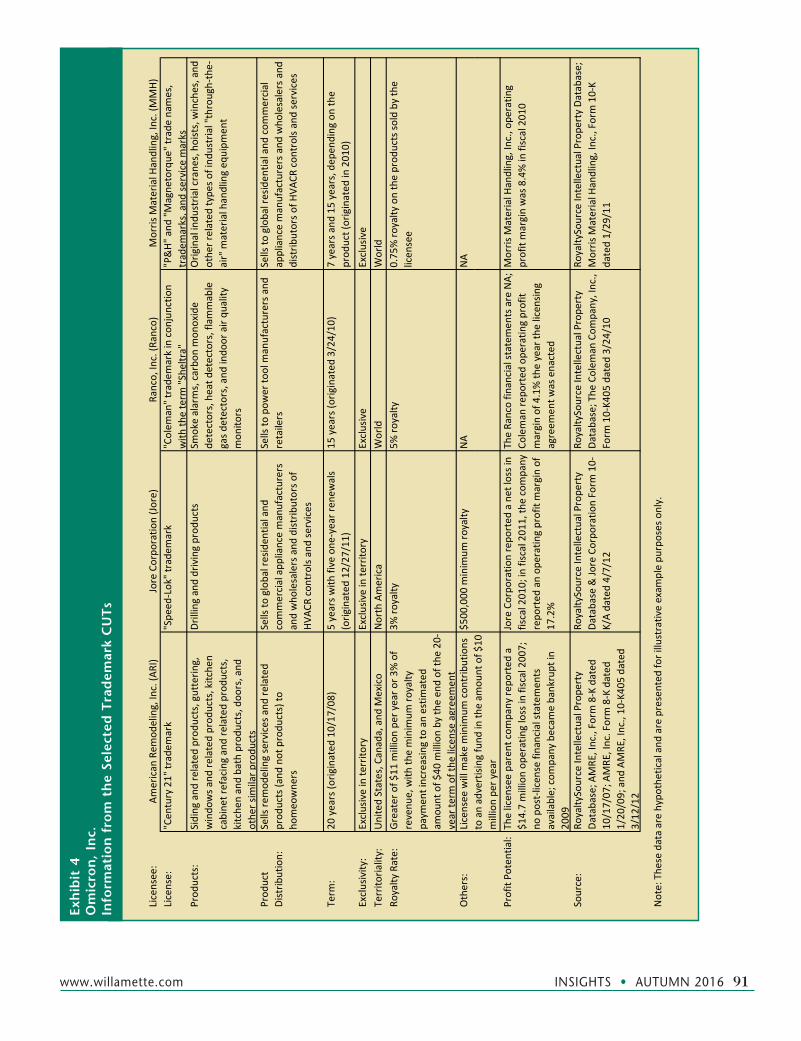
Exhibit 4 summarizes relevant information about the selected CUTs.
The analyst considered the following factors regarding the selected CUTs:
n All of the CUTs were still in effect in 2013. All of the CUTs were executed between 2008 and 2012.
n All of the CUTs involved companies that manufactured durable goods. None of the CUTs involved a window or door manufac-turer.
n ARI is primarily a service company. ARI licensed the “Century 21” trademark for home improvement products sold and installed by ARI. Although it was primar-ily a service company, ARI manufactured home remodeling products sold under the Century 21 trademark.
n The Century21 license agreement con-tained a minimum royalty payment. The Speed-Lok license agreement required annual contributions to the licensor com-pany for advertising, and there was not sufficient detail regarding the other two CUTs to determine if the licensee agreed to make payments to the licensor in addition to the agreed upon royalties. All else being equal, these net sales guarantees gener-ally allow for a lower net sales royalty rate. The subject transactions are not subject to minimum net sales guarantees, and the Omicron subsidiaries are not required to pay Omicron for advertising costs.
www .willamette .com INSIGHTS • AUTUMN 2016 91
Licensee:
American
Rem
odeling, Inc. (A
RI)
Jore Corpo
ratio
n (Jo
re)
Ranco, Inc. (R
anco)
Morris M
aterial H
andling, Inc. (M
MH)
License:
"Cen
tury 21" tradem
ark
"Spe
ed‐Lok" trade
mark
"Colem
an" trade
mark in con
junctio
n with
the term
"She
ltra"
"P&H"
and
"Magne
torque
" trade
nam
es,
tradem
arks, and
service marks
Prod
ucts:
Siding
and
related prod
ucts, gutterin
g,
windo
ws a
nd re
lated prod
ucts, kitche
n cabine
t refacing and related prod
ucts,
kitche
n and bath produ
cts, doo
rs, and
othe
r sim
ilar p
rodu
cts
Drilling and driving prod
ucts
Smoke alarms, carbo
n mon
oxide
detectors, heat d
etectors, flammable
gas d
etectors, and
indo
or air qu
ality
mon
itors
Orig
inal indu
stria
l crane
s, hoists, winches, and
othe
r related
type
s of ind
ustrial "through‐the‐
air" m
aterial handling eq
uipm
ent
Prod
uct
Distrib
ution:
Sells re
mod
eling services and
related
prod
ucts (and
not produ
cts) to
ho
meo
wne
rs
Sells to
global residen
tial and
commercial app
liance manufacturers
and who
lesalers and
distrib
utors o
f HV
ACR controls and
services
Sells to
pow
er to
ol m
anufacturers and
retailers
Sells to
global residen
tial and
com
mercial
appliance manufacturers and
who
lesalers and
distrib
utors o
f HVA
CR con
trols a
nd se
rvices
Term
:20
years (o
riginated
10/17
/08)
5 years w
ith five one
‐year ren
ewals
(orig
inated
12/27
/11)
15 years (o
riginated
3/24/10
)7 years a
nd 15 years, dep
ending
on the
prod
uct (originated
in 201
0)Exclusivity:
Exclusive in te
rrito
ryExclusive in te
rrito
ryExclusive
Exclusive
Territo
riality:
United States, C
anada, and
Mexico
North America
World
World
Royalty
Rate:
Greater of $
11 m
illion pe
r year o
r 3% of
revenu
e, with
the minim
um ro
yalty
paym
ent increasing to an estim
ated
am
ount of $
40 m
illion by th
e en
d of th
e 20
‐year te
rm of the
license agreem
ent
3% ro
yalty
5% ro
yalty
0.75
% ro
yalty
on the prod
ucts so
ld by the
licen
see
Others:
Licensee
will m
ake minim
um con
tributions
df
dh
f$$5
00,000
minim
um ro
yalty
NA
NA
to an advertising
fund
in th
e am
ount of $
10
million pe
r year
Profit Po
tential:
The licen
see parent com
pany re
ported
a
$14.7 million op
erating loss in fiscal 200
7;
no post‐licen
se financial statemen
ts
available; com
pany becam
e bankrupt in
2009
Jore Corpo
ratio
n repo
rted
a net loss in
fiscal 201
0; in fiscal 201
1, th
e company
repo
rted
an op
erating profit margin of
17.2%
The Ra
nco fin
ancial statem
ents are NA;
Coleman
repo
rted
ope
ratin
g profit
margin of 4.1% th
e year th
e licen
sing
agreem
ent w
as enacted
Morris M
aterial H
andling, Inc., ope
ratin
g profit margin was 8.4% in fiscal 201
0
Source:
RoyaltySource Intellectual Prope
rty
Database; A
MRE
, Inc., Form
8‐K dated
10
/17/07
; AMRE
, Inc. Form 8‐K dated
1/20
/09; and
AMRE
, Inc., 10
‐K40
5 dated
3/12
/12
RoyaltySource Intellectual Prope
rty
Database & Jo
re Corpo
ratio
n Form
10‐
K/A dated 4/7/12
RoyaltySource Intellectual Prope
rty
Database; The
Colem
an Com
pany, Inc.,
Form
10‐K4
05 dated
3/24/10
RoyaltySource Intellectual Prope
rty Da
tabase;
Morris M
aterial H
andling, Inc., Form 10‐K
dated 1/29
/11
Note: The
se data are hypo
thetical and
are presented
for illustrative exam
ple pu
rposes only.
Exh
ibit
4O
mic
ron
, In
c.In
form
atio
n f
rom
th
e Se
lect
ed T
rad
emar
k C
UT
s

92 INSIGHTS • AUTUMN 2016 www .willamette .com
n The royalty rate specified in the P&H and Magnatorque license agreement was based on a percent of the licensee’s total sales (and not only the sales related to the licensed products). All else being equal, this formula allows for a lower net sales royalty rate. The ALP for the license of the subject trademark will be based on a percent of sales of products sold with the subject trademark (and not the respective company’s total sales).
n Several of the CUTs provide for licensee exclusivity in multicountry territories. All else being equal, the exclusivity of a larger territory allows for a higher net sales roy-alty rate. The subject transactions allow for the nonexclusive right to promote or sell merchandise in a single territory. However, the subject companies operated in large and well-developed markets.
n The operating profit margin of the licensee during the year of the CUT was negative for the ARI parent company and Jore and posi-tive for MMH. Financial statements were unavailable for Ranco. However, Coleman, the licensor in the transaction with Ranco, reported an operating profit margin of 4.1 percent. MMH reported an operating profit margin of 8.4 percent in its fiscal 2013. The normalized 2011 operating profit mar-gin from OC, OE, and OUK was 8.8 per-cent, negative 0.9 percent, and 5.9 percent, respectively. A higher profit margin implies a higher net sales royalty rate, all other fac-tors being equal.
The CUT net sales royalty rates ranged from 0.75 percent to 5.0 percent. The P&H and Magnatorque CUT had a 0.75 percent net sales royalty rate; the Century21 CUT and Speed-Lok CUT each had a 3 percent net sales royalty rate; and the Coleman and Sheltra CUT had a 5 percent net sales royalty rate.
The P&H and Magnatorque CUT was adjusted (down) because the royalty rate was based on total MMH product sales and not only the product sales affected by the licensed trademark. However, the royalty rate on this transaction was adjusted (up) since the licensee was granted worldwide exclusiv-ity.
The Century21 CUT and Speed-Lok CUT was adjusted (down) because the license included com-pensation in addition to the royalty rate.
The Coleman and Sheltra CUT net sales royalty rate of 5 percent was for world exclusivity. This roy-
alty rate may have been less than 5 percent if the licensee territory were smaller.
Based on the selected CUT data, the analyst estimated a reasonable range of royalty rates at one percent to four percent of licensed product licenses sales where the licensee territory is a regional area (and not worldwide). This royalty rate range may need to be adjusted up or down based on the products, profit, and contract terms of the subject transactions.
To select a net sales royalty rate for the right to use the subject trademark, the analyst considered the following five factors:
1. The outlook for the window and door industry
2. The fundamental position of each subject company
3. The historical financial results of each sub-ject company
4. A functional analysis of the subject trade-mark
5. The license agreement terms of the subject transactions
Transfer Price ConclusionBased on the CUT method, the analyst concluded that an ALP (or the trademark royalty rate) for the right to use the subject trademark in Canada, as a percent of sales, is
2.5 percent.
The selected royalty rate for OC is at the higher end of the rate range indicated by the CUTs. The analyst reached this conclusion based primarily on the following:
1. The factors previously identified
2. The subject trademark being the only trade-mark used by OC in Canada
3. Marketing and promotion costs being borne by OC
4. The OC profitability compared to the licens-ees in the CUTs
5. The market share of the subject trademark in the OC territory. OC holds a leading posi-tion in the window end market in Canada. In Canada, OC is the largest provider of residential windows.
6. The subject trademark being first used exclusively in Canada in 2005 for the sale of products of windows and doors
7. OC operating in an industry and economy that has withstood the industry and

www .willamette .com INSIGHTS • AUTUMN 2016 93
economic downturn better than other regions of the world. Canada has fared better than other industrialized countries in the economic crisis. As of January 2013, Canada recovered all jobs lost in the recession and created additional jobs. In addition, it is expected that the window and door industry in Canada will outpace the overall economy in 2013.
Based on the CUT method, the analyst conclud-ed that an ALP (or the trademark royalty rate) for the right to use the subject trademark in Europe, as a percent of sales, is
1.5 percent.
The selected royalty rate for OE is below the lower end of the rate range indicated by the CUTs. The analyst reached this conclusion based primarily on the following:
1. The factors previously identified
2. OE using several other prominent brands in its window and door business besides the subject trademark
3. Marketing and promotion costs being borne by OE
4. OE reporting operating losses during the last three fiscal years. According to man-agement, OE targets increased profitability after restructuring
5. The market share of the subject trademark in the OE territory. OE sells its products under other prominent brands, which may compete with the Omicron brand.
6. The subject trademark not being used in all of the markets in Europe that OE competes in
7. OE operating in an industry and economy that has experienced a greater adverse impact from the industry and economic downturn than other regions of the world. Unemployment in the Euro Zone increased more than in other European countries. In addition, the windows market in Poland is the only other European market besides Germany to expand since 2008.
Based on the CUT method, the analyst conclud-ed that an ALP (or the trademark royalty rate) for the right to use the subject trademark in the United Kingdom, as a percent of sales, is
1.5 percent.
The selected royalty rate is at the lower end of the rate range indicated by the CUTs. The analyst reached this conclusion based primarily on the fol-lowing:
1. The factors previously identified
2. OUK using the subject trademark exclu-sively to market the Omicron products of doors and windows
3. Marketing and promotion costs being borne by OUK
4. OUK reporting operating losses during the last five fiscal years. According to manage-ment, the OUK operations experience some inefficiencies due to high labor costs and excess working capital investments.
5. The market share of the subject trademark in the OUK territory. OUK has 41 percent market share in doors and 15 percent market share in windows in the United Kingdom. OUK holds the first or second market position for doors and holds a lead-ing position in the window end market.
6. The fact that the United Kingdom—the OUK market—expects annual real GDP growth of 1.8 percent over the 2013–2020 period. However, according to the Scotiabank Group Global Forecast Update, a weaker economic recovery was expected in 2013 and 2014 in the United Kingdom, amid aggressive fiscal consolidation, slow export growth, and higher household debt levels.
summaryThis discussion described and illustrated intel-lectual property valuation, damages, and transfer price analyses. This discussion summarized the various types of intellectual property. This discus-sion explained the primary reasons to analyze intel-lectual property, including valuation, damages, and transfer price reasons.
This discussion explained the principal intellec-tual property valuation methods, damages methods, and intercompany transfer price methods. Finally, this discussion presented an illustrative example of a trademark valuation, a patent dam-ages analysis, and a trademark transfer price analysis.
Robert Reilly is a managing director of the firm and is resident in our Chicago office. Robert can be reached at (773) 399-4318 or at [email protected].