Embed Size (px)
Citation preview

1 Introduction
1.1 Audience and PurposeThis document provides details and certain examples describing the performance of Intel® Resource Director Technology (Intel® RDT) on 2nd Generation Intel® Xeon® Scalable processor products.
Service assurance, efficiency, flexibility across the data center, and deterministic performance (including predictable latency and throughput) are important system qualities for industry-standard applications. Intel RDT can help organizations enhance these system qualities by providing predictable, consistent application monitoring and improved efficiency of shared resources. With Intel RDT, organizations can optimize system resource utilization, ensure predictable latency, and improve throughput in their production deployments.
The Intel RDT feature set is subject to certain errata on specific products. This document provides details on the impact and mitigation options for these errata, which may be oberved on certain Intel Xeon Scalable processors. This document also provides discussion of potential methods for detecting those issues and, where applicable, methods for mitigating applicable errata. This reference manual is primarily intended for architects and engineers interested in how Intel RDT can benefit their environments.
Test configurations for each scenario presented may vary, and as such are documented alongside each test result.
Note that this document does not contain a comprehensive list of errata for the processor, and other Intel RDT errata may exist beyond the scope of this document. Contact your Intel representative for the latest Sightings Report document.
Intel® Resource Director Technology (Intel® RDT) on 2nd Generation Intel® Xeon® Scalable Processors Reference Manual
April 2019 Revision 1.0
Revision History
DocumentNumber Revision Affected Products Discussion
338822-001US 1.0 Initial release April 2019
RefeRence Manual

Reference Manual | Intel® Resource Director Technology (Intel® RDT) on 2nd Generation Intel® Xeon® Scalable Processors Reference Manual
Table of Contents1 Introduction . . . . . . . . . . . . . . . . . . . . . . 1 1.1 Audience and Purpose . . . . . . . . . . . . . . .1
1.1 Terminology . . . . . . . . . . . . . . . . . . . . . . . . .2
2 Intel RDT Overview . . . . . . . . . . . . . . . 2 2.1 Intel RDT Monitoring Features . . . . . . . .3
2.2 Intel RDT Allocation Features . . . . . . . .3
2.3 Intel RDT Errata on 2nd Generation . . . Intel Xeon Scalable Processors. . . . . . .3
2.4 Intel RDT Errata Changes Relative to 2nd Generation Intel Xeon Scalable Processors . . . . . . . . . . . . . . . . .4
3 Intel RDT Errata, Detection, and Mitigations . . . . . . . . . . . . . . . . . . . 4
3.1 CAT/CDP May Not Restrict Cacheline Allocation under Certain Conditions . .4
3.1.1 Problem . . . . . . . . . . . . . . . . . . . . . . . . .4
3.1.2 Implication . . . . . . . . . . . . . . . . . . . . . .4
3.1.3 Detection . . . . . . . . . . . . . . . . . . . . . . . .4
3.1.3 Workaround . . . . . . . . . . . . . . . . . . . 14
3.2 MBM Counters Might Be Inaccurate 15
3.2.1 Problem . . . . . . . . . . . . . . . . . . . . . . . 15
3.2.2 Implication . . . . . . . . . . . . . . . . . . . . 15
3.2.3 Detection . . . . . . . . . . . . . . . . . . . . . 15
3.2.4 Workaround . . . . . . . . . . . . . . . . . . 18
3.3 Intel® MBA May Incorrectly Throttle All Threads . . . . . . . . . . . . . . . . . . . . . . . . 18
3.3.1 Problem . . . . . . . . . . . . . . . . . . . . . . . 18
3.3.2 Implication . . . . . . . . . . . . . . . . . . . . 18
3.3.3 Detection . . . . . . . . . . . . . . . . . . . . . 18
3.3.4 Workaround . . . . . . . . . . . . . . . . . . 21
3.4 Intel MBA Read after MSR Write May Return Incorrect Values . . . . . . . 21
3.4.1 Problem . . . . . . . . . . . . . . . . . . . . . . . 21
3.4.2 Implication . . . . . . . . . . . . . . . . . . . . 21
3.4.3 Detection . . . . . . . . . . . . . . . . . . . . . 21
3.4.4 Workaround . . . . . . . . . . . . . . . . . . 22
3.5 Intel CMT and MBM Counters May Be Inaccurate When SNC Is Enabled . . . . . . . . . . . . . . . . . . . . . . . . . 22
3.5.1 Problem . . . . . . . . . . . . . . . . . . . . . . . 22
3.5.2 Implication . . . . . . . . . . . . . . . . . . . . 22
3.5.3 Detection . . . . . . . . . . . . . . . . . . . . . 22
3.5.4 Workaround . . . . . . . . . . . . . . . . . . 24
3.6 Intel MBM RMID Imbalance . . . . . . . . 24
3.6.1 Problem . . . . . . . . . . . . . . . . . . . . . . . 24
3.6.2 Implication . . . . . . . . . . . . . . . . . . . . 24
3.6.3 Detection . . . . . . . . . . . . . . . . . . . . . 24
3.6.4 Workaround . . . . . . . . . . . . . . . . . . 24
1.2 Terminology
Table 1. Common terminology
Table 1 defines important terms used in this document.
TERM DESCRIPTION
Intel® RDT Intel® Resource Director Technology
PQR A shorthand for the IA32_PQR_ASSOC model-specific register (MSR), which specifies the Class of Service (CLOS) and Resource Monitoring ID (RMID) tags of the currently running software thread on a logical processor
CAT Cache Allocation Technology
MBM Memory Bandwidth Monitoring
CMT Cache monitoring technology
MBA Memory Bandwidth Allocation
CDP Code and Data Prioritization, an extension of CAT
RMID Resource Monitoring ID, a per-thread tag for monitoring resource utilization
HP High-priority application, often a latency-sensitive application
CLOS Class of Service, a per-thread tag for controlling resource utilization
LP Lower-priority workloads
WIP Work in progress
LLC Last level cache
CBM Capacity Bit Mask
BW Bandwidth
2 Intel RDT OverviewData center system design is becoming more sophisticated, with dynamic applications and workloads running in complex virtualized software environments. Organizations can improve consolidation density and performance consistency by managing and controlling platform resources in more advanced ways. Example shared resources that have a significant effect on workload performance include processor cache and memory bandwidth resources, which can have a large impact on application performance and runtime determinism.
Monitoring and managing these resources more closely enables deployments to meet more stringent workload demands including increasingly strict performance service-level agreements (SLAs) to support emerging workloads such as Network Function Virtualization (NFV). In an environment needing increased throughput and lower latency to meet service-level objectives (SLOs), Intel RDT supports these goals through component features such as those listed below. These technologies provide a hardware framework to monitor and control the utilization of shared resources, such as last level cache (LLC) and main memory (DRAM) bandwidth.
Intel RDT is composed of a set of Intel® technologies, namely:
• Cache Allocation Technology (CAT)
• Code and Data Prioritization (CDP)
• Memory Bandwidth Allocation (MBA)
• Cache Monitoring Technology (CMT)
• Memory Bandwidth Monitoring (MBM)
2

Reference Manual | Intel® Resource Director Technology (Intel® RDT) on 2nd Generation Intel® Xeon® Scalable Processors Reference Manual
This document assumes a working knowledge of the Intel RDT architectural concepts described in Section 1.2. For detailed information on the Intel RDT technologies, refer to “Intel® 64 and IA-32 Architectures Software Developer Manuals” at: intel.com/content/www/us/en/processors/architectures-software-developer-manuals.html.
2.1 Intel RDT Monitoring FeaturesThe CMT and MBM features allow an operating system (OS), hypervisor, or Virtual Machine Monitor (VMM) to determine the cache capacity (CMT) and memory bandwidth (MBM) being used by applications running on the platform. Software can enumerate the presence and capabilities of CMT and MBM via CPUID. If present, feature details can be enumerated through CPUID, and an MSR interface is provided for configuration and usage. With CMT and MBM, software can enable an OS or VMM to assign Resource Monitoring IDs (RMIDs) for all applications or VMs that are scheduled to run on a core. CMT and MBM can then monitor cache occupancy and memory bandwidth on a per-RMID basis. An OS or VMM can read LLC occupancy and memory bandwidth for a given RMID at any time. Full details on the Intel RDT monitoring features are provided in Intel’s Software Developer Manuals.
Readings from CMT and MBM can be combined with other performance monitoring and performance metrics to create profiling trends that describe the amount of cache required to achieve a given level of performance, or the amount of memory bandwidth required.
By default, the Intel RDT monitoring features associate all threads with RMID [0], which provides information on overall memory bandwidth usage (and is likely to show that the LLC is fully utilized, subject to measurement noise). To monitor specific apps, VMs, containers, or functions, software can allocate RMIDs for this purpose.
RMIDs are common across monitoring features, meaning that RMID [N] has an associated cache capacity reading and memory bandwidth tracked, which can be retrieved by software independently of other RMIDs potentially in use. RMIDs, much like Classes of Service (CLOS), are managed by the OS/VMM at context swap to maintain the correct thread associations per logical processor.
2.2 Intel RDT Allocation FeaturesThe CAT, CDP, and MBA features allow an OS, hypervisor, or VMM to control allocation of a CPU’s shared resources, such as LLC and memory bandwidth. Once one or more of the CAT, CDP, or MBA features is configured, the processor allows access to portions of the shared resources by the corresponding CLOS, subject to software-configured resource-allocation guidance. The processor obeys this resource guidance when it executes an application thread or application process.
To summarize, the Intel RDT allocation features can be used by performing the following steps:
1. Determine via CPUID whether the CPU supports the MBA, CAT, and CDP features.
2. Configure the CLOS to define the amount of resources (such as LLC cache capacity) available to a given CLOS. This configuration is at the processor level and is common to all logical processors.
3. Associate each logical processor with an available CLOS.
4. Run the application on the logical processor that uses the desired CLOS.
Cache Allocation Technology (CAT) provides controls over the L2 or Last-Level Cache (LLC) depending on the supported features on a certain processor. Memory Bandwidth Allocation (MBA) is a feature that extends the Intel RDT allocation technologies beyond the cache to include memory bandwidth.
By default, the Intel RDT allocation features are configured with all threads in CLOS[0] and no resource constraints applied, effectively disabling resource controls until software configures and opts into using the features.
The same common CLOS apply to all Intel RDT allocation features, meaning that, for instance, CLOS[5] could be configured with a cache capacity and memory bandwidth limit independent of other CLOS in use on the system. Logically, this means that only a single CLOS tag needs to be associated with a thread, which is updated at context-swap time by software.
2.3 Intel RDT Errata on 2nd Generation Intel Xeon Scalable Processors
Certain errata affect product-specific implementations of Intel RDT. These errata, along with applicable products, are listed below. A number of the sections that follow describe the impact and mitigation options for these errata.
3

Reference Manual | Intel® Resource Director Technology (Intel® RDT) on 2nd Generation Intel® Xeon® Scalable Processors Reference Manual
Table 2. Cross-reference of Intel® RDT errata within scope
Errata Number Errata Title Affected Products Discussion
1 Intel Cache Allocation Technology (CAT)/Code and Data Prioritization (CDP) May Not Restrict Cacheline Allocation Under Certain Conditions
Intel® Xeon® Scalable processors, 2nd generation Intel Xeon Scalable processors, and derivatives
Section 3.1
2 Intel Memory Bandwidth Monitoring (MBM) Counters May be Inaccurate
Intel Xeon Scalable Processors, 2nd generation Intel Xeon Scalable processors, and derivatives
Section 3.2
3 Intel Memory Bandwidth Allocation (MBA) May Throttle All Threads
Intel Xeon Scalable processors, 2nd generation Intel Xeon Scalable processors, and derivatives
Section 3.3
4 Intel® MBA Read After MSR Write May Return Incorrect Value
Intel Xeon Scalable processors, 2nd generation Intel Xeon Scalable processors, and derivatives
Section 3.4
5 Intel CMT and MBM Counters May Be Inaccurate When SNC Is Enabled
Intel Xeon Scalable processors, 2nd generation Intel Xeon Scalable processors, and derivatives
Section 3.5
6 Intel MBM Counters May Report System Memory Bandwidth Incorrectly
Intel Xeon Scalable processors, 2nd generation Intel Xeon Scalable processors, and derivatives
Section 3.6
2.4 Intel RDT Errata Changes Relative to 2nd Generation Intel Xeon Scalable ProcessorsPrior-generation Intel Xeon Scalable processors included certain errata that are resolved in 2nd generation Intel Xeon Scalable processors. In particular, a prior sighting number 262, wherein CMT inaccuracy could be observed, has been resolved, and no known CMT errata remain on 2nd generation Intel Xeon Scalable processors.
Sighting number 328 from prior-generation Intel Xeon Scalable processors has been closed on 2nd generation Intel Xeon Scalable processors and is replaced with sighting 607. This change captures that, on prior-generation Intel Xeon Scalable processors, MBM did not track write bandwidth, whereas, on 2nd generation Intel Xeon Scalable processors, MBM tracks write bandwidth more accurately, except NT writes and remote-socket write bandwidth. This is discussed in more detail in Section 3.2.
3 Intel RDT Errata, Detection, and MitigationsThis section describes Intel RDT feature set–related errata that may be observed under certain conditions on certain processors, the implications of these errata, and guidance on how to detect and mitigate those issues in customer environments.
Various open source and publically available micro-benchmarks are utilized in order to ease duplication of these results in customer environments.
3.1 CAT/CDP May Not Restrict Cacheline Allocation under Certain Conditions
3.1.1 ProblemUnder certain microarchitectural conditions involving heavy memory traffic, cache lines may fill outside the allocated L3 capacity bitmask (CBM) associated with the current CLOS.
3.1.2 ImplicationCAT and CDP might see performance side effects and a reduction in the effectiveness of the CAT/CDP features for certain classes of applications, including cache-sensitive or bandwidth-intense workloads.
3.1.3 DetectionThe following three test cases demonstrate how this problem can be detected, and mitigation options are described.
3.1.3.1 Test Case 1: CAT’s Effectiveness with Low Memory Bandwidth (BW) Conditions
This test case represents CAT’s effectiveness with low memory bandwidth conditions.
For certain latency-sensitive applications, it may be important to achieve reduced latencies in a contended environment where low-priority workloads are running in parallel and causing resource contention, and CAT may be a useful tool under such conditions.
As part of normal cache management algorithms, as other low-priority workloads run concurrently with executed memory read requests of a latency sensitive workload, the processor might evict certain lines that have not been recently referenced from the caches. If this occurs, future read requests may result in fetching data from memory before executing the next read or write request can be completed. This can result in increased read latencies and hence can lead to undesired latency increases for low-latency applications.
4
Reference Manual | Intel® Resource Director Technology (Intel® RDT) on 2nd Generation Intel® Xeon® Scalable Processors Reference Manual
CAT can potentially reduce LLC read latencies by providing a mechanism to manage LLC capacity and protect important working sets that are likely to be referenced in the future. This can, in turn, benefit applications that are sensitive to the performance of read and write latencies in contested environments. With CAT, users can reduce contention-induced evictions caused by the presence of low-priority workloads on the processor.
Benchmark: To demonstrate this beneficial CAT behavior, the system is first configured with the LMbench* suite (bitmover.com/lmbench/). The LMbench suite is a set of portable microbenchmarks that measure different types of bandwidth and latency. This test case focuses on the lat_mem_rd test from the LMbench suite (to download LMbench, visit bitmover.com/lmbench/get_lmbench.html).
The lat_mem_rd utility (bitmover.com/lmbench/lat_mem_rd.8.html) measures read latencies for all levels of cache and main memory, as specified by commands passed to it. Memory read latencies are reported in nanoseconds for each configurable array’s memory size. The output consists of two columns: the first is the array size in MB (the floating point value), and the second is the load latency over all the points of the array. When the results are graphed, one can clearly see the relative latencies of the entire memory hierarchy, including the latency of each cache level and the main memory latency.
With this utility, commands may be run in the following format to demonstrate baseline performance under low memory bandwidth conditions, assuming the rest of the processor cores are primarily idle:
taskset -c 0 0x1 ./lat _ mem _ rd –N [x] –P [y] [depth] [stride]
In this command, replace [x] with the number of times the process is run before reporting latency. Typically, setting this to 1 is sufficient for accurate measurements. For the -P option, [y] equals the number of processes invoked to run the benchmark. The recommendation for this is always 1, which is sufficient to measure the access latency with only one processing core or thread (simplifying the results interpretation).
The [depth] specification indicates how far into the memory buffer the utility will measure. In order to ensure an accurate measurement, specify an amount that will go far enough beyond the cache so that it does not factor in latency measurements.
Finally, [stride] is the skipped amount of memory before the next access. If a stride is not large enough, modern processors have the ability to prefetch the data, thus providing low latency readings for certain memory regions that may be lower than the latency of the underlying physical cache structures required to fit the full buffer. If a stride is too large, the utility will not report correct latencies because it will be skipping past measured intervals. The utility will default to 128 bytes when a stride size is not specified.
Refer to Table 4 for a listing of the results. Binding to the first core under a Linux* environment and accessing only up to 145 MB of RAM, the command line would be as follows:
taskset 0x0 ./lat _ mem _ rd –N 1 –P 1 145M 512
This will run through each level of memory and report the latency in nanoseconds. Applying the “taskset” feature of Linux in a multi-core environment ensures that this utility uses the same processing core for each individual run. If numbers are unrealistic, increase the stride of the command to avoid CPU prefetchers influencing the data. The stride size should be from 128 and 512. Depth can be anywhere from 64 and 256, ensuring that the utility goes deep enough into memory to not use cache to affect the result.
The next section describes the test environment configuration, followed by cache sensitivity data using CAT.
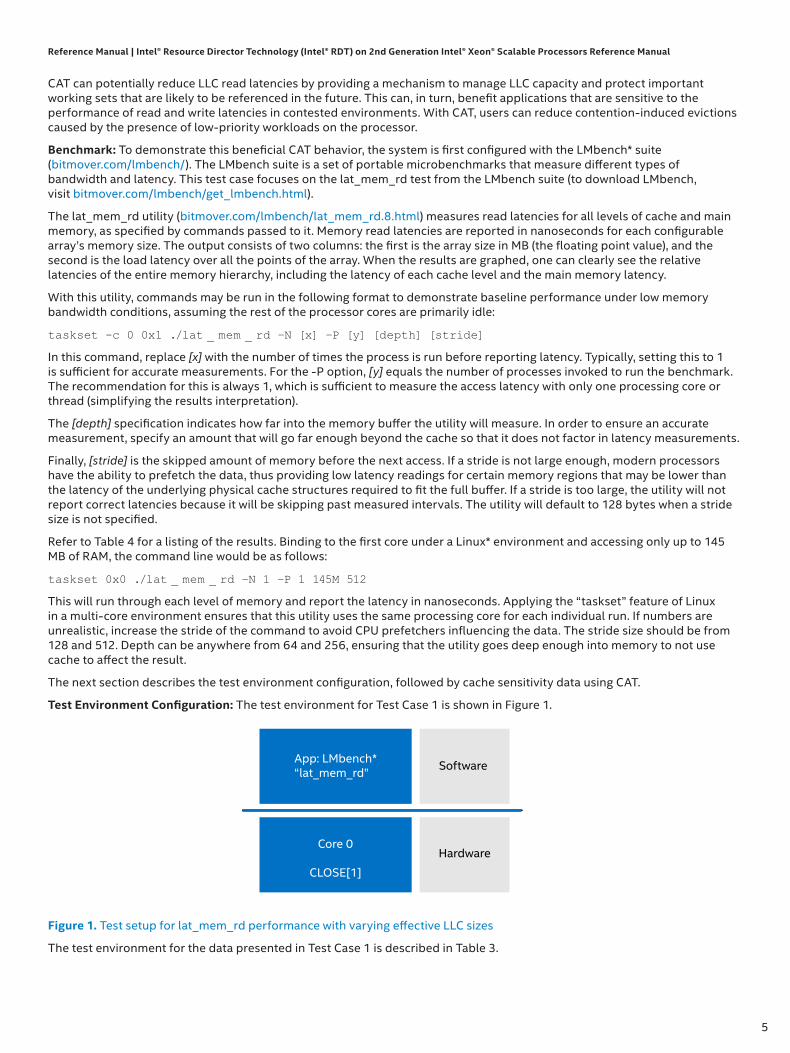
Test Environment Configuration: The test environment for Test Case 1 is shown in Figure 1.
Hardware
Software App: LMbench*“lat_mem_rd”
Core 0
CLOSE[1]
Figure 1. Test setup for lat_mem_rd performance with varying effective LLC sizes
The test environment for the data presented in Test Case 1 is described in Table 3.
5

Reference Manual | Intel® Resource Director Technology (Intel® RDT) on 2nd Generation Intel® Xeon® Scalable Processors Reference Manual
Table 3. Test Case 1: Test environment details
Server Platform Intel® Server Board S2600WF–based system
Processor Intel® Xeon® Platinum 8260L processor
Speed: 2.3 GHz
Socket Count: 2 sockets (NUMA nodes)
Number of CPUs: 24 cores/socket, 48 threads
Last Level Cache: 33 MB
Stepping: B0
Memory Micron-MIC-MON*
16 GB(8 GB x 8 DR)
DDR4 RE16-2666
2,666 MHz 19-19-19
Socket 0 Socket 1 System
Active Memory 191.0 GB 192.0 GB 383.0 GB
Expected Memory 192.0 GB 192.0 GB 384.0 GB
Active Channels Ch012345 Ch012345
DDR Frequency 2,666 MHz 2,666 MHz 2,666 MHz
Max DDR Frequency 2,933 MHz 2,933 MHz
BIOS BIOS Version: RC D01.0315
Intel® Hyper-Threading Technology (Intel® HT Technology): Disabled
Intel® RDT CAT Opportunistic: Tuned 0x003
Local Storage Intel® Solid State Drive (SSD)
Operating System Fedora 28*
Intel RDT provides real-time monitoring and allocation with the Intel RDT utility from GitHub (or 01.org).This utility works with generic Linux operating systems to provide per-thread monitoring and control by associating RMIDs and CLOSs with each hardware thread.
Instructions: Perform the following steps to achieve results similar to those shown in Table 4, which illustrates that CAT can be used to modify the effective LLC size, which impacts core read latencies:
1. Restrict core 0’s LLC access to a single way.
2. Run the LMbench read latency benchmark with the following command pinned to core N, and then save the output: taskset 0x1 ./lat _ mem _ rd –N 1 –P 1 145M 512
3. Increase core 0’s LLC by one CBM bit. For example, use the following command: pqos –e “llc:1=0x1”; pqos –a “llc:1=0” For subsequent runs, adjust the numbering in the command; for example: pqos –e “llc:1=0x3”
4. Rerun steps 2 and 3 until LMbench has access to the entire LLC.
Table 4 shows the measurement results.
6

Reference Manual | Intel® Resource Director Technology (Intel® RDT) on 2nd Generation Intel® Xeon® Scalable Processors Reference Manual
Table 4. Memory latencies with regard to varying LLC sizes
As shown in Table 4, the L3 CAT feature provides significant control over the L3 cache under these low memory bandwidth load conditions, on 2nd generation Intel Xeon processors with the errata present.
Figure 2 visualizes the values shown in Table 4.
Figure 2. Graphed memory latency for Test Case 1
7

Reference Manual | Intel® Resource Director Technology (Intel® RDT) on 2nd Generation Intel® Xeon® Scalable Processors Reference Manual
Table 4 provides a heat chart of the read latency data, in which the different levels of memory hierarchy and the effect of LLC (L3) CAT controls become apparent. In the heat chart shown in Table 4:
• After 32 KB, full read latency increases (shown in green) as the latency becomes dominated by the L2 cache size. L3 CAT has no effect on performance observed in the L1 and L2 caches.
• After 1 MB, the array spills over in the LLC, and the effects of CAT in controlling available LLC capacity become apparent. For small LLC sizes allocated, read latency increases (shown in yellow/orange).
• The L3 CAT feature can have significant effects over the L3 cache capacity as shown in Figure 2 when the span is greater than L2 size, that is,1 MB. For example, with a minimum CAT mask applied (0x1) at 1.5 MB (columns in Table 4), the L3 cache read latencies increase to main memory latencies as the array is larger than the allocated LLC capacity. As cache is increased from the minimum number of capacity bitmask (CBM) bits (0x1) to the maximum number of bits on this processor (0x7ff) for each experiment, as shown in Table 4, L3 cache read latencies decrease, demonstrating the capacity redistribution effects of CAT.
3.1.3.2 Test Case 2: Quantifying CAT Effectiveness Using CMT
The performance of the software components and applications on the platform can be affected by the size of the LLC. An algorithm can be applied in order to determine the conditions when a workload (such as a performance-sensitive VNF appliance, or a latency-sensitive application) will require the maximum cache size under some conditions, and whether a more moderate apportionment for more typical performance scenarios is acceptable, enabling more cache for other workloads. It may be valuable to study worst-case conditions in order to analyze the boundary conditions, such as modulating load or system conditions to push the software component to require as much LLC as possible while still achieving the required level of overall performance. One method to accomplish this is to stress the platform with more strenuous competing workloads than would be expected in a production environment. While the platform is under the maximum sustainable stress, without any cache allocation controls, CMT can be used to measure and monitor the cache occupancy of these components and how CAT redistributes cache capacity.
Benchmark: On a system, an administrator can verify that CAT and CMT work together by validating the cache occupancy reported by CMT while changing cache allocations with CAT. Under fully functional conditions, the cache occupancy should not report more occupancy than what CAT has allocated to the core (and usually not much less given workloads that stream through the cache, competing for occupancy).
This experiment uses two memory-intensive publically available benchmarks called memtester* (http://pyropus.ca/software/memtester/) and STREAM* (cs.virginia.edu/stream/).
• Memtester: Use the memtester application to access 100 MB of memory using the following command: # ./memtester 100M > /dev/tmp
• STREAM: Compile the STREAM benchmark with a big enough array size, such as -DSTREAM _ ARRAY _ SIZE=13000000000, using the following command: cc -O -DSTREAM _ ARRAY _ SIZE=100000000 -DNTIMES=20 stream.c –o stream;
• Run the STREAM benchmark using the following command: # ./stream
Test Environment Configuration: The test environment for Test Case 2 is shown in Figure 3.
Hardware
Software App: memtester* App: STREAM*
Core 0
CLOSE[1]
Core 0
CLOSE[1]
Core 0
CLOSE[1]Core 10
CLOSE[2]
Figure 3. Test setup for CAT and CMT accuracy study
8

Reference Manual | Intel® Resource Director Technology (Intel® RDT) on 2nd Generation Intel® Xeon® Scalable Processors Reference Manual
The test environment for the data presented in test case 2 is described in Table 5.
Table 5. Test Case 2 test environment details
Server Platform Intel® Server Board S2600WF–based system
Processor Intel® Xeon® Platinum 8260L processor
Speed: 2.3 GHz
Socket Count: 2 sockets (NUMA nodes)
Number of CPUs: 24 cores/socket, 48 threads
Last Level Cache: 33 MB
Stepping: B0
Memory Micron-MIC-MON*
16 GB (8 GB x 8 DR)
DDR4 RE16-2666
2,666 MHz 19-19-19
Socket 0 Socket 1 System
Active Memory 191.0 GB 192.0 GB 383.0 GB
Expected Memory 192.0 GB 192.0 GB 384.0 GB
Active Channels Ch012345 Ch012345
DDR Frequency 2,666 MHz 2,666 MHz 2,666 MHz
Max DDR Frequency 2,933 MHz 2,933 MHz
BIOS BIOS Version: RC D01.0315
Intel® Hyper-Threading Technology (Intel® HT Technology): Disabled
Intel® RDT CAT Opportunistic: Tuned 0x003
Local Storage Intel® SSD
Operating System Fedora 28*
Intel RDT provides real-time monitoring and allocation with the Intel RDT utility from GitHub. This utility works with generic Linux operating systems to provide per-thread monitoring and control by associating RMIDs and CLOSs with each hardware thread.
Instructions: Perform the following steps to achieve results similar to those shown in Figure 4, which illustrates CAT effectiveness using CMT, executed from a typical Bash* console under Linux*:
1. Set CLOS[1] with access to a single LLC CBM bit (most significant bit [MSB]) using the following command: # pqos –e “llc:1=0x400”; pqos –a “llc:1=0”;
2. Set CLOS[2] to have access to the entire LLC with the following command: # pqos –e “llc:2=0x3ff”; pqos –a “llc:2=1,2,3,4,5,6,7,8,9,10”;
3. Run one instance of memtester in CLOS[1] with the following command: # taskset –c 0 ./memtester 100M > /dev/tmp &
4. Run 10 instances of STREAM in CLOS[2] with the following command: # for ((i=1;i<10;i++)); do taskset –c $i ./stream &; done
5. Use the pqos command line to record LLC occupancy, and then save the results to a CSV file with the following command: # pqos -m all:0-10 -u csv -o pqos _ mon.csv &
6. Run for a period of time, and then increment CLOS[1] (memtester) by one CBM bit and decrement CLOS[2] (STREAM) by one CBM bit.
7. Repeat step 6 until STREAM has access to only one CBM bit (the least significant bit [LSB]) and memtester has access to all other cache capacity.
9

Reference Manual | Intel® Resource Director Technology (Intel® RDT) on 2nd Generation Intel® Xeon® Scalable Processors Reference Manual
Measurement Results: Figure 4 shows a graph of LLC occupancy using CMT for two applications: memtester and STREAM, executing one thread of each. As shown in Figure 4, cache occupancy reported by CMT never reports more LLC occupancy than what is allocated to the core using CAT (subject to sampling noise, a stair-step pattern is clearly visible). This experiment shows that, as cache capacity is reduced for the noisy neighbor (STREAM) using CAT, its cache occupancy and footprint are reduced, whereas cache ways are increased for memtester to fill in; this trend can be demonstrated using the monitoring visibility that CMT provides.
Figure 4. CMT and CAT cross-correlation: clean steps should be evident for one memtester* instance and 10 STREAM* instances as their CAT masks are adjusted, reallocating cache capacity across the two running applications.
3.1.3.3 Test Case 3: Example of Reduced CAT Effectiveness under an Increasing Memory BW Load (Errata Demonstration)
Test Case 1, using CAT, shows the sensitivity of reported read latencies from LMbench and demonstrates that additional cache can help reduce latencies under certain test configurations. Generalizing this result, CAT may benefit applications that are sensitive to the performance of read and write latencies and cache occupancies. But without CAT to manage contention across different threads/classes of applications, the same reduced latencies for LMbench can increase again as other workloads start stressing shared-level resources like cache and memory bandwidth for larger arrays.
When this increased contention from other threads occurs, the processor might evict a portion of the required buffer size from cache. If this occurs, certain following read requests might be required to fetch the data from memory before the next read or write request can be serviced, which can result in increased read latencies (often visible in the performance results).
Under normal circumstances, CAT works across all system memory bandwidth levels. However, due to the errata described in chapter 1, on certain processors, under moderate to heavy memory bandwidth conditions, CAT can become less effective as the number of memory-intensive threads increases on the system. This behavior can be observed and quantified by following the steps in this section.
Benchmark: Refer to Test Case 1 for LMbench and Test Case 2 for STREAM benchmark details.
Test Environment Configuration: The test environment for Test Case 3 is shown in Figure 5.
Hardware
Software App: LMbench*
“lat_mem_rd”App: STREAM*
Core 0
CLOSE[1]
Core 0
CLOSE[1]
Core 0
CLOSE[1]Core 10
CLOSE[1]
Figure 5. Test setup for CAT and CMT accuracy study
10

Reference Manual | Intel® Resource Director Technology (Intel® RDT) on 2nd Generation Intel® Xeon® Scalable Processors Reference Manual
The test environment for the data presented in Test Case 3 is described in Table 6.
Table 6. Test Case 3 test environment details
Server Platform Intel® Server Board S2600WF–based system
Processor Intel® Xeon® Platinum 8260L processor
Speed: 2.3 GHz
Socket Count: 2 sockets (NUMA nodes)
Number of CPUs: 24 cores/socket, 48 threads
Last Level Cache: 33 MB
Stepping: B0
Memory Micron-MIC-MON*
16 GB (8 GB x 8 DR)
DDR4 RE16-2666
2,666 MHz 19-19-19
Socket 0 Socket 1 System
Active Memory 191.0 GB 192.0 GB 383.0 GB
Expected Memory 192.0 GB 192.0 GB 384.0 GB
Active Channels Ch012345 Ch012345
DDR Frequency 2,666 MHz 2,666 MHz 2,666 MHz
Max DDR Frequency 2,933 MHz 2,933 MHz
BIOS BIOS Version: RC D01.0315
Intel® Hyper-Threading Technology (Intel® HT Technology): Disabled
Intel® RDT CAT Opportunistic: Tuned 0x003
Local Storage Intel® SSD
Operating System Fedora 28*
Intel RDT provides real-time monitoring and allocation with the Intel RDT utility from GitHub. This utility works with generic Linux operating systems to provide per-thread monitoring and control by associating RMIDs and CLOSs with each hardware thread.
Instructions: Perform the following steps to achieve results similar to those shown in Table 7. These results illustrate that CAT might observe a reduction in its expected effectiveness due to the product errata previously described, for an application like LMbench, when run alongside a heavy memory-traffic workload (such as STREAM).
1. Use the following commands to run LMbench on core 0, associated with CLOS[0], and run multiple instances of STREAM on cores 1–N (where N is the maximum number of cores available on the socket), in CLOS[1], with access to all LLC capacity: # pqos –a “llc:0=0”; # pqos –a “llc:1=1,2,3,4,5,6,7,8,9,10..N”;
2. Configure CLOS[0] to have access to a single LLC CBM bit (MSB) using the following command: # pqos –e “llc:0=0x400”;
3. Configure CLOS[1] to have access to all other LLC capacity using the following command: # pqos –e “llc:1=0x3ff”;
4. Run LMbench on core 0, associated to CLOS[0], and then write the output to a results file using the following command: # taskset 0x1 ./lat _ mem _ rd –N 1 –P 1 145M 512
5. Run multiple instances of STREAM on cores 1–N, associated to CLOS[1], using the following command: # for ((i=1;i<”N”;i++)); do taskset –c $i ./stream &; done
11

Reference Manual | Intel® Resource Director Technology (Intel® RDT) on 2nd Generation Intel® Xeon® Scalable Processors Reference Manual
6. Allow the above applications to run for some time, such as 30 seconds.
7. Increment CLOS[0] CBM (lat_mem_rd) and decrement CLOS[1] CBM (STREAM).
8. Rerun steps 5–8 until CLOS[1] has access to only one single LLC capacity bitmask (CBM) bit.
Measurement Results: Table 7 shows how L3 latencies are affected due to the CAT errata when the memory bandwidth loading level on the platform increases (that is, with an increasing number of STREAM aggressor threads). The number of aggressor stream instances increases from top to bottom, and the number of L3 CBM bits dedicated to LMbench increases from left to right (including a “NO CAT” case at the top, where the LLC is fully shared).
Table 7. L3 latencies affected by reduced CAT effectiveness
Lmbench* CAT way(s)/#STREAM
* threads
Default CAT
1 2 3 4 5 6 7 8 9 10
0 60.519 69.681 70.353 68.86 67.714 66.348 65.636 64.571 63.365 62.287 61.2181 68.874 79.518 78.009 77.121 75.168 73.403 73.852 72.192 69.302 67.452 67.0442 73.725 85.118 83.864 82.498 81.084 79.518 79.823 77.902 74.604 72.882 71.4273 79.471 90.507 89.608 87.297 85.921 85.072 85.37 83.332 80.386 78.546 76.7934 85.941 96.393 94.918 94.032 93.487 91.152 91.508 90.259 85.812 83.873 81.8835 94.523 107.31 103.628 103.439 99.085 97.781 97.867 96.413 92.821 89.831 87.4816 98.863 114.468 112.964 113.287 108.162 108.736 106.383 106.678 103.016 100.788 95.9767 113.399 128.605 123.544 127.7 119.276 114.928 122.801 120.234 110.745 109.553 107.4498 124.65 139.401 142.057 130.898 135.556 137.602 133.45 134.326 112.991 122.505 120.9899 142.415 159.896 154.828 155.797 152.628 148.416 149.75 147.033 136.726 134.721 123.959
10 157.012 179.094 172.174 165.903 147.732 157.891 156.608 158.469 149.063 151.852 147.81315 222.607 250.156 236.354 231.728 256.718 232.66 245.359 237.201 229.466 223.288 217.02320 310.208 308.541 304.407 301.875 305.574 295.336 296.657 275.711 282.092 277.883 271.80221 324.783 326.276 330.164 325.587 323.303 286.323 314.479 296.514 285.458 271.642 273.01122 317.534 328.966 330.256 315.862 314.882 310.643 306.323 308.036 295.187 282.174 277.60523 338.183 342.801 353.568 341.638 323.186 312.088 313.177 303.852 290.286 284.59 285.412
Figure 6 represents the values shown in Table 7.
12

Reference Manual | Intel® Resource Director Technology (Intel® RDT) on 2nd Generation Intel® Xeon® Scalable Processors Reference Manual
Figure 6. CAT performance vs. memory bandwidth load level
As demonstrated in the results above, as the memory bandwidth increases, CAT still provides a benefit, but this benefit is more variable and less effective overall at protecting LMbench latencies than might be expected. This is due to the nature of the CAT errata, which is exacerbated under heavy cache replacement conditions (as in the case of streaming workloads).
Note that in some cases certain CAT masks exhibit more control over capacity than others (the left side versus the right side of example 3 in Figure 7), and tuning the masks used on an environment-specific basis is one option to mitigate the effects of the CAT errata (see the Workaround section, below). As demonstrated in these various examples, CMT is a valuable tool to study whether CAT provides the expected capacity control.
Note that, as described in the Intel Software Developer’s Manual (SDM), while single-bit CAT masks are supported by the hardware, they are not recommended for performance reasons.
13

Reference Manual | Intel® Resource Director Technology (Intel® RDT) on 2nd Generation Intel® Xeon® Scalable Processors Reference Manual
3.1.3.4 Test Case 4: A Separate Example across Load Levels
When visualized in the form of the “stair step” plot in Figure 4, as load increases, the provided LLC capacity managed with CAT will begin to differ from the requested capacity (as measured by MBM). An example conceptual set of “stair step” plots across system load to help describe the inaccuracy of allocation versus load level is included in Figure 7.
Note that these results should be considered conceptual, as they are from an older system with previous-generation Intel Xeon Scalable processors and only one example; actual test results may vary significantly depending on the workloads used and system configuration. In this case, only two memory channels were populated (practical max ~30.7 GB/s memory bandwidth) in order to exacerbate system-load conditions and increase the impact of the errata.
Figure 7. As system-load levels increase, encountering the CAT errata is more likely (masks used are the same across the X-axis, as in Figure 4)
Note that, at lighter load levels (11 active cores), CAT provides reasonable isolation of the workloads, with some test noise apparent (the spikes downward in blue). At higher load levels, the CAT capacity provided versus requested begins to differ more significantly (the difference between the solid lines indicating expected capacity and the experimental data of capacity measured through MBM). In the heaviest load cases, with saturated memory bandwidth (example 3), cache capacity does not reflect the requests made through CAT, demonstrating the errata.
Note that, in some cases, certain CAT masks exhibit more control over capacity than others (as seen in the left side of example 3 compared to the right side), and tuning the masks used on an environment-specific basis is one option to mitigate the effects of the CAT errata. As demonstrated in these various examples, CMT is a valuable tool to study whether CAT provides the expected capacity control.
3.1.4 WorkaroundNone identified.
Mitigations: CMT might be used as described to determine whether a significant misallocation of cache capacity has occurred, and if so, other technologies such as MBA or reducing OS scheduler quanta for aggressor threads may be used to reduce cache contention effects indirectly.
14

Reference Manual | Intel® Resource Director Technology (Intel® RDT) on 2nd Generation Intel® Xeon® Scalable Processors Reference Manual
Certain CAT masks may provide better isolation under certain circumstances, and this can be tuned on an environment-specific basis if desired. As an example, allocating higher bits (most significant bits) for higher-priority workloads and lower bits (least significant bits) in the CAT masks may provide improved CAT performance, though this is model-specific behavior. As an example, allocating a CAT mask of 0x7F0 for the high priority (HP) workload, and 0x00F for the low-priority (LP) workload may provide better CAT performance than the inverse (0x780 for the HP workload and 0x07F for the LP workload) given an equal amount of capacity. This MSB/LSB sensitivity is a model-specific behavior that may change across processor generations; however, for some workloads and use cases, this may be a tuning knob that could be explored.
A CAT “RDT CAT Opportunistic” BIOS option may be available in certain BIOS releases, which can be experimentally studied to see if it benefits certain workloads of customer interest. However, results are not guaranteed, and performance effects to both CAT and general cases should be studied to ensure no workload-specific performance side effects occur.
3.2 MBM Counters Might Be Inaccurate
3.2.1 ProblemThe MBM counters (IA32_QM_EVTSEL [MSR 0xC8D] and IA32_QM_CTR [MSR 0xC8E]) might exhibit inaccuracy when Wow, snon-temporal (NT) writes are used, or in cases where memory on a remote processor is accessed.
3.2.2 ImplicationFor workloads utilizing NT operations or access to memory on remote processors, software that relies on MBM counters might not operate correctly.
MBM is improved in 2nd generation Intel Xeon Scalable processors relative to prior-generation Intel Xeon Scalable processors in that general write bandwidth is more accurately tracked, subject to the conditions of this erratum.
This erratum does not affect UNC_M_CAS_COUNT.RD and UNC_M_CAS_COUNT.WR (Event 4h, umasks 3h, and Ch) which are performance monitoring counters located in the memory controller, and which track the summed behavior of all threads on the processor.
3.2.3 Detection3.2.3.1 Test Case 1: MBM Measurements with NT Write Traffic
The MBM feature provides increased visibility into per-thread memory bandwidth utilization, enabling enhanced application profiling, telemetry, and techniques such as bandwidth-aware scheduling. The MBM feature reports memory bandwidth for different operations like loads and stores as a sum, between the LLC and DRAM interface.
The MBM counters (IA32_QM_EVTSEL [MSR 0xC8D] and IA32_QM_CTR [MSR 0xC8E]) might exhibit inaccuracy when NT writes are used, or in cases where memory on a remote processor is accessed.
The following sample code provides an example of NT stores using the MOVNTDQA instruction:
non _ temporal _ stores (void *p, const uint64 _ t v){asm volatile(“movq %0, %%xmm1\n\t”“movntdq %%xmm1, (%1)\n\t”“movntdq %%xmm1, 16(%1)\n\t”“movntdq %%xmm1, 32(%1)\n\t”“movntdq %%xmm1, 48(%1)\n\t”:: “r”(v), “r”(p): “%xmm1”, “memory” );
}
Benchmark: MBM statistics may be verified with Intel® Performance Counter Monitor (Intel® PCM) Integrated Memory Controller (IMC) performance counters for various operations. MBM statistics should report results similar to Intel PCM for operations like read, write, nt-write-sse, and so on. This experiment uses the “membw” benchmark https://github.com/intel/intel-cmt-cat/tree/master/tools/membw to generate NT store operations along with other memory operations like read, write, and so on.
15

Reference Manual | Intel® Resource Director Technology (Intel® RDT) on 2nd Generation Intel® Xeon® Scalable Processors Reference Manual
1. Membw: Use membw to generate NT store operations, as in the following example:
# Usage: ./membw -c <cpu> -b <BW [MB/s]> <operation type>Description: -c, --cpu cpu to generate B/W -b, --bandwidth memory B/W specified in MBpsOperation types: --prefetch-t0 prefetcht0 --prefetch-t1 prefetcht1 --prefetch-t2 prefetcht2 --prefetch-nta prefetchtnta --prefetch-w prefetchw --read x86 loads --read-sse SSE loads --nt-read-sse SSE NT loads --read-mod-write x86 load XOR write --write x86 stores --write-avx512 AVX512 stores --write-clwb x86 stores + clwb --write-flush x86 stores & clflush (naturally generates loads & stores) --write-sse SSE stores --write-sse-flush SSE stores & clflush (naturally generates loads & stores) --nt-write x86 NT stores --nt-write-avx512 AVX512 NT stores --nt-write-clwb x86 NT stores + clwb --nt-write-sse SSE NT stores
2. Intel PCM: IMC performance monitoring counters can help derive a read/write ratio that may be helpful under some conditions; for more information, see https://software.intel.com/en-us/articles/intel-performance-counter-monitor
3. Intel RDT utility: The Intel RDT utility from GitHub.
Test Environment Configuration: The test environment for the data presented in this test case is described in Table 8.
Table 8. Test environment for MBM counters
Server Platform Intel® Server Board S2600WF–based system
Processor Intel® Xeon® Platinum 8260L processor
Speed: 2.3 GHz
Socket Count: 2 sockets (NUMA nodes)
Number of CPUs: 24 cores/socket, 48 threads
Last Level Cache: 33 MB
Stepping: B0
Memory Micron-MIC-MON*
16 GB (8 GB x 8 DR)
DDR4 RE16-2666
2,666 MHz 19-19-19
Socket 0 Socket 1 System
Active Memory 191.0 GB 192.0 GB 383.0 GB
Expected Memory 192.0 GB 192.0 GB 384.0 GB
Active Channels Ch012345 Ch012345
DDR Frequency 2,666 MHz 2,666 MHz 2,666 MHz
Max DDR Frequency 2,933 MHz 2,933 MHz
BIOS BIOS Version: RC D01.0315
Intel® Hyper-Threading Technology (Intel® HT Technology): Disabled
Intel® RDT CAT Opportunistic: Tuned 0x003
Local Storage Intel® SSD
Operating System Fedora 28* 16

Reference Manual | Intel® Resource Director Technology (Intel® RDT) on 2nd Generation Intel® Xeon® Scalable Processors Reference Manual
Intel RDT provides real-time monitoring and allocation with the Intel RDT utility from GitHub. This utility works with generic Linux operating systems to provide per-thread monitoring and control by associating RMIDs and CLOSs with each hardware thread. In cases where the OS kernel is not enabled, the Intel RDT utility uses MSR interfaces directly; but in cases where the OS is enabled, the Intel RDT utility switches to those interfaces (Resctl and Perf from Linux, for instance).
Instructions: Perform the following steps to achieve results similar to those shown in Table 9, which illustrates that the MBM counters (IA32_QM_EVTSEL [MSR 0xC8D] and IA32_QM_CTR [MSR 0xC8E]) might exhibit inaccuracy when NT writes are used, or in cases where memory on a remote processor is accessed:
1. Run membw pinned to a core generating specified memory bandwidth with the following command: # ./membw 1 20000 nt-write
2. Use pqos to monitor local and remote memory bandwidth events, and then save the results to a CSV file using the following command: # pqos -m all:1 -u csv -o pqos _ mon.csv &
3. Use Intel PCM to monitor local and remote socket memory bandwidth, and then save the results to a CSV file using the following command: # pcm-memory.x –csv
Similarly, perform the following steps to achieve results similar to those shown in Table 9, which illustrates that the MBM counters (IA32_QM_EVTSEL [MSR 0xC8D] and IA32_QM_CTR [MSR 0xC8E]) might exhibit inaccuracy when memory on a remote processor is accessed:
4. Run membw write or nt-write operation pinned to a core generating specified memory bandwidth with the following command: Use numactl(https://linux.die.net/man/8/numactl) utility to run application with a specific NUMA scheduling or memory placement policy. Here, use numactl “membind” policy setting is used to allocate memory for remote node. # numactl --membind=1 ./membw 1 20000 nt-write # numactl --membind=1 ./membw 1 20000 write
5. Use pqos to monitor local and remote memory bandwidth events, and then save the results to a CSV file using the following command: # pqos -m all:1 -u csv -o pqos _ mon.csv &
6. Use Intel PCM to monitor local and remote socket memory bandwidth, and then save the results to a CSV file using the following command: # pcm-memory.x –csv
Measurement Results: Table 9 shows memory bandwidth reported by MBM counters and Intel PCM results using memory counters (UNC_M_CAS_COUNT.RD and UNC_M_CAS_COUNT.WR) to derive a memory read/write ratio.
Table 9. Memory bandwidth and Intel® Performance Counter Monitor (Intel® PCM) results
Local/ Remote Memory request
Memory Operation Intel® Resource Director Technology (Intel® RDT) MBM (MB/s)
Intel® Performance Counter Monitor (Intel® PCM) (MB/s)
Local Memory Request
nt-write 13,987.7 7,150.8
Remote Memory Request
nt-write 41,249.6 62,949.05
Remote Memory write 12,665.6 19,401.15
3.2.3.2 Test Case 2: MBM Readings across Hardware Generations
To demonstrate the change in hardware behavior across generations, Figure 8 provides a cross-generational view of the accuracy of the MBM counters. Note that a custom memory bandwidth-generation tool is used (membw as previously described) and as results vary across system configurations, software/firmware versions, and other factors, these results should be compared only across the MBM and Intel PCM columns to show relative accuracy. The results should not be interpreted in absolute terms. The Intel PCM utility is used to gather performance counter data from the memory controllers for comparison.
On the left side of Figure 8 is data from the previous-generation Intel Xeon Scalable processor, which included an erratum in which write bandwidth was not tracked.
On the right side of Figure 8 is updated data from a pre-release 2nd generation Intel Xeon Scalable processor, demonstrating that typical write-back memory read and write traffic is accurately tracked, however NT writes are double-counted. This effect stems from microarchitectural event tracking and, in some cases, directory update traffic that MBM captures. Architecturally, this is allowed as part of the MBM architecture, in which bandwidth from background management of coherency operations may or may not be tracked; however, given prior-generation feature behavior, this erratum is issued as an advisory to software.
17

Reference Manual | Intel® Resource Director Technology (Intel® RDT) on 2nd Generation Intel® Xeon® Scalable Processors Reference Manual
Figure 8. MBM readings across processor generations
3.2.4 Workaround
None identified. This erratum can be partially mitigated by using UNC_M_CAS_COUNT.RD and UNC_M_CAS_COUNT.WR to derive a memory read/write ratio that can be used to adjust the MBM counter contents, or per-core performance monitoring counters that may be able to detect NT write traffic. Generally speaking, reads and other types of bandwidth not subject to the erratum should be tracked accurately.
3.3 Intel® MBA May Incorrectly Throttle All Threads
3.3.1 ProblemWhen one logical processor is disabled, the MBA feature might select an incorrect throttling value to apply to the core. A disabled logical processor can behave as though the CLOS field in its associated IA32_PQR_ASSOC MSR (0xC8F) is set to zero (appearing to be set to CLOS[0]). When this occurs, the MBA throttling value associated with CLOS[0] can be incorrectly applied to both threads on the core.
3.3.2 ImplicationWhen Intel® Hyper-Threading Technology (Intel® HT Technology) is disabled, or one logical thread on the core is disabled, the disabled thread is interpreted to have CLOS=0 set by the hardware in its IA32_PQR_ASSOC MSR. This affects the calculation for the actual throttling value applied to the core. When this erratum occurs, the MBA throttling value associated with a given core may be incorrect.
3.3.3 DetectionThe MBA feature provides indirect and approximate control over the memory bandwidth available per core. The MBA feature uses a programmable request controller between cores and the high-speed interconnect, enabling indirect control over memory bandwidth for cores over-utilizing bandwidth relative to their priority. But when the MBA feature is used with Intel HT Technology disabled or threads offlined (in the BIOS, OS or VMM), an incorrectly high MBA delay value might be applied if the delay value for CLOS[0] is higher than the delay value for the adjacent thread’s CLOS. Users may detect this problem by using the following mechanism.
Benchmark: This experiment uses a memory-intensive benchmark, STREAM (cs.virginia.edu/stream/), and the Intel RDT utility for monitoring and allocating.
18

Reference Manual | Intel® Resource Director Technology (Intel® RDT) on 2nd Generation Intel® Xeon® Scalable Processors Reference Manual
• STREAM: Use the following command to compile the STREAM benchmark with a big enough array size, such as -DSTREAM _ ARRAY _ SIZE=13000000000: gcc -O -DSTREAM _ ARRAY _ SIZE=100000000 -DNTIMES=20 stream.c –o stream;
• Run the benchmark using the following command: # ./stream
• Intel RDT utility: the Intel RDT utility from GitHub
Test Environment Configuration: The test environment for the data presented in this test case is described in Table 10.
Table 10. Test environment details for incorrect MBA throttle value applied to the core when Intel® Hyper-Threading Technology is disabled
Server Platform Intel® Server Board S2600WF–based system
Processor Intel® Xeon® Platinum 8260L processor, Stepping: B0
Speed: 2.3 GHz
Socket Count: 2 sockets (NUMA nodes)
Number of CPUs: 24 cores/socket, 48 threads
Last Level Cache: 33 MB
Memory Micron-MIC-MON*
16 GB (8 GB x 8 DR)
DDR4 RE16-2666
2,666 MHz 19-19-19
Socket 0 Socket 1 System
Active Memory 191.0 GB 192.0 GB 383.0 GB
Expected Memory 192.0 GB 192.0 GB 384.0 GB
Active Channels Ch012345 Ch012345
DDR Frequency 2,666 MHz 2,666 MHz 2,666 MHz
Max DDR Frequency 2,933 MHz 2,933 MHz
BIOS BIOS Version: RC D01.0315
Intel® Hyper-Threading Technology (Intel® HT Technology): Disabled
Intel® RDT CAT Opportunistic: Tuned 0x003
Local Storage Intel® SSD
Operating System Fedora 28*
Instructions: Perform the following steps to demonstrate MBA behavior:
1. Disable Intel HT Technology through the BIOS.
2. Make sure all the cores are set to default RMID/CLOS values.
3. Run a STREAM benchmark instance on core 0 and core 1 with the following commands: # taskset –c 0 ./stream # taskset –c 1 ./stream
4. Monitor per-core memory bandwidth using the MBM feature of Intel RDT using the following command: # pqos -m all:0,1 -u csv -o pqos _ mon.csv &
5. Associate core 0 to CLOS[0] and core 1 to CLOS[1] using the following command: # pqos –a “llc:0=0; llc:1=1”;
6. Set CLOS[0] and CLOS[1] to 50 percent throttling using the following command; a complete view of the setup is shown in Figure 8.
19

Reference Manual | Intel® Resource Director Technology (Intel® RDT) on 2nd Generation Intel® Xeon® Scalable Processors Reference Manual
Note: The MBA delay values that may be programmed range from zero (implying zero delay, and full bandwidth available) to maximum (MBA_MAX), specified in CPUID. The throttling values are approximate and do not sum to 100percent across CLOS; rather they should be viewed as a maximum bandwidth “cap” per CLOS. Use the “# pqos –s –v” command for MBA detection. Output of this command will contain a string mentioning details about MBA; that is, “INFO: MBA details: #COS=8, linear, max=90, step=10” which shows the maximum MBA throttling value available, such as 90 percent. Additionally, with linear interface one hundred minus the maximum throttling value indicates the granularity, 10 percent in this example. Hence, lower available bandwidth percentage available is equal to a higher delay value. # pqos –e “mba:0=50; llc:1=50”;
Figure 9. Initial setup for the experiment to detect MBA behavior
7. Note the memory bandwidth for core 0 and core 1.
8. Modify CLOS[0] from 50 percent to 10 percent using the following command, and then note the bandwidth on both the cores; Figure 10 represents step 8: # pqos –e “mba:0=10”;
Figure 10. Modify the allocated bandwidth for CLOS[0] from 50 percent to 10 percent
9. Observe the graph presented in Figure 11, which shows that core 1’s bandwidth is impacted because the MBA delay value of CLOS[0] is higher than that of CLOS[1]. Note that core 1’s MBA delay value is unchanged, but because of the CLOS[0] throttling value being higher, core 1’s bandwidth is reduced from 50 percent to 10 percent.
Figure 11. A higher CLOS[0] MBA delay value can impact the bandwidth of other cores
20

Reference Manual | Intel® Resource Director Technology (Intel® RDT) on 2nd Generation Intel® Xeon® Scalable Processors Reference Manual
Benchmark Results: See Figure 11 for results.
3.3.4 WorkaroundTo work around this erratum, CLOS[0] should not be used if any logical cores are disabled. Alternatively, software or administrators may leave all threads enabled.
3.4 Intel MBA Read after MSR Write May Return Incorrect Values
3.4.1 ProblemThe MBA feature defines a series of MSRs (0xD50–0xD57) to specify MBA delay values per CLOS in the IA32_L2_QoS_Ext_BW_Thrtl_n MSR range. Certain values, when written and then read back, might return an incorrect value in the MSR. Specifically, values greater than 10 (decimal) and less than 40 (decimal) written to the MBA delay value (Bits [15:0]) might be read back as 10 (decimal). Note that values between multiples of ten are rounded down, but the read-after-write values changing is the source of the errata.
3.4.2 ImplicationThe values written to the registers will be applied; however, software should be aware that an incorrect value might be returned.
3.4.3 DetectionIn order to detect when MBA reads and writes are returning incorrect values in the MSR, complete the following steps.
Benchmark: One can verify that MBA delay values greater than 10 (decimal) and less than 40 (decimal) are written to the MSR successfully, even though, when read back, they return incorrect values in the MSR. To do this, use the following tool:
• msr-tools: kernel.org/pub/linux/utils/cpu/msr-tools/
Test Environment Configuration: The test environment for the data presented in this test case is described in Table 11.
Table 11. Test environment details for detecting the return of incorrect values in the MSR
Server Platform Intel® Server Board S2600WF–based system
Processor Intel® Xeon® Platinum 8260L processor
Speed: 2.3 GHz
Socket Count: 2 sockets (NUMA nodes)
Number of CPUs: 24 cores/socket, 48 threads
Last Level Cache: 33 MB
Stepping: B0
Memory Micron-MIC-MON*
16 GB (8 GB x 8 DR)
DDR4 RE16-2666
2,666 MHz 19-19-19
Socket 0 Socket 1 System
Active Memory 191.0 GB 192.0 GB 383.0 GB
Expected Memory 192.0 GB 192.0 GB 384.0 GB
Active Channels Ch012345 Ch012345
DDR Frequency 2,666 MHz 2,666 MHz 2,666 MHz
Max DDR Frequency 2,933 MHz 2,933 MHz
BIOS BIOS Version: RC D01.0315
Intel® Hyper-Threading Technology (Intel® HT Technology): Disabled
Intel® RDT CAT Opportunistic: Tuned 0x003
Local Storage Intel® SSD
Operating System Fedora 28*
21

Reference Manual | Intel® Resource Director Technology (Intel® RDT) on 2nd Generation Intel® Xeon® Scalable Processors Reference Manual
Intel RDT provides real-time monitoring and allocation with the Intel RDT utility from GitHub. This utility works with generic Linux operating systems to provide per-thread monitoring and control by associating RMIDs and CLOS IDs with each hardware thread.
Instructions: The Intel RDT MBA feature defines a series of MSRs (0xD50–0xD57 in cases with eight supported MBA CLOS) to specify MBA delay values per CLOS in the IA32_L2_QoS_Ext_BW_Thrtl_n MSR range. Perform the following steps using those MSRs to verify that the MBA values write correctly:
1. Store values that are greater than or equal to 10 (decimal) and less than 39 (decimal) to the IA32_L2_QoS_Ext_BW_Thrtl_n MSR range using a command such as: wrmsr –p 0 0xd51 10 Note: In this command, 0xd51 should be a value from the series of MSRs described above: 0xD50–0xD57
2. Compare the read value against the expected value using a command such as: rdmsr –p 0 0xd51 Note: Software should make note of values that are being written/requested in step 1 and values that are being returned in step 2, in order to to keep track of requested values (step 1) and values that are set in the MSR (step 2).
3. Repeat steps 1 and 2 until all values greater than or equal to 10 (decimal) and less than 39 (decimal) are tested. This step ensures that the values written to the registers will be applied; however, software should be aware that an incorrect value might be returned.
3.4.4 WorkaroundNone identified.
3.5 Intel CMT and MBM Counters May Be Inaccurate When SNC Is Enabled
3.5.1 ProblemWhen the Sub-NUMA Clustering (SNC) feature is enabled, the CMT and MBM counters may not be accurate.
3.5.2 ImplicationWhen SNC is enabled, software utilizing the CMT and MBM features may not function as expected.
3.5.3 DetectionIntel RDT provides real-time monitoring and allocation with the Intel RDT utility from GitHub. This utility works with generic Linux operating systems to provide per-thread monitoring and control by associating RMIDs and CLOSs with each hardware thread.
Instructions: Perform the following steps to achieve results similar to those shown in Table 13 and Table 14, which illustrate that the CMT and MBM counters may not be accurate with SNC is enabled. This experiment uses the membw benchmark https://github.com/intel/intel-cmt-cat/tree/master/tools/membw to generate NT store operations along with other memory operations like read, write, and so on.
1. Prerequisites:
a. Intel RDT Utility must be installed on your linux distro: the Intel RDT utility from GitHub.
b. Latest Firmware (BIOS) for your platform.
c. Memory Stress test tool. This experiment uses membw: https://github.com/intel/intel-cmt-cat/tree/master/tools/membw
2. Enabled SNC in BIOS:
a. Depending on your BIOS vendor, the location of SNC will vary.
i. Change from disabled to enabled, if it is disabled.
3. Run membw pinned to a core generating specified memory bandwidth with the following command:
i. # ./membw 1 20000 nt-write
22

Reference Manual | Intel® Resource Director Technology (Intel® RDT) on 2nd Generation Intel® Xeon® Scalable Processors Reference Manual
4. Use pqos to monitor local and remote memory bandwidth events, and then save the results to a CSV file using the following command:
i. # pqos -u csv -o pqos _ mon.csv
5. Rerun the steps below, but with SNC disabled. You will see the results indicated in Table 13 and Table 14.
Test Environment Configuration: The test environment for the data presented in this test case is described in Table 12.
Table 12. Test environment details
Server Platform Intel® Server Board S2600WF–based system
Processor Intel® Xeon® Platinum 8260L processor
Speed: 2.3 GHz
Socket Count: 2 sockets (NUMA nodes)
Number of CPUs: 24 cores/socket, 48 threads
Last Level Cache: 33 MB
Stepping: B0
Memory Micron-MIC-MON*
16 GB (8 GB x 8 DR)
DDR4 RE16-2666
2,666 MHz 19-19-19
Socket 0 Socket 1 System
Active Memory 191.0 GB 192.0 GB 383.0 GB
Expected Memory 192.0 GB 192.0 GB 384.0 GB
Active Channels Ch012345 Ch012345
DDR Frequency 2,666 MHz 2,666 MHz 2,666 MHz
Max DDR Frequency 2,933 MHz 2,933 MHz
BIOS BIOS Version: RC D01.0315
Intel® Hyper-Threading Technology (Intel® HT Technology): Disabled
Intel® RDT CAT Opportunistic: Tuned 0x003
Local Storage Intel® SSD
Operating System Fedora 28*
Intel RDT provides real-time monitoring and allocation with the Intel RDT utility from GitHub. This utility works with generic Linux operating systems to provide per-thread monitoring and control by associating RMIDs and CLOSs with each hardware thread.
Table 13 shows the counters with SNC enabled. SNC disabled is shown in Table 14.
In these tests, core 2 is utilized; however, any core can be targetted within the same cluster to demonstrate these results.
Note that the number of cores will vary between the CPU SKU that is used.
Table 13. SNC Enabled
CORE IPC MISSES LLC(KB) MBL(MB/s) MBR(MB/s)
0 0.74 89K 96 0 0.5
1 0.97 8K 0 0.1 0.1
2 0.72 144,517K 0 0.2 0
… … … … … …
94 0.42 0K 3,456 0 0
95 0.42 0K 1,728 0 0
23

Reference Manual | Intel® Resource Director Technology (Intel® RDT) on 2nd Generation Intel® Xeon® Scalable Processors Reference Manual
Table 14. SNC Disabled
CORE IPC MISSES LLC(KB) MBL(MB/s) MBR(MB/s)
0 0.77 39K 480 0.7 0.2
1 0.63 10K 0 0.4 0
2 0.67 114,995K 23,040 7,321.3 0.3
… … … … … …
94 0.25 0K 0 0 0
95 0.33 0K 192 0 0
As traffic is localized to clusters, software would need to be updated to understand the RMID-to-cluster mappings to make effective use of Intel RDT monitoring features when SNC is enabled. This enabling requirement is the source of the errata.
3.5.4 WorkaroundA software workaround is available to enable the usage of Intel RDT with SNC enabled; see the document entitled “Intel Software Enabling Guide for Sub-NUMA Clustering With RDT” for full details.
Alternatively, it is possible to configure the BIOS to disable SNC.
3.6 Intel MBM Counters May Report System Memory Bandwidth Incorrectly
3.6.1 ProblemIntel MBM counters track metrics according to the assigned RMID for a logical core. The IA32_QM_CTR register (MSR 0xXXXX), used to report these metrics, may report incorrect system bandwidth for certain RMID values.
3.6.2 ImplicationDue to this erratum, system memory bandwidth may not match what is reported.
3.6.3 DetectionRMIDs above a certain SKU-specific threshold may exhibit an imbalance in readings relative to other (lower) RMIDs used to sample the same traffic patterns.
3.6.4 WorkaroundIt is possible for software to contain code changes to work around this erratum.
24
Optimization Notice - Intel’s compilers may or may not optimize to the same degree for non-Intel microprocessors for optimizations that are not unique to Intel microprocessors. These optimizations include SSE2, SSE3, and SSSE3 instruction sets and other optimizations. Intel does not guarantee the availability, functionality, or effectiveness of any optimization on microprocessors not manufactured by Intel. Microprocessor-dependent optimizations in this product are intended for use with Intel microprocessors. Certain optimizations not specific to Intel microarchitecture are reserved for Intel microprocessors. Please refer to the applicable product User and Reference Guides for more information regarding the specific instruction sets covered by this notice. Notice revision #20110804Tests document performance of components on a particular test, in specific systems. Differences in hardware, software, or configuration will affect actual performance. Consult other sources of information to evaluate performance as you consider your purchase. For more complete information about performance and benchmark results, visit intel.com/benchmarks. Performance measurements presented are relative and measured on pre-production Intel hardware, firmware and software. Measurements may vary based on hardware, software and firmware configurations. Intel technologies’ features and benefits depend on system configuration and may require enabled hardware, software or service activation. Performance varies depending on system configuration. No computer system can be absolutely secure. Check with your system manufacturer or retailer or learn more at intel.com.For more complete information about performance and benchmark results, visit intel.com/benchmarks.Intel disclaims all express and implied warranties, including without limitation, the implied warranties of merchantability, fitness for a particular purpose, and non-infringement, as well as any warranty arising from course of performance, course of dealing, or usage in trade.Intel, the Intel logo, Intel SpeedStep, and Xeon are trademarks of Intel Corporation or its subsidiaries in the U.S. and/or other countries. *Other names and brands may be claimed as the property of others. © 2019 Intel Corporation.Printed in USA 0419/SH/PRW/PDF Please Recycle 338822-001US