Embed Size (px)
Citation preview

Intel® NetStructure™ Host Media ProcessingDiagnostics Guide
September 2004
05-2356-001

HMP Diagnostics Guide – September 2004
INFORMATION IN THIS DOCUMENT IS PROVIDED IN CONNECTION WITH INTEL® PRODUCTS. NO LICENSE, EXPRESS OR IMPLIED, BY ESTOPPEL OR OTHERWISE, TO ANY INTELLECTUAL PROPERTY RIGHTS IS GRANTED BY THIS DOCUMENT. EXCEPT AS PROVIDED IN INTEL'S TERMS AND CONDITIONS OF SALE FOR SUCH PRODUCTS, INTEL ASSUMES NO LIABILITY WHATSOEVER, AND INTEL DISCLAIMS ANY EXPRESS OR IMPLIED WARRANTY, RELATING TO SALE AND/OR USE OF INTEL PRODUCTS INCLUDING LIABILITY OR WARRANTIES RELATING TO FITNESS FOR A PARTICULAR PURPOSE, MERCHANTABILITY, OR INFRINGEMENT OF ANY PATENT, COPYRIGHT OR OTHER INTELLECTUAL PROPERTY RIGHT. Intel products are not intended for use in medical, life saving, or life sustaining applications.
Intel may make changes to specifications and product descriptions at any time, without notice.
This Intel® NetStructure™ Host Media Processing Diagnostics Guide as well as the software described in it is furnished under license and may only be used or copied in accordance with the terms of the license. The information in this manual is furnished for informational use only, is subject to change without notice, and should not be construed as a commitment by Intel Corporation. Intel Corporation assumes no responsibility or liability for any errors or inaccuracies that may appear in this document or any software that may be provided in association with this document.
Except as permitted by such license, no part of this document may be reproduced, stored in a retrieval system, or transmitted in any form or by any means without express written consent of Intel Corporation.
Copyright © 2004, Intel Corporation
BunnyPeople, Celeron, Chips, Dialogic, EtherExpress, ETOX, FlashFile, i386, i486, i960, iCOMP, InstantIP, Intel, Intel Centrino, Intel Centrino logo, Intel logo, Intel386, Intel486, Intel740, IntelDX2, IntelDX4, IntelSX2, Intel Inside, Intel Inside logo, Intel NetBurst, Intel NetMerge, Intel NetStructure, Intel SingleDriver, Intel SpeedStep, Intel StrataFlash, Intel Xeon, Intel XScale, IPLink, Itanium, MCS, MMX, MMX logo, Optimizer logo, OverDrive, Paragon, PDCharm, Pentium, Pentium II Xeon, Pentium III Xeon, Performance at Your Command, Sound Mark, The Computer Inside., The Journey Inside, VTune, and Xircom are trademarks or registered trademarks of Intel Corporation or its subsidiaries in the United States and other countries.
* Other names and brands may be claimed as the property of others.
Publication Date: September 2004
Document Number: 05-2356-001
Intel Converged Communications, Inc.1515 Route 10Parsippany, NJ 07054
For Technical Support, visit the Intel Telecom Support Resources website at:http://developer.intel.com/design/telecom/support
For Products and Services Information, visit the Intel Telecom Products website at:http://www.intel.com/design/network/products/telecom
For Sales Offices and other contact information, visit the Where to Buy Intel Telecom Products page at:http://www.intel.com/buy/wtb/wtb1028.htm

Contents
Revision History . . . . . . . . . . . . . . . . . . . . . . . . . . . . . . . . . . . . . . . . . . . . . . . . . . . . . . . . . . . . . . 7
About This Publication . . . . . . . . . . . . . . . . . . . . . . . . . . . . . . . . . . . . . . . . . . . . . . . . . . . . . . . . 9
1 Diagnostics Overview . . . . . . . . . . . . . . . . . . . . . . . . . . . . . . . . . . . . . . . . . . . . . . . . . . . . . . . . 11
2 Tracing Intel® Dialogic™ Runtime Libraries . . . . . . . . . . . . . . . . . . . . . . . . . . . . . . . . . . . . . . 13
3 DM3Insight Reference . . . . . . . . . . . . . . . . . . . . . . . . . . . . . . . . . . . . . . . . . . . . . . . . . . . . . . . . 15
4 DM3StdErr Reference. . . . . . . . . . . . . . . . . . . . . . . . . . . . . . . . . . . . . . . . . . . . . . . . . . . . . . . . . 17
4.1 Description. . . . . . . . . . . . . . . . . . . . . . . . . . . . . . . . . . . . . . . . . . . . . . . . . . . . . . . . . . . . . 174.2 Guidelines . . . . . . . . . . . . . . . . . . . . . . . . . . . . . . . . . . . . . . . . . . . . . . . . . . . . . . . . . . . . . 174.3 Options . . . . . . . . . . . . . . . . . . . . . . . . . . . . . . . . . . . . . . . . . . . . . . . . . . . . . . . . . . . . . . . 17
5 Getver Reference . . . . . . . . . . . . . . . . . . . . . . . . . . . . . . . . . . . . . . . . . . . . . . . . . . . . . . . . . . . . 19
6 KernelVer Reference . . . . . . . . . . . . . . . . . . . . . . . . . . . . . . . . . . . . . . . . . . . . . . . . . . . . . . . . . 21
7 QError Reference . . . . . . . . . . . . . . . . . . . . . . . . . . . . . . . . . . . . . . . . . . . . . . . . . . . . . . . . . . . . 23
8 Runtime Trace Facility (RTF) Reference . . . . . . . . . . . . . . . . . . . . . . . . . . . . . . . . . . . . . . . . . 25
8.1 Description. . . . . . . . . . . . . . . . . . . . . . . . . . . . . . . . . . . . . . . . . . . . . . . . . . . . . . . . . . . . . 258.2 RTF Tool Architecture . . . . . . . . . . . . . . . . . . . . . . . . . . . . . . . . . . . . . . . . . . . . . . . . . . . . 25
8.2.1 Overview. . . . . . . . . . . . . . . . . . . . . . . . . . . . . . . . . . . . . . . . . . . . . . . . . . . . . . . . 268.2.2 Files Used by the RTF Tool . . . . . . . . . . . . . . . . . . . . . . . . . . . . . . . . . . . . . . . . . 26
8.3 Starting and Stopping the RTF Tool . . . . . . . . . . . . . . . . . . . . . . . . . . . . . . . . . . . . . . . . . 268.4 RTF Configuration File. . . . . . . . . . . . . . . . . . . . . . . . . . . . . . . . . . . . . . . . . . . . . . . . . . . . 26
8.4.1 RTFConfig Tag . . . . . . . . . . . . . . . . . . . . . . . . . . . . . . . . . . . . . . . . . . . . . . . . . . . 288.4.2 Logfile Tag . . . . . . . . . . . . . . . . . . . . . . . . . . . . . . . . . . . . . . . . . . . . . . . . . . . . . . 308.4.3 Global Tag . . . . . . . . . . . . . . . . . . . . . . . . . . . . . . . . . . . . . . . . . . . . . . . . . . . . . . 318.4.4 GLabel Tag . . . . . . . . . . . . . . . . . . . . . . . . . . . . . . . . . . . . . . . . . . . . . . . . . . . . . . 318.4.5 GClient Tag. . . . . . . . . . . . . . . . . . . . . . . . . . . . . . . . . . . . . . . . . . . . . . . . . . . . . . 328.4.6 GClientLabel Tag . . . . . . . . . . . . . . . . . . . . . . . . . . . . . . . . . . . . . . . . . . . . . . . . . 338.4.7 Module Tag. . . . . . . . . . . . . . . . . . . . . . . . . . . . . . . . . . . . . . . . . . . . . . . . . . . . . . 338.4.8 MLabel Tag. . . . . . . . . . . . . . . . . . . . . . . . . . . . . . . . . . . . . . . . . . . . . . . . . . . . . . 358.4.9 MClient Tag . . . . . . . . . . . . . . . . . . . . . . . . . . . . . . . . . . . . . . . . . . . . . . . . . . . . . 368.4.10 MClientLabel Tag . . . . . . . . . . . . . . . . . . . . . . . . . . . . . . . . . . . . . . . . . . . . . . . . . 368.4.11 Guidelines for Editing the RTF Configuration File. . . . . . . . . . . . . . . . . . . . . . . . . 37
8.5 Example RTF Configuration Files . . . . . . . . . . . . . . . . . . . . . . . . . . . . . . . . . . . . . . . . . . . 388.5.1 Example 1: Tracing disabled . . . . . . . . . . . . . . . . . . . . . . . . . . . . . . . . . . . . . . . . 388.5.2 Example 2: Tracing enabled, logfile path and size specified, one module configured
388.5.3 Example 3: Tracing enabled, logfile path and size specified, several modules
configured, global configuration used . . . . . . . . . . . . . . . . . . . . . . . . . . . . . . . . . . 39
9 StrmStat Reference . . . . . . . . . . . . . . . . . . . . . . . . . . . . . . . . . . . . . . . . . . . . . . . . . . . . . . . . . . 43
HMP Diagnostics Guide – September 2004 3

Contents
Index . . . . . . . . . . . . . . . . . . . . . . . . . . . . . . . . . . . . . . . . . . . . . . . . . . . . . . . . . . . . . . . . . . . . . . . 45
4 HMP Diagnostics Guide – September 2004

HMP Diagnostics Guide – September 2004 5
Contents
Figures
1 RTF Configuration File Tag Structure . . . . . . . . . . . . . . . . . . . . . . . . . . . . . . . . . . . . . . . . . . . . 28

6 HMP Diagnostics Guide – September 2004
Contents
Tables
1 RTF Configuration File Traceable Modules . . . . . . . . . . . . . . . . . . . . . . . . . . . . . . . . . . . . . . . . 34

Revision History
This revision history summarizes the changes made in each published version of this document.
Document No. Publication Date Description of Revisions
05-2356-001 September 2004 Initial version of document. Some of the information contained in this document was previously published in the Intel® Dialogic® System Release 6.0 for CompactPCI on Linux Diagnostics Guide, document number 05-1885-001.
HMP Diagnostics Guide — September 2004 7

Revision History
8 HMP Diagnostics Guide — September 2004

About This Publication
This preface provides information about the purpose, audience, and overall structure of this publication and well as listing related information. This information is contained in the following sections:
• Purpose
• Intended Audience
• How to Use This Publication
• Related Information
Purpose
This publication describes diagnostic tools, each of which is described in a separate reference chapter.
Intended Audience
This publication is intended for:
• System Integrators
• Toolkit Developers
• Independent Software Vendors (ISVs)
• Original Equipment Manufacturers (OEMs)
How to Use This Publication
To use this publication, look up the diagnostic tool you want to use in the Contents or Chapter 1, “Diagnostics Overview” or below and click the link to go to that chapter:
• Chapter 2, “Tracing Intel® Dialogic™ Runtime Libraries”
• Chapter 3, “DM3Insight Reference”
• Chapter 4, “DM3StdErr Reference”
• Chapter 5, “Getver Reference”
• Chapter 6, “KernelVer Reference”
• Chapter 7, “QError Reference”
• Chapter 8, “Runtime Trace Facility (RTF) Reference”
• Chapter 9, “StrmStat Reference”
HMP Diagnostics Guide — September 2004 9

About This Publication
This document also contains a preface (this chapter) and an Index.
Related Information
The following documents and web sites provide more information:
• Intel® NetStructure™ Host Media Processing Software Release 1.2 for Linux Installation Guide - This document describes how to install the HMP Software.
• Intel® NetStructure™ Host Media Processing Software Release 1.2 for Linux License Manager Administration Guide - This publication describes how to perform the various tasks related to obtaining, activating, and otherwise working with HMP Software license files and also how to manually stop and start HMP services.
• Intel® NetStructure™ Host Media Processing Software Release 1.2 for Linux Release Guide - This document provides information about the release such as product features, system requirements, and user documentation.
• Intel® NetStructure™ Host Media Processing Software Release 1.2 for Linux Release Update - This document addresses release issues such as known problems and documentation updates.
• For technical support, go to http://developer.intel.com/design/telecom/support/.
• For information about Intel NetStructure Host Media Processing products, go to http://www.intel.com/design/network/products/telecom/software/index.htm#hmp
• For information about Intel® telecom products, go to http://www.intel.com/design/network/products/telecom/index.htm.
10 HMP Diagnostics Guide — September 2004

11.Diagnostics Overview
This section provides a brief description of the types of diagnostic tools included with the system software. Each tool is described in a reference chapter.
Note: “HMP software resources” can be considered synonymous with “boards.”
DM3Insight ReferenceDM3Insight is a tool used to capture message and stream traffic from the DM3 board device driver.
DM3StdErr ReferenceThe Dm3StdErr tool acts as a virtual serial port (terminal emulation) session to the board.
Getver ReferenceThe Getver tool displays the version of any DM3 board binary file.
KernelVer ReferenceThe KernelVer tool queries the board’s kernel running on a particular processor for its version number.
QError ReferenceThe QError tool displays the string associated with a particular error code returned in a QResultError message from the board.
Runtime Trace Facility (RTF) ReferenceThe RTF tool provides a mechanism for tracing the execution path of various HMP runtime libraries. The trace information can be captured in log files or sent to a debug stream.
StrmStat ReferenceThe StrmStat tool displays the current state of a set of specified streams.
HMP Diagnostics Guide — September 2004 11

Diagnostics Overview
12 HMP Diagnostics Guide — September 2004

22.Tracing Intel® Dialogic™ Runtime Libraries
This chapter describes how to use the Runtime Trace Facility (RTF) tool for tracing the execution path of various Intel® Dialogic™ runtime libraries. For more details about the tool, including the tool’s architecture, information about editing the RTF configuration file, and information about starting, stopping and restarting the tool’s tracing capabilities, refer to Chapter 8, “Runtime Trace Facility (RTF) Reference”.
Use the following procedure to customize and activate the RTF tool’s tracing capabilities:
1. Ensure that the Intel® Dialogic System Software you have installed on your host computer supports the RTF tool. Refer to the system software Release Guide for more information.
2. Locate the RTF configuration file. The default installation location is as follows:
– /usr/dialogic/cfg for Linux systems
– C:\Program Files\Dialogic\cfg for Windows systems
3. If you are familiar with XML syntax, use any ASCII text editor to open the RTF configuration file. If you are not familiar with XML syntax, open the RTF configuration file with XML editor software.
4. Edit the RTF configuration file to customize the RTF tool’s tracing capabilities. Refer to Section 8.4, “RTF Configuration File”, on page 26 for complete information about editing the RTF configuration file. The RTF configuration file includes the following XML tags:
– RTFConfig: This tag’s attributes configure the RTF tool itself. All other tags in the RTF configuration file are children of this tag. This tag must appear one time in the RTF configuration file. The RTF tool’s tracing capabilities are turned off by default. At a minimum, you must change the RTFConfig tag’s trace attribute setting from 0 (default) to 1 to activate the RTF tool. Refer to Section 8.4.1, “RTFConfig Tag”, on page 28 for complete information about the RTFConfig tag. The RTFConfig tag includes the following child tags:
• Logfile: This is the first child tag of the RTFConfig tag. The Logfile tag’s attributes set the parameters for the RTF tool’s logfile output. This tag is an optional part of the RTF configuration file. Refer to Section 8.4.2, “Logfile Tag”, on page 30 for complete information about the Logfile tag.
• Global: This is the second child tag of the RTFConfig tag. The Global tag is used to specify the global configuration. Configuration settings at the global level are valid for all modules in the RTF configuration file. When a module is traced at the global level, all activity related to that particular module is traced. Refer to Section 8.4.3, “Global Tag”, on page 31 for complete information about the Global tag.
• Module: This is the third child tag of the RTFConfig tag. The Module tag is used to specify the trace configuration for a particular module. The default RTF configuration contains pre-defined module tags for traceable Intel® Dialogic runtime libraries. You can edit the state attributes of these pre-defined module tags or delete these pre-defined module tags. However, keep in mind that the RtfConfigLinux.xml file must
HMP Diagnostics Guide — September 2004 13

Tracing Intel® Dialogic™ Runtime Libraries
contain at least one Module tag. Refer to Section 8.4.7, “Module Tag”, on page 33 for complete information about the Module tag.
5. When you are finished editing the RTF configuration file, save and close the file.
6. Start your application. As your application runs, the RTF tool will trace the Intel® Dialogic runtime libraries according to RTF configuration file settings. Refer to the individual entries in the log file or debug stream to review the trace statements generated by the Intel® Dialogic runtime libraries.
7. If you wish to dynamically edit the RTF tool trace levels while your application runs, it is not necessary to stop the RTF tool. Instead, perform the following:
a. Open the RTF configuration file.
b. Customize the settings in the RTF configuration file.
c. Save and close the RTF configuration file.
d. Issue the RtfTrace -restart command to restart the RTF tool.
Note: Keep in mind that changes made to the RTF configuration file will not be reflected in the RTF tool output until the tool has been restarted.
8. At any time, you can issue the RtfTrace -stop command to stop the RTF tool. The RTF tool will not provide output while it is stopped.
14 HMP Diagnostics Guide — September 2004

33.DM3Insight Reference
This chapter provides information about the DM3Insight tool.
DM3Insight is a tool used to capture message and stream traffic from the DM3 board device driver. DM3Insight can be used for the following:
• Debugging/Understanding applications, driver, kernel by capturing traffic and analyzing the trace output
• Viewing messages that are encountered only between the device driver and the DM3 board
• Eliminating orphan messages and streams
• Calculating the turnaround time for messages
• Viewing messages from the board that have incorrect source/destination address or transaction Id and therefore never reach the application
• Viewing error messages from the board like Std_MsgError or QMsgUndelivered, which are not handled (or reported) by simple applications
For complete information about configuring and using the DM3Insight tool, refer to the DM3Insight online help file (DM3Insight.chm). The default directory for this file is C:\program files\Dialogic\bin.
HMP Diagnostics Guide — September 2004 15

DM3Insight Reference
16 HMP Diagnostics Guide — September 2004

44.DM3StdErr Reference
This chapter provides reference information about the Dm3StdErr tool. The following topics are included:
• Description. . . . . . . . . . . . . . . . . . . . . . . . . . . . . . . . . . . . . . . . . . . . . . . . . . . . . . . . . . . 17
• Guidelines . . . . . . . . . . . . . . . . . . . . . . . . . . . . . . . . . . . . . . . . . . . . . . . . . . . . . . . . . . . 17
• Options. . . . . . . . . . . . . . . . . . . . . . . . . . . . . . . . . . . . . . . . . . . . . . . . . . . . . . . . . . . . . . 17
4.1 Description
The Dm3StdErr tool acts as a virtual serial port (terminal emulation) session to the board. The DM3 kernel and resources can be enabled to send qPrintf( ) statements to both the serial port and the host. This program polls the board and posts the qPrintf( ) statements from the resources and DM3 kernel to the screen and/or a designated output file.
4.2 Guidelines
Dm3StdErr and Dm3Trace both act as a virtual serial port (terminal emulation) session to the DM3 board, but they differ as follows:
• If the firmware prints out a string using the qPrintf( ) function call, the output string goes to the com port/dm3Stderr window. If the firmware prints out a string using the qTrace( ) function call, the output string goes to Dm3Trace.
• Dm3StdErr requires a board number, but Dm3Trace requires both a board number and a processor number.
• Dm3StdErr posts qPrintf( ) from all the processors on a board, but Dm3Trace posts qTrace( ) from the indicated processor.
• Dm3Trace allows for an optional argument: trace level, which is a bit mask allowing up to 24 simultaneous active trace levels, whereas Dm3Trace will filter out the output of qTrace( ) that is not in the current trace level.
4.3 Options
The Dm3StdErr tool uses the following command line options:
-b<n>Logical ID of board (required).Use the PBL utility (Linux) or the Intel® Dialogic® Configuration Manager (Windows) to obtain the board’s logical ID.
--d<level>Do not modify. Leave this at the default value of 0.
HMP Diagnostics Guide — September 2004 17

DM3StdErr Reference
-f<file>Output file name (required to save output in a file).
-s<n>Stream number. Do not modify. Leave at the default value of 1.
-hDisplays the help screen.
-vDisplays the version number.
18 HMP Diagnostics Guide — September 2004

55.Getver Reference
This chapter provides reference information about the Getver tool.
The Getver tool displays the version of any DM3 board binary file. It scans the binary for the standard DM3 version string and prints it to the screen.
The following example scans for the qvs_t1.mlm file and prints its version string to the screen:
getver ../data/qvs_t1.mlm
HMP Diagnostics Guide — September 2004 19

Getver Reference
20 HMP Diagnostics Guide — September 2004

66.KernelVer Reference
This chapter provides reference information about the KernelVer tool.
The KernelVer tool queries the board’s kernel running on a particular processor for its version number. This tool can be used to verify whether or not a processor has crashed.
Options
The KernelVer tool uses the following command line options:
-b<n>Logical ID of board (required).Use the PBL utility (Linux) or the DCM configuration utility (Windows) to obtain the board’s logical ID.
--d<level>Do not modify. Leave this at the default value of 0.
-f<file>Output file name (required to save output in a file).
-p<n>Processor number (required). Lowest allowable value is 1.
-l<n>Number of times the program will retrieve the version (optional). You can use this option to repeatedly ping the board’s kernel to generate message traffic.
-hDisplays the help screen.
-vDisplays the version number.
The following example runs the KernelVer tool on board 1, processor 2:kernelver -b1 -p2
HMP Diagnostics Guide — September 2004 21

KernelVer Reference
22 HMP Diagnostics Guide — September 2004

77.QError Reference
This chapter provides reference information about the QError tool.
The QError tool displays the string associated with a particular error code returned in a QResultError message from the board.
Note: QError displays error code strings for DM3 kernel errors only.
The error code string is generated with a Perl* script directly from the header files, so it as accurate as the comments in the header files. The source to the QError code is arranged so that the “get error string” function can be pulled out and used in any application.
Options
The QError tool uses the following command line options:
-b<n>Base of input number (hexadecimal is 16, decimal is 10, default is 16).
-d<level>Do not modify. Leave this at the default value of 0.
-hDisplays the help screen.
-vDisplays the version number.
The following example runs the QError tool on error code 28008:qerror 28008
The output from this example would be as follows:
ERROR==> 0x28008 (163848)Kernel Error: Cluster does not exist or cannot be found.
HMP Diagnostics Guide — September 2004 23

QError Reference
24 HMP Diagnostics Guide — September 2004

88.Runtime Trace Facility (RTF) Reference
This chapter provides an overview of the Runtime Trace Facility (RTF) tool, including the tool architecture, a procedural overview for using the tool and information about editing the RTF configuration file (RtfConfigLinux.xml for Linux* and RtfConfigWin.xml for Windows*) file to set tracing configuration options. Reference information about starting, stopping and restarting the tool’s tracing capabilities is also included. This chapter provides the following subsections:
• Description. . . . . . . . . . . . . . . . . . . . . . . . . . . . . . . . . . . . . . . . . . . . . . . . . . . . . . . . . . . 25
• RTF Tool Architecture . . . . . . . . . . . . . . . . . . . . . . . . . . . . . . . . . . . . . . . . . . . . . . . . . . 25
• Starting and Stopping the RTF Tool . . . . . . . . . . . . . . . . . . . . . . . . . . . . . . . . . . . . . . . 26
• RTF Configuration File . . . . . . . . . . . . . . . . . . . . . . . . . . . . . . . . . . . . . . . . . . . . . . . . . 26
• Example RTF Configuration Files. . . . . . . . . . . . . . . . . . . . . . . . . . . . . . . . . . . . . . . . . 38
A procedure for using the tool is provided in Chapter 2, “Tracing Intel® Dialogic™ Runtime Libraries”.
8.1 Description
The RTF tool provides a mechanism for tracing the execution path of various Intel® Dialogic runtime libraries. The trace information can be captured in log files or sent to a debug stream. The resulting log file/debug stream output helps troubleshoot runtime issues for applications that are built with Intel® Dialogic software.
The RTF tool obtains trace control settings and output formatting from an RTF configuration file (RtfConfigLinux.xml for Linux and RtfConfigWin.xml for Windows). Each Intel® Dialogic runtime library has several levels of tracing that can be dynamically enabled/disabled by editing the RTF configuration file while your application runs. This allows the RTF tool to be configured to meet specific needs.
8.2 RTF Tool Architecture
This section provides an architectural overview of the RTF tool. The following subsections are included:
• Overview
• Files Used by the RTF Tool
HMP Diagnostics Guide — September 2004 25

Runtime Trace Facility (RTF) Reference
8.2.1 Overview
This subsection provides a brief overview of the RTF tool architecture. The top level of the RTF architecture consists of producers and consumers:
• A producer is a software component that has internal Intel® Dialogic RTF APIs incorporated into its source code. This allows producers to generate trace information. Intel® Dialogic runtime libraries are examples of producers (e.g. Global Call, Device Management, Voice).
• A consumer is the internal RTF engine that receives trace information from the RTF producers, converts the trace information into a readable format and outputs the trace information to a log file or debug stream.
8.2.2 Files Used by the RTF Tool
The RTF tool uses the following files, all of which are installed as part of the Intel® Dialogic System Software:
• RtfConfig.xml- Editable file that allows you to customize the tracing and output capabilities of the RTF tool (e.g which Intel® Dialogic runtime libraries the RTF tool will trace, the trace levels, location and size of log files etc.)
• RTFConfig.dtd - document tag definition file for the RTF configuration file. This file is read only; it should not be modified.
8.3 Starting and Stopping the RTF Tool
The RtfTrace command is used to stop and start the RTF tool. This command is issued from the command line and relies on an environmental variable that is defined as part of the Intel® Dialogic System Software installation routine. Therefore, the RftTrace command can be issued from any directory. The RtfTrace command has the following variations:
• RtfTrace -start: Initializes and starts the RTF tool. Tracing is only initiated if/when your application has been started.
• RtfTrace -stop: Stops the RTF tool.
• RtfTrace -restart: Restarts the RTF tool.
8.4 RTF Configuration File
To make full use of the RTF tool, you will want to modify the RTF configuration file (RtfConfigLinux.xml for Linux RtfConfigWin.xml for Windows). This configuration file allows you to define which trace messages will be included in the RTF tool output. This subsection provides
26 HMP Diagnostics Guide — September 2004
Runtime Trace Facility (RTF) Reference
some guidelines for modifying the RTF configuration file and reference information about the file’s XML tags and attributes.
Note: Keep in mind that the tags present in the XML file vary according to which Intel® Telecom System Release you are working with. For example, some tags in this section are only present in the RtfConfigLinux.xml file that ships with the Intel® NetStructure™ Host Media Processing (HMP) software while other tags are only present in the RtfConfigWin.xml that ships with the Intel® Dialogic System Software for Windows.
The RTF configuration file uses a number of esoteric terms that should be understood before attempting to edit the file. The following definitions should be kept in mind as you edit the RTF configuration file:
• module - a binary file, typically an executable or a shared object library file (.so).
• client - an entity for identifying a device (e.g. “dxxxB1C1”), component (e.g. “WaveFileSource”) or a function (e.g. “dx_play()”) that is to be traced by the RTF tool.
• label - an attribute associated with a trace statement (e.g. “Error”, “Warning”, “Info”, “External API entry”, “External API exit” etc.). A trace statement’s label is used by the trace data output for categorization purposes.
• trace entry - individual entries in the trace data output. The trace data output is typically sent to a log file or debug stream.
• 0 - when a 0 appears next to a configuration item in the RTF configuration file, it indicates that the configuration item is disabled.
• 1 - when a 1 appears next to a configuration item in the RTF configuration file, it indicates that the configuration item is enabled.
The RTF configuration file’s top-level document tag is the RTFConfig tag. The following three tags are child tags of the RTFConfig tag:
1. Logfile
2. Global
3. Module
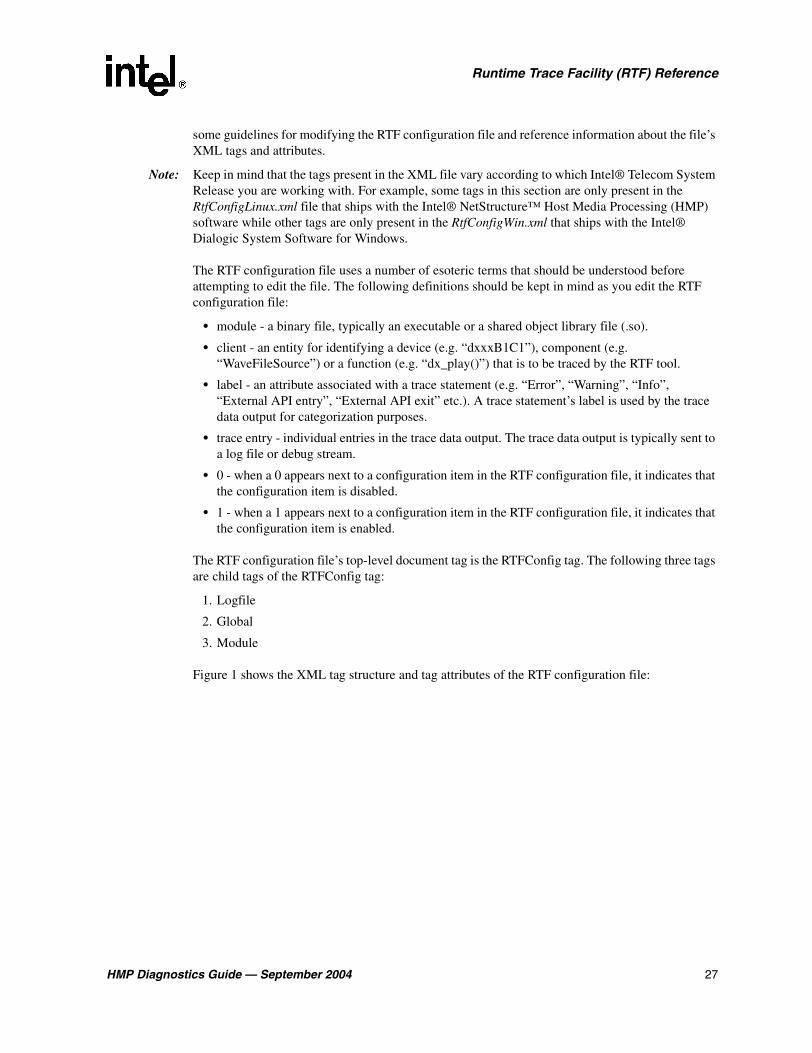
Figure 1 shows the XML tag structure and tag attributes of the RTF configuration file:
HMP Diagnostics Guide — September 2004 27

Runtime Trace Facility (RTF) Reference
Figure 1. RTF Configuration File Tag Structure
8.4.1 RTFConfig Tag
RTFConfig is the document tag. This tag is a mandatory component of the RTF configuration file; it can be found at the top of the RTF configuration file. A sample RTFConfig tag entry is shown below, keep in mind that certain tags are Windows-only while other tags are Linux-only:
<RTFConfig trace=“1” timestamp=”1” tracelocation=”TRACE_LOG” logformat=”ALIGN”>
<!-- Logfile section goes here -->
<!-- Global section goes here -->
<!-- Module sections go here -->
</RTFConfig>
The RTFConfig tag includes the following attributes:
RTFConfigtraceqostimestamptracelocation
Logfilenamepathsize
Global Modulenamestate
GLabelnamestate
GClientnamestate
MLabelnamestate
MClientnamestate
GClientLabelnamestate
MClientLabelnamestate
Convention Used:
Tag nameattribute 1attribute 2...
child Tag nameattribute 1attribute 2...
28 HMP Diagnostics Guide — September 2004
Runtime Trace Facility (RTF) Reference
trace
This attribute is used to enable or disable the RTF tracing capabilities. Valid values are as follows:
• 0 - RTF tracing is disabled. This is the default setting.
• 1 - RTF tracing is enabled.
timestamp
This attribute acts as a Boolean flag to determine whether or not time stamps are generated in the trace data. Possible values are as follows:
• 1 - Time stamping in trace data is enabled. This value is the default.
• 0 - Time stamping in trace data is disabled.
tracelocation
This attribute determines the output mechanism for the RTF tool’s trace data. The trace data can be sent to a log file or a system-specific debug stream (e.g. OutputDebugString( ) on Windows machines). Valid values are as follows:
• TRACE_LOG - RTF sends trace data to a log file. The log file details are specified in the Logfile tag. Refer to Section 8.4.2, “Logfile Tag”, on page 30 for more information. This value is the default.
• SYSTEM_LOG - RTF sends trace data to a system-specific debug stream (debug console on Windows and standard output console for Linux).
logformat
This attribute defines the format of the log file. The following two values are supported:
• ALIGN - Aligns the trace entry fields in the log file into comma separated columns. The top of each column includes a header that provides a description of the column’s content. This is the default setting.
• UNALIGN - Separates the trace entry fields in the log files with commas. Column alignment is not done.
Notes: 1. If you set the logformat attribute to ALIGN, you can customize the widths of the various columns. The following tags in the RTF configuration file allow you to define the aligned column widths:
– ModuleWidth number - Allows you to customize the number of characters that appear in the Module column. The default setting is 10.
– ClientWidth number - Allows you to customize the number of characters that appear in the Client column. The default setting is 10.
– LabelWidth number - Allows you to customize the number of characters that appear in the Label column. The default setting is 10.
2. Using the ALIGN setting makes the log file easier to read but it does not make efficient use of hard drive space. This inefficiency is exacerbated as the log file grows. The UNALIGN format is
HMP Diagnostics Guide — September 2004 29

Runtime Trace Facility (RTF) Reference
separated by commas so it can be parsed by a spreadsheet or database program to make the file easier to read.
createbackup
This attribute is used to determine whether or not backup log files are created. Valid values are as follows:
• 0 - Backup log files will not be created. All trace information will be written to one log file. When the size of this log file reaches the threshold defined in the Logfile tag’s size attribute (refer to Section 8.4.2, “Logfile Tag”, on page 30), the RTF tool “rolls over” the log file, much like a circular buffer. RTF aligns the entries so that the oldest entry is always at the top of the log file and the newest entry is always at the bottom of the log file. This is the default setting.
• 1 - Backup log files will be created. All trace information is initially written to one log file. When the size of this log file reaches the threshold defined in the Logfile tag’s size attribute (refer to Section 8.4.2, “Logfile Tag”, on page 30), the initial log file is saved and the trace data is written to a second log file. This sequence occurs until 99999 log files are created (default naming convention of rtflog00001.txt...rtflog99999.txt). 99999 is the maximum number of log files created by the RTF tool.
8.4.2 Logfile Tag
The Logfile tag is the first child tag of the RTFConfig tag. The Logfile tag provides logistical information about the log file(s) used to store trace output.
If you would like to customize the appearance and settings of the log file, edit the Logfile tag within the RTF configuration file. The Logfile tag appears under the RTFConfig tag in the RTF configuration file.
A sample Logfile tag entry from the RtfConfigLinux.xml file is shown below:
<Logfile name=”rtflog.txt” path=”/var/temp” size=”1000”/>
A sample Logfile tag entry for RtfConfigWin.xml file is shown below:
<Logfile path=”c:\rtflog” size=”1000” maxbackups=”2”/>
The Logfile tag includes the following attributes:
name
Indicates a valid log file name. For Windows systems, log files use an rtflog-[date]-[time].txt naming convention and cannot be changed. For Linux systems, the default log file name is rtflog.txt.
path
Indicates a valid directory path for the log file. The default path for Linux is /var/tmp. The default path for Windows is $(INTEL_DIALOGIC_DIR)\log, where the $(INTEL_DIALOGIC_DIR)
30 HMP Diagnostics Guide — September 2004

Runtime Trace Facility (RTF) Reference
environment variable is defined as part of the Intel® Dialogic System Software installation routine. Refer to the Intel® Dialogic System Software Installation Guide for more information about environment variables.
size
Sets the maximum size, in Kilobytes (KB), of the log file. The default setting is 1000. The behavior varies according to the system software you are working with:
• For Intel® NetStructure HMP releases: When the file reaches its maximum size, the RTF tool “rolls over” the log file, much like a circular buffer. RTF aligns the entries so that the oldest entry is always at the top of the log file and the newest entry is always at the bottom of the log file.
• For Intel® Dialogic System Software releases: The size is the maximum size of a single log file. When the file reaches this size, it will be closed and a new file will be created with a unique timestamp.
maxbackups
Indicates the maximum number of backup log files the RTF creates. The default value is 2.
8.4.3 Global Tag
The Global tag is the second child tag of the RTFConfig tag. The Global tag is used to specify the global configuration. Global configuration settings are valid for all modules included in the RTF configuration file. However, global configuration settings can be overridden by individual settings at the Module tag level (see Section 8.4.7, “Module Tag”, on page 33). The Global tag cannot occur more than one time in the RTF configuration file. The Global tag can either be empty:
<Global>
<!-- This is an example of an empty Global tag -->
</Global>
or the Global tag can have GLabel and/or GClient child tags. There are no attributes associated with the Global tag.
8.4.4 GLabel Tag
The GLabel tag is a child tag of the Global tag; it is used to configure global labels. If a label is defined at the GLabel level then all module and client behavior will be governed by this configuration (unless overridden for a given module at the MLabel level).
The following line may appear in the default RtfConfigLinux.xml file:<GLabel name = “Error” state = “1”/>
This line indicates that tracing of all Error labels is turned on by default. To disable this default behavior, you can delete this line or change the “Error” state attribute setting to 0.
HMP Diagnostics Guide — September 2004 31

Runtime Trace Facility (RTF) Reference
The following lines may appear in the default RtfConfigWin.xml file:<GLabel name = “Error” state = “1”/><GLabel name = “Exception” state = “1”/>
This line indicates that tracing of all Error labels and all Exception labels is turned on by default. To disable this default behavior, you can delete these lines or change the “Error” state attribute and “Exception” state attribute setting to 0.
The GLabel tag has the following two attributes:
name
Indicates the name of the global label to be configured. You must define the name of the global label; there is no default value. Possible labels include:
• “Error” (enabled at the Global level by default)
• “Debug”
• “Info”
• “Warning”
Note: Refer to the default RTF configuration file’s MLabel name attributes. These default entries are for the Intel® Dialogic runtime libraries. Any of these Intel® Dialogic runtime library label names can be included in a GLabel tag.
state
Specifies the state of the label. Valid values are as follows:
• 1 - label is enabled at the global level. All trace messages associated with this label will be sent to the trace output. This is the default value.
• 0 - label is disabled at the global level. Trace messages associated with this label will not be sent to the trace output.
8.4.5 GClient Tag
The GClient tag is a child tag of the Global tag; it is used to configure global clients (devices). If a client is defined at the GClient level then all client behavior will be governed by the this configuration (unless overridden for a given client at the MClient level). The GClient tag can be empty or have GClientLabel children tags. The GClient tag has the following two attributes:
name
Indicates the name of the client to be configured. You must define the name of the global client; there is no default value. Example clients include:
• “dxxxB1C1”
• “dxxxB2C2”
32 HMP Diagnostics Guide — September 2004

Runtime Trace Facility (RTF) Reference
state
Specifies the state of the client. Valid values are as follows:
• 1 - client is enabled at the global level. All trace messages associated with this client will be sent to the trace output. This is the default value.
• 0 - client is disabled at the global level. Trace messages associated with this client will not be sent to the trace output.
8.4.6 GClientLabel Tag
The GClientLabel tag is a child tag of the GClient tag; it is used to specify a label for a global client. The GClientLabel tag has the following two attributes:
name
Indicates the name of a client label to be configured. You must define the name of the client label; there is no default value. Possible client labels include:
• “Error”
• “Warning”
• “Entry”
Note: Refer to the default RTF configuration file’s MLabel name attributes. These default entries are for the Intel® Dialogic runtime libraries. Any of these Intel® Dialogic runtime library label names can be included in a GClientLabel tag.
state
Specifies the state of the label. Valid values are as follows:
• 1 - client label is enabled at the global level. Trace messages associated with this label will be sent to the trace output. This is the default value.
• 0 - client label is disabled at the global level. Trace messages associated with this label will not be sent to the trace output.
8.4.7 Module Tag
This tag is used to specify configuration for various modules. Configuration at the module level overrides global configuration. For example, if the state of a label “Error” is set to “1” in the global section and “Error” is set to “0” for an individual module, then the label “Error” will not traced for that particular module. The module section must exist in the configuration file, even if the section is empty. Possible child tags of the Module tag are MClient and MLabel.
HMP Diagnostics Guide — September 2004 33

Runtime Trace Facility (RTF) Reference
The RTF configuration file contains modules for the Intel® Dialogic runtime libraries. Table 1 lists the Intel® Dialogic runtime libraries that have modules included in the default RTF configuration file. You can edit the state attributes of the modules to enable (set state = “1”) or disable (set state = “0”) the tracing. Alternatively, you can delete one or more modules from the default RTF configuration file if you are not interested in tracing certain Intel® Dialogic runtime libraries.
Table 1. RTF Configuration File Traceable Modules
Library Description File Name (.so for Linux,
.dll for Windows)
PMAC Transport pmac_transport
Fax library libfax
Fax NTF library libFaxntfmt (Windows only)
Voice library libdxxm
Voice NTF library voxspan (Windows only)
Standard Runtime library (SRL)
libsrl
NDI ndi (Windows only)
MSI DM3 libDm3Msi
IPM PMAC libipm_pmac.so
Cheetah Cheetah
BRI NTF brintf (Windows only)
DTI NTF libDtintfmt (Windows only)
DTI library libdti
MSI Rev4 library libmsir4 (Windows only)
MSI NTF libMsintfmt (Windows only)
ODI Dm3Odi
OTI DM3Oti
DM3 utility DM3Utility
ipvsc library libipm_ipvsc
ipm library libipm
Global Call libgc
Global Call (IP) libgcipm
Global Call (PDK) libpdkrt
ISDN library libisdn
ISDN Technology Formatter library
isdnspan (Windows only)
UTI UTI
34 HMP Diagnostics Guide — September 2004

Runtime Trace Facility (RTF) Reference
The Module tag includes the following attributes:
name
Indicates the name of a module to be configured. Intel® Dialogic runtime libraries have module names in the default RTF configuration file. Example module names in the RTF configuration file include:
• “cheetah”
• “libdcnf”
• “libdevmgmt”
state
Specifies the state of the module. Valid values are as follows:
• 1 - module is enabled. Trace messages associated with this label will be sent to the trace output. This is the default value.
• 0 - module is disabled. Trace messages associated with this label will not be sent to the trace output.
8.4.8 MLabel Tag
The MLabel tag is a child tag of the Module tag. The MLabel tag is used to configure module labels. If a label is defined at the global level and the same label is defined at the module level, the module level configuration overrides the global configuration for the module. The MLabel tag has the following two attributes:
name
Indicates the name of the label to be configured. The Intel® Dialogic runtime libraries have module label names in the default RTF configuration file. Example module label names in the RTF configuration file include:
• “Error”
• “Warning”
• “Entry”
CNF library libcnf
Device management library
libdevmgmt
Table 1. RTF Configuration File Traceable Modules
Library Description File Name (.so for Linux,
.dll for Windows)
HMP Diagnostics Guide — September 2004 35

Runtime Trace Facility (RTF) Reference
state
Specifies the state of the label. Valid values are as follows:
• 1 - label is enabled. Trace messages associated with this label will be sent to the trace output. This is the default value.
• 0 - label is disabled. Trace messages associated with this label will not be sent to the trace output.
Note: When the state attribute is not included or not defined, the default value is 1. However, the Intel® Dialogic runtime library module labels that exist in the default RTF configuration file have their state attribute initially set to 0.
8.4.9 MClient Tag
The MClient tag is a child tag of the Module tag; it is used to configure a specific client for the module. The MClient tag can be empty or have MClientLabel children tags. The MClient tag has the following two attributes:
name
Indicates the name of the client to be configured. The Intel® Dialogic runtime libraries have pre-defined module client names in the default RTF configuration file. Example clients include:
• “dxxxB1C1”
• “dxxxB2C2”
state
Specifies the state of the client. Valid values are as follows:
• 1 - client is enabled. Trace messages associated with this client will be sent to the trace output. This is the default value.
• 0 - client is disabled. Trace messages associated with this client will not be sent to the trace output.
Note: When the state attribute is not included or not defined, the default value is 1. However, the Intel® Dialogic runtime library module clients that exist in the default RTF configuration file have their state attribute initially set to 0.
8.4.10 MClientLabel Tag
The MClientLabel tag is a child tag of the MClient tag; it is used to specify a label for a client. The MClientLabel tag has the following two attributes
36 HMP Diagnostics Guide — September 2004

Runtime Trace Facility (RTF) Reference
name
Indicates the name of a label to be configured. You must define the name of the label; there is no default value. Example labels include:
• “Error”
• “Warning”
• “Entry”
state
Specifies the state of the label. Valid values are as follows:
• 1 - label is enabled. Trace messages associated with this label will be sent to the trace output. This is the default value.
• 0 - label is disabled. Trace messages associated with this label will not be sent to the trace output
8.4.11 Guidelines for Editing the RTF Configuration File
Keep the following rules in mind when editing the RTF configuration file:
1. Do not change the name of the file. The filename must remain RTF configuration.
2. The RTF configuration file is broken down into three sections. The sequence of the sections must always be as follows:
a. Logfile configuration (not required)
b. Global configuration
c. Module configuration
3. The Logfile section, which provides logistical information about the resulting log file(s), is optional. If you do not provide information about the logfile, then the RTF tool will use the following log file settings:
a. File name: rtflog.txt (default name is provided for Linux only)
b. File location: /var/tmp for Linux, $(INTEL_DIALOGIC_DIR)\log for Windows
c. Maximum size: 1000 KB
4. The Global configuration section can only appear one time in the RTF configuration file.
5. If a there is configuration information which conflicts in the global and module sections (for example, the global section enables a trace label for a client, but the module section disables this same label for the same client), then the module configuration overrides the global configuration.
6. Configuration information which is repeated later in the file will take precedence. For example, if there are two module configurations for libdxxx.so (Linux) or libdxxx.dll (Windows), the configuration information lower in the file will dictate tracing behavior for that module.
Note: This should not be done, but it is mentioned here so the behavior can be recognized if this situation occurs by error.
HMP Diagnostics Guide — September 2004 37

Runtime Trace Facility (RTF) Reference
7. RTF configuration file syntax is case sensitive. Therefore, the trace labels “Error” and “error” are considered to be two distinctly different trace labels.
8. Simultaneous tracing of multiple Intel® Dialogic® libraries may have an adverse effect on system performance.
9. RTF affects running processes/applications only. If you enable RTF prior to starting your application, the RTF will not provide trace information until your application has started.
8.5 Example RTF Configuration Files
This section provides a number of example RtfConfigLinux.xml files along with a brief explanation of how the file settings effect the RTF tool’s trace output. Note that the same rules/examples covered in this section can be extended to the RtfConfigWin.xml file.
8.5.1 Example 1: Tracing disabled
<?xml version="1.0" standalone="no"?> <!DOCTYPE RTFConfig SYSTEM "RTFConfig.dtd" >
<RTFConfig trace="0">
<Logfile path="/var/tmp" size="1024"/>
<Global>
</Global>
<Module name="libdxxx.so" state = "1"> MLabel name="Error" state = "1"/> MLabel name="Warning" state = "0"/></Module>
</RTFConfig >
Explanation
The RTFConfig tag’s trace attribute is set to 0 so tracing is disabled. Trace output will not be created. Set the trace attribute to 1 to activate tracing.
8.5.2 Example 2: Tracing enabled, logfile path and size specified, one module configured
<?xml version="1.0" standalone="no"?><!DOCTYPE RTFConfig SYSTEM "RTFConfig.dtd" >
38 HMP Diagnostics Guide — September 2004

Runtime Trace Facility (RTF) Reference
<RTFConfig trace="1">
<Logfile path="/var/tmp" size="1024"/>
<Global>
</Global>
<Module name="libdxxx.so" state = "1"> MLabel name="Error" state = "1"/> MLabel name="Warning" state = "1"/></Module>
</RTFConfig >
Explanation
The RTFConfig tag’s trace attribute is set to 1 so tracing is enabled. The Global tag is empty, so there is no global configuration. Tracing is only configured at the module level.
The path for the log file is /var/tmp and the maximum logfile size is 1024KB. The log file name is not specified so the default name (rtflog.txt) is used.
The only module configured for trace is libdxxx.so. This means that all clients (devices) for this module are configured to trace Error and Warning labels.
8.5.3 Example 3: Tracing enabled, logfile path and size specified, several modules configured, global configuration used
<?xml version="1.0" standalone="no"?><!DOCTYPE RTFConfig SYSTEM "RTFConfig.dtd" ><RTFConfig trace="1">
<Logfile path="/var/tmp" size="1024"/>
<Global> <GLabel name="Entry" state = "1"/> <GClient name="dxxxB1C2" > <GClientLabel name="Exit" state =”1”/> </GClient></Global>
<Module name="libdxxx.so" state = "1"> MLabel name="Error" state = "1"/> MLabel name="Warning" state = "0"/></Module>
HMP Diagnostics Guide — September 2004 39

Runtime Trace Facility (RTF) Reference
<Module name="libdxxx.so"> <MLabel name="Entry" state = "0"/> <MLabel name="Warning" state = "1"/> <MClient name="dxxxB1C2" > <MClientLabel name="Entry"/> /MClient></Module>
<Module name="libfax.so" state = "1"> <MLabel name="Warning" state = "1"/</Module>
<Module name="libdti.so"> <MClient name="dxxxB2C1"> <MClientLabel name="Internal_Exit"/ </MClient>
</Module>
</RTFConfig >
Explanation
The trace attribute of the RTFConfig tag is set to 1 so tracing is enabled.
The logfile path is /var/tmp. The log file’s maximum size is 1024KB. A name is not specified so the default name (rtflog.txt) is used.
The Global section is present in the configuration file, so all modules will have this global configuration. This configures “Entry” as a global label and “dxxxB1C2” is a global client for label “Exit”.
In the module section there are two configurations for libdxxx.so so the later configuration will take precedence. Since the state of libdxxx.so is not specified it takes default value “1”. Tracing is enabled for the module libdxxx.so but only for the “Warning” label. Even though “Entry” is configured to trace in the global section, it is disabled in the libdxxx.so module configuration, so the “Entry” label will not be traced.
The client “dxxxB1C2” is also configured to trace in the libdxxx.so module with the label “Entry”. Therefore the client “dxxxB1C2” in libdxxx.so is traced for the label “Entry”, even though it is disabled in the module section. This results in the client “dxxxB1C2” being traced for the labels “Exit” (from global configuration), “Warning” (from module configuration) and “Entry” (from its own configuration) in module libdxxx.so. While all other clients of libdxxx.so are configured to be traced for only label “Warning”, as “Warning” is the only label configured to be traced for the module.
40 HMP Diagnostics Guide — September 2004

Runtime Trace Facility (RTF) Reference
The libfax.so module is configured to trace “Warning” (from the module section) and “Entry” (from the global section). The libfax.so client “dxxxB1C2” is configured to trace for “Warning” (from module configuration), “Exit” (from global client section) and “Entry” (from global label section). All other clients of this module are configured to trace “Warning” (from module section) and “Entry” (from the global section) since these labels are configured for the module.
The libdti.so module is configured to trace “Entry” (from the global section). “dxxxB1C2” in libdti.so is configured to trace “Entry” (from the global section) and “Exit” (from the global client). The other client “dxxxB2C1” is configured to trace “Entry” (from the global configuration) and “Internalities” (from the module client section). All other clients of this module are configured to trace “Entry” (from the global section) since these labels are configured for the module.
HMP Diagnostics Guide — September 2004 41

Runtime Trace Facility (RTF) Reference
42 HMP Diagnostics Guide — September 2004

99.StrmStat Reference
This chapter provides reference information about the StrmStat tool.
The StrmStat tool displays the current state of a set of specified streams. Possible states of a stream as shown by the StrmStat display are as follows:
• closing
• closed
• close failed
• opening
• opened for write
• opened for read
• open failed
Options
The StrmStat tool uses the following command line options:
/b<n>logical ID of the board (required). Use the DCM configuration utility to obtain the board’s logical ID.
/f<file>log file name (default is strmstat.log)
/i<n>number of streams on which to report (default is 120)
/s<n>first stream to report (default is 1)
/?displays the program help screen (optional)
The following command displays the stream state for the stream IDs 1-16 on board 0:strmstat /b 0 /i 16
HMP Diagnostics Guide — September 2004 43

StrmStat Reference
44 HMP Diagnostics Guide — September 2004

Index
AALIGNED 29
Bbinary file 11, 19
Cclient 27
ClientWidth 29
consumer 26
createbackup 30
DDM3Insight.chm 15
DM3StdErr tool 11, 17
document tag 28
EEntry 33
Error 33
GGClient tag 32
GClientLabel 33
Getver tool 11, 19
GLabel tag 31
Global tag 31
KKernelVer tool 11, 21
Llabel 27
LabelWidth 29
Logfile tag 30
logformat 29
MMClient 33
MClient tag 36
MClientLabel tag 36
MLabel 33
MLabel tag 35
module 27
ModuleWidth 29
Ppath 30
Perl 23
producer 26
QQError 23
QError tool 11, 23
qPrintf( ) 17
QResultError 11, 23
qTrace( ) 17
RRTF configuration file 26
RTF tool 13
RTFConfig tag 27
RtfConfig.dtd 26
RtfConfigLinux.xml 25, 26
RtfConfigWin.xml 25
RtfTrace command 26
runtime libraries 13
Runtime Trace Facility 13
Ssize 31
start the RTF tool 26
state 32, 33
stop the RTF tool 26
StrmStat tool 11, 43
strmstat.log 43
HMP Diagnostics Guide — September 2004 45

SYSTEM_LOG 29
Ttimestamp 29
trace 29
trace entry 27
TRACE_LOG 29
tracelocation 29
Tracing disabled 38
UUNALIGNED 29
Vversion string 19
WWarning 33
46 HMP Diagnostics Guide — September 2004