Embed Size (px)
Citation preview
The Journal of Neuroscience January 1986, 6(l): 145-157
Integration of Direction Signals of Image Motion in the Superior Temporal Sulcus of the Macaque Monkey
Hide-aki Saito,* Masao Yukie, Keiji Tanaka,* Kazuo Hikosaka, Yoshiro Fukada,* and Eiichi lwai Department of Behavioral Physiology, Tokyo Metropolitan Institute for Neurosciences, Tokyo, 183 Japan, and *NHK Science and Technical Research Laboratories, Tokyo, 157 Japan
Using anesthetized and paralyzed monkeys, we have studied the visual response properties of neurons in the cortical area sur- rounding the middle temporal area (MT) in the superior tem- poral sulcus (STS). Systematic electrode penetrations revealed that there is a functionally distinct region where three classes of directionally selective cells with large receptive fields cluster. This region is anteriorly adjoined to the dorsal two-thirds of MT, has a width of 4-5 mm mediolaterally, and therefore may correspond to the dorsal part of the medial superior temporal area (MST), which was previously defined as a MT-recipient zone. One class of cells responded to a straight movement of patterns in the frontoparallel plane with directional selectivity (D cells: 2171422, 51.4%). The second class of cells selectively responded to an expanding or contracting size change of pat- terns (S cells: 66/422, 15.7%). These cells responded neither to a change in width of a slit of any orientation or any length, nor to a change in brightness. The third class of cells responded only to a rotation of patterns in one direction (R cells: 58/422, 13.7%). A majority of these cells (41/58) responded to the clock- wise or counterclockwise rotation of patterns in the frontopar- allel plane (Rf cells), while the rest responded to a rotation of patterns in depth (Rd cells). We will suggest that these cells acquire the ability to discover whole events of visual motion- i.e., unidirectional straight movement, size change (radial move- ment), and rotation- by integrating elemental motion informa- tion extracted by MT cells. The receptive fields of D, S, and Rf cells can be constructed by converging signals of MT cells, the preferred directions of which are arranged in parallel (D cells), radially (S cells), and circularly (Rf cells). The receptive fields of Rd cells can be constructed, in turn, by the convergence of signals of S cells.
The extrastriate visual cortex of the macaque is composed of multiple areas (Maunsell and Van Essen, 1983~; Rockland and Pandya, 1979; Seltzer and Pandya, 1978; Van Essen et al., 1982; Van Essen and Maunsell, 1983; Van Essen and Z&i, 1978; Z&i, 1969, 1971, 1977, 1978a), and a model of the anatomical hi- erarchy of these multiple areas has been put forward (Van Essen and Maunsell, 1983; Maunsell and Van Essen, 1983~). Although the functional hierarchy is not clear yet, it has been suggested
Received Apr. 5, 1985; revised July 15, 1985; accepted July 17, 1985. We wish to thank Drs. L. G. Ungerleider and R. Desimone for their helpful
advice in making the semichronic recording, and Dr. H. Sakata for many stim- ulating discussions during the course of the experiment. We also thank Kaomi Nonaka and Hiro-aki Hino, undergraduate students at Tamagawa University, Faculty of Engineering, for help with data analysis, and Keiko Tatsuki for typing the manuscript.
Correspondence should be addressed to Hide-aki Saito, NHK Science and Tech- nical Research Laboratories, I- IO- 1 I, Kinuta, Setagaya-ku, Tokyo, 157 Japan.
Copyright 0 1986 Society for Neuroscience 0270-6474/86/010145-13$02.00/O
that there are at least two distinct information flows in the hierarchical paths: one pathway analyzes form and color and the other, visual motion. The “form-color” pathway includes area V4, which contains a large population of color-coded and orientation-selective cells (Zeki, 1978b, 1979) and leads into the inferotemporal cortex, which has been shown to be closely linked with pattern discrimination (Iwai, 1982, 1985; Iwai and Mishkin, 1968; Sato et al., 1980; Yaginuma et al., 1982). The “visual motion” pathway includes the MT area (middle tem- poral area), which contains a high proportion of directionally selective cells (Albright et al., 1984; Maunsell and Van Essen, 1983a, b; Tanaka et al., 1984, 1986; Zeki, 1974a, 1978b). From MT, the fibers are sent to the MST (medial superior temporal area) and then to the posterior parietal cortex (see Maunsell and Van Essen, 1983~) which is thought to be involved in spatial perception, as well as visually guided motor control (Motter and Mountcastle, 1981; Mountcastle et al., 1975, 1981; Robinson et al., 1978; Sakata et al., 1980, 1983, 1985; reviewed by Hy- v&men, 1982). On the basis of these views, it has been suggested that there are two cortical paths, one mediating object vision and the other mediating spatial vision (Iwai, 1982; Mishkin et al., 1983; Ungerleider and Mishkin, 1982).
What kinds of serial processing are carried out in these parallel pathways? In the analysis of color, a group of V4 cells has been reported to show highly integrative behavior that corresponds to one psychological phenomenon: color constancy (Zeki, 1980a, 1983a, b). A recent ablation study has supported this notion (Wild et al., 1985). Since such color-coded cells have not been found in area Vl (Z&i, 1983a), a special integration may take place along the color-analyzing pathway. As for the motion- analyzing pathway, visual cells having higher functions, such as fovea1 sparing (Motter and Mountcastle, 198 l), opponent vector organization for direction of motion (Motter and Mountcastle, 198 l), and detection of motion in depth and rotary movement (Sakata et al., 1985, and personal communication), have been found in area 7a. However, in MST, only cells which have large receptive fields and show directionally selective responses to a straight movement of patterns have been described (Maunsell and Van Essen, 1983b, Tanaka et al., 1986; Van Essen et al., 198 1; Wurtz et al., 1984; Zeki, 1980b). To clarify the integration of visual information along the motion-analyzing pathway, we have examined receptive-field properties of MST cells exten- sively in anesthetized and paralyzed monkeys.
This paper reports that three classes of directionally selective cells, one responding to a unidirectional straight movement in the frontoparallel plane (D cells), the second to a size change (S cells), and the third to a rotary movement of patterns (R cells), clustered within a restricted region that seems to correspond to the dorsal part of MST. This region will be referred to as the “DSR” region. We will discuss the process of integration of MT input in building up the receptive fields of D, S, and R cells, as well as the functional role of the DSR region. Preliminary ac-
145

146 Saito et al. Vol. 6, No. 1, Jan. 1986
region
lent. sis
Figure 1. Site of recordings in the macaque brain. Receptive-field properties of the cells in the area anteriorly adjoining MT were system- atically examined. The vertical range of recordings is shown by arrows on the lateral view of the macaque brain (upper drawing). MT lies deep in a part of the STS (filled triangles). Lower drawing, A horizontal section at level A. Trackings were made horizontally at an angle of 30”-45” to the parasagittal plane. The electrode passed through MT or a more lateral part of the posterior bank of the STS, and then entered the anterior bank, where the DSR region was located. F, Fundus of the STS. AS, Arcuate sulcus; CS, cent&l sulcus; ZOS, inferior occipital sulcus; ZPS, intraparietal sulcus; LF, lateral fissure; LS, lunate sulcus; PS, principal sulcus; STS, superior temporal sulcus.
counts of these results have been briefly described elsewhere (Saito et al., 1984; Yukie et al., 1985).
Materials and Methods Four Japanese monkeys (Mucucu fucutu) weighing 4-7 kg were re- peatedly used in the experiments (9-14 x each). The animals were anes- thetized with a gas mixture ofN,O and 0, (70:30 to 80:20) and paralyzed with gallamine triethiodide (Flaxedil, initially 10 mg/kg, supplemented by hourly 4 mg/kg intramuscular injection) during recording sessions. The details of the procedures of preparation and recording were de- scribed in the preceding paper (Tanaka et al., 1986).
Systematic recording Systematic penetrations were made in the deep region of the STS using glass-coated platinum-iridium electrodes. Electrodes advanced antero- medially in the horizontal plane, at an angle of 30”45” from the para- sagittal plane (Fig. 1). Usually, two to seven penetrations, separated by 1 mm, were made in each of six to 10 horizontal planes, separated by l-2 mm (see Fig. 11). In one animal, several penetrations were also made from the anterior side. A total of 17-27 penetrations were made in each of the four hemispheres of three animals. The dorsoventral range we examined is indicated by the vertical arrows on the lateral view of the macaque brain (Fig. 1).
After the last recording session, the animal was deeply anesthetized with pentobarbital sodium (Nembutal) and perfused intracardially with a warm saline, followed by 10% formol-saline. Horizontal sections of the brain were made at 50 pm thickness, as described in detail in the preceding paper (Tanaka et al., 1986). Every fifth section was stained with a modified Heidenhain’s myelin stain (Hutchins and Wever, 1983) or Gallyas’ silver stain (Gallyas, 1979), and the other sections were stained with cresyl violet. The extent of MT was determined by the dense and uniform myelinated band in layers IV-VI of the cortex (Un- gerleider and Mishkin, 1979; Van Essen et al., 1981). With the aid of
the electric lesions made by passing a current (10 PA, tip negative, 20 set) at the end of several penetrations, as well as of traces of the elec- trodes, the tracks of electrodes were reconstructed on the drawings of the horizontal sections.
Photic stimulation In a pilot study using one experimental animal, it was found that, in the region anteriorly adjoining MT, a substantial number of cells were insensitive to any straight movement of projected patterns, but were activated when a hand-held object was moved in depth or rotated. Therefore, we prepared equipment to produce stimuli with the following four fundamental movements: (1) unidirectional straight movement of patterns in the frontoparallel plane; (2) monocular and binocular signals of motion in depth, i.e., size change and binocular disparity change; (3) rotary movement of patterns in the frontoparallel plane; and (4) rotary movement of patterns in depth.
The first type of stimulus was produced by projecting various patterns on a translucent tangent screen (placed 57 cm in front of the eyes, subtending over 100” x loo’), and moving them back and forth by means of a mirror mounted on a galvanometer. Routinely used patterns were a light slit ofvariable width and length, and a wide-field dot pattern (a lattice of light spots; spot diameter: 0.7”, spot separation: 2”, the whole pattern subtending 70” x 55’). To investigate a preference of cells for a pattern shape, dot patterns made up of larger (l”, 2”, and 4” diameter) dots, stripes of various spatial frequencies, randomly textured patterns of various spatial properties, photographs of real objects, such as a face, hand, etc., were also employed.
The size-changing stimuli included a change in the width of a light slit, change in size of a white circle or a square, and zooming in and out of a projected wide-field dot pattern. The former two stimuli were produced by putting a mask in the focal plane of the projector. Three masks were made by arranging adequate wings for the purpose of pro- ducing either rectangular, circular, or square windows of changeable width or size. In the third stimulus, which was obtained by use of a zoom lens, all the elements of the pattern moved radially over the wide field with a size change in each element. Such a stimulus is referred to as “radially directed visual flow.”
The frontoparallel rotary motion was produced by rotating hand-held circular flat boards, black rectangles, and projected patterns. The boards were textured with small rectangles (0.5” x 1” to 1” x 4”). Some of them were brighter and others darker than the gray base mat. Boards of differing diameters (from lo” to 40”, in 10” steps) were prepared.
Rotary motion in depth was produced by rotating the textured flat boards. We also employed a rotating drum (25” diameter, 25” height), the surface of which was textured with small, rectangular patterns. The latter stimulus, but not the former, produced a rotary stimulus which kept the subtending angle of the whole pattern constant.
For the cells that did not respond at all to the monocular and binocular presentation of any of the above-mentioned stimuli, we tested to find whether the cells were selective for a particular value of binocular dis- parity (static disparity) or to a change in disparity (dynamic disparity). A Risley prism was set in front of one eye to change the value of static disparity. For the test of selectivity to a disparity change, the visual axis of one eye was diverted far from that of the other by use of the Risley prism, and a pair of slits was projected onto the respective fields of the eyes, and moved in mutually opposing directions.
Projected patterns were about 1 log unit brighter than the background (4 cd/m2). The brightness contrast of the textures of the hand-held boards was also around 10 (1 log unit). All size changes and rotations of stimuli were performed by hand, in synchrony with an automatically moved marker. Thus, the observations of the cells, which responded to size changes and rotations, were mainly qualitative. The responses of the cells and timing signals ofthe stimulus were recorded on the memory devices of a microcomputer for the purpose of making peristimulus time histograms (PSTHs). Responses to 10-20 stimulus cycles were routinely averaged.
Results In the restricted region anteriorly adjoining the dorsal two-thirds of area MT, three classes of directionally selective cells (referred to as D, S, and R cells) clustered. The region may correspond to a dorsal part of MST (designated by Maunsell and Van Essen, 1982). It will be referred to as the DSR region in this report.
For the D cells, which showed directionally selective re-

The Journal of Neuroscience Integration of Motion Cues in Macaque STS 147
0
0
. . ‘0
OL I 0 10 20 30 40 50 60'
eccentricity
Figure 2. Size and position of the receptive fields of D (dot), S (tri- angle), and R (circle) cells. Upper, Seven receptive fields of each of three classes of cells. Lower, Size of the receptive field plotted against the eccentricity of its center. There is neither a positive nor negative cor- relation between the two. N = 111, 52, 33 for D, S, and R cells, re- spectively. The extent of the receptive field was expressed by azimuth and elevation, adopting the spherical polar coordinate (axis vertical) system (Bishop et al., 1962). The size of the receptive field is expressed by the square root of area in this and succeeding figures.
sponses to the unidirectional straight movement of patterns in the frontoparallel plane, detailed descriptions have been given in the preceding paper (Tanaka et al., 1986), comparing their response characteristics with those ofdirectionally selective cells in MT. This paper reports the receptive-field properties of S and R cells, which responded selectively to size change and rotation of patterns, with additional observations on D cells. The site and extent of the DSR region are also described.
Response properties of cells in the DSR region The cell types recorded in the DSR region and their populations are listed in Table 1. The great majority (3661422, 86.7%) of the cells in the DSR region were activated by photic stimuli. Auditory and somesthetic stimuli (such as voice, pure tone, noise, touching the skin, etc.) were also given to visually un- responsive cells and to some visually responsive cells, but none of them responded to these stimuli. Therefore, this region may concern mainly visual analysis. However, whether the cells of the DSR region receive other nonvisual signals, such as those of eye movements and vestibular inputs, remains to be seen.
When a cell was isolated, the effective stimulus for its acti- vation was determined by the use of hand-held and/or projected patterns; the extent of the receptive field was then plotted on the screen. The spatial extent of the receptive field of D cells was determined by the method of “minimum response field” (Barlow et al., 1967): an oscillating slit or textured square board was slowly shifted from the central region of the receptive field towards the periphery, and the position of the trailing edge of
Table 1. Types and populations of cells recorded in the DSR regiow and the ventral par@ of MST (figures in parentheses indicate percentages)
Ventral part DSR region of MST
D celp 217 (51.4) 68(70.1)
S celld 66(15.7) 4 (4.1)
Expansion 46 4
Contraction 20 0
R celp 58 (13.7) 0 (0.0) Clockwise 19 Counterclockwise 22
Depth 17
Directionally biased cell 3 (0.7) 2(2.1)
Pandirectional cell 4 (1.0) l(l.0) Bidirectional cell 5 (1.2) l(l.0) Jerky cell 5 (1.2) 3 (3.1)
Dynamic disparity cell 2(0.5) 0 (0.0)
Bi-R cell’ 0 (0.0) l(l.0) ON-cell 5 (1.2) 0 (0.0)
OFF-cell 1 (0.1) 0 (0.0) Unclassified 56(13.3) 17(17.5)
Total 422 97
a Cell count was made for the recording sites plotted by filled and open circles which appeared dorsal to the upper broken line shown in Figure 12. b Cell count was made for the recording sites plotted by open circles (including one “u”-marked site surrounded by open circles) between two broken lines in Figure 12. c Directionally selective cells that responded to unidirectional straight movement of patterns in the equidistant plane. d Directionally selective cells that responded to size change of patterns. c Directionally selective cells that responded to rotation of patterns. ‘Cell that responded to both clockwise and counterclockwise rotations of patterns.
the pattern was defined as a border if the cell gave no detectable response when the pattern was shifted a little further towards the periphery. The extent of the receptive fields of S and R cells was determined by the use of the preferred stimuli, i.e., changing size and rotating stimuli. The subtending angle of the stimuli was taken to be as small as possible, and the position of the center of the stimuli, instead of the edge, was defined as a border. Using these methods, the field size of the cells for which si- multaneous stimulation of a large part of the receptive field is required for activation may be somewhat underestimated. The many receptive fields thus determined included the fovea1 region and extended into the ipsilateral visual field. As shown in the scatter diagram in Figure 2, there was a great variety in the size of the receptive fields, with no simple correlation between the size of the receptive field and the eccentricity. The average square roots of the receptive-field areas of D, S, and R cells were 4 1.4”, 40.9”, and 33.4”, respectively. There was a tendency for succes- sively recorded cells to have similar sizes and locations of the receptive fields. However, no simple retinotopic organization has been noted in the DSR region.
Properties common to the cells of the DSR region were that most responded strongly to monocular stimuli presented to either eye and had similar receptive fields in both eyes. For several cells, binocular stimuli were given with various values of the static disparity, but a large change in the response magnitude was not observed. The exceptions were two cells that responded only to a change in binocular disparity (described in a later section).
D cells. About half of the cells of the DSR region (2341422,
148 Saito et al. Vol. 6, No. 1, Jan. 1986
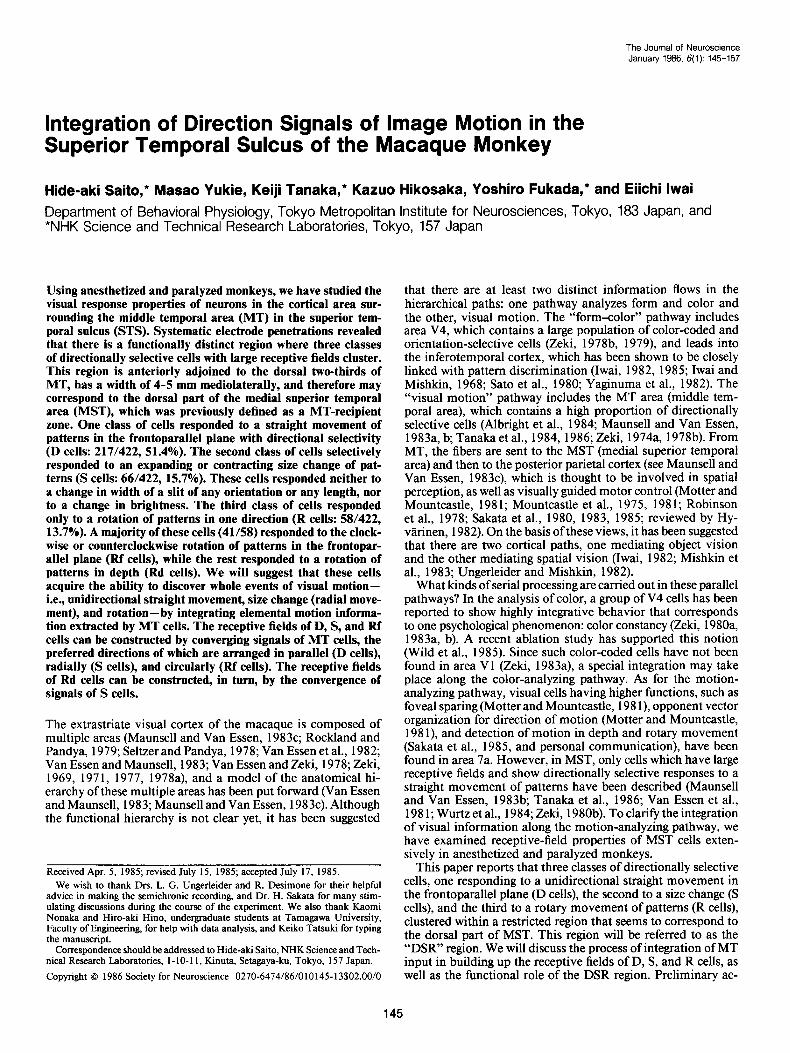
Figure 3. Position invariance of di- rectional selectivity within the recep- tive field of a D cell. Responses of the cell to a 1” x lo” slit moving back and forth (shown by a pair of opposing arrows) at 15Vsec along two orthog- r------------
onal axes within four different regions of the receptive field. Broken line, The receptive field. Its size and eccentric- ity were 40” x 50” and 25”, respec- tively. The period of movement is in- -! n-n -&
dicated bv a line beneath the baseline 7 Q- of the PcTHs. At any region within the large receptive field, the cell main- tained the same directional selectiv- ity. The preferred direction was lo:30 o’clock. This cell responded to a movement of a small slit (1” x l”), as well as to that of a large-field dot pat- tern (70” x 55’; dot diameter, 0.7”; dot separation, 23, thus being classified as the Nonselective type.
55.4%) responded to a unidirectional straight movement of pat- terns in the frontoparallel plane. The great majority of these showed clear selectivity for the direction of motion, that is, an individual cell gave the strongest response to the movement of patterns in a particular direction (preferred direction), but only a feeble or no response (less than 10% of the responses to the preferred direction) to the movement in the opposite direction (null direction). The preferred direction was not changed by the reversal of the luminance contrast of patterns (white or black), similar to the directionally selective cells of MT (Zeki, 1974a). We classified these cells as D cells (2 17/422, 5 1.4%).
D cells in this region were insensitive to the “shape” of the pattern, but exhibited individual preference for the “extent” of the pattern. The preference was evaluated by calculating the ratio of the magnitude of the response evoked by the wide-field dot pattern (70” x 55”; dot diameter, 0.7”; dot separation, 2”) to that evoked by the optimal slit (for details, see Tanaka et al., 1986). Although the distribution was continuous among the cells, those with a ratio of less than 0.5 were classified as Figure type; those having a larger value than 1.5 were classified as Field type; and intermediate cells were classified as Nonselective type, in order to facilitate later discussion of the functional implication of the variety. The frequency of occurrence of Fig- ure, Field, and Nonselective types thus classified was 2:2:3.
As all three groups of D cells had very large receptive fields on average, we wanted to know whether they showed a consis- tent directional selectivity over the whole receptive field. This could be tested for the cells of the Figure type and Nonselective type, but not for those of the Field type because they did not respond significantly to a local movement. An example of the behavior of a Nonselective-type D cell is shown in Figure 3. This figure demonstrates that the cell gave directionally selective responses even when the movement of a slit was confined within a small region of the receptive field, and that the preferred direction was the same at any region within the large receptive field. This fact suggests that the receptive fields of these cells are composed of many compartments, which have similar re- sponse properties.
Though the majority of D cells of Field and Nonselective types responded strongly to any of the dot patterns used in this experiment (dot diameters: 0.7”-4”), it was noted that some cells showed a preference for patterns composed of large dots (2”-4” in diameter).
D L c e I- 0, --, - Is
S cells. Many of the cells that did not respond at all to uni- directional straight movements of patterns in the frontoparallel plane responded to the straight movements of patterns in depth. Further, it was found that, except for two cells, monocular stim- ulation activated them as strongly as binocular stimulation. This indicates that a trigger feature of the responses may not be a change in binocular disparity. We therefore examined the re- sponsiveness of these cells to one of the important monocular cues of motion in depth, i.e., size change of patterns, and found that all of them responded vigorously to this stimulus. These cells were named S cells. Since D cells also responded vigorously to size changes when one of the moving edges passed through the receptive field, the “direction reversal test” was performed to ascertain the identification of S cells. A size-change stimulus was presented in various positions relative to the center of the receptive field. D cells responded to expansion at some position and to contraction at another position. In contrast, S cells only responded to expansion or contraction.
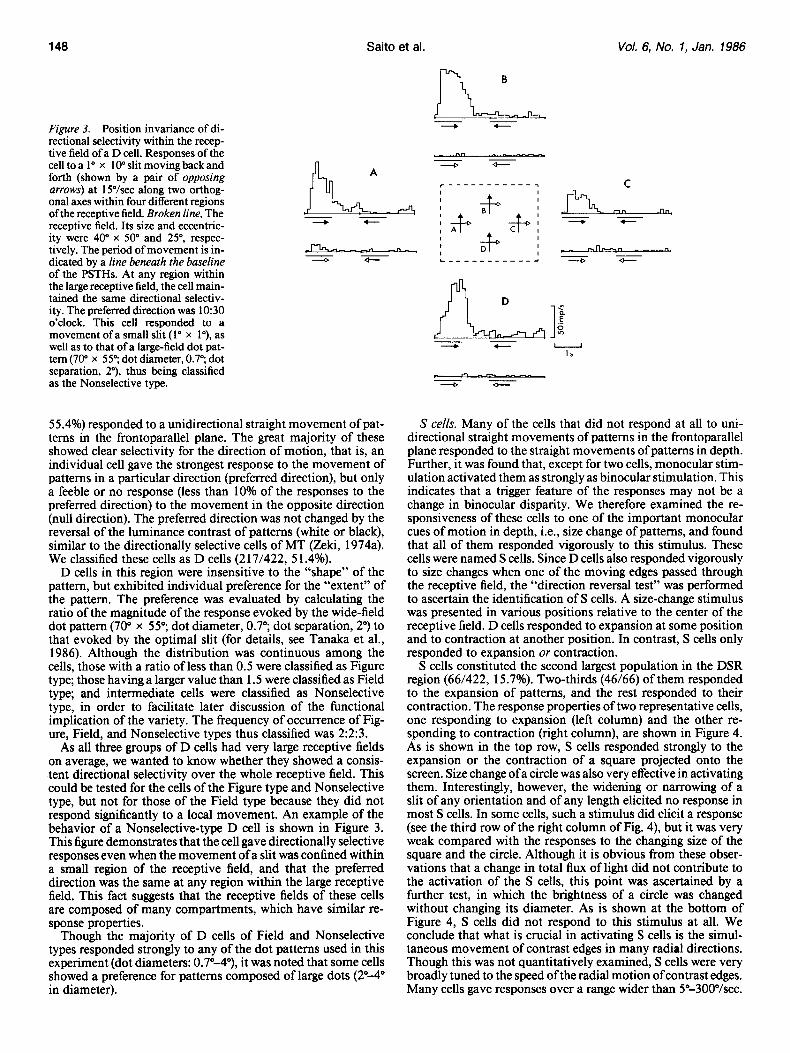
S cells constituted the second largest population in the DSR region (66/422, 15.7%). Two-thirds (46/66) of them responded to the expansion of patterns, and the rest responded to their contraction. The response properties of two representative cells, one responding to expansion (left column) and the other re- sponding to contraction (right column), are shown in Figure 4. As is shown in the top row, S cells responded strongly to the expansion or the contraction of a square projected onto the screen. Size change of a circle was also very effective in activating them. Interestingly, however, the widening or narrowing of a slit of any orientation and of any length elicited no response in most S cells. In some cells, such a stimulus did elicit a response (see the third row of the right column of Fig. 4), but it was very weak compared with the responses to the changing size of the square and the circle. Although it is obvious from these obser- vations that a change in total flux of light did not contribute to the activation of the S cells, this point was ascertained by a further test, in which the brightness of a circle was changed without changing its diameter. As is shown at the bottom of Figure 4, S cells did not respond to this stimulus at all. We conclude that what is crucial in activating S cells is the simul- taneous movement of contrast edges in many radial directions. Though this was not quantitatively examined, S cells were very broadly tuned to the speed of the radial motion ofcontrast edges. Many cells gave responses over a range wider than 5”-300Vsec.
Integration of Motion Cues in Macaque STS 149 The Journal of Neuroscience
Figure 4. Response properties of S cells. Left column, Cell responding to expanding stimulus size. Size and eccentricity of the receptive field, 27” and 30“, respectively. Right column, Cell responding to contracting stimulus size. Size and eccentricity of the receptive field, 45” and 299 respectively. Middle two truces, The widening or narrowing of a slit elicited a weak or no response. Changing brightness (3 log unit) of a circle of constant size was not effective in activating them, either (bottom PSTHs). Black arrows in the upper three PSTHs, Expansion; white arrows, contraction. For the bottom PSTHs, brightness changes are indicated by ramped lines.
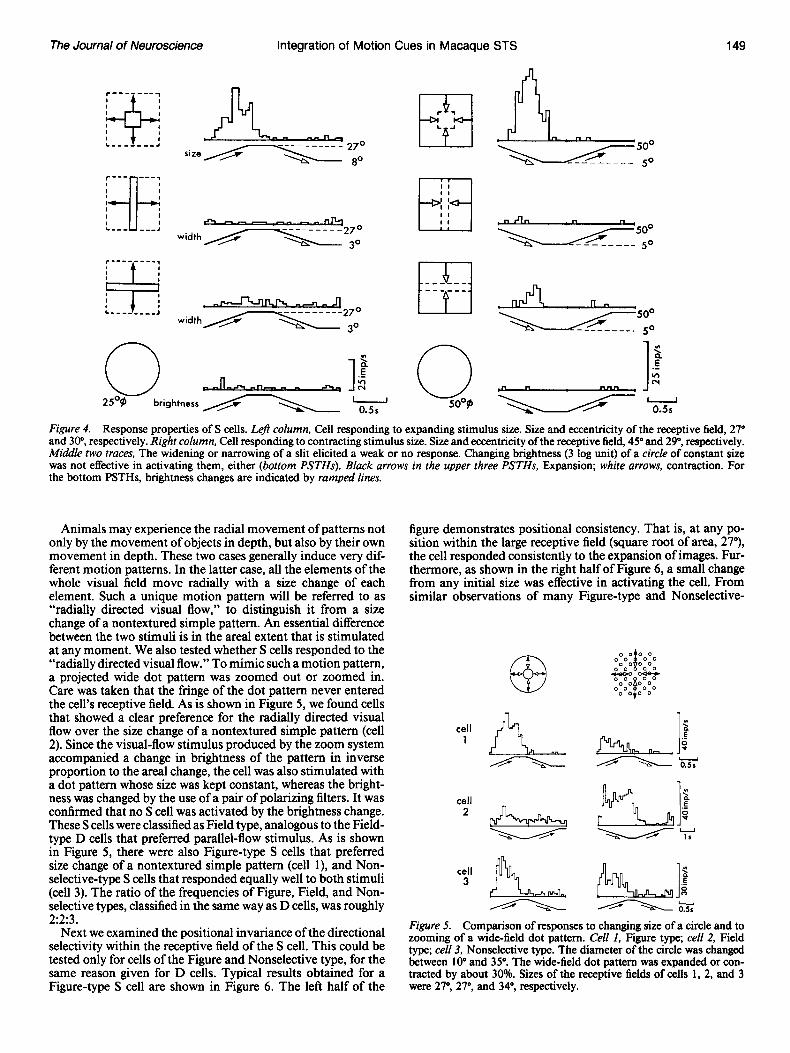
Animals may experience the radial movement of patterns not only by the movement of objects in depth, but also by their own movement in depth. These two cases generally induce very dif- ferent motion patterns. In the latter case, all the elements of the whole visual field move radially with a size change of each element. Such a unique motion pattern will be referred to as “radially directed visual flow,” to distinguish it from a size change of a nontextured simple pattern. An essential difference between the two stimuli is in the area1 extent that is stimulated at any moment. We also tested whether S cells responded to the “radially directed visual flow.” To mimic such a motion pattern, a projected wide dot pattern was zoomed out or zoomed in. Care was taken that the fringe of the dot pattern never entered the cell’s receptive field. As is shown in Figure 5, we found cells that showed a clear preference for the radially directed visual flow over the size change of a nontextured simple pattern (cell 2). Since the visual-flow stimulus produced by the zoom system accompanied a change in brightness of the pattern in inverse proportion to the area1 change, the cell was also stimulated with a dot pattern whose size was kept constant, whereas the bright- ness was changed by the use of a pair of polarizing filters. It was confirmed that no S cell was activated by the brightness change. These S cells were classified as Field type, analogous to the Field- type D cells that preferred parallel-flow stimulus. As is shown in Figure 5, there were also Figure-type S cells that preferred size change of a nontextured simple pattern (cell l), and Non- selective-type S cells that responded equally well to both stimuli (cell 3). The ratio of the frequencies of Figure, Field, and Non- selective types, classified in the same way as D cells, was roughly 2:2:3.
Next we examined the positional invariance of the directional selectivity within the receptive field of the S cell. This could be tested only for cells of the Figure and Nonselective type, for the same reason given for D cells. Typical results obtained for a Figure-type S cell are shown in Figure 6. The left half of the
figure demonstrates positional consistency. That is, at any po- sition within the large receptive field (square root of area, 27“), the cell responded consistently to the expansion of images. Fur- thermore, as shown in the right half of Figure 6, a small change from any initial size was effective in activating the cell. From similar observations of many Figure-type and Nonselective-
@
cell 1
2!3&&
.---- b
cell 3
JY!!L&%
,’ b
Figure 5. Comparison of responses to changing size of a circle and to zooming of a wide-field dot pattern. CelI I, Figure type; cell 2, Field type; cell 3, Nonselective type. The diameter of the circle was changed between 10” and 35”. The wide-field dot pattern was expanded or con- tracted by about 30%. Sizes of the receptive fields of cells 1, 2, and 3 were 27”, 27”, and 34”, respectively.

150 Saito et al. Vol. 6, No. 1, Jan. 1986
Figure 6. Consistency of selectivity of the S cell. Left, At any region within the receptive field (size, 277 eccen- tricity, 293, the cell responded con- sistently to the expansion of a circle. Right, A small change from any initial size was effective in activating the cell. Black arrows, Expansion; white ar- rows, contraction.
P-0 IO0
type S cells, we conclude that these cells have the ability to respond to a small size change (1” or less) consistently over their wide receptive fields.
In MT, we encountered a small number of cells (1 O/463) that responded to size change. However, they had small receptive fields (average of the square root of area, 18.6”) and the majority responded strongly to a change in the width of a slit of a par- ticular orientation (oriented size cells).
R-cells. The last of the three main classes are R cells, which responded only to rotations of patterns in one direction (58/ 422, 13.7%). Many of them (41/58) responded to rotations of patterns in the frontoparallel plane (Rf cells); some of these responded to clockwise rotation and the others responded to counterclockwise rotation. An example of Rf cells is given in Figure 7. Frontoparallel movement of the textured pattern elic- ited no excitation in these cells (or, rather, elicited inhibition in some cells, as seen in Fig. 7). In contrast, their sensitivity to the rotation was so high that even a rotation as small as 3” elicited strong excitations (see the bottom PSTHs of the right column, Fig. 8).
All the R cells encountered in the present study gave vigorous responses to a rotation of the textured wide pattern. As rotation-
Figure 7. An example of the Rf cell. The cell responded vigorously to a counterclockwise rotation of a pattern textured with black-and-white small rectangles (0.5” x 1” to 1” x 4”). Straight movements of the same pattern in any direction were not effective in activating the cell. A pair of opposing arrows beneath the PSTHs indicates the reversal of the direction of pattern movements. Size of the receptive field, 63”; eccen- tricity, 16”.
,/- -., / \ : \ \ 0 \ \ \ : ‘.- -.’
22 -+zA9
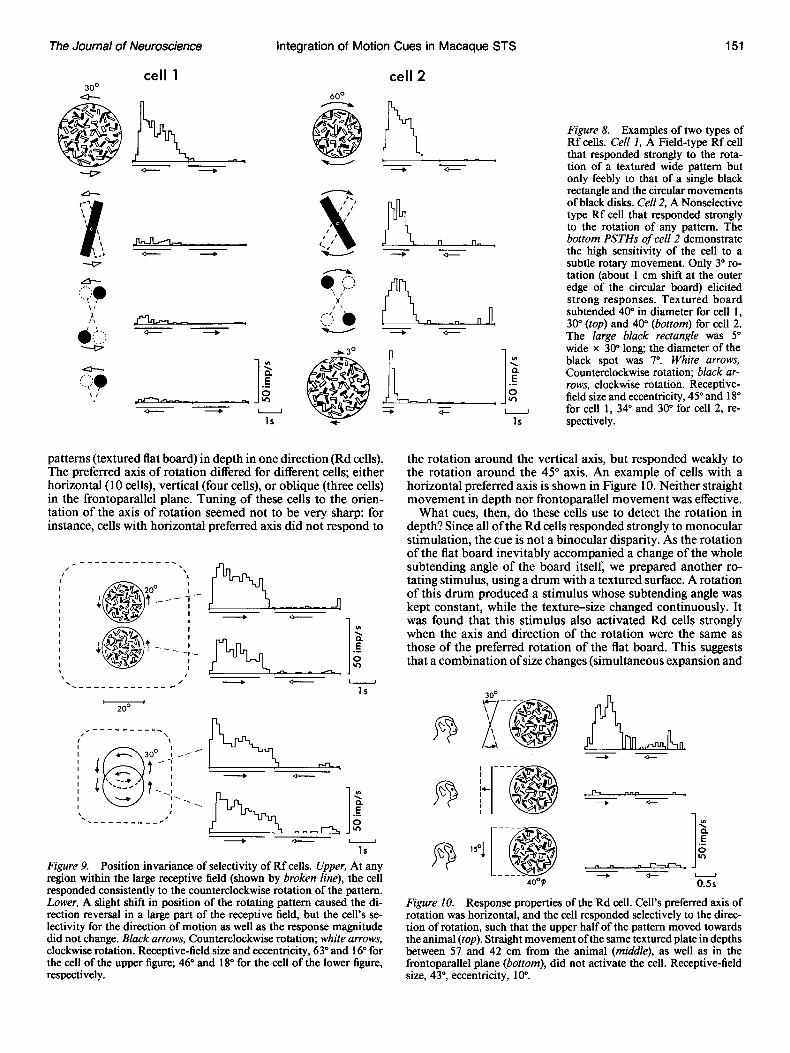
L sensitive cells in area 7a were shown to respond to a rotation of a nontextured simple pattern such as a slit (Sakata et al., 1984, 1985, and personal communication), we tested whether the R cells in the DSR region were also sensitive to such stimuli. Except for one cell, all the R cells showed very weak responses to such stimuli, thus qualifying as Field type. An example of such cells is shown in the left column of Figure 8 (cell 1). In many Field-type R cells with a large receptive field (the square root of area exceeded 40”), the response amplitude increased with an increase in the area of the textured pattern, up to 20” 30” in diameter; but a further increase in area did not strengthen the responses. Thus, signal summation seems to occur within an area that is a little narrower than the whole receptive field in these cells.
Responses of the cell that showed equally vigorous responses to the rotation of a nontextured simple pattern are illustrated in the right column of Figure 8 (cell 2). This cell was classified as a Nonselective type. We did not encounter any Figure-type R cells in the present study. Though not systematically exam- ined, speed tunings of Rf cells seemed to be very broad, with a range as wide as 3”-360Vsec of the rotation.
Similar to D and S cells, Rf cells’ directional selectivity was firmly maintained within their receptive field. As shown in the upper half of Figure 9, Rf cells responded to the same direction of rotation in the different regions of the receptive field. The lower half of Figure 9 illustrates Rf cell behavior when the center of the rotating pattern was shifted only a little. As is shown diagrammatically in the inset, such a shift of the rotating pattern inevitably caused a direction reversal in a large part of the stim- ulated area. The cell overcame this locally conflicting stimulus condition and extracted the whole event of motion, i.e., the “counterclockwise” rotation in the case of this cell.
Rf cells responded fairly well, though not maximally, to a rotating pattern when its presentation was limited to a diagonal pair of quadrants (the cross-point of the quadrants was placed at the center of the rotation) by attaching a mask to the screen. This raised the possibility that Rf cells would detect a kind of shearing motion rather than a rotation. However, Rf cells re- sponded similarly to the stimuli presented to any pair of diag- onal quadrants, l-3 and 2-4 quadrants, for example, and re- sponded maximally when the stimuli were presented to all four quadrants. These facts strongly support the idea that the most effective trigger feature of these cells is rotation. Like D and S cells, Rf cells were insensitive to a “shape” of the component of a texture pattern. They responded indifferently to rotations of a dot pattern, a striped pattern, and irregularly textured pat- terns.
The rest of the R cells (17 cells) responded to the rotation of
The Journal of Neuroscience Integration of Motion Cues in Macaque STS 151
cell 1 cell 2 300
patterns (textured flat board) in depth in one direction (Rd cells). The preferred axis of rotation differed for different cells; either horizontal (10 cells), vertical (four cells), or oblique (three cells) in the frontoparallel plane. Tuning of these cells to the orien- tation of the axis of rotation seemed not to be very sharp: for instance, cells with horizontal preferred axis did not respond to
..-----_-__ --- - IS
zoo .
- - - IS
Figure 9. Position invariance of selectivity of Rf cells. Upper, At any region within the large receptive field (shown by broken line), the cell responded consistently to the counterclockwise rotation of the pattern. Lower, A slight shift in position of the rotating pattern caused the di- rection reversal in a large part of the receptive field, but the cell’s se- lectivity for the direction of motion as well as the response magnitude did not change. Black arrows, Counterclockwise rotation; white arrows, clockwise rotation. Receptive-field size and eccentricity, 63” and 16” for the cell of the upper figure; 46” and 18” for the cell of the lower figure, respectively.
Figure 8. Examples of two types of Rf cells. CelI 1, A Field-type Rf cell that responded strongly to the rota- tion of a textured wide pattern but only feebly to that of a single black rectangle and the circular movements of black disks. Cell 2, A Nonselective type Rf cell that responded strongly to the rotation of any pattern. The bottom PSTHs of cell 2 demonstrate the high sensitivity of the cell to a subtle rotary movement. Only 3” ro- tation (about 1 cm shift at the outer edge of the circular board) elicited strong responses. Textured board subtended 40” in diameter for cell 1, 30” (top) and 40” (bottom) for cell 2. The large black rectangle was 5” wide x 30” long; the diameter of the black spot was I”. White arrows, Counterclockwise rotation; black ar- rows, clockwise rotation. Receptive- field size and eccentricity, 45” and 18” for cell 1, 34” and 30” for cell 2, re- spectively.
the rotation around the vertical axis, but responded weakly to the rotation around the 45” axis. An example of cells with a horizontal preferred axis is shown in Figure 10. Neither straight movement in depth nor frontoparallel movement was effective.
What cues, then, do these cells use to detect the rotation in depth? Since all of the Rd cells responded strongly to monocular stimulation, the cue is not a binocular disparity. As the rotation of the flat board inevitably accompanied a change of the whole subtending angle of the board itself, we prepared another ro- tating stimulus, using a drum with a textured surface. A rotation of this drum produced a stimulus whose subtending angle was kept constant, while the texture-size changed continuously. It was found that this stimulus also activated Rd cells strongly when the axis and direction of the rotation were the same as those of the preferred rotation of the flat board. This suggests that a combination of size changes (simultaneous expansion and
1 c E i =Y+---- -T=- I 0.5s
Figure IO. Response properties of the Rd cell. Cell’s preferred axis of rotation was horizontal, and the cell responded selectively to the direc- tion of rotation, such that the upper half of the pattern moved towards the animal (top). Straight movement of the same textured plate in depths between 57 and 42 cm from the animal (middle), as well as in the frontoparallel plane (bottom), did not activate the cell. Receptive-field size, 43”, eccentricity, 10”.

Saito et al. Vol. 6, No. 1, Jan. 1986
specifically concerned with analysis of visual motion. The re- maining cells (56, 13.3%) were hardly activated by any stimulus (including conventional auditory and somesthetic stimuli) used in the present study.
The site and extent of the DSR region
Figure II. Reconstruction of penetrations. Tracks of systematic pen- etrations of electrodes at 1 mm intervals at two levels (indicated by lines marked A and B in the fop-left drawing) in the right hemisphere are reconstructed on the horizontal sections. The tracks ran almost straight and in parallel and passed through the anterior bank of the STS obliquely. Right column, Tracks are enlarged, and recorded positions and cell types are indicated. D, D cell; S, S cell; R1; Rf cell; Rd. Rd cell; pD, pandirectional cell; bD, bidirectional cell; X, direction-selective cell for a real object; o, ON-cell; not marked, cells for which effective stimuli were not found.
To explore the extent of the DSR region, systematic electrode penetrations in the horizontal planes were made in four hemi- spheres of three animals. In each hemisphere, 17-27 penetra- tions were made, shifting the track by l-2 mm either horizon- tally or vertically. Typical tracks at a vertical level that intersects the middle of MT are reconstructed in Figure 11. Posteriorly situated penetrations (tracks Al-A3, Bl-B3) passed through MT at the posterior bank of the STS and then entered the anterior bank, where D, S, and R cells clustered. In the present penetrations, which passed obliquely through the anterior bank of the STS cortex, there was a tendency for each class of cells (D, S, Rf, and Rd cells) to occur in a grouped fashion (for example, see tracks Bl-B3), suggesting that a columnar organi- zation also exists in this cortical region. When an electrode entered a more lateral part of the anterior bank of the STS (tracks A4 and 5, B4 and 5), most of the sampled cells were unrespon- sive to any stimulus we used. In several penetrations that entered the fundus of the STS at a similar dorsoventral level to that shown in Figure 11, D cells were continuously sampled, but the size of the receptive field increased suddenly when the electrode tip passed through some point. This change in field size was accompanied by a mixture of S and R cells, indicating that the DSR region and MT are contiguous.
contraction in the different parts of the receptive field) may be a trigger feature for their activation.
Other cells. D, S, and R cells constituted 80.8% of the cells encountered in the DSR region. As shown in Table 1, there was a small number of other types of cells. Most of these responded to a straight movement of a slit in the frontoparallel plane (17 cells, 4.0%). Among them, cells whose ratio of magnitudes of responses evoked by the movement directed opposite to the best to magnitude of the responses evoked by movement of the best direction fell between 0.1 and 0.5, were classified as direc- tionally biased (three cells). Four other cells (pandirectional cells) responded to any direction of movement with a ratio larger than 0.5, and five cells (bidirectional cells) responded to two mutually opposing directions. At present, we think that these were im- perfectly constructed D cells. The properties of the remaining five cells (jerky cells) were somewhat unique. Their firing fre- quency was modulated only slightly by a smooth movement of the slit; however, they gave a burst of discharges when the mov- ing slit was suddenly stopped and also when it started to move again. This suggests that negative as well as positive acceleration of the movement of patterns is crucial in activating them.
We found two cells that responded only to a combination of movement to the left within the receptive field of one eye with movement to the right within the receptive field of the other eye. These cells can extract a change in binocular disparity (dy- namic disparity information). There were only six cells that did not require motion for activation: ON-cells and OFF-cells, which responded to the onset and the cessation of a stationary pattern, respectively. This supports the view that the DSR region is
All the anteromedially directed penetrations were recon- structed on the horizontal sections of the brain. Each single oblique trace of the electrode through the cortical depth was projected onto layer IV, and its center was represented as the recording site. Taking the fundus of the STS as a straight ref- erence line, an unfolded map of the STS cortex was drawn, and recording sites were plotted on the map by various marks that indicate differences in the composition of recorded cell types. Such maps, drawn for four hemispheres, were aligned for op- timal superimposition of the dorsoventral extent of MT, see Figure 12. It is clear that the recording sites where D, S, and R cells clustered (filled circles) were concentrated within a narrow region adjoining a dorsal part of MT. In all the penetrations located about 1 mm higher than the dorsal margin of MT, pandirectional cells and unresponsive cells dominated. Though the penetrations in the vertical level that corresponded to the most dorsal part of MT were relatively sparse in the present study, it seems that the dorsal boundary of the DSR region lies at a level similar to that of MT. As for the ventral margin of the DSR region, we think that it is located at a level higher than the base of MT by a distance equal to one-third of the dorso- ventral length of MT (the upper broken line). Below this level, the frequency of occurrence of the S cell was greatly reduced, the R cell was not encountered, and D cells occupied more than 70% of the cells encountered. The area with this property con- tinues ventrally to a level corresponding to the ventral boundary of MT (the lower broken line). It seems that this region, situated between the two broken lines, corresponds to a ventral part of MST. The cell types and their populations recorded in this region are listed in Table 1. In the more ventral region, the population of D cells was greatly reduced, and instead, other types of motion-sensitive cells, such as pandirectional and bi- directional cells, dominated, with a small number of cells that were activated by centrifugal or centripetal movements of a spot, or a few cells activated by binocular disparity.
To summarize: The DSR region adjoins the dorsal two-thirds of MT at the fundus of the STS, and has a width of 4-5 mm mediolaterally occupying one-third of the anterior bank of the STS; it thus seems to correspond to the dorsal part of MST.
The Journal of Neuroscience Integration of Motion Cues in Macaque STS 153
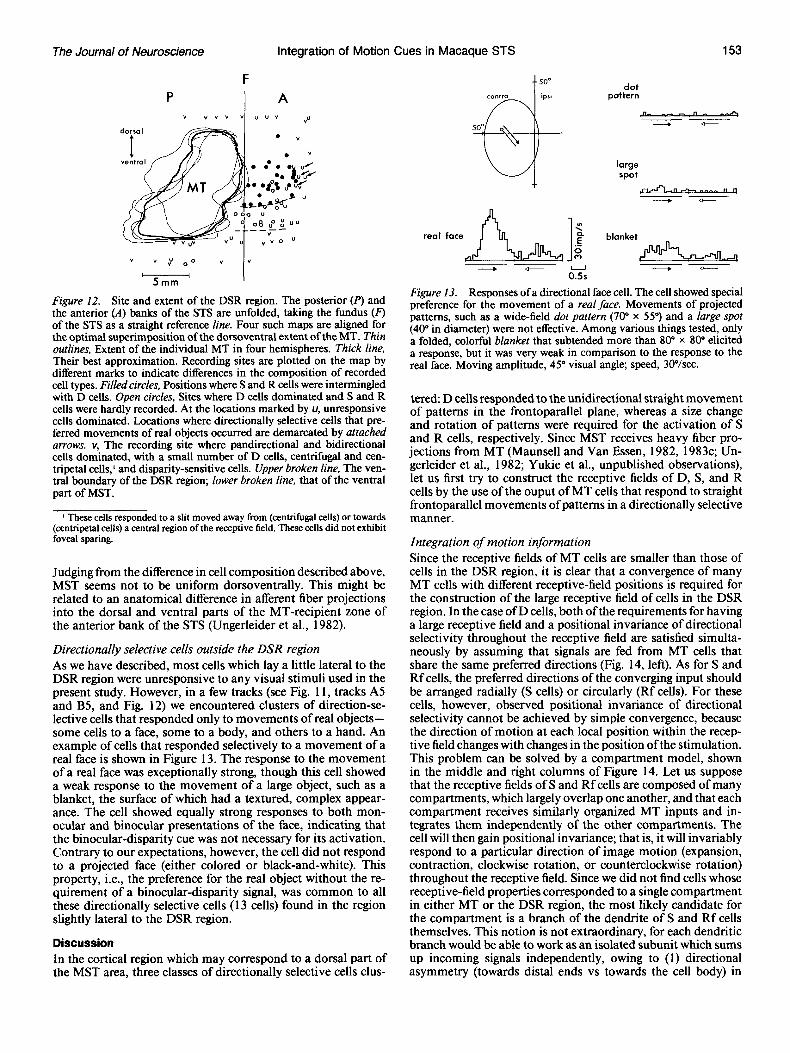
Figure 12. Site and extent of the DSR region. The posterior (P) and the anterior (A) banks of the STS are unfolded, taking the fundus Q of the STS as a straight reference line. Four such maps are aligned for the optimal superim&sition of the dorsoventral extent of the MT. Thin outlines. Extent of the individual MT in four hemispheres. Thick line, Their b&t approximation. Recording sites are plotted on the map by different marks to indicate differences in the composition of recorded cell types. Filled circles, Positions where S and R cells were intermingled with D cells. Open circles, Sites where D cells dominated and S and R cells were hardly recorded. At the locations marked by u, unresponsive cells dominated. Locations where directionally selective cells that pre- ferred movements of real objects occurred are demarcated by attached arrows. v, The recording site where pandirectional and bidirectional cells dominated, with a small number of D cells, centrifugal and cen- tripetal cells,l and disparity-sensitive cells. Upper broken line, The ven- tral boundary of the DSR region; lower broken line, that of the ventral part of MST.
’ These cells responded to a slit moved away from (centrifugal cells) or towards (centripetal cells) a central region of the receptive field. These cells did not exhibit fovea1 sparing.
Judging from the difference in cell composition described above, MST seems not to be uniform dorsoventrally. This might be related to an anatomical difference in afferent fiber projections into the dorsal and ventral parts of the MT-recipient zone of the anterior bank of the STS (Ungerleider et al., 1982).
Directionally selective cells outside the DSR region As we have described, most cells which lay a little lateral to the DSR region were unresponsive to any visual stimuli used in the present study. However, in a few tracks (see Fig. 11, tracks A5 and BS, and Fig. 12) we encountered clusters of direction-se- lective cells that responded only to movements of real objects- some cells to a face, some to a body, and others to a hand. An example of cells that responded selectively to a movement of a real face is shown in Figure 13. The response to the movement of a real face was exceptionally strong, though this cell showed a weak response to the movement of a large object, such as a blanket, the surface of which had a textured, complex appear- ance. The cell showed equally strong responses to both mon- ocular and binocular presentations of the face, indicating that the binocular-disparity cue was not necessary for its activation. Contrary to our expectations, however, the cell did not respond to a projected face (either colored or black-and-white). This property, i.e., the preference for the real object without the re- quirement of a binocular-disparity signal, was common to all these directionally selective cells (13 cells) found in the region slightly lateral to the DSR region.
Discussion In the cortical region which may correspond to a dorsal part of the MST area, three classes of directionally selective cells clus-
dot pattern
large spot
-==z-T
Figure 13. Responses of a directional face cell. The cell showed special preference for the movement of a reuI face. Movements of projected patterns, such as a wide-field dot pattern (70” x 5S0) and a large spot (40” in diameter) were not effective. Among various things tested, only a folded, colorful blanket that subtended more than 80” x 80“ elicited a response, but it was very weak in comparison to the response to the real face. Moving amplitude, 45” visual angle; speed, 3OVsec.
tered: D cells responded to the unidirectional straight movement of patterns in the frontoparallel plane, whereas a size change and rotation of patterns were required for the activation of S and R cells, respectively. Since MST receives heavy fiber pro- jections from MT (Maunsell and Van Essen, 1982, 1983~; Un- gerleider et al., 1982; Yukie et al., unpublished observations), let us first try to construct the receptive fields of D, S, and R cells by the use of the ouput of MT cells that respond to straight frontoparallel movements of patterns in a directionally selective manner.
Integration of motion information Since the receptive fields of MT cells are smaller than those of cells in the DSR region, it is clear that a convergence of many MT cells with different receptive-field positions is required for the construction of the large receptive field of cells in the DSR region. In the case of D cells, both of the requirements for having a large receptive field and a positional invariance of directional selectivity throughout the receptive field are satisfied simulta- neously by assuming that signals are fed from MT cells that share the same preferred directions (Fig. 14, left). As for S and Rf cells, the preferred directions of the converging input should be arranged radially (S cells) or circularly (Rf cells). For these cells, however, observed positional invariance of directional selectivity cannot be achieved by simple convergence, because the direction of motion at each local position within the recep- tive field changes with changes in the position of the stimulation. This problem can be solved by a compartment model, shown in the middle and right columns of Figure 14. Let us suppose that the receptive fields of S and Rf cells are composed of many compartments, which largely overlap one another, and that each compartment receives similarly organized MT inputs and in- tegrates them independently of the other compartments. The cell will then gain positional invariance; that is, it will invariably respond to a particular direction of image motion (expansion, contraction, clockwise rotation, or counterclockwise rotation) throughout the receptive field. Since we did not find cells whose receptive-field properties corresponded to a single compartment in either MT or the DSR region, the most likely candidate for the compartment is a branch of the dendrite of S and Rf cells themselves. This notion is not extraordinary, for each dendritic branch would be able to work as an isolated subunit which sums up incoming signals independently, owing to (1) directional asymmetry (towards distal ends vs towards the cell body) in
154 Saito et al. Vol. 6, No. 1, Jan. 1986
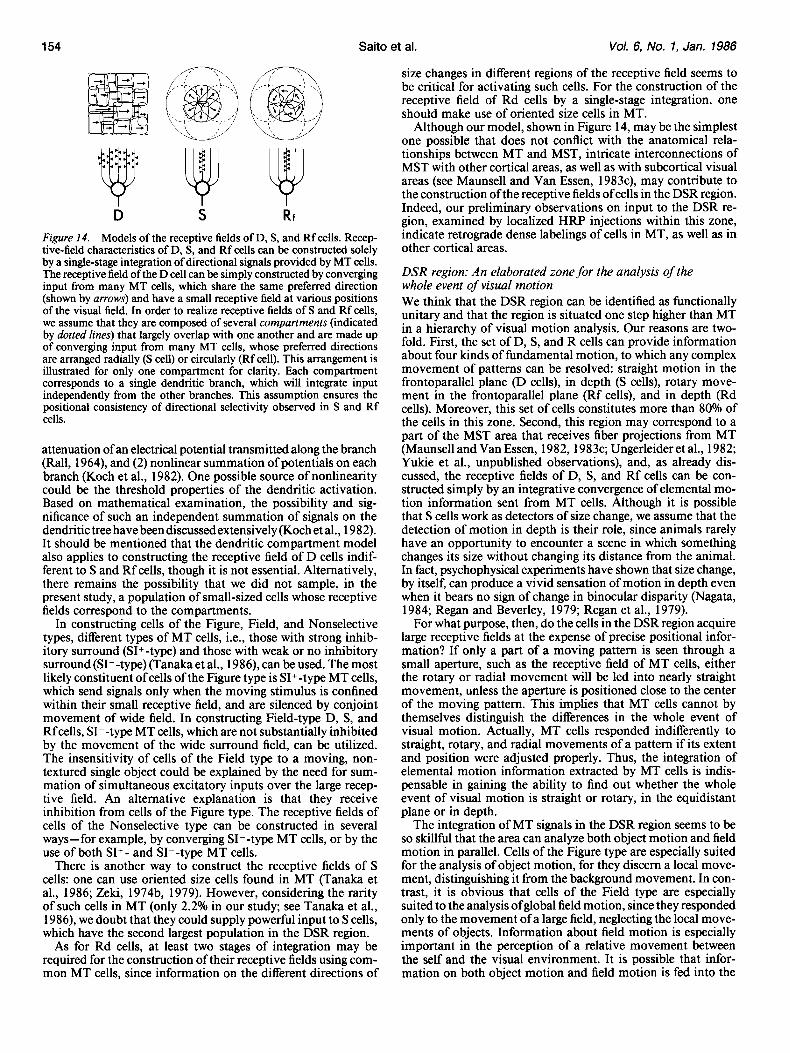
Figure 14. Models of the receptive fields of D, S, and Rf cells. Recep- tive-field characteristics of D, S, and Rf cells can be constructed solely by a single-stage integration of directional signals provided by MT cells. The receptive field of the D cell can be simply constructed by converging input from many MT cells, which share the same preferred direction (shown by arrows) and have a small receptive field at various positions of the visual field. In order to realize receptive fields of S and Rf cells, we assume that they are composed of several compartments (indicated by dotted lines) that largely overlap with one another and are made up of converging input from many MT cells, whose preferred directions are arranged radially (S cell) or circularly (Rf cell). This arrangement is illustrated for only one compartment for clarity. Each compartment corresponds to a single dendritic branch, which will integrate input independently from the other branches. This assumption ensures the positional consistency of directional selectivity observed in S and Rf cells.
attenuation of an electrical potential transmitted along the branch (Rall, 1964), and (2) nonlinear summation of potentials on each branch (Koch et al., 1982). One possible source of nonlinearity could be the threshold properties of the dendritic activation. Based on mathematical examination, the possibility and sig- nificance of such an independent summation of signals on the dendritic tree have been discussed extensively (Koch et al., 1982). It should be mentioned that the dendritic compartment model also applies to constructing the receptive field of D cells indif- ferent to S and Rf cells, though it is not essential. Alternatively, there remains the possibility that we did not sample, in the present study, a population of small-sized cells whose receptive fields correspond to the compartments.
In constructing cells of the Figure, Field, and Nonselective types, different types of MT cells, i.e., those with strong inhib- itory surround @I+-type) and those with weak or no inhibitory surround (SI- -type) (Tanaka et al., 1986), can be used. The most likely constituent of cells of the Figure type is SI+-type MT cells, which send signals only when the moving stimulus is confined within their small receptive field, and are silenced by conjoint movement of wide field. In constructing Field-type D, S, and Rfcells, SI--type MT cells, which are not substantially inhibited by the movement of the wide surround field, can be utilized. The insensitivity of cells of the Field type to a moving, non- textured single object could be explained by the need for sum- mation of simultaneous excitatory inputs over the large recep- tive field. An alternative explanation is that they receive inhibition from cells of the Figure type. The receptive fields of cells of the Nonselective type can be constructed in several ways-for example, by converging SI--type MT cells, or by the use of both SI+- and SI--type MT cells.
There is another way to construct the receptive fields of S cells: one can use oriented size cells found in MT (Tanaka et al., 1986; Z&i, 1974b, 1979). However, considering the rarity of such cells in MT (only 2.2% in our study; see Tanaka et al., 1986), we doubt that they could supply powerful input to S cells, which have the second largest population in the DSR region.
As for Rd cells, at least two stages of integration may be required for the construction of their receptive fields using com- mon MT cells, since information on the different directions of
size changes in different regions of the receptive field seems to be critical for activating such cells. For the construction of the receptive field of Rd cells by a single-stage integration, one should make use of oriented size cells in MT.
Although our model, shown in Figure 14, may be the simplest one possible that does not conflict with the anatomical rela- tionships between MT and MST, intricate interconnections of MST with other cortical areas, as well as with subcortical visual areas (see Maunsell and Van Essen, 1983c), may contribute to the construction of the receptive fields of cells in the DSR region. Indeed, our preliminary observations on input to the DSR re- gion, examined by localized HRP injections within this zone, indicate retrograde dense labelings of cells in MT, as well as in other cortical areas.
DSR region: An elaborated zone for the analysis of the whole event of visual motion We think that the DSR region can be identified as functionally unitary and that the region is situated one step higher than MT in a hierarchy of visual motion analysis. Our reasons are two- fold. First, the set of D, S, and R cells can provide information about four kinds of fundamental motion, to which any complex movement of patterns can be resolved: straight motion in the frontoparallel plane (D cells), in depth (S cells), rotary move- ment in the frontoparallel plane (Rf cells), and in depth (Rd cells). Moreover, this set of cells constitutes more than 80% of the cells in this zone. Second, this region may correspond to a part of the MST area that receives fiber projections from MT (Maunsell and Van Essen, 1982, 1983~; Ungerleider et al., 1982; Yukie et al., unpublished observations), and, as already dis- cussed, the receptive fields of D, S, and Rf cells can be con- structed simply by an integrative convergence of elemental mo- tion information sent from MT cells. Although it is possible that S cells work as detectors of size change, we assume that the detection of motion in depth is their role, since animals rarely have an opportunity to encounter a scene in which something changes its size without changing its distance from the animal. In fact, psychophysical experiments have shown that size change, by itself, can produce a vivid sensation of motion in depth even when it bears no sign of change in binocular disparity (Nagata, 1984; Regan and Beverley, 1979; Regan et al., 1979).
For what purpose, then, do the cells in the DSR region acquire large receptive fields at the expense of precise positional infor- mation? If only a part of a moving pattern is seen through a small aperture, such as the receptive field of MT cells, either the rotary or radial movement will be led into nearly straight movement, unless the aperture is positioned close to the center of the moving pattern. This implies that MT cells cannot by themselves distinguish the differences in the whole event of visual motion. Actually, MT cells responded indifferently to straight, rotary, and radial movements of a pattern if its extent and position were adjusted properly. Thus, the integration of elemental motion information extracted by MT cells is indis- pensable in gaining the ability to find out whether the whole event of visual motion is straight or rotary, in the equidistant plane or in depth.
The integration of MT signals in the DSR region seems to be so skillful that the area can analyze both object motion and field motion in parallel. Cells of the Figure type are especially suited for the analysis of object motion, for they discern a local move- ment, distinguishing it from the background movement. In con- trast, it is obvious that cells of the Field type are especially suited to the analysis ofglobal field motion, since they responded only to the movement of a large field, neglecting the local move- ments of objects. Information about field motion is especially important in the perception of a relative movement between the self and the visual environment. It is possible that infor- mation on both object motion and field motion is fed into the
The Journal of Neuroscience Integration of Motion Cues in Macaque STS 155
next stage for further integration. However, it is also possible that each type of information is used within the DSR region for the refinement of the other; that is, the cells of the Field type can serve as elements providing background inhibition for the cells of the Figure type, and, conversely, the cells of the Figure type can serve as elements that provide the Field type with inhibition causing the neglect of the presence of a local move- ment.
The uneven population of D, S, Rf, and Rd cells (roughly, 13:4:2: 1) in the DSR region deserves some comment. Let us consider the problem from the viewpoint of the analysis of field motion. The usual source of field motion is the animal’s self- movement (Gibson, 1968) and the most frequent types of self- movement may be eye and head movements, which induce the primarily straight movements of patterns in the equidistant plane. The next most frequent may be motion in depth caused by self- locomotion (running on the ground, jumping from tree to tree, etc.). Rotary field motion, either in an equidistant plane or in depth, seems to be less frequent in ordinary situations. There- fore, the dominance of D cells might be related to a relatively frequent occurrence of straight movements in the equidistant plane. From the standpoint of analysis of object motion, the meaning of the imbalance of the populations is not clear at present.
As has been widely recognized, the animal can use at least two different motion signals to detect motion in depth. One is changing binocular disparity and the other is size change. The former signal (mutually opposing movement of patterns for two eyes), however, can be obtained only for moving objects that approach or recede from the head of the animal. In contrast, the latter signal is not restricted to a particular direction and is therefore easily obtained throughout the whole visual field. The importance of radially directed visual flow, induced by self- movement in depth, in the perception of motion in depth has been emphasized for a long time in the field of psychology (Gibson, 1950, 1957; reviewed by Nakayama, 1985). Moreover, the detectors of size changes can be easily constructed by a single-stage integration of simple direction signals extracted in MT, as discussed already. These points might explain why the dynamic-disparity cells were so rare in the DSR region. In the cat’s Clare-Bishop area, which is assumed to correspond to the macaque MT area anatomically, there are many motion-in- depth cells (Toyama and Kozasa, 1982) in addition to direc- tionally selective cells that respond to straight motion in the frontoparallel plane (Spear and Baumann, 1975; Toyama and Kozasa, 1982). In this respect, the Clare-Bishop area resembles the DSR region. However, there is a distinct difference in the motion-in-depth cells of these two areas: many of the motion- in-depth cells of the Clare-Bishop area respond both to the changing-size stimulus and to changing binocular disparity (Toyama and Kozasa, 1982). The functional meaning of this difference between the strategy of the Clare-Bishop area of the cat and the DSR region of the monkey in the detection of mo- tion-in-depth is not clear at present.
Further integration beyond the DSR region It has been reported that in area 7a of the posterior parietal cortex, to which MST sends fibers (Mesulam et al., 1977; see also Maunsell and Van Essen, 1983~) there are many neurons that show directionally selective responses to a moving visual pattern. Among them, the following four classes of cells are of special interest: cells responding to the straight movement of patterns in the equidistant plane (Kawano and Sasaki, 1984; Motter and Mountcastle, 198 1; Robinson et al., 1978; Sakata et al., 1983, and personal communication), those responding to the straight movement of patterns in depth (Sakata et al., 1985, and personal communication), and those responding to rotary movement in the equidistant plane, or in depth (Sakata et al.,
1984, 1985, and personal communication). It is plausible that the source of the visual input to such parietal neurons is the cells of the DSR region. In view of a similarity in the visual- response properties ofcells in the two areas, the major processing performed in the posterior parietal cortex seems to be something other than a refinement of visual properties. Instead, as indi- cated by the fact that a significant population of parietal visual cells responded to eye movements (Kawano and Sasaki, 1984; Motter and Mountcastle, 198 1; Mountcastle et al., 1975; Rob- inson et al., 1978; Sakata et al., 1980, 1983), bodily movements (Leinonen, 1980; Robinson et al., 1978), somesthetic stimuli (Leinonen, 1980; Robinson et al., 1978) and vestibular stimuli (Kawano and Sasaki, 1984; Sakata et al., 1984, 1985, and per- sonal communication), and that the responses of the parietal visual neurons were modulated by selective visual attention (Andersen and Mountcastle, 1983; Bushnell et al., 198 1; Mount- castle et al., 198 I), an integration ofvisual signals with nonvisual signals may be the role of this area. Such integration is indis- pensable for the perception of the relationships between the movements of the self and the visual environment, as well as for visually guided motor control. A recent study has shown that eye-movement signals already converge onto some MST cells (Wurtz et al., 1984). Therefore, it is possible that nonvisual signals have some influence on the activities of cells in the DSR region, though we did not examine this point in the present study.
As to the rotation-sensitive cells recorded by Sakata et al. in area 7a (1984, 1985, and personal communication) it should be remarked that the most of them responded to the rotary move- ment of a nontextured simple pattern, such as a single slit. Because of this property, it seems that those cells can be classified as the Figure type or Nonselective type, according to our ter- minology. With the exception of only one cell, however, R cells observed in the DSR region preferred field movement and showed a feeble or no response to the rotation of a spot. At present, there are two possibilities with regard to this difference: that is due to a difference in experimental design (behaving animals were used in Sakata’s experiments), and that the ro- tation-selective cells found in the two areas were different sub- sets of cells, which integrate motion information differently. Because the recording sites of Sakata et al. (1985, and personal communication) were in the anterior bank of the STS, a little dorsal, but very close to the area we have examined in the present study, it is possible that these areas overlap partially.
It has been reported, regarding area 7a, that there are many visual cells whose receptive fields are large but that do not include the fovea1 region (fovea1 sparing), and also that there is a unique class of directionally selective cells that respond to the movement of a spot away from or towards the fixation point throughout a large, bilateral receptive field (opponent vector organization) (Motter and Mountcastle, 198 1). Since cells with similar properties were not found in the DSR region (although we recorded, in a region more ventral to the DSR, a few cells that responded to either centrifugal or centripetal movement of patterns), further visual integration may take place in the pos- terior parietal cortex if such parietal receptive fields are con- structed by receiving main inputs from the DSR region. It is also possible that those receptive fields of parietal cells are con- structed from inputs from the other part of the brain.
Outputs of the DSR region may be fed to cortical areas other than the posterior parietal cortex, for the purpose of different kinds of integration. Although the efferent projections from MST have not been extensively examined as yet, a retrograde tracing study has revealed that the frontal eye field is one of the target areas of MST (Barbas and Mesulam, 198 1). However, since the great majority of cells in this area are not directionally selective (Goldberg and Bushnell, 198 1; Mikami et al., 1982; Suzuki and Azuma, 1983) we cannot estimate, at present, how the cells of

156 Saito et al. Vol. 6, No. 1, Jan. 1966
the DSR region contribute to the construction of the receptive fields of cells in the frontal eye field. However, the directionally selective cells that clustered lateral to the DSR region are of special interest with regard to the integration of motion infor- mation with other kinds of visual information. They were strongly activated only when a real object moved in the preferred di- rection. Because they responded strongly to monocular stimu- lation, but were insensitive to any projected patterns, we think that the trigger feature for the activation of these cells is neither binocular disparity nor simple integration of a shape with the frontoparallel movement. One possible explanation is that they integrate information on shape with that on motion, which is a combination of size changes and/or rotations with straight parallel movements. The source of these three types of motion information would be the cells in the DSR region lying just to the side. As for the source of the shape information, there are clusters of cells that responded specifically to faces, either pho- tographed or real, in the polysensory area of the STS cortex (Bruce et al., 1981; Perrett et al., 1982).
It has been shown that there are cells that respond to size change or rotation of patterns in the polysensory area in the STS cortex (Bruce et al., 1981). In addition, it has been briefly reported that there is a cluster of cells in the anterior part of the STS cortex that shows a preference for moving real objects (Jeeves et al., 1983). Quite similar to the cells we have observed, they respond to the motion of a face, body, or hand in a direc- tionally selective manner. The functional relationships, as well as interconnections, between these areas and the DSR region remain to be examined.
References
Albright, T. D., R. Desimone, and C. G. Gross (1984) Columnar organization of directionally selective cells in visual area MT of the macaque. J. Neurophysiol. 51: 16-3 1.
Andersen, R. A., and V. B. Mountcastle (1983) The influence of the angle of gaze upon the excitability of the light-sensitive neurons of the posterior p&eta1 cortex. J. Neurosci. X-532-548.
Barbas. H.. and M.-M. Mesulam (198 1) Organization of afferent input to subdivisions of area 8 in the rhesus monkey. J. Comp. Neural. 200: 407-43 1.
Barlow, H. B., C. Blakemore, and J. D. Pettigrew (1967) The neural mechanism of binocular depth discrimination. J. Physiol. (Lond.) 193: 327-342.
Bishop, P. O., W. Kozak, and G. J. Vakkur (1962) Some quantitative aspects of the cat’s eye: Axis and plane of reference, visual field co- ordinates and optics. J. Physiol. (Lond.) 163: 466-502.
Bruce, C., R. Desimone, and C. G. Gross (198 1) Visual properties of neurons in a polysensory area in superior temporal sulcus of the macaque. J. Neurophysiol. 46: 369-384.
Bushnell, M. C., M. E. Goldberg, and D. L. Robinson (198 1) Behav- ioral enhancement of visual responses in monkey cerebral cortex. I. Modulation in posterior parietal cortex related to selective visual attention. J. NeurophysioK 46: 755-772.
Gallvas. F. (1979) Silver stainina of mvelin bv means of nhvsical development. Ndurol. Res. I: 201-209. - -
_ _
Gibson, J. J. (1950) The Perception of the Visual World, Houghton Mifflin, Boston, MA.
Gibson, J. J. (1957) Optical motions and transformations as stimuli for visual perception. Psychol. Rev. 64: 288-295.
Gibson, J. J. (1968) What gives rise to the perception of motion? Psychol. Rev. 75: 335-346.
Goldberg, M. E., and M. C. Bushnell (198 1) Behavioral enhancement of visual responses in monkey cerebral cortex. II. Modulation in frontal eye fields specifically related to saccades. J. Neurophysiol. 46: 773-787.
Hutchins, B., and J. Wever (1983) A rapid myelin stain for frozen sections; modification of the Heidenhain procedure. J. Neurosci. Methods 7: 289-294.
Hyvlrinen, J. (1982) Posterior parietal lobe of the primate brain. Physiol. Rev. 62: 1060-l 129.
Iwai, E. (1982) A model regarding system of information processing in visual goal-directed behavior of macaque monkeys. In Learning
and Memory, S. Saito and J. L. McGaugh, eds., pp. 39-58, Excerpta Medica, Amsterdam.
Iwai, E. (1985) Neuropsychological basis of pattern vision in macaque monkeys. Vision Res. 25: 425-439.
Iwai, E., and M. Mishkin (1968) Extrastriate visual focus in monkeys: Two visual foci in the temporal lobe of monkeys. In Neurophysiolog- ical Basis of Learning and Behavior, N. Yoshii and N. A. Buchwald, eds., pp. 23-33, Osaka U. P., Osaka.
Jeeves, M. A., A. D. Milner, D. I Perrett, and P. A. J. Smith (1983) Visual cells responsive to direction of movement and stimulus form in the anterior superior temporal sulcus of the macaque monkey. J. Physiol. (Lond.) j41: 8OP.
Kawano. K.. and M. Sasaki ( 1984) Resnonse nronerties of neurons in posterior parietal cortex of monkey during &al-vestibular stimu- lation. II. Optokinetic neurons. J. Neurophysiol. 51: 352-360.
Koch, C., T. Poggio, and V. Terre (1982) Retinal ganglion cells: A functional interpretation ofdendritic morphology. Phil. Trans. R. Sot. Lond. [Biol.] 298: 227-264.
Leinonen, L. (1980) Functional properties of neurons in the posterior part of area 7 in awake monkey. Acta Physiol. Stand. 108: 30 l-308.
Maunsell, J. H. R., and D. C. Van Essen (1982) The connections of the middle temporal visual area in the macaque monkey. Sot. Neu- rosci. Abstr. 8: 8 11.
Maunsell, J. H. R., and D. C. Van Essen (1983a) Functional properties of neurons in middle temporal visual area of the macaque monkey. I. Selectivity for stimulus direction, speed, and orientation. J. Neu- rophysiol. 49: 1127-l 147.
Maunsell, J. H. R., and D. C. Van Essen (1983b) Functional properties of neurons in middle temporal visual area of the macaque monkey. II. Binocular interactions and sensitivity to binocular disparity. J. Neurophysiol. 49: 1148-l 167.
Maunsell, J. H. R., and D. C. Van Essen (1983~) The connections of the middle temporal visual area (MT) and their relationship to a cortical hierarchy in the macaque monkey. J. Neurosci. 3: 2563-2586.
Mesulam, M.-M., G. W. Van Hoesen, D. N. Pandya, and N. Geschwind (1977) Limbic and sensory connections of the inferior lobule (area PG) in the rhesus monkey: A study with a new method for horseradish peroxidase histochemistry. Brain Res. 136: 393-4 14.
Mikami, A., S. Ito, and K. Kubota (1982) Visual response properties of dorsolateral prefrontal neurons during visual fixation task. J. Neu- rophysiol. 47: 593-605.
Mishkin, M., L. G. Ungerleider, and K. A. Macko (1983) Object vision and spatial vision: Two cortical pathways. Trends Neurosci. 6: 4 14- 417.
Motter, B. C., and V. B. Mountcastle (198 1) The functional properties of the light-sensitive neurons of the posterior parietal cortex studied in waking monkeys: Fovea1 sparing and opponent vector organization. J. Neurosci. 1: 3-26.
Mountcastle, V. B., R. A. Andersen, and B. C. Motter (198 1) The influence of attentive fixation upon the excitability of the light-sen- sitive neurons of the posterior parietal cortex. J. Neurosci. I: 12 18- 1235.
Mountcastle, V. B., J. C. Lynch, A. Georgopoulos, H. Sakata, and C. Acuna (1975) Posterior parietal association cortex of the monkey: Command functions for operations within extrapersonal space. J. Neurophysiol. 38: 87 1-908.
Naaata. S. I1 984) How to reinforce nerceution of denth in sinde two- dimensional pictures. Proc. Sot. Inform: Disp. 25:~239-246.-
Nakayama, K. (1985) Biological image motion processing: A review. Vision Res. 25: 625-660.
Perrett, D. I., E. T. Rolls, and W. Caan (1982) Visual neurones re- sponsive to faces in the monkey temporal cortex. Exp. Brain Res. 47: 329-342.
Rall, W. (1964) Theoretical significance of dendritic trees for neuronal input-output relations. In Neural Theory and Modeling, R. F. Reiss, ed., pp. 73-97, Stanford University Press, Stanford, CA.
Regan, D., and K. I. Beverley (1979) Binocular and monocular stimuli for motion in depth: Changing-disparity and changing-size feed the same motion-in-depth stage. Vision Res. 19: 1331-1342.
Regan, D., K. I. Beverley, and M. Cynader (1979) Stereoscopic sub- systems for position in depth and for motion in depth. Proc. R. Sot. Lond. [Biol.] 204: 485-501.
Robinson, D. L., M. E. Goldberg, and G. B. Stanton (1978) Parietal association cortex in primate: Sensory mechanisms and behavioral modulations. J. Neurophysiol. 41: 910-932.
The Journal of Neuroscience Integration of Motion Cues in Macaque STS 157
Rockland, K. S., and D. N. Pandya (1979) Laminar origins and ter- minations of cortical connections of the occipital lobe in the rhesus monkey. Brain Res. 179: 3-20.
Saito, H., K. Tanaka, Y. Fukada, M. Yukie, K. Hikosaka, and E. Iwai (1984) Integration of direction cues of stimulus motion in macaque STS cortex. Sot. Neurosci. Abstr. 10: 475.
Sakata, H., H. Shibutani, Y. Ito, and K. Tsurugai (1984) Parietal visual neurones responding to rotary movements of the visual stimulus. J. Physiol. Sot. Jpn. 46: 445.
Sakata, H., H. Shibutani, and K. Kawano (1980) Spatial properties of visual fixation neurons in posterior parietal association cortex of the monkey. J. Neurophysiol.b? 1654-1672.
Sakata, H., H. Shibutani, and K. Kawano (1983) Functional properties of visual tracking neurons in posterior parietal association cortex of the monkey. J. Neurophysiol. 49: 1364-l 380.
Sakata, H., H. Shibutani, K. Kawano, and T. L. Harrington (1985) Neural mechanisms of space vision in the parietal association cortex of the monkey. Vision Res. 25: 453-463.
Sato. T.. T. Kawamura. and E. Iwai (1980) Resoonsiveness of infe- rotemporal single units to visual pattern stimuli ih monkeys perform- ing discrimination. Exp. Brain Res. 38: 3 13-3 19.
Seltzer, B., and D. N. Pandya (1978) Afferent cortical connections and architectonics of the superior temporal sulcus and surrounding cortex in the rhesus monkey. Brain Res. 149: l-24.
Spear, P. D., and T. P. Baumann (1975) Receptive-field characteristics of single neurons in lateral suprasylvian visual area of the cat. J. Neurophysiol. 38: 1403-1420.
Suzuki, H., and M. Azuma (1983) Topographic studies on visual neurons in the dorsolateral prefrontal cortex of the monkey. Exp. Brain Res. 53: 47-58.
Tanaka, K., K. Hikosaka, H.-a. Saito, M. Yukie, Y. Fukada, and E. Iwai (1986) Analysis of local and wide-field movements in the su- perior temporal visual areas of the macaque monkey. J. Neurosci. 6: 134-144.
Tanaka, K., H. Saito, Y. Fukada, K. Hikosaka, M. Yukie, and E. Iwai (1984) Two groups of neurons responding to local and whole field movements in the macaque MT area. Sot. Neurosci. Abstr. 10: 474.
Toyama, K., and T. Kozasa (1982) Responses of Clare-Bishop neu- rones to three dimensional movement of a light stimulus. Vision Res. 22: 571-574.
Ungerleider, L. G., and M. Mishkin (1979) The striate projection zone in the superior temporal sulcus of Mucucu muluttu: Location and topographic organization. J. Comp. Neurol. 188: 347-366.
Ungerleider, L. G., and M. Mishkin (1982) Two cortical visual sys- tems. In An&is of Visual Behavior. D. J. Inale. M. A. Goodale. and R. J. W. Mansfield, eds., pp. 549-586, MIT,-Cambridge, MA. ’
Ungerleider, L. G., R. Desimone, and M. Mishkin (1982) Cortical projections of area MT in the macaque. Sot. Neurosci. Abstr. 8: 680.
Van Essen, D. C., and J. H. R. Maunsell (1983) Hierarchical orga- nization and functional streams in the visual cortex. Trends in Neu- rosci. 6: 370-375.
Van Essen, D. C., and S. M. Zeki (1978) The topographic organization of rhesus monkey prestriate cortex. J. Physiol. (Lond.) 277: 193-226.
Van Essen, D. C., J. H. R. Maunsell, and J. L. Bixby (1981) The middle temporal visual area in the macaque: Myeloarchitecture, con- nections, functional properties and topographic organization. J. Comp. Neurol. 199: 293-326.
Van Essen, D. C., W. T. Newsome, and J. L. Bixby (1982) The pattern of interhemispheric connections and its relationship to extrastriate visual areas in the macaque monkey. J. Neurosci. 2: 265-283.
Wild, H. M., S. R. Butler, D. Carden, and J. J. Kulikowski (1985) Primate cortical area V4 important for colour constancy but not wave- length discrimination. Nature 313: 133-135.
Wurtz, R. H., B. J. Richmond, and W. T. Newsome (1984) Modulation of cortical visual processing by attention, perception, and movement. In Dynamic Aspects of Neocorticul Function, G. M. Edelman, W. E. Gall, and W. M. Cowan, eds., pp. 195-2 17, Wiley, New York.
Yaginuma, S., T. Niihara, and E. Iwai (1982) Further evidence on elevated discrimination limens for reduced patterns in monkeys with inferotemporal lesions. Neuropsychology 20: 2 l-3 1.
Yukie, M., K. Hikosaka, E. Iwai, H. Saito, K. Tanaka, and Y. Fukada (1985) Detection of straight and rotary movements of stimuli in macaque STS. Neurosci. Res. (Suppl. 1): S162.
Zeki, S. M. (1969) Representation of central visual fields in prestriate cortex of monkey. Brain Res. 14: 27 l-29 1.
Zeki, S. M. (1971) Cortical projections from two prestriate areas in the monkey. Brain Res. 34: 19-35.
Z&i, S. M. (1974a) Functional organization of a visual area in the posterior bank of the superior temporal sulcus of the rhesus monkey. J. Physiol. (Lond.) 236: 549-573.
Z&i, S. M. (1974b) Cells responding to changing image size and dis- parity in the cortex of the rhesus monkey. J. Physiol. (Lond.) 242: 827-84 1.
Zeki, S. M. (1977) Colour coding in the superior temporal sulcus of rhesus monkey visual cortex. Proc. R. Sot. Lond. [Biol.] 197: 195- 223.
Z&i, S. M. (1978a) The cortical projections of fovea1 striate cortex in the rhesus monkey. J. Physiol. (Lond.) 277: 227-244.
Z&i, S. M. (1978b) Uniformity and diversity of structure and function in rhesus monkey prestriate visual cortex. J. Physiol. (Land.) 277: 273-290.
Zeki, S. M. (1979) Functional specialization and binocular interaction in the visual areas of rhesus monkey prestriate cortex. Proc. R. Sot. Lond. [Biol.] 204: 379-397.
Zeki, S. (1980a) The representation of colours in the cerebral cortex. Nature 284: 4 12-4 18.
Zeki, S. (1980b) The responses of cells in the anterior bank of the superior temporal sulcus in macaque monkeys. J. Physiol. (Lond.) 308: 85P.
Zeki, S. (1983a) Colour coding in the cerebral cortex: The reaction of cells in monkey visual cortex to wavelengths and colours. Neurosci- ence 9: 741-765.
Zeki, S. (1983b) Colour coding in the cerebral cortex: The responses of wavelength-selective and colour-coded cells in monkey visual cor- tex to changes in wavelength composition. Neuroscience 9: 767-78 1.