Embed Size (px)
Citation preview

Method
Integration of ChIP-seq and machine learning revealsenhancers and a predictive regulatory sequencevocabulary in melanocytesDavid U. Gorkin,1,2 Dongwon Lee,3 Xylena Reed,1,2 Christopher Fletez-Brant,1
Seneca L. Bessling,1 Stacie K. Loftus,4 Michael A. Beer,1,3,5 William J. Pavan,4,5
and Andrew S. McCallion1,5
1McKusick-Nathans Institute of Genetic Medicine, Johns Hopkins University School of Medicine, Baltimore, Maryland 21205, USA;2Predoctoral Training Program in Human Genetics, Johns Hopkins University School of Medicine, Baltimore, Maryland 21205, USA;3Department of Biomedical Engineering, Johns Hopkins University, Baltimore, Maryland 21201, USA; 4Genetic Disease Research
Branch, National Human Genome Research Institute, National Institutes of Health, Bethesda, Maryland 20892, USA
We take a comprehensive approach to the study of regulatory control of gene expression in melanocytes that proceedsfrom large-scale enhancer discovery facilitated by ChIP-seq; to rigorous validation in silico, in vitro, and in vivo; andfinally to the use of machine learning to elucidate a regulatory vocabulary with genome-wide predictive power. Weidentify 2489 putative melanocyte enhancer loci in the mouse genome by ChIP-seq for EP300 and H3K4me1. Wedemonstrate that these putative enhancers are evolutionarily constrained, enriched for sequence motifs predicted to bindkey melanocyte transcription factors, located near genes relevant to melanocyte biology, and capable of driving reportergene expression in melanocytes in culture (86%; 43/50) and in transgenic zebrafish (70%; 7/10). Next, using the se-quences of these putative enhancers as a training set for a supervised machine learning algorithm, we develop a vocabularyof 6-mers predictive of melanocyte enhancer function. Lastly, we demonstrate that this vocabulary has genome-widepredictive power in both the mouse and human genomes. This study provides deep insight into the regulation of geneexpression in melanocytes and demonstrates a powerful approach to the investigation of regulatory sequences that can beapplied to other cell types.
[Supplemental material is available for this article.]
Regulation of gene expression at the level of transcription is an
essential process in all organisms. In eukaryotes, DNA sequence
elements known as enhancers play a major role in regulating
transcription. Enhancers direct an increase in the expression of
one or more target genes in cis, and their activity is typically re-
stricted to specific cell types. Though the molecular mechanisms
by which enhancers function are not fully understood, it is gen-
erally accepted that they are composed of short sequence motifs
that bind transcription factors (TFs) (Noonan and McCallion
2010). These TFs recruit transcriptional coactivators such as EP300,
CREBBP, and members of the Mediator complex (Panne et al. 2007;
He et al. 2011b), and this enhancer-bound complex of TFs and
coactivators then mediates an increase in the expression of a target
gene at least in part through direct interaction with the basal
transcriptional machinery present at the gene’s promoter (Ong
and Corces 2011; Chepelev et al. 2012). Epigenetic modifications
are also thought to play a significant role in enhancer function, as
it is well established that histones in the vicinity of enhancers bear
characteristic modifications, including H3K4me1 (Heintzman
et al. 2007, 2009) and H3K27Ac (Creyghton et al. 2010).
The identification of enhancers in eukaryotic genomes is
challenging, due in large part to the expansive search space of
noncoding sequence in which enhancers can reside. The recent
integration of chromatin immunoprecipitation (ChIP) with mas-
sively parallel/next-generation sequencing (ChIP-seq) or micro-
array hybridization (ChIP-chip) facilitates the identification of loci
bound by enhancer-related proteins and/or modified histones in
a cell or tissue type of interest. Among the many ChIP targets used
in this way to identify putative enhancers, the transcriptional
coactivator EP300 and the histone modification H3K4me1 have
proven particularly effective (Heintzman et al. 2007, 2009; Visel
et al. 2009a; Blow et al. 2010; Bulger and Groudine 2011). Though
ChIP-seq and ChIP-chip have dramatically increased the through-
put with which putative enhancers can be identified, it remains
important to thoroughly analyze the identified loci using bio-
informatics-based tools and reporter assays before drawing con-
clusions about their function.
Enhancer identification is one step in a larger effort to un-
derstand the DNA sequence features that underlie enhancer
function. These sequence features provide insight into the mo-
lecular mechanisms of transcriptional regulation and can be used
to predict the impact of variation in regulatory sequence, much in
the same way that the canonical genetic code can be used to pre-
dict the impact of variation in protein-coding sequence. We apply
a recently developed strategy to identify sequence features pre-
dictive of enhancer function (Lee et al. 2011), which uses a super-
vised machine learning algorithm based on the concept of a sup-
port vector machine (SVM). Importantly, this strategy does not
require any prior knowledge of TF binding specificities and thus
has the potential to identify completely novel predictive sequence
5Corresponding authorsE-mail [email protected] [email protected] [email protected] published online before print. Article, supplemental material, and pub-lication date are at http://www.genome.org/cgi/doi/10.1101/gr.139360.112.
2290 Genome Researchwww.genome.org
22:2290–2301 � 2012, Published by Cold Spring Harbor Laboratory Press; ISSN 1088-9051/12; www.genome.org

features. Furthermore, this strategy performs well on large se-
quence sets, allowing for accurate prediction of additional en-
hancer sequences genome-wide.
In this study we investigate regulatory control of gene ex-
pression in epidermal melanocytes, the pigment-producing cells
that generate skin and hair color. These cells also play a central role
in several pathological phenotypes, including melanoma, albi-
nism, and vitiligo (for review, see Lin and Fisher 2007). These
qualities, along with extensive knowledge about the key TFs and
developmental origins of melanocytes (Silver et al. 2006; Hou and
Pavan 2008; Thomas and Erickson 2008), make this lineage an
attractive model system for the study of enhancers. We employ
ChIP-seq for EP300 and H3K4me1 to identify melanocyte en-
hancers genome-wide. We use a novel set of criteria that takes into
account both EP300 and H3K4me1 to define a single set of putative
enhancers, and validate these enhancers through a series of in
silico, in vitro, and in vivo analyses. Having validated the identi-
fied enhancers, we use them as a training set for a machine
learning algorithm, developing a comprehensive vocabulary of
6-mers predictive of melanocyte enhancer function with power to
predict additional melanocyte enhancers
in the mouse and human genomes. Our
data establish an extensive body of knowl-
edge about regulatory control in melano-
cytes, which is relevant to phenotypic
variation and disease. Moreover, we dem-
onstrate a comprehensive approach that
integrates ChIP-seq and machine learning
to discover lineage-dependent enhancers
and reveal the sequence vocabulary un-
derlying their function.
Results
Previously characterized melanocyteenhancers are bound by EP300and flanked by H3K4me1
We sought to identify a large set of puta-
tive melanocyte enhancers from which
we could derive a predicative sequence
vocabulary. We began our enhancer iden-
tification by performing ChIP-seq for both
EP300 and H3K4me1 in a line of immor-
talized melanocytes (melan-a) derived from
Ink4a-Arf–null mice on a C57BL/6J back-
ground (Bennett et al. 1987; Sviderskaya
et al. 2002). We identified 3622 and 59,965
ChIP-seq peaks for EP300 and H3K4me1,
respectively. We expected a priori that both
EP300 and H3K4me1 would be enriched at
melanocyte enhancers loci, based on simi-
lar findings in other cell types (Barski
et al. 2007; Heintzman et al. 2009; Visel
et al. 2009a; Wang et al. 2009). Consistent
with these observations, we confirmed
the presence of enrichment for these
factors at previously characterized me-
lanocyte enhancers (Fig. 1A,B; Supple-
mental Table S1). More specifically,
we observed that a central EP300 peak
overlaps these enhancers and that this
peak is flanked on both sides by strong H3K4me1 enrichment.
To further assess the relationship between EP300 and H3K4me1
in melanocytes, we examined the distribution of H3K4me1
ChIP-seq reads relative EP300 peaks genome-wide. We found that
H3K4me1 enrichment flanking EP300 peaks is a striking genome-
wide trend (Fig. 1C,D), similar to observations made in other cell
types (Heintzman et al. 2007, 2009; Ghisletti et al. 2010).
A specific EP300/H3K4me1 ChIP-seq signature identifiesmelanocyte enhancers genome-wide
To identify a finite set of putative enhancers, we looked genome-
wide for loci bearing the signature observed at previously charac-
terized melanocyte enhancers, i.e., at which an EP300 peak is
flanked by H3K4me1 enrichment. First, we identified a set of
H3K4me1-flanked regions at which adjacent H3K4me1 peaks are
separated by between 100 and 1500 bp (n = 21,189). This distance
of 100–1500 bp was chosen based on the range of intervals be-
tween adjacent H3K4me1 peaks at known melanocyte enhancers
(Supplemental Fig. S1). Next, we identified all EP300 peaks that
Figure 1. EP300 and H3K4me1 ChIP-seq signature at melanocyte enhancers. (A, left) Schematic ofchr15:78,984,500–79,034,500 (UCSC Genome Browser; mm9) showing Sox10 and previously char-acterized melanocyte enhancer Sox10 MSC#5. (Right) Detailed view of the region immediately sur-rounding Sox10 MSC#5 (chr15:79030709–79033709), showing ChIP-seq data for EP300 (green) andH3K4me1 (blue) in melan-a. Rectangles are ChIP-seq peaks, and colored vertical bars below peaks showdensity of ChIP-seq reads in 10-bp bins. Gray bars at the bottom of inset show the phastCons score(Euarchontoglires). (B) Same scheme as in A, but showing the interval chr7:94,575,283–94,662,322containing the Tyr gene and previously characterized melanocyte enhancer Tyr DRE-15kb. Intervalshown to the right is chr7:94655287–94658287. (C ) Number of ChIP-seq reads for H3K4me1 (blue, leftaxis) and EP300 (green, right axis) in a 5-kb window around the summits of 3622 EP300 peaks (averagedin 100-bp bins). (D) Heatmap showing the number of H3K4me1 ChIP-seq reads in a 3-kb windowaround 3,622 EP300 peaks.
Genome Research 2291www.genome.org
Enhancer discovery and regulatory vocabulary
overlap an H3K4me1-flanked region. This approach, represented
schematically in Figure 2A, yields 2489 loci at which an EP300
peak falls in a region flanked by H3K4me1 peaks. Hereafter we
refer to these 2489 loci as ‘‘putative melanocyte enhancers’’
(Supplemental Tables S4–S7). These putative melanocyte en-
hancers include previously reported enhancers at Tyr and Sox10
(Murisier et al. 2007; Antonellis et al. 2008), as well as novel en-
hancers at a number of other genes central to melanocyte biology,
including Mitf, Tyrp1, Kit, and Mc1r (Supplemental Fig. S2). For
downstream analysis, we use the summit of the EP300 peak as
a surrogate for the center of a given enhancer, and where neces-
sary, we use the boundaries of the EP300 peak as surrogates for the
enhancer’s boundaries.
Several additional lines of evidence support the imputed
function of these 2489 putative melanocyte enhancers. First, the
putative melanocyte enhancers show evolutionary sequence con-
straint (Fig. 2B), providing independent evidence of their func-
tional significance. Second, these putative melanocyte enhancers
are enriched for sequence motifs predicted to bind key melanocyte
TFs, including SOX10 and MITF, as detected by DREME (Fig. 2C;
Bailey 2011). Mutations in SOX10 and MITF in humans cause
Waardenburg syndrome (WS), a pleiotropic neural crest disorder
with characteristic pigmentary defects (SOX10 mutations cause
WS type 2E OMIM:611584 and 4C OMIM:613266; MITF muta-
tions cause WS type 2A OMIM:193510) (McKusick 1998; http://
omim.org/), and both TFs are involved in the pathogenesis of
melanoma (Cronin et al. 2009; Harris et al. 2010). Third, analysis
with GREAT (McLean et al. 2010) reveals that genes proximal to
the putative melanocyte enhancers (within ;50 kb; see GREAT
methods) are significantly associated with Gene Ontology (GO)
terms relevant to melanocyte biology, including melanoma,
melanosome, pigmentation, and melanocyte differentiation (Ta-
ble 1). Furthermore, using previously reported gene expression
data for the melan-a line (Buac et al. 2009), we found that pu-
tative melanocyte enhancers are enriched near the most highly
expressed genes and depleted near genes that are not expressed at
appreciable levels (Fig. 2D), reflecting the expected distribution of
active melanocyte enhancers.
Although the 2489 putative melanocyte enhancers are
enriched within 100 kb of highly expressed genes, they are not
enriched in a 1-kb window immediately adjacent to the tran-
scription start site (TSS) of these genes (Fig. 2E). This suggests that
the enhancers identified are truly distal-acting and include very
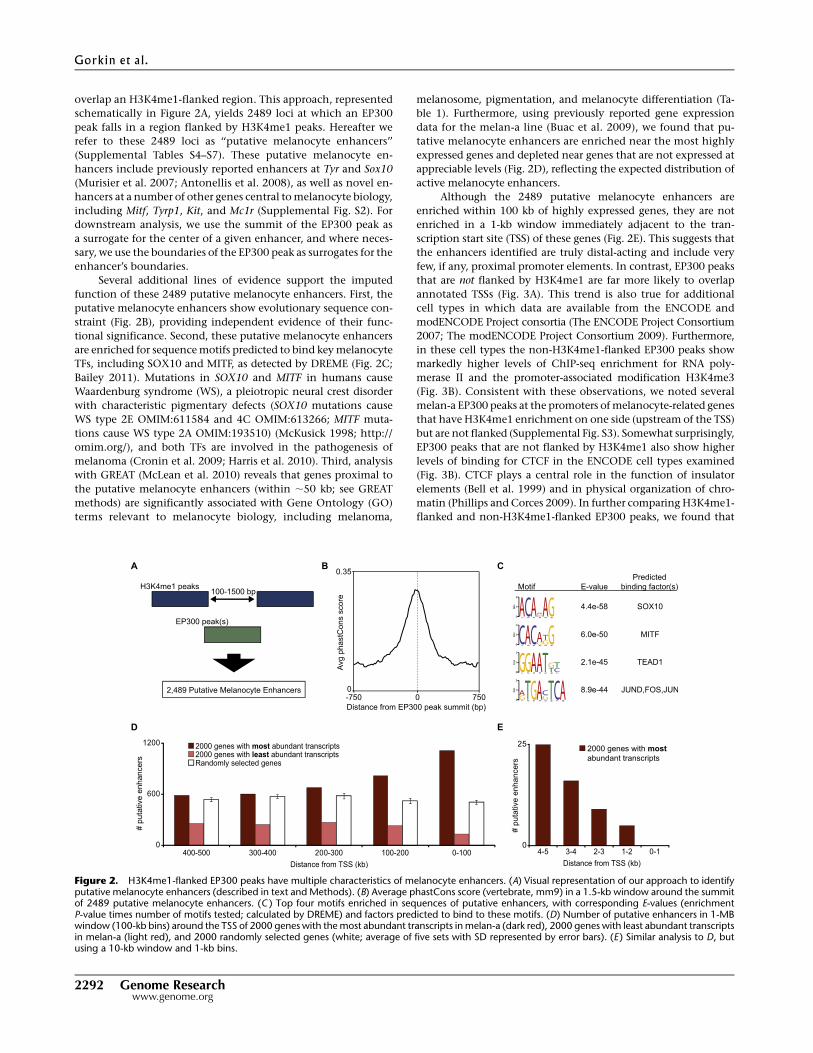
few, if any, proximal promoter elements. In contrast, EP300 peaks
that are not flanked by H3K4me1 are far more likely to overlap
annotated TSSs (Fig. 3A). This trend is also true for additional
cell types in which data are available from the ENCODE and
modENCODE Project consortia (The ENCODE Project Consortium
2007; The modENCODE Project Consortium 2009). Furthermore,
in these cell types the non-H3K4me1-flanked EP300 peaks show
markedly higher levels of ChIP-seq enrichment for RNA poly-
merase II and the promoter-associated modification H3K4me3
(Fig. 3B). Consistent with these observations, we noted several
melan-a EP300 peaks at the promoters of melanocyte-related genes
that have H3K4me1 enrichment on one side (upstream of the TSS)
but are not flanked (Supplemental Fig. S3). Somewhat surprisingly,
EP300 peaks that are not flanked by H3K4me1 also show higher
levels of binding for CTCF in the ENCODE cell types examined
(Fig. 3B). CTCF plays a central role in the function of insulator
elements (Bell et al. 1999) and in physical organization of chro-
matin (Phillips and Corces 2009). In further comparing H3K4me1-
flanked and non-H3K4me1-flanked EP300 peaks, we found that
Figure 2. H3K4me1-flanked EP300 peaks have multiple characteristics of melanocyte enhancers. (A) Visual representation of our approach to identifyputative melanocyte enhancers (described in text and Methods). (B) Average phastCons score (vertebrate, mm9) in a 1.5-kb window around the summitof 2489 putative melanocyte enhancers. (C ) Top four motifs enriched in sequences of putative enhancers, with corresponding E-values (enrichmentP-value times number of motifs tested; calculated by DREME) and factors predicted to bind to these motifs. (D) Number of putative enhancers in 1-MBwindow (100-kb bins) around the TSS of 2000 genes with the most abundant transcripts in melan-a (dark red), 2000 genes with least abundant transcriptsin melan-a (light red), and 2000 randomly selected genes (white; average of five sets with SD represented by error bars). (E ) Similar analysis to D, butusing a 10-kb window and 1-kb bins.
Gorkin et al.
2292 Genome Researchwww.genome.org

H3K4me1-flanked peaks have higher levels of EP300 enrichment
than non-H3K4me1-flanked peaks (P = 2.5 3 10�5) (Fig. 3C).
Collectively, these data show that our set of 2489 candidate
loci is highly enriched for bona fide melanocyte enhancers. By
selecting only those EP300 peaks that overlap H3K4me1-flanked
regions, we obtain a set of putative melanocyte enhancers with
stronger EP300 binding that includes fewer regions containing
sequence features of nonenhancer regulatory elements such as
promoters and insulators. Importantly, these characteristics of our
approach are particularly well suited to the creation of a training
set from which key sequence features of enhancers can be ex-
tracted. Furthermore, our results add to a growing body of evidence
linking EP300 and H3K4me1 to enhancer function and suggest the
existence of functionally distinct subsets of EP300 peaks that can
be distinguished to some extent by proximal histone modifications.
Identified melanocyte enhancers direct reporter expressionin melanocytes in vitro and in vivo
Given the evidence already supporting the role of the identified
putative melanocyte enhancers in melanocyte regulatory control,
we next sought to validate their biological activity in reporter as-
says. To this end, we first selected 50 putative enhancers at random
from the full set of 2489 and analyzed each one for its ability to
direct expression of a luciferase reporter gene in the melan-a line.
We found that 86% (43/50) of enhancers tested increase reporter
expression greater than threefold relative to the minimal promoter
alone (Fig. 4A; Supplemental Table S2). Moreover, 72% (36/50) of
enhancers tested increase reporter expression more than fivefold,
and 48% (24/50) increase expression more than 10-fold relative to
the minimal promoter alone. As there is considerable variation in
the activity of melanocyte enhancers in this assay, we tested an
additional 10 regions as negative controls. These regions were
matched to our putative enhancers in average size and GC content
but did not have significant EP300 or H3K4me1 ChIP-seq enrich-
ment. None of these negative control regions increase reporter
expression more than threefold relative to promoter alone (Sup-
plemental Fig. S4A). As expected, the difference in reporter ex-
pression between putative enhancers and negative control regions
is highly significant (P = 9.6 3 10�7 by two-tailed t-test) (Fig. 4B).
We also assayed three previously charac-
terized melanocyte enhancers for refer-
ence, which directed expression at levels
11-fold, 42-fold, and 51-fold higher than
the minimal promoter alone, respectively
(Supplemental Fig. S4B). However, it should
be noted that these three enhancers are
not directly comparable to our test se-
quences because the critical regions of
these enhancers have been refined in pre-
vious studies. In this assay, a given en-
hancer will show highest activity when
the amplified region contains the motifs
critical for enhancer function with as lit-
tle additional sequence as possible.
To further validate the biological
activity of the putative enhancers, we
tested the ability of a subset (n = 10) to
appropriately direct melanocyte expres-
sion of a GFP reporter in vivo in trans-
genic zebrafish. We used an established
pipeline for analyzing putative enhancers
in zebrafish (Fisher et al. 2006a,b; McGaughey et al. 2008; Prasad
et al. 2011), which we have previously used to analyze melanocyte
regulatory elements at Sox10 (Antonellis et al. 2008) and GPNMB
(Loftus et al. 2009). The 10 putative enhancers tested were chosen
at random from the 50 analyzed in vitro as described above. We
found that 70% (7/10) of enhancers tested direct GFP expression
in the melanocytes of mosaic transgenic zebrafish (Fig. 5; Sup-
plemental Table S3). The observed reporter expression is consis-
tent with what we have seen previously when assaying melano-
cyte enhancers (Loftus et al. 2009) and is highly specific to
melanocytes (Supplemental Fig. S5). We do not see consistent ex-
pression in other tissues with any of the seven positive constructs,
with two exceptions that result from inherent artifacts of the assay:
(1) We always see background GFP expression in the yolk (into
which the construct is injected at day 0); and (2) we often see ex-
pression in skeletal muscle, which we suspect is caused by a cryptic
regulatory sequence in the backbone of the reporter construct that
we have been unable to locate. One melanocyte-negative construct
(putative enhancer 25) did drive consistent expression in ganglia
of the peripheral nervous system (PNS). Interestingly, the PNS and
melanocytes both arise from the neural crest during embryonic
development.
The results of these functional assays demonstrate that the
majority of putative melanocyte enhancers can direct gene ex-
pression in melanocytes both in vitro and in vivo, providing strong
additional evidence that the identified loci function as melanocyte
enhancers.
Machine learning reveals sequence features that underliemelanocyte enhancer function
To more thoroughly investigate the sequence composition of me-
lanocyte enhancers, we used the putative enhancers identified by
ChIP-seq as a training set for a supervised machine learning algo-
rithm based on the statistical framework of a SVM (Lee et al. 2011).
This approach as applied to embryonic mouse enhancers from
other tissues is presented in detail by Lee et al. (2011). Briefly, the
SVM finds an optimal decision boundary to distinguish the set
of enhancers from random genomic regions using sequences of
length k (k-mers) as features. Here, we used the putative melanocyte
Table 1. Gene Ontology (GO) terms associated with genes proximal to putative melanocyteenhancers
GO category Melanocyte-related GO term P-value
Biological process Pigmentation 1.3 3 10�7
Melanocyte differentiation 1.5 3 10�7
Pigment cell differentiation 2.0 3 10�7
Developmental pigmentation 3.1 3 10�7
Melanin metabolic process 6.5 3 10�5
Mouse phenotype Abnormal hair follicle melanocyte morphology 3.1 3 10�9
Abnormal melanocyte morphology 1.5 3 10�8
Abnormal extracutaneous pigmentation 6.8 3 10�8
Hypopigmentation 8.3 3 10�7
Abnormal hair follicle melanin granule morphology 1.8 3 10�5
Absent hair follicle melanin granules 2.3 3 10�5
White spotting 2.7 3 10�5
Abnormal melanosome morphology 7.4 3 10�5
Abnormal melanoblast migration 9.3 3 10�5
Yellow coat color 6.4 3 10�4
Disease ontology Melanoma 4.1 3 10�19
Melanocytic neoplasm 7.4 3 10�19
Waardenburg syndrome 9.3 3 10�6
Cellular component Melanosome 1.3 3 10�11
Enhancer discovery and regulatory vocabulary
Genome Research 2293www.genome.org
enhancers as positive sequences, a 503 larger set of random ge-
nomic regions as negative sequences, and the full set of 2080 dis-
tinct 6-mers as features. We have previously found that 6-mers and
7-mers are more informative in these analyses than are k-mers of
other lengths, and we prefer 6-mers for robustness and ease of in-
terpretation (Lee et al. 2011). SVM training assigns a weight, w, to
each feature (6-mer), which determines its relative contribution
to the decision boundary. The SVM discriminatory function,
fSVM(x) = wx + b, represents the distance of a sequence x from the
decision boundary and determines the predicted class, enhancer or
nonenhancer, of the sequence x. This approach, which we call the
kmer-SVM classifier, has three major advantages: (1) It identifies
the specific sequences recognized by TFs active in melanocytes and
provides independent support for our putative melanocyte en-
hancers based on previously known biology; (2) it allows the
identification of additional melanocyte enhancers outside the
original set of 2489 putative enhancers; and (3) it allows an indirect
assessment of the quality of our putative enhancer set based on its
sequence properties.
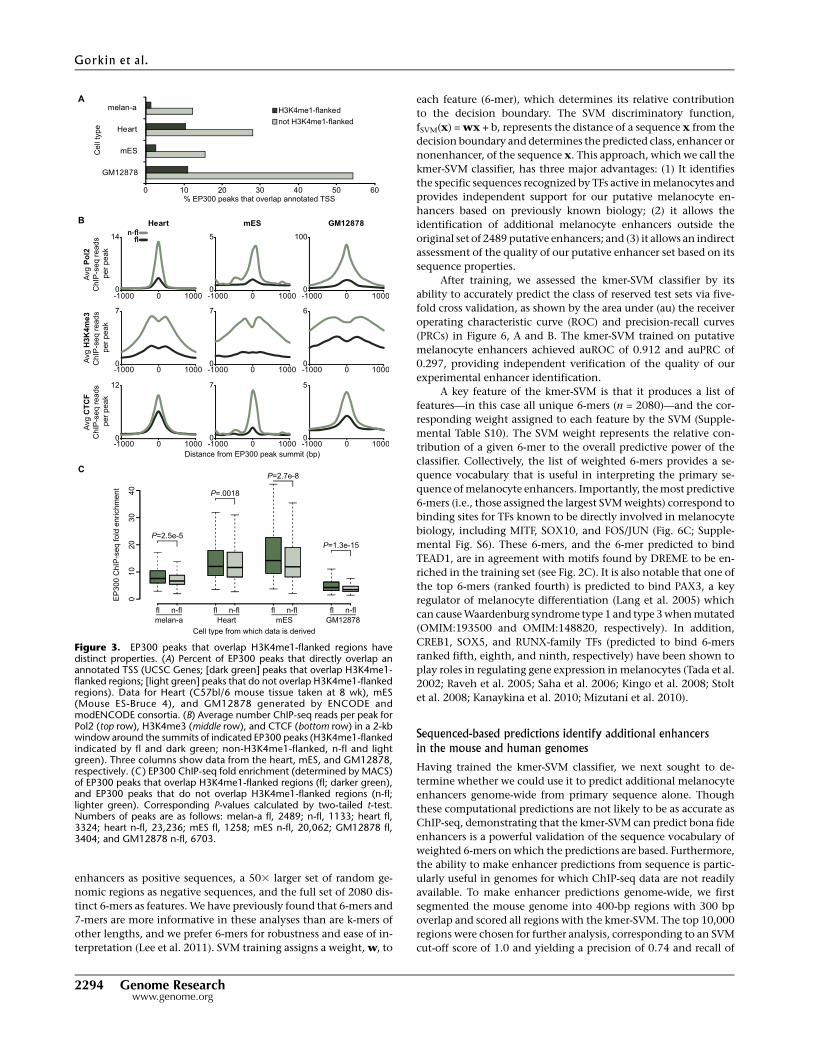
After training, we assessed the kmer-SVM classifier by its
ability to accurately predict the class of reserved test sets via five-
fold cross validation, as shown by the area under (au) the receiver
operating characteristic curve (ROC) and precision-recall curves
(PRCs) in Figure 6, A and B. The kmer-SVM trained on putative
melanocyte enhancers achieved auROC of 0.912 and auPRC of
0.297, providing independent verification of the quality of our
experimental enhancer identification.
A key feature of the kmer-SVM is that it produces a list of
features—in this case all unique 6-mers (n = 2080)—and the cor-
responding weight assigned to each feature by the SVM (Supple-
mental Table S10). The SVM weight represents the relative con-
tribution of a given 6-mer to the overall predictive power of the
classifier. Collectively, the list of weighted 6-mers provides a se-
quence vocabulary that is useful in interpreting the primary se-
quence of melanocyte enhancers. Importantly, the most predictive
6-mers (i.e., those assigned the largest SVM weights) correspond to
binding sites for TFs known to be directly involved in melanocyte
biology, including MITF, SOX10, and FOS/JUN (Fig. 6C; Supple-
mental Fig. S6). These 6-mers, and the 6-mer predicted to bind
TEAD1, are in agreement with motifs found by DREME to be en-
riched in the training set (see Fig. 2C). It is also notable that one of
the top 6-mers (ranked fourth) is predicted to bind PAX3, a key
regulator of melanocyte differentiation (Lang et al. 2005) which
can cause Waardenburg syndrome type 1 and type 3 when mutated
(OMIM:193500 and OMIM:148820, respectively). In addition,
CREB1, SOX5, and RUNX-family TFs (predicted to bind 6-mers
ranked fifth, eighth, and ninth, respectively) have been shown to
play roles in regulating gene expression in melanocytes (Tada et al.
2002; Raveh et al. 2005; Saha et al. 2006; Kingo et al. 2008; Stolt
et al. 2008; Kanaykina et al. 2010; Mizutani et al. 2010).
Sequenced-based predictions identify additional enhancersin the mouse and human genomes
Having trained the kmer-SVM classifier, we next sought to de-
termine whether we could use it to predict additional melanocyte
enhancers genome-wide from primary sequence alone. Though
these computational predictions are not likely to be as accurate as
ChIP-seq, demonstrating that the kmer-SVM can predict bona fide
enhancers is a powerful validation of the sequence vocabulary of
weighted 6-mers on which the predictions are based. Furthermore,
the ability to make enhancer predictions from sequence is partic-
ularly useful in genomes for which ChIP-seq data are not readily
available. To make enhancer predictions genome-wide, we first
segmented the mouse genome into 400-bp regions with 300 bp
overlap and scored all regions with the kmer-SVM. The top 10,000
regions were chosen for further analysis, corresponding to an SVM
cut-off score of 1.0 and yielding a precision of 0.74 and recall of
Figure 3. EP300 peaks that overlap H3K4me1-flanked regions havedistinct properties. (A) Percent of EP300 peaks that directly overlap anannotated TSS (UCSC Genes; [dark green] peaks that overlap H3K4me1-flanked regions; [light green] peaks that do not overlap H3K4me1-flankedregions). Data for Heart (C57bl/6 mouse tissue taken at 8 wk), mES(Mouse ES-Bruce 4), and GM12878 generated by ENCODE andmodENCODE consortia. (B) Average number ChIP-seq reads per peak forPol2 (top row), H3K4me3 (middle row), and CTCF (bottom row) in a 2-kbwindow around the summits of indicated EP300 peaks (H3K4me1-flankedindicated by fl and dark green; non-H3K4me1-flanked, n-fl and lightgreen). Three columns show data from the heart, mES, and GM12878,respectively. (C ) EP300 ChIP-seq fold enrichment (determined by MACS)of EP300 peaks that overlap H3K4me1-flanked regions (fl; darker green),and EP300 peaks that do not overlap H3K4me1-flanked regions (n-fl;lighter green). Corresponding P-values calculated by two-tailed t-test.Numbers of peaks are as follows: melan-a fl, 2489; n-fl, 1133; heart fl,3324; heart n-fl, 23,236; mES fl, 1258; mES n-fl, 20,062; GM12878 fl,3404; and GM12878 n-fl, 6703.
Gorkin et al.
2294 Genome Researchwww.genome.org

0.05 estimated from the PR curve in Figure 6B. We then eliminated
any predicted regions overlapping the original training set (508
regions overlapping 348 enhancers from the original training set)
and merged any overlapping regions. None of the six previously
characterized melanocyte enhancers in Supplemental Table S1
overlap a kmer-SVM prediction, though it should be noted that
four are included in the training set as they were bound by EP300
and flanked by H3K4me1 (Tyr DRE-15kb, Sox10 MCS4, Sox10
MCS5, Sox10 MCS9).
Ultimately, we obtained a set of 7361 predicted melanocyte
enhancers (Supplemental Table S8). These predicted enhancers
show strong sequence constraint (Fig. 7A), albeit to a lesser extent
than the original set of putative enhancers. In addition, the pre-
dicted enhancers also show an EP300 and H3K4me1 ChIP-seq
signature reminiscent of the original enhancer set (Fig. 7B). This
suggests that the kmer-SVM predictions share underlying biology
with the original set of 2489 putative enhancers, though the ChIP-
seq signal at these loci is much lower than at regions detected by
peak calling (Supplemental Fig. S7). We further analyzed the ability
of a subset of the kmer-SVM–predicted enhancers to direct ex-
pression of a luciferase reporter in vitro in melanocytes (n = 11). We
found that majority of enhancers tested direct luciferase expres-
sion in vitro more than threefold higher than the minimal pro-
moter alone (8/11; 73%), and several drove expression more than
fivefold (6/11; 55%) and 10-fold higher (3/11; 27%) (Fig. 7C;
Supplemental Fig. S8A). We also tested the enhancer activity of
three predicted enhancers in vivo using the same assay described
above for ChIP-identified enhancers, and found that two of the
three sequences assayed directed expression of GFP in the melano-
cytes of transgenic zebrafish (Supplemental Fig. S8B; Supplemental
Table S3). GFP expression was mostly specific to melanocytes,
though one predicted enhancer (no. 1) also directed expression in
the CNS and otic vesicle. It should be noted that the predicted
enhancers assayed here were chosen from among the predictions
with the highest SVM scores rather than at random (see Methods).
To further demonstrate the power of this approach, we also
made genome-wide enhancer predictions in the human genome in
the same way as described above for mouse. We identified 7788
predicted melanocyte enhancers in the human genome (Supple-
mental Table S9). Like the mouse predictions, the human pre-
dictions show strong sequence constraint (Fig. 7D), even though
conservation was not taken into account when making predic-
tions. The predicted human enhancers display elevated levels of
DNase I hypersensitivity (HS) in human primary melanocytes
(data generated by The ENCODE Project Consortium) (Fig. 7E),
which is a feature of active enhancers (Song and Crawford 2010;
Song et al. 2011). Moreover, the degree of overlap between the
kmer-SVM predictions and DNase I HS peaks is markedly higher in
primary melanocytes and melanoma cell lines than in unrelated
cell types (Fig. 7F), suggesting that the activity of the predicted
enhancers is largely specific to the melanocyte lineage.
The ability of the kmer-SVM classifier to make valid genome-
wide predictions in the mouse and human genomes clearly dem-
onstrates the high information content of the 6-mer vocabulary
derived from our original training set. The kmer-SVM predictions
also augment the catalog of putative melanocyte enhancers iden-
tified in this study by adding an additional 7361 predicted en-
hancers in the mouse and 7788 in humans. Furthermore, the fact
that a classifier trained on mouse sequences can make accurate
predictions in the human genome clearly demonstrates the utility
Figure 4. Putative melanocyte enhancers direct reporter expression in melan-a. (A) Fold increase in luciferase reporter expression directed by indicatedsequence relative to promoter-only control (P; white bar). Gray bars show fold increase of randomly selected putative enhancers (numbered 1–50). N(orange bar) represents the average of 10 negative regions. (Error bars) SD of three biological replicates, except in the case of N, where error bars show thestandard deviation of 10 different negative regions. Note the difference in scale between bottom panel (onefold to 10-fold by one) and top panel (10-foldto 115-fold by 10). (Dotted lines) 10-fold, fivefold, and threefold thresholds (top to bottom). (B) Box plot summarizing results of reporter assays for 10negative regions (top, orange) and 50 putative enhancers (bottom, gray). P = 9.564 3 10�7 by two-tailed t-test. Four outliers in putative enhancer groupnot shown in box plot (nos. 14, 22, 27, 46).
Enhancer discovery and regulatory vocabulary
Genome Research 2295www.genome.org

of this approach in identifying enhancers in genomes for which
ChIP-seq data are not available, and provides direct proof of
regulatory sequence vocabulary conserved between mouse and
human.
DiscussionIn this study, we demonstrate an approach to the investigation of
regulatory sequences that integrates ChIP-based enhancer dis-
covery with computational interrogation of sequence composi-
tion. The comprehensive nature of this approach represents a sig-
nificant step forward in our ability to decipher the sequence basis
of regulatory control of gene expression. Importantly, our strategy
can be applied to any cell type of interest for which ChIP-seq and
functional validation are feasible. We began this study by em-
ploying ChIP-seq for EP300 and H3K4me1 to discover a large set
of previously unidentified putative melanocyte enhancers. In our
melan-a ChIP-seq data, we observed a striking relationship between
EP300 and H3K4me1, similar to that observed in other cell types
(The ENCODE Project Consortium 2007; Heintzman et al. 2007,
2009; Ghisletti et al. 2010). The bimodal pattern of H3K4me1 ChIP-
seq signal around EP300 peaks likely reflects the tendency of en-
hancers to be nucleosome depleted (Boyle et al. 2008; Song et al.
2011), and thus the flanking H3K4me1 signal arises from posi-
tioned nucleosomes marked by H3K4me1 on either side of the
enhancer. A similar phenomenon was elegantly demonstrated in
the case of nucleosomes at androgen-
responsive enhancers in pancreatic can-
cer cells by He et al. (2010).
Though other studies have employed
ChIP-seq for EP300 alone to identify
putative enhancers with notable success
(Visel et al. 2009a; Blow et al. 2010), we
chose to focus specifically on EP300
peaks flanked by H3K4me1 peaks as this
approach minimized the inclusion of
nonenhancer sequence features with the
potential to obscure the sequence vo-
cabulary underlying enhancer function.
Though not the primary focus of this
study, we show that there are significant
differences between the subset of EP300
peaks that are flanked by H3K4me1 and
those that are not and that these differ-
ences are consistent across unrelated cell
types. These differences suggest that
there is considerable value in using both
EP300 and H3K4me1 data sets together
for enhancer discovery, and that future
studies to further unravel the relationship
between EP300 and H3K4me1 are likely
to yield important insights into enhancer
biology.
The rates of functional validation we
observed (86% in vitro and 70% in vivo)
are consistent with validation rates of
ChIP-seq identified enhancers reported
previously, though there is considerable
variation between studies (Heintzman et al.
2009; Visel et al. 2009a; Blow et al. 2010;
Ghisletti et al. 2010). There was general
agreement in activity between the in vitro
and in vivo assays used here. Six of seven elements showing ac-
tivity in vivo also showed activity in vitro (threefold threshold). In
addition, the enhancer with the strongest activity in vitro (no. 22)
clearly had the strongest activity in vivo as well, as judged by the
level of fluorescence in GFP-expressing melanocytes, the number
of positive embryos observed, and the number of positive mela-
nocytes per positive embryo. However, putative enhancer 3 drove
melanocyte expression in vivo even though its enhancer activity
was not significant in vitro, and conversely, three enhancers that
drove expression in vitro did not drive expression in vivo in mosaic
transgenic zebrafish (nos. 20, 25, and 30). These discrepancies
between the results of the in vitro and in vivo functional assays
used here could be the result of differences among the model or-
ganisms (mouse and zebrafish, respectively), the minimal pro-
moters in the reporter constructs (E1B and FOS, respectively), or
other limitations of the respective reporter assays. Our results
demonstrate the importance of using multiple complimentary
assays to assess the function of putative enhancers.
We observed that the orientation of the amplicon tested rel-
ative to the minimal promoter had a dramatic impact on the en-
hancer activity of sequences assayed in vitro. This is not likely to
reflect an orientation dependence of the enhancer in its native
genomic context. Rather, it is likely an artifact of the placement of
the sequence in the synthetic context of a reporter construct. The
orientation effect likely arises from the fact that the distance be-
tween an enhancer and minimal promoter in a reporter construct
Figure 5. Putative enhancers direct reporter expression in melanocytes of transgenic zebrafish em-bryos. (A) Dorsal view of melanocytes on the head of wild-type zebrafish embryo at 3 d post-fertilization(dpf). (B) Same view as A after treatment with epinephrine, which causes contraction of pigmentgranules to the center of the cell and enables the visualization of GFP at the periphery of melanocytes intransgenic embryos. (C–I) Representative images for all seven enhancers positive in this assay showingGFP-positive melanocytes in transgenic (mosaic) embryos at 3 dpf after treatment with epinephrine.Numbering is consistent with Figure 4.
Gorkin et al.
2296 Genome Researchwww.genome.org
can strongly influence its functional output. This distance effect
can be observed with as little 50 bp separating the two components
(Nolis et al. 2009) and can manifest as orientation-dependent ac-
tivity when testing an amplicon in which the critical sequence
components (TF binding sites) are skewed to one side. In such a
case, a given amplicon will show higher activity in the orientation
that places its critical components closest to the minimal pro-
moter, and lower (in some cases even undetectable) activity in the
orientation that places its critical components furthest from the
minimal promoter. Indeed, our strongest putative enhancer (no.
22), which mediates an increase of >100-fold reporter expression in
the ‘‘forward’’ orientation and drives strong melanocyte expres-
sion in vivo, does not drive detectable expression in vitro in the
‘‘reverse’’ orientation (Supplemental Table S2).
The similarity between the motifs identified by DREME (Fig.
2C) and the 6-mers identified by the kmer-SVM classifier (Fig. 6C)
is strong evidence that these sequences are binding motifs for TFs
that play significant roles in melanocyte biology. The identifica-
tion of motifs predicted to bind SOX10 and MITF is consistent with
the well-characterized roles for these TFs in the melanocyte line-
age. JUN and FOS are major effectors of the MAP kinase signaling
cascade, which is critical to the proliferation of melanocyte cells in
culture (Swope et al. 1995). In addition, constitutive activation of
the MAP kinase pathway is a hallmark of melanoma (Dutton-
Regester and Hayward 2012). The enrichment for a motif predicted
to bind members of the TEAD family may reflect an as yet un-
appreciated role for TEAD TFs in melanocytes. To our knowledge,
no TEAD family member has been previously shown to play a
specific biological role in melanocytes. However, TEAD2 has been
shown to bind an enhancer active in neural crest, the develop-
mental precursor to melanocytes (Degenhardt et al. 2010). This
binding causes an increase in the expression of Pax3, itself a TF
that is predicted to bind one of the most highly weighted 6-mers
(Fig. 6C).
Motifs predicted to bind other TFs involved in melanocyte
biology could have escaped detection due to high variation in
consensus sequence, low enrichment relative to negative control
sequences, or inherent biases in the algorithms used here for motif
detection. Additionally, our EP300/H3K4me1-based approach
likely identifies only a subset of enhancers active in melanocytes.
This particular subset of enhancers may be more highly enriched
for some TF binding sites than for others. Mechanistically distinct
subsets of enhancers have been reported in other cell types (He
et al. 2011a). Though beyond the scope of this study, ChIP-seq for
additional factors and in additional melanocyte-related cellular
substrates would likely help to distinguish potential differences
between subsets of enhancers.
Taken collectively, the melanocyte enhancers and corre-
sponding sequence vocabulary described here greatly enhance our
understanding of the regulation of gene expression in melano-
cytes. Furthermore, they are relevant to human phenotypes and
disease risk caused by variation in regulatory sequences. To date, at
least 18 distinct genome-wide association studies (GWAS) have
identified 52 SNPs associated with melanocyte-related pheno-
types, including skin color, hair color, freckling, tanning response,
number of cutaneous nevi, melanoma risk, and vitiligo (Hindorff
et al. 2011). Many of these associations are likely to reflect causa-
tive variants that impact regulatory sequences (Hindorff et al.
2009; Visel et al. 2009b). This study, and others like it, promises to
aid the identification of causative variants underlying genome-
wide associations, as well as the molecular mechanisms by which
they act.
Methods
ChIP-seqMelan-a cells were propagated according to guidelines fromSviderskaya et al. (2002). ChIP was performed according to themethod previously described (Lee et al. 2006). Alternative lysisbuffers to those in the referenced protocol were used as follows:lysis buffer 1 (5 mM PIPES, 85 mM KCl, 0.5% NP-40, and 13 RocheComplete, EDTA-free protease inhibitor), lysis buffer 2 (50 mMTris-HCl, 10 mM EDTA, 1% SDS, and 13 Roche Complete, EDTA-free protease inhibitor), and lysis buffer 3 (16.7 mM Tris-HCl, 1.2 mMEDTA, 167 mM NaCl, 0.01% SDS, 1.1% Triton X-100, and 13
Roche Complete, EDTA-free protease inhibitor). Sonication wasperformed using a Bioruptor (Diagenode) with the following set-tings: high output; 30-sec disruption; 30-sec cooling; total soni-cation time of 35 min with addition of fresh ice and cold water towater bath every 10 min. Four micrograms of ab8895 (Abcam) and10 mg of antibody sc-585 (Santa Cruz Biotechnology) were used forH3K4me1 and EP300 ChIP, respectively. IP wash conditions wereadjusted from the protocol referenced above as follows: Each im-munoprecipitation (IP) was washed twice with low-salt washbuffer (0.1% SDS, 1% Triton X-100, 2 mM EDTA, 20 mM Tris-HCl,150 mM NaCl), twice with high-salt wash buffer (0.1% SDS, 1%Triton X-100, 2 mM EDTA, 20 mM Tris-HCl, 500 mM NaCl), andtwice with LiCl wash buffer (0.25 M LiCl, 1% IGEPAL CA630, 1%deoxycholic acid [sodium salt], 1 mM EDTA, 10 mM Tris-HCl) andrinsed once with PBS (pH 7.4). At least two biological replicateswere performed for each antibody, with each replicate consisting ofa ChIP sample and an input (pre-IP) sample. Each replicate was per-formed with ;1 3 108 melan-a cells. ChIP libraries were submittedto NIH Intramural Sequencing Center, and each was sequenced on
Figure 6. Analysis of kmer-SVM classifier trained with putative mela-nocyte enhancers. (A) Receiver operating characteristic curve for kmer-SVM classifier trained on putative melanocyte enhancers, with overall areaunder curve (auROC = 0.912) (B) Precision-recall curve with area undercurve (auPRC = 0.297). (C ) 6-mers with highest positive predictive valueto kmer-SVM classifier, and factors predicted to bind each 6-mer. (*) NoPWM in queried databases. Match based on similarity to publishedbinding specificities (see Methods).
Enhancer discovery and regulatory vocabulary
Genome Research 2297www.genome.org

one lane of an Illumina GA2 yielding >20 million reads per sample,with the exception that each EP300 ChIP library was sequenced ontwo lanes for increased coverage depth.
Analysis of ChIP-seq data: peak calling
EP300 peaks were called using the Model-based Analysis for ChIP-seq (MACS) algorithm (Zhang et al. 2008). Peaks were called foreach replicate independently, and only those that were called inboth replicates (n = 3622) were selected for further analysis. Co-ordinates reported are from Replicate 1. H3K4me1 peaks werecalled using cisGenome (Ji et al. 2008) because it tends to call sep-arate peaks corresponding to each apex of the bimodal distributionof H3K4me1 signal flanking enhancers, whereas MACS tends to callthe entire bimodal distribution as a single peak. The Two SamplePeak Calling option in cisGenome was used, which allows bothreplicates to be entered simultaneously to produce a single set ofoutput files. Default settings were used for both peak callers, exceptthat ‘half window size W’ was set to 4 for cisGenome.
Distribution of ChIP-seq reads relative to features of interest
The total number of sequencing reads covering each base in awindow of indicated size (x-axis) around the summit/center of theset of genome regions of interest (ChIP-seq peaks/kmer-SVM pre-dictions) was calculated with a custom script. The total numberof reads covering each base in the window was then smoothed in100 bp bins, and is represented as ‘reads’ (y-axis) in Figures 1C and7, B and E. For Figure 3B and Supplemental Figure S7, a subsequentcalculation was performed in which the total reads in each bin wasdivided by the number of genome regions in the set of interest, to
facilitate comparison between sets of different sizes. This normal-ized measure is represented as ‘‘Avg reads per peak’’ (y-axis) inFigure 3B and Supplemental Figure S7. The heatmap in Figure 2Dwas generated with the heatmap tool in the Cistrome AnalysisPipeline (Liu et al. 2011) using a bed file of 3622 EP300 peaks(300-bp regions centered the peak summits), and a wig file ofH3K4me1 ChIP enrichment generated by MACS as standardoutput from peak calling.
ENCODE data
ENCODE data in Figures 3 and 7 were processed as describedabove for melan-a data. Much of the data handling for these analyseswas performed with Galaxy (Giardine et al. 2005; Blankenberget al. 2010; Goecks et al. 2010).
In silico analysis of putative enhancers:
Average phastCons score
Average phastCons score plots (Figs. 2B, 7A,D) were generatedwith the Conservation Plot tool as part of the Cistrome AnalysisPipeline using an interval file of H3K4me1-flanked EP300 peaks(300-bp intervals around peak summits) (Fig. 2B) or kmer-SVMpredicted enhancers (Fig. 7A,D).
Motif analysis
DREME (Bailey 2011) was used to identify enriched motifs (Fig.2C). Sequences of 2489 putative melanocyte enhancers (centeredon the EP300 ChIP-seq peak summit and extending 6150 bp) wereused as input. Default settings for motif size (mink = 3, maxk = 7)
Figure 7. kmer-SVM classifier predicts additional enhancers in the mouse and human genomes. (A–C) Mouse predictions; (D–F) human. (A) AveragephastCons score (vertebrate, mm9) in a 1.5-kb window around the centers of the 7361 kmer-SVM-predicted mouse melanocyte enhancers. (B) Number ofChIP-seq reads for H3K4me1 (blue line, left axis) and EP300 (green, right axis) in a 5-kb window around the centers of 7361 predicted melanocyteenhancers (averaged in 100-bp bins). (C ) Box plot summarizing results of reporter assays for 10 negative regions (top, orange) and 11 predicted enhancers(bottom, gray). P = 0.01803 by two-tailed t-test. (D) Average phastCons score (vertebrate, hg19) in a 1.5-kb window around the centers of the 7788 kmer-SVM–predicted human melanocyte enhancers. (E) Number of DNase-seq reads from human primary melanocytes in a 2-kb window (averaged in 100-bpbins) around the centers of predicted enhancers (orange) and randomly selected regions matched in size and GC content (gray). (F) Percentage ofpredicted human melanocyte enhancers (n = 7788) that overlap DNase HS peaks in six cell types, which are either derived from melanocytes (orange) ornot (beige).
Gorkin et al.
2298 Genome Researchwww.genome.org

were used. Motifs were submitted to TOMTOM (Gupta et al. 2007)as part of the MEME Suite (Bailey et al. 2009) to predict bindingfactors corresponding to each enriched motif, and the top verte-brate TF match was reported unless otherwise indicated in text. Inthe case of MITF and PAX3 (Figs. 2C, 6C; Supplemental Fig. S6),match was made based on high similarity to published bindingspecificities (Bentley et al. 1994; Chalepakis and Gruss 1995;Yasumoto et al. 1995), as there is no position weight matrix (PWM)for either of these TFs in the databases queried by TOMTOM(JASPER and UniProbe).
GO analysis
GREAT (McLean et al. 2010) was used to identify GO terms en-riched among genes proximal to putative enhancers. The associa-tion rule was set as follows: proximal, 50 kb upstream and 50 kbdownstream (any gene in this interval relative to input regions isincluded); plus distal, up to 500 kb (if no gene is present in theproximal interval, the closest gene in this distal interval is in-cluded). For details, see McLean et al. (2010).
Distribution of enhancers relative to genes expressed at different levelsin melan-a
Previously published melan-a microarray data were used (Buacet al. 2009). For analyses in Figure 2, only genes represented on thearray with a corresponding TSS in RefSeq (n = 17,957) were used.These genes were ranked by raw expression level in melan-a (probesaveraged, mean of three replicates). Custom scripts were used tocalculate the number of putative enhancers within 500 kb (in binsof 100 kb) (Fig. 2D) and 5 kb (in bins of 1 kb) (Fig. 2E) of TSSs of thetop 2000 and bottom 2000 genes on the ranked list, as well as forfive sets of 2000 genes selected randomly from this list.
Luciferase assays
All tested sequences (putative enhancers, negative regions, kmer-SVM predictions, and previously characterized enhancers) werePCR amplified from mouse genomic DNA (Promega, no. G309A)and TA-cloned with the pCR8/GW/TOPO TA Cloning kit (LifeTechnologies). The luciferase reporter construct contains the fireflyluciferase gene downstream from a minimal E1B promoter (Anto-nellis et al. 2006). Test sequences were inserted into a gatewaycloning site upstream of the promoter with a directional LR reaction(Gateway cloning from Life Technologies). All sequences were testedin both orientations, and data from the orientation with thehighest expression were used for downstream analysis to give themost accurate representation of the potential of each sequence todrive expression in melanocytes. For negative control regions, a setof 2000 regions was generated in which the regions were matchedto the putative enhancers in size, GC%, and repeat fraction, butwith a read count below for EP300 and H3K4me1. Ten regions wereselected at random from this set for functional testing. For all lu-ciferase assays, melan-a cells were plated in 24-well format (40,000cells/well) and transfected next day with 400 ng of luciferase re-porter and 8 ng of pCMV-RL Renilla expression vector (Promega)using 2 mL Lipofectamine 2000 per well (Life Technologies). Celllysate was collected at 48 h post-transfection and assayed with theDual-Luciferase Reporter Assay System (Promega) using a TecanGENiosPro Microplate Reader (Tecan Group). Three biologicalreplicates were performed for each construct.
Zebrafish transgenesis
All tested sequences were PCR amplified and TA-cloned as de-scribed above (see Luciferase Assays). The GFP reporter construct,
described previously (Fisher et al. 2006b), contains a gateway re-combination cassette (Life Technologies) upstream of a minimal(FOS) promoter and EGFP. The reporter used here was modifiedslightly by insertion of an eye-specific regulatory element fromthe zebrafish crybb1 locus (chr10:45,529,501–45,530,122; Zv9)downstream from EGFP to facilitate screening for successfultransgenesis independent of the test sequence. Zebrafish trans-genesis was performed as previously described (Fisher et al. 2006b).Briefly, each construct was injected into >150 wild-type (AB) em-bryos at the one- to two-cell stage with Tol2 transposase mRNA tofacilitate efficient and random integration of the reporter construct(flanked by tol2 recombination arms) into the zebrafish genome.Embryos were screened for GFP expression at 3 d post-fertilization(dpf), a timepoint at which melanocytes are well developed andthe embryos are most amenable to comprehensive screening. Em-bryos were also screened at 2, 4, and 5 dpf, albeit less thoroughly,and no significant differences in expression from 3 dpf were ob-served. At least 10 positive embryos were imaged at 3 dpf for eachpositive construct. For high-magnification fluorescent images ofmelanocytes (Fig. 5; Supplemental Fig. S8), zebrafish were treatedwith epinephrine 5–10 min prior to imaging (4 mg/mL) in orderto contract pigment granules toward the center of the cell andthus facilitate visualization of GFP at the periphery. For full-bodylateral images (Supplemental Fig. S5) embryos were raised in1-phenyl 2-thiourea (PTU) from 24 hpf until imaging to inhibitmelanin synthesis. All Images were taken on a Nikon AZ100Multizoom microscope with NIS-elements software. All zebrafishwork was performed under an approved protocol (FI10M369),reviewed by the Johns Hopkins Institutional Animal Care and UseCommittee.
Kmer-SVM classifier
To generate a high-confidence training set, we defined a new set of400-bp regions that maximizes the overall EP300 ChIP-seq signalwithin each of the 2489 putative melanocyte enhancers after re-moving any enhancers which were >70% repeats. We used repeatmasked sequence data (mm9) from the UCSC Genome Browserto calculate repeat fractions. For negative sequences, we found a503 larger set of random genomic 400-bp sequences by match-ing GC and repeat fraction of the positive set. Additionally,we excluded any potential EP300-bound regions with Poissontest P-value <0.1 (10 ChIP-seq reads). At each sampling step,we randomly selected a region from the positive set, calculatedthe GC content and the repeat fraction, sampled a genomic se-quence that matched these properties, and repeated samplinguntil we obtained 503 sequences. We performed standard fivefoldcross validation to assess the performance of our kmer-SVM clas-sifier. We measured the quality of the classifier by calculating theauROC, which plots the true positive rate vs. the false-positive rateof the predictions. The PRC is a more reliable measure of perfor-mance than the ROC when positive and negative sets are un-balanced, as in our case. Precision is the ratio of true positives topredicted positives, and recall is identical to the true positive rate inthe ROC. The PRCs can be quantified by the auPRC, or averageprecision. TFs predicted to bind top 6-mers were determined asdescribed above for DREME motifs (see Motif Analysis). Predictionsfor functional validation (n = 11) were chosen from the top of a listof regions ranked by SVM score. These are not the top 11 rankedpredictions overall however, because the list they were chosenfrom was generated by an earlier version of the classifier trained ona slightly different input set. In the final set of predictions, the 11regions tested are ranked by SVM score as 13, 15, 1, 9, 2, 44, 21,108, 24, 273, and 203, respectively.
Enhancer discovery and regulatory vocabulary
Genome Research 2299www.genome.org

Data accessThe data from this study have been submitted to the NCBI GeneExpression Omnibus (GEO) (http://www.ncbi.nlm.nih.gov/geo/)under accession number GSE38498.
AcknowledgmentsWe thank Barbara Migeon, Kirby Smith, Hongkai Ji, George Wu,Megana Prasad, Zachary Stine, Samantha Maragh, and AmandaPrice for helpful comments and discussion. This work was fundedin part by the National Institute of General Medical Sciences(GM071648) and the National Institute of Neurological Diseaseand Stroke (NS062972) to A.S.M., by the National Human GenomeResearch Institute’s (NHGRI) Intramural Research Program (W.J.P.,S.K.L.), by an NSF Graduate Research Fellowship to D.U.G., and bya predoctoral training grant (GM07814) to X.R. M.A.B. was sup-ported by the Searle Scholars Program and in part by NS062972.
Author contributions: The study was conceived by D.U.G.,A.S.M., S.K.L., and W.J.P. ChIP-seq was performed by D.U.G. andX.R. Peak calling and downstream analysis of ChIP-seq data wasperformed by D.U.G., in vitro validation by D.U.G. and C.F-B, andin vivo validation by D.U.G. and S.L.B. D.L. and M.A.B. developedand applied the kmer-SVM model. Kmer-SVM predictions weregenerated by D.L. and validated by D.U.G. and C.F-B. Experi-mental data were interpreted by D.U.G. and A.S.M. The manu-script was written by D.U.G., A.S.M., D.L., M.A.B., S.K.L., and W.J.P.
References
Antonellis A, Bennett WR, Menheniott TR, Prasad AB, Lee-Lin SQ, GreenED, Paisley D, Kelsh RN, Pavan WJ, Ward A. 2006. Deletion of long-rangesequences at Sox10 compromises developmental expression in a mousemodel of Waardenburg-Shah (WS4) syndrome. Hum Mol Genet 15: 259–271.
Antonellis A, Huynh JL, Lee-Lin SQ, Vinton RM, Renaud G, Loftus SK, ElliotG, Wolfsberg TG, Green ED, McCallion AS, et al. 2008. Identification ofneural crest and glial enhancers at the mouse Sox10 locus throughtransgenesis in zebrafish. PLoS Genet 4: e1000174. doi: 10.1371/journal.pgen.1000174.
Bailey TL. 2011. DREME: Motif discovery in transcription factor ChIP-seqdata. Bioinformatics 27: 1653–1659.
Bailey TL, Boden M, Buske FA, Frith M, Grant CE, Clementi L, Ren J, Li WW,Noble WS. 2009. MEME SUITE: Tools for motif discovery and searching.Nucleic Acids Res 37: W202–W208.
Barski A, Cuddapah S, Cui K, Roh TY, Schones DE, Wang Z, Wei G, ChepelevI, Zhao K. 2007. High-resolution profiling of histone methylations in thehuman genome. Cell 129: 823–837.
Bell AC, West AG, Felsenfeld G. 1999. The protein CTCF is required for theenhancer blocking activity of vertebrate insulators. Cell 98: 387–396.
Bennett DC, Cooper PJ, Hart IR. 1987. A line of non-tumorigenic mousemelanocytes, syngeneic with the B16 melanoma and requiring a tumourpromoter for growth. Int J Cancer 39: 414–418.
Bentley NJ, Eisen T, Goding CR. 1994. Melanocyte-specific expression of thehuman tyrosinase promoter: Activation by the microphthalmia geneproduct and role of the initiator. Mol Cell Biol 14: 7996–8006.
Blankenberg D, Von Kuster G, Coraor N, Ananda G, Lazarus R, Mangan M,Nekrutenko A, Taylor J. 2010. Galaxy: a web-based genome analysis toolfor experimentalists. Curr Protoc Mol Biol 89: 19.10.1–19.10.21.
Blow MJ, McCulley DJ, Li Z, Zhang T, Akiyama JA, Holt A, Plajzer-Frick I,Shoukry M, Wright C, Chen F, et al. 2010. ChIP-Seq identification ofweakly conserved heart enhancers. Nat Genet 42: 806–810.
Boyle AP, Davis S, Shulha HP, Meltzer P, Margulies EH, Weng Z, Furey TS,Crawford GE. 2008. High-resolution mapping and characterization ofopen chromatin across the genome. Cell 132: 311–322.
Buac K, Xu M, Cronin J, Weeraratna AT, Hewitt SM, Pavan WJ. 2009. NRG1/ERBB3 signaling in melanocyte development and melanoma: Inhibitionof differentiation and promotion of proliferation. Pigment Cell MelanomaRes 22: 773–784.
Bulger M, Groudine M. 2011. Functional and mechanistic diversity of distaltranscription enhancers. Cell 144: 327–339.
Chalepakis G, Gruss P. 1995. Identification of DNA recognition sequencesfor the Pax3 paired domain. Gene 162: 267–270.
Chepelev I, Wei G, Wangsa D, Tang Q, Zhao K. 2012. Characterization ofgenome-wide enhancer-promoter interactions reveals co-expression ofinteracting genes and modes of higher order chromatin organization.Cell Res 22: 490–503.
Creyghton MP, Cheng AW, Welstead GG, Kooistra T, Carey BW, Steine EJ,Hanna J, Lodato MA, Frampton GM, Sharp PA, et al. 2010. HistoneH3K27ac separates active from poised enhancers and predictsdevelopmental state. Proc Natl Acad Sci 107: 21931–21936.
Cronin JC, Wunderlich J, Loftus SK, Prickett TD, Wei X, Ridd K, Vemula S,Burrell AS, Agrawal NS, Lin JC, et al. 2009. Frequent mutations in theMITF pathway in melanoma. Pigment Cell Melanoma Res 22: 435–444.
Degenhardt KR, Milewski RC, Padmanabhan A, Miller M, Singh MK, Lang D,Engleka KA, Wu M, Li J, Zhou D, et al. 2010. Distinct enhancers at thePax3 locus can function redundantly to regulate neural tube and neuralcrest expressions. Dev Biol 339: 519–527.
Dutton-Regester K, Hayward NK. 2012. Reviewing the somatic genetics ofmelanoma: From current to future analytical approaches. Pigment CellMelanoma Res 25: 144–154.
The ENCODE Project Consortium. 2007. Identification and analysis offunctional elements in 1% of the human genome by the ENCODE pilotproject. Nature 447: 799–816.
Fisher S, Grice EA, Vinton RM, Bessling SL, McCallion AS. 2006a.Conservation of RET regulatory function from human to zebrafishwithout sequence similarity. Science 312: 276–279.
Fisher S, Grice EA, Vinton RM, Bessling SL, Urasaki A, Kawakami K,McCallion AS. 2006b. Evaluating the biological relevance of putativeenhancers using Tol2 transposon-mediated transgenesis in zebrafish.Nat Protoc 1: 1297–1305.
Ghisletti S, Barozzi I, Mietton F, Polletti S, De Santa F, Venturini E, Gregory L,Lonie L, Chew A, Wei CL, et al. 2010. Identification and characterizationof enhancers controlling the inflammatory gene expression program inmacrophages. Immunity 32: 317–328.
Giardine B, Riemer C, Hardison RC, Burhans R, Elnitski L, Shah P, Zhang Y,Blankenberg D, Albert I, Taylor J, et al. 2005. Galaxy: A platform forinteractive large-scale genome analysis. Genome Res 15: 1451–1455.
Goecks J, Nekrutenko A, Taylor J. 2010. Galaxy: A comprehensive approachfor supporting accessible, reproducible, and transparent computationalresearch in the life sciences. Genome Biol 11: R86.
Gupta S, Stamatoyannopoulos JA, Bailey TL, Noble WS. 2007. Quantifyingsimilarity between motifs. Genome Biol 8: R24.
Harris ML, Baxter LL, Loftus SK, Pavan WJ. 2010. Sox proteins inmelanocyte development and melanoma. Pigment Cell Melanoma Res23: 496–513.
He HH, Meyer CA, Shin H, Bailey ST, Wei G, Wang Q, Zhang Y, Xu K, Ni M,Lupien M, et al. 2010. Nucleosome dynamics define transcriptionalenhancers. Nat Genet 42: 343–347.
He A, Kong SW, Ma Q, Pu WT. 2011a. Co-occupancy by multiple cardiactranscription factors identifies transcriptional enhancers active in heart.Proc Natl Acad Sci 108: 5632–5637.
He J, Ye J, Cai Y, Riquelme C, Liu JO, Liu X, Han A, Chen L. 2011b. Structureof p300 bound to MEF2 on DNA reveals a mechanism of enhanceosomeassembly. Nucleic Acids Res 39: 4464–4474.
Heintzman ND, Stuart RK, Hon G, Fu Y, Ching CW, Hawkins RD, Barrera LO,Van Calcar S, Qu C, Ching KA, et al. 2007. Distinct and predictivechromatin signatures of transcriptional promoters and enhancers in thehuman genome. Nat Genet 39: 311–318.
Heintzman ND, Hon GC, Hawkins RD, Kheradpour P, Stark A, Harp LF, Ye Z,Lee LK, Stuart RK, Ching CW, et al. 2009. Histone modifications athuman enhancers reflect global cell-type-specific gene expression.Nature 459: 108–112.
Hindorff LA, Sethupathy P, Junkins HA, Ramos EM, Mehta JP, Collins FS,Manolio TA. 2009. Potential etiologic and functional implications ofgenome-wide association loci for human diseases and traits. Proc NatlAcad Sci 106: 9362–9367.
Hindorff L, MacArthur J, Wise A, Junkins H, Hall P, Klemm A, Manolio T.2011. A catalog of published genome-wide association studies.www.genome.gov/gwastudies.
Hou L, Pavan WJ. 2008. Transcriptional and signaling regulation in neuralcrest stem cell-derived melanocyte development: Do all roads lead toMitf? Cell Res 18: 1163–1176.
Ji H, Jiang H, Ma W, Johnson DS, Myers RM, Wong WH. 2008. An integratedsoftware system for analyzing ChIP-chip and ChIP-seq data. NatBiotechnol 26: 1293–1300.
Kanaykina N, Abelson K, King D, Liakhovitskaia A, Schreiner S, Wegner M,Kozlova EN. 2010. In vitro and in vivo effects on neural crest stem celldifferentiation by conditional activation of Runx1 short isoform and itseffect on neuropathic pain behavior. Ups J Med Sci 115: 56–64.
Kingo K, Aunin E, Karelson M, Ratsep R, Silm H, Vasar E, Koks S. 2008.Expressional changes in the intracellular melanogenesis pathwaysand their possible role in the pathogenesis of vitiligo. J Dermatol Sci 52:39–46.
Gorkin et al.
2300 Genome Researchwww.genome.org
Lang D, Lu MM, Huang L, Engleka KA, Zhang M, Chu EY, Lipner S, SkoultchiA, Millar SE, Epstein JA. 2005. Pax3 functions at a nodal point inmelanocyte stem cell differentiation. Nature 433: 884–887.
Lee TI, Johnstone SE, Young RA. 2006. Chromatin immunoprecipitation andmicroarray-based analysis of protein location. Nat Protoc 1: 729–748.
Lee D, Karchin R, Beer MA. 2011. Discriminative prediction of mammalianenhancers from DNA sequence. Genome Res 21: 2167–2180.
Lin JY, Fisher DE. 2007. Melanocyte biology and skin pigmentation. Nature445: 843–850.
Liu T, Ortiz JA, Taing L, Meyer CA, Lee B, Zhang Y, Shin H, Wong SS, Ma J, LeiY, et al. 2011. Cistrome: An integrative platform for transcriptionalregulation studies. Genome Biol 12: R83. doi: 10.1186/gb-2011-12-8-r83.
Loftus SK, Antonellis A, Matera I, Renaud G, Baxter LL, Reid D, Wolfsberg TG,Chen Y, Wang C, Prasad MK, et al. 2009. Gpnmb is a melanoblast-expressed, MITF-dependent gene. Pigment Cell Melanoma Res 22: 99–110.
McGaughey DM, Vinton RM, Huynh J, Al-Saif A, Beer MA, McCallion AS.2008. Metrics of sequence constraint overlook regulatory sequences inan exhaustive analysis at phox2b. Genome Res 18: 252–260.
McKusick VA. 1998. Mendelian inheritance in man. A catalogue ofhuman genes and genetic disorders. Johns Hopkins University Press,Baltimore, MD.
McLean CY, Bristor D, Hiller M, Clarke SL, Schaar BT, Lowe CB, Wenger AM,Bejerano G. 2010. GREAT improves functional interpretation of cis-regulatory regions. Nat Biotechnol 28: 495–501.
Mizutani Y, Hayashi N, Kawashima M, Imokawa G. 2010. A single UVBexposure increases the expression of functional KIT in humanmelanocytes by up-regulating MITF expression through thephosphorylation of p38/CREB. Arch Dermatol Res 302: 283–294.
The modENCODE Project Consortium. 2009. Unlocking the secrets of thegenome. Nature 459: 927–930.
Murisier F, Guichard S, Beermann F. 2007. The tyrosinase enhancer isactivated by Sox10 and Mitf in mouse melanocytes. Pigment Cell Res 20:173–184.
Nolis IK, McKay DJ, Mantouvalou E, Lomvardas S, Merika M, Thanos D.2009. Transcription factors mediate long-range enhancer-promoterinteractions. Proc Natl Acad Sci 106: 20222–20227.
Noonan JP, McCallion AS. 2010. Genomics of long-range regulatoryelements. Annu Rev Genomics Hum Genet 11: 1–23.
Ong CT, Corces VG. 2011. Enhancer function: New insights into theregulation of tissue-specific gene expression. Nat Rev Genet 12: 283–293.
Panne D, Maniatis T, Harrison SC. 2007. An atomic model of the interferon-beta enhanceosome. Cell 129: 1111–1123.
Phillips JE, Corces VG. 2009. CTCF: Master weaver of the genome. Cell 137:1194–1211.
Prasad MK, Reed X, Gorkin DU, Cronin JC, McAdow AR, Chain K, HodonskyCJ, Jones EA, Svaren J, Antonellis A, et al. 2011. SOX10 directlymodulates ERBB3 transcription via an intronic neural crest enhancer.BMC Dev Biol 11: 40. doi: 10.1186/1471-213X-11-40.
Raveh E, Cohen S, Levanon D, Groner Y, Gat U. 2005. Runx3 is involved inhair shape determination. Dev Dyn 233: 1478–1487.
Saha B, Singh SK, Sarkar C, Bera R, Ratha J, Tobin DJ, Bhadra R. 2006.Activation of the Mitf promoter by lipid-stimulated activation of p38-stress signalling to CREB. Pigment Cell Res 19: 595–605.
Silver DL, Hou L, Pavan WJ. 2006. The genetic regulation of pigment celldevelopment. Adv Exp Med Biol 589: 155–169.
Song L, Crawford GE. 2010. DNase-seq: A high-resolution technique formapping active gene regulatory elements across the genome frommammalian cells. Cold Spring Harb Protoc doi: 10.1101/pdb.prot5384.
Song L, Zhang Z, Grasfeder LL, Boyle AP, Giresi PG, Lee BK, Sheffield NC,Graf S, Huss M, Keefe D, et al. 2011. Open chromatin defined by DNase Iand FAIRE identifies regulatory elements that shape cell-type identity.Genome Res 21: 1757–1767.
Stolt CC, Lommes P, Hillgartner S, Wegner M. 2008. The transcription factorSox5 modulates Sox10 function during melanocyte development.Nucleic Acids Res 36: 5427–5440.
Sviderskaya EV, Hill SP, Evans-Whipp TJ, Chin L, Orlow SJ, Easty DJ, CheongSC, Beach D, DePinho RA, Bennett DC. 2002. p16Ink4a in melanocytesenescence and differentiation. J Natl Cancer Inst 94: 446–454.
Swope VB, Medrano EE, Smalara D, Abdel-Malek ZA. 1995. Long-termproliferation of human melanocytes is supported by the physiologicmitogens a-melanotropin, endothelin-1, and basic fibroblast growthfactor. Exp Cell Res 217: 453–459.
Tada A, Pereira E, Beitner-Johnson D, Kavanagh R, Abdel-Malek ZA. 2002.Mitogen- and ultraviolet-B-induced signaling pathways in normalhuman melanocytes. J Invest Dermatol 118: 316–322.
Thomas AJ, Erickson CA. 2008. The making of a melanocyte: Thespecification of melanoblasts from the neural crest. Pigment CellMelanoma Res 21: 598–610.
Visel A, Blow MJ, Li Z, Zhang T, Akiyama JA, Holt A, Plajzer-Frick I, ShoukryM, Wright C, Chen F, et al. 2009a. ChIP-seq accurately predicts tissue-specific activity of enhancers. Nature 457: 854–858.
Visel A, Rubin EM, Pennacchio LA. 2009b. Genomic views of distant-actingenhancers. Nature 461: 199–205.
Wang Z, Zang C, Cui K, Schones DE, Barski A, Peng W, Zhao K. 2009.Genome-wide mapping of HATs and HDACs reveals distinct functionsin active and inactive genes. Cell 138: 1019–1031.
Yasumoto K, Mahalingam H, Suzuki H, Yoshizawa M, Yokoyama K. 1995.Transcriptional activation of the melanocyte-specific genes by the humanhomolog of the mouse Microphthalmia protein. J Biochem 118: 874–881.
Zhang Y, Liu T, Meyer CA, Eeckhoute J, Johnson DS, Bernstein BE, NusbaumC, Myers RM, Brown M, Li W, et al. 2008. Model-based analysis of ChIP-Seq (MACS). Genome Biol 9: R137. doi: 10.1186/gb-2008-9-9-r137.
Received February 17, 2012; accepted in revised form July 5, 2012.
Enhancer discovery and regulatory vocabulary
Genome Research 2301www.genome.org


![Screening reveals conserved and nonconserved ... · HCR2 [12], associated with the APOE/C1/C4/C2 gene cluster were identified, as well as two astrocyte enhancers, ME1 and ME2 [13],](https://img.dokumen.tips/doc/110x75/608ca25ca8ef31749d2a7acb/screening-reveals-conserved-and-nonconserved-hcr2-12-associated-with-the.jpg)