Embed Size (px)
Citation preview

Integration of a Thermal Imaging Feedback Control System in Electron Beam Melting
Emmanuel Rodriguez1, Francisco Medina1, David Espalin1, Cesar Terrazas1, Dan Muse1, Chad Henry2, Eric MacDonald1,
and Ryan B. Wicker1
1W.M. Keck Center for 3D Innovation, The University of Texas at El Paso, El Paso, TX 79968, USA
2Lockheed Martin Aeronautics Company, Marietta, GA 30063, USA
Abstract
A thermal imaging system using an infrared (IR) camera was incorporated in the
fabrication process of an Arcam A2 Electron Beam Melting system to provide layer-by-layer
feedback and ensure quality and defect free products. Using the IR camera, build chamber
surface temperature profiles were imaged and analyzed, providing information used to modify
build settings for the next build layer. Individual part temperatures were also monitored and
modified to achieve a more uniform bed temperature. The thermal imaging information can also
be used as a quality control tool to detect imperfections during the build. Results from the
integration of the camera in the system as well as use of the thermal images in process
monitoring and control is described.
Introduction
The Electron Beam Melting (EBM) process is a promising technology in the rapid
manufacturing of metal components. EBM has the potential to reduce the cost of metal parts by
minimizing the use of raw materials and machining time. The EBM technology has several
advantages over other additive manufacturing (AM) technologies of metal, such as
manufacturing speed and mechanical properties of the finished parts. For the process to be
accepted in the aerospace industry as a flight-ready manufacturing technology, however,
improved control and feedback must be implemented in the building process for better part
quality and manufacturing repeatability. As part of this research, an IR imaging system was
implemented in an Arcam A2 EBM system providing another level of control for the EBM
process that could lead to rapid certification of flight-ready parts.
The EBM technology is a relatively new direct-metal freeform fabrication process that
has been commercialized by Arcam [1]. The machine uses a metal powder (10 µm- 160 µm
diameter) to build solid parts in layer-wise fashion inside a vacuum chamber maintained at
(Figure 1) by following 4 steps: 1) spreading a layer of metal powder
(typically in the range 0.05 – 0.20 mm thick) across the build platform by using the machine’s
raking mechanism, 2) preheating the layer to approximately 50% of the metal’s melting
temperature (760°C for Ti6Al4V) using the electron beam gun at relatively low beam current and
high scan speed (the preheating step lightly sinters the metal powder to hold it in place for
subsequent melting and also transmits heat to the part that helps maintain a low thermal gradient
945

between the melted layer and the rest of the part- greatly reducing residual stresses),
3) selectively melting the preheated powder by increasing the beam power and reducing the scan
speed to effectively reach the material’s melting point, and 4) lowering the build platform an
amount equal to one layer thickness [1]. The process is repeated until the part is complete.
In thermodynamics, temperature is an important state variable that can be used to help
determine energy states as well as assist in determination of heat transfer, and as a result, the
measurement, monitoring, and control of temperature is an important variable in the evolution of
the metal during EBM fabrication. The distribution of temperatures on the powder bed surface
of the EBM platform should be as uniform as possible to achieve equal part quality,
characteristics, and properties [1]. However, the lack of spatial feedback of temperature from the
A2 system (since a single thermocouple located below the build plate is used to monitor
temperature) leads to the notion of non-uniform temperature distribution within the build
chamber. As a result, a reliable temperature monitoring system is desired to more effectively
control build temperatures during fabrication. Infrared (IR) thermal imaging has been chosen as
the most suitable feedback system for this application due to the ability of measuring two-
dimensional surface temperatures and inspection capabilities of part defects. Moreover,
correlations between process build parameters and the temperature of the melt pool can be
determined with thermal imaging [2].
The focus of the current project is to obtain true temperatures from the IR images
acquired. Using the measured temperatures, real-time individual part parameter modification
was implemented to achieve a more uniform temperature surface for all parts in the build. Real
temperature measurements may also be used, although not the focus of the current project, to
make a correlation between a part’s mechanical properties and microstructure. Recent work has
been successful in identifying part defects with the use of thermal imagery [3], a brief
investigation on the methodology of quantifying these defects and correcting them in successive
layers in real-time is also discussed.
946
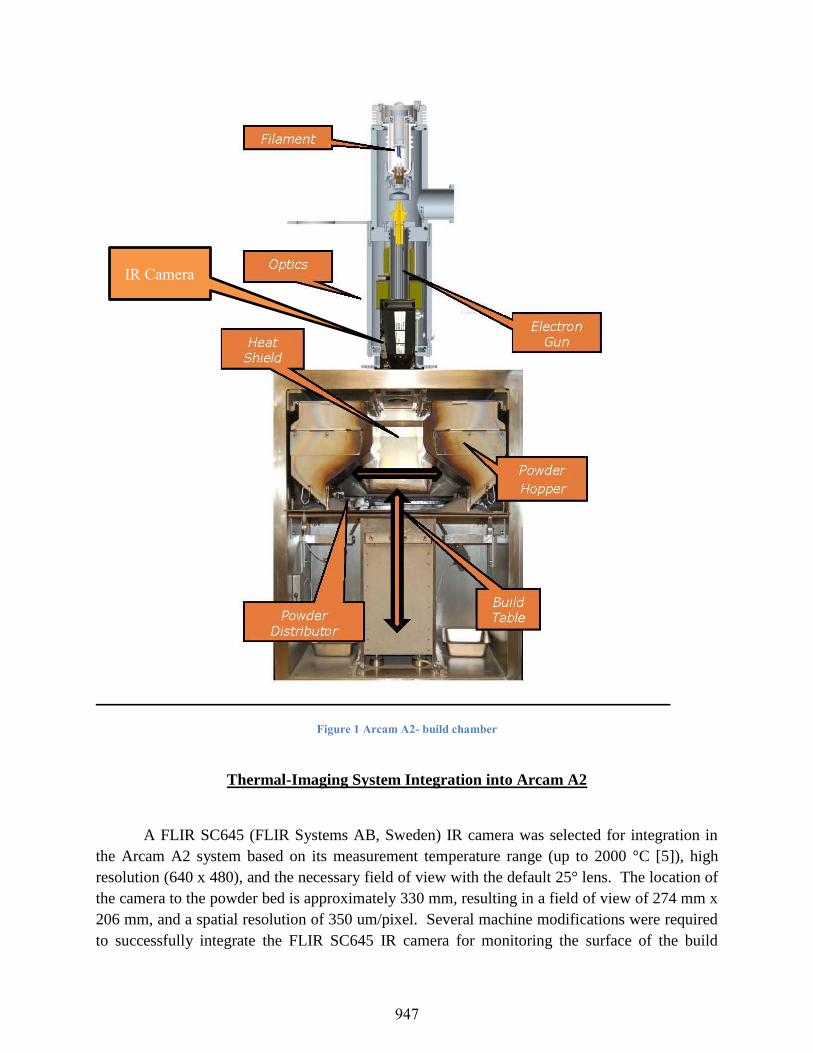
Figure 1 Arcam A2- build chamber
Thermal-Imaging System Integration into Arcam A2
A FLIR SC645 (FLIR Systems AB, Sweden) IR camera was selected for integration in
the Arcam A2 system based on its measurement temperature range (up to 2000 °C [5]), high
resolution (640 x 480), and the necessary field of view with the default 25° lens. The location of
the camera to the powder bed is approximately 330 mm, resulting in a field of view of 274 mm x
206 mm, and a spatial resolution of 350 um/pixel. Several machine modifications were required
to successfully integrate the FLIR SC645 IR camera for monitoring the surface of the build
IR Camera
947

chamber. First, there were a number of items removed to make way for the drilling of new holes
for the flap mechanism and actuator. The upper and lower chamber door cowling, column turbo
pump, and column assembly with film drive were all removed. Five precise (±0.02 mm) holes
were drilled atop the build chamber. It is important to note that these holes were drilled with
circumspection to preserve the high vacuum requirements ( ) within the
electron beam melting build chamber. The components were then reinstalled, and an additional
chamber frame that is used to hold the FLIR camera mount was also put in place.
Several components were required to be incorporated into the modified system to make
the acquisition of IR images of the system’s build surface possible (Figure 2). A zinc-selenide
(ZnSe) glass with O-rings above and below the glass replaced the system’s film camera. The
ZnSe glass is the viewing window of the camera allowing transmittance in the IR spectrum. The
transmittance was calculated to be 94% by measuring the temperature of a hot plate in the
chamber - with and without the window for comparison. The ZnSe window needs to be
protected from metallization during the melting process, and to do this, a protective flap that acts
as a shutter was installed inside the chamber. The flap is held in place with a feed-thru
mechanism, sealed with an O-ring, and a feed-thru collar holds this in place. A pneumatic piston
is used to open and close the shutter (flap) to permit image capture when the beam is off. Air
supply is connected to the input regulator on the pneumatic panel. The pneumatic panel is
powered by tapping into the chamber vacuum gauge in the wire breakout panel on the wall of the
chamber cabinet. A parallel cable is run from the D-sub connector in the electronics rack to the
connection box on the pneumatic panel and the pneumatic piston is connected to the pneumatic
panel. Once powered, the flap is in the closed position and the micro-switch is in the ‘normally
closed’ state allowing the beam to become active. The IR camera is now put in position for
image capture as shown in Figures 1 and 2. The angle between the camera and the surface
normal is 25°, which according to the IR camera’s manufacturer, an angle below 30° will neglect
the effect of temperature deviation between the measured temperature and the real temperature
value [5].
948

Figure 2 Top of Arcam-A2’s build chamber with new component location and IR-camera
In order to automate the opening of the flap mechanism (or shutter), monitoring of a
voltage signal from the Arcam system was required. This signal was received and interpreted by
a modular controller from National Instruments (NI cRIO-9074, Austin, TX). These signals
were then incorporated into the standard process steps (first is a preheat step, followed by the
melt step) for a given layer. There are three different process signals that can be used during the
build process for a layer. For example, signal one can be assigned to assert before the preheat
step, signal two before the melt, and signal three after the melt. A collaborative effort with
Arcam AB resulted in a new version of the EBM Control software that allows the selection of
these process steps to be incorporated into the standard process step cycle. Figure 3 is a
schematic of the architecture for the IR feedback control in the A2 system.
To complete the implementation of a feedback control system, the next step was to
intercept the output signals from the A2’s output module. The intercepted signal is fed to an
electromechanical relay (opens/closes the flap mechanism) that connects to the modular
controller. The NI cRIO-9074 controller is the central unit for feedback from the A2 system.
This unit allowed the attachment of various modules to realize tasks such as measuring signals
and issuing commands. Once the controller received the signal to open the shutter, LabVIEW
Retaining ring
w/two O-rings
FLIR SC645 IR-camera
ZnSe glass
Feed-thru collar
Flap mechanism
feed-thru
Pneumatic piston Micro-switch
949

was used to program the IR camera to render a snapshot of the surface bed. Thermal images are
recorded, archived, processed and analyzed.
Figure 3 Architecture for IR feedback control in Arcam A2 system
IR Camera Calibration
The FLIR SC645 used here images and measures the emitted IR radiation from an object.
As shown in Figure 4, the radiation measured by the camera is made up of emission from the
object , reflected emission from ambient sources , and emission from the
atmosphere . For the camera to measure temperature accurately, the following
parameters are required to be known and supplied to the camera: emissivity of the object,
reflected apparent temperature, and temperature of the atmosphere.
EBM
main module
Start of Build Process
Voltage signal from custom
EBM Control software
NI 9481
electromechanical
relay
NI 9411 6-channel
differential digital
input module
NI compactRIO-9074
modular controller
LabVIEW VI for
image acquisition
and processing
Defect?
Non-uniform temp.?
Y
N
Operator: modify
parameters
FLIR SC645
infrared camera
950

Figure 4 A schematic representation of the general thermographic measurement situation. 1: Surroundings, 2: Object,
3: Atmosphere, 4:Camera. Courtesy: FLIR Systems AB
Figure 4 shows three different sources of power W that the IR camera receives and
translates to a camera signal U that is proportional to the power input (power linear camera) [5].
The signal U is obtained by multiplying a constant C (FLIR Systems AB) by the radiation power
W [4]. The total received radiation power can now be written in terms of the total measured
camera output voltage
Here, ε is the emissivity of the object and τ is the transmittance of the atmosphere. By supplying
the IR camera with the required parameters, the FLIR Systems thermographic equipment will use
the above general formula to solve for . is the calculated camera output voltage for a
blackbody of temperature - a voltage that can be directly converted into true requested object
temperature [5].
Creating a blackbody specimen
An isothermal cavity heated to a uniform temperature generates blackbody radiation,
called a cavity radiator, the characteristics of which are determined solely by the temperature of
the cavity. This cavity radiator becomes a necessary tool when determining material radiation
characteristics and for calibrating thermographic instruments such as an IR camera.
The construction of a blackbody source is simple. A common blackbody used in IR
measurements is a cavity with a small opening (Figure 4). This cavity-type blackbody will have
radiation coming in through the opening and undergoes multiple reflections once inside allowing
for the radiation to be reflected by the interior surfaces of the cavity before the radiation can
escape [6]. The level of blackness, or emissivity, obtained at the aperture is 99.4 ± 0.2 [7] using
951
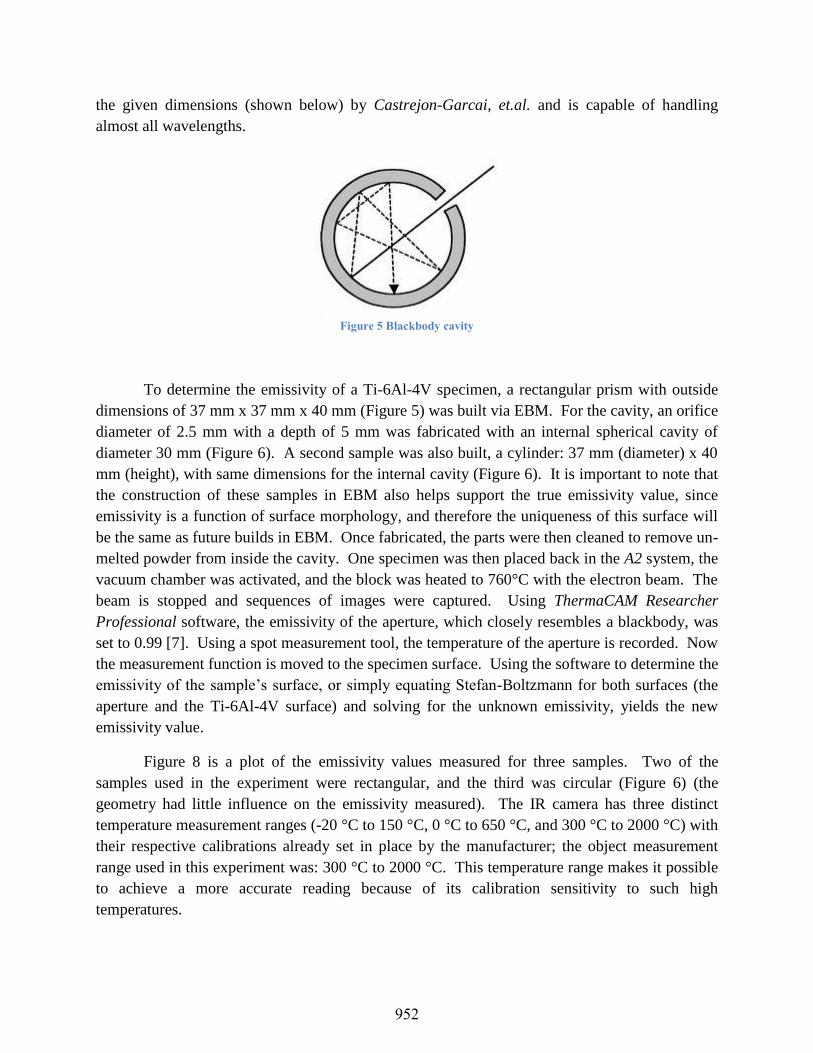
the given dimensions (shown below) by Castrejon-Garcai, et.al. and is capable of handling
almost all wavelengths.
Figure 5 Blackbody cavity
To determine the emissivity of a Ti-6Al-4V specimen, a rectangular prism with outside
dimensions of 37 mm x 37 mm x 40 mm (Figure 5) was built via EBM. For the cavity, an orifice
diameter of 2.5 mm with a depth of 5 mm was fabricated with an internal spherical cavity of
diameter 30 mm (Figure 6). A second sample was also built, a cylinder: 37 mm (diameter) x 40
mm (height), with same dimensions for the internal cavity (Figure 6). It is important to note that
the construction of these samples in EBM also helps support the true emissivity value, since
emissivity is a function of surface morphology, and therefore the uniqueness of this surface will
be the same as future builds in EBM. Once fabricated, the parts were then cleaned to remove un-
melted powder from inside the cavity. One specimen was then placed back in the A2 system, the
vacuum chamber was activated, and the block was heated to 760°C with the electron beam. The
beam is stopped and sequences of images were captured. Using ThermaCAM Researcher
Professional software, the emissivity of the aperture, which closely resembles a blackbody, was
set to 0.99 [7]. Using a spot measurement tool, the temperature of the aperture is recorded. Now
the measurement function is moved to the specimen surface. Using the software to determine the
emissivity of the sample’s surface, or simply equating Stefan-Boltzmann for both surfaces (the
aperture and the Ti-6Al-4V surface) and solving for the unknown emissivity, yields the new
emissivity value.
Figure 8 is a plot of the emissivity values measured for three samples. Two of the
samples used in the experiment were rectangular, and the third was circular (Figure 6) (the
geometry had little influence on the emissivity measured). The IR camera has three distinct
temperature measurement ranges (-20 °C to 150 °C, 0 °C to 650 °C, and 300 °C to 2000 °C) with
their respective calibrations already set in place by the manufacturer; the object measurement
range used in this experiment was: 300 °C to 2000 °C. This temperature range makes it possible
to achieve a more accurate reading because of its calibration sensitivity to such high
temperatures.
952

Figure 6 Wire frame view (with hidden lines) of blackbody cavity model specimen-cylinder (left) and rectangular
prism (right)
Figure 7 IR image of blackbody cavity (seen here is the orifice)
30 mm
30 mm
ᴓ 2.5 mm
ᴓ 2.5 mm
40 mm
40 mm
37 mm
ᴓ 37 mm
37 mm
Ti-6Al-4V specimen
Blackbody cavity
953
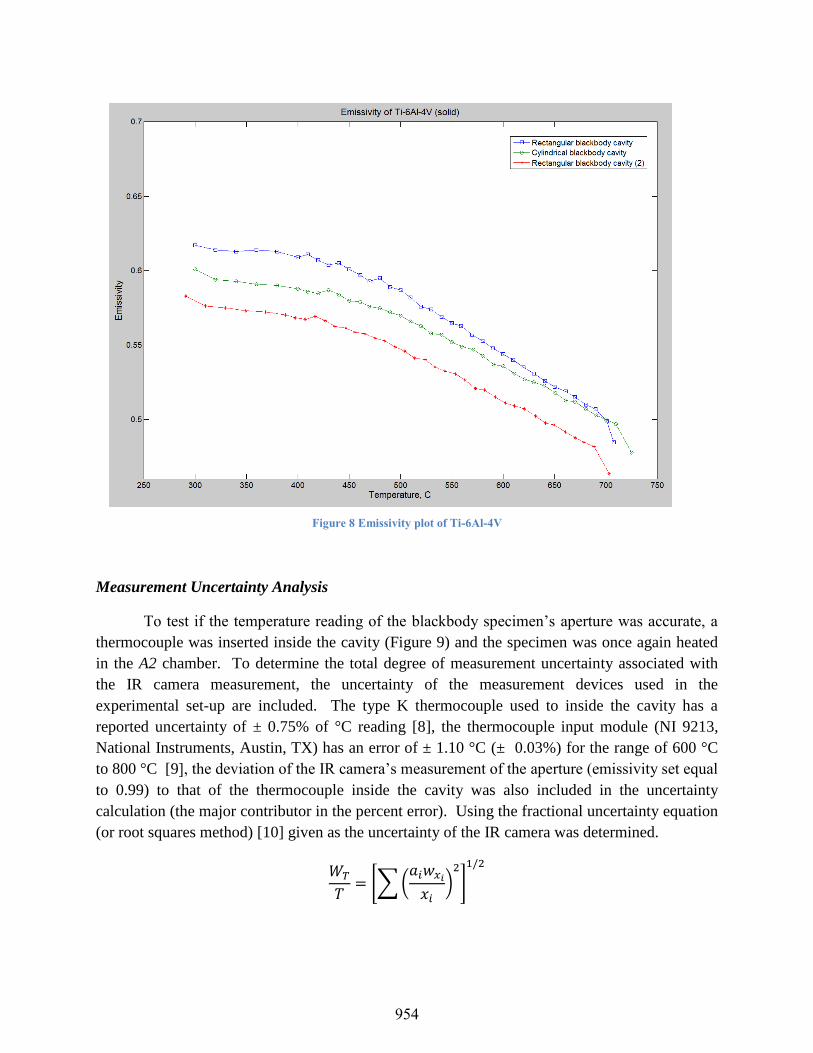
Figure 8 Emissivity plot of Ti-6Al-4V
Measurement Uncertainty Analysis
To test if the temperature reading of the blackbody specimen’s aperture was accurate, a
thermocouple was inserted inside the cavity (Figure 9) and the specimen was once again heated
in the A2 chamber. To determine the total degree of measurement uncertainty associated with
the IR camera measurement, the uncertainty of the measurement devices used in the
experimental set-up are included. The type K thermocouple used to inside the cavity has a
reported uncertainty of ± 0.75% of °C reading [8], the thermocouple input module (NI 9213,
National Instruments, Austin, TX) has an error of ± 1.10 °C (± 0.03%) for the range of 600 °C
to 800 °C [9], the deviation of the IR camera’s measurement of the aperture (emissivity set equal
to 0.99) to that of the thermocouple inside the cavity was also included in the uncertainty
calculation (the major contributor in the percent error). Using the fractional uncertainty equation
(or root squares method) [10] given as the uncertainty of the IR camera was determined.
[∑(
)
]
954

Where is the uncertainty of the instrument, and is the coefficient of the variable used in
the respective measurement equation. At the given camera angle, location, and viewing window,
the IR camera uncertainty is approximated to be ± 5.0% in the temperature range of 465 °C to
760 °C or ± 35 °C at 760 °C - the temperature maintained for Ti-6Al-4V during the build
process. It is important to note that there are other possible sources of error that were not
included in the calculation, and further work will include identifying these sources, and
improving on the experimental set-up to minimize this error calculation.
Figure 9 Blackbody cavity radiator with internal thermocouple
Image Analysis
Currently the analysis of images is being carried out manually. The raw images are
acquired and uploaded to ThermaCAM Researcher where the operator evaluates the images for
defects (Figure 10) and non-homogeneous temperature gradients. Figure 10 shows an IR image
of cylinders being fabricated of a non-standard material, during the course of build parameter
development, it was seen that the build temperature was too high causing the parts to swell, or
over-melt.
A part with non-uniform temperature distribution is associated with a defect, sometimes
referred to as ‘cold-spots.’ These cold spots will appear in a darker color due to lower-IR
emission, a result of a lower temperature or lower local emissivity [3]. Histogram analysis
proves an effective method of quantifying these regions of interest (Figure 11). A part with a
more consistent temperature will have a higher concentration of pixels within a smaller
temperature range, and part with cold-spots will have a higher temperature range of pixel
distribution.
Thermocouple
Cavity
Orifice
Ti-6Al-4V blackbody specimen
955
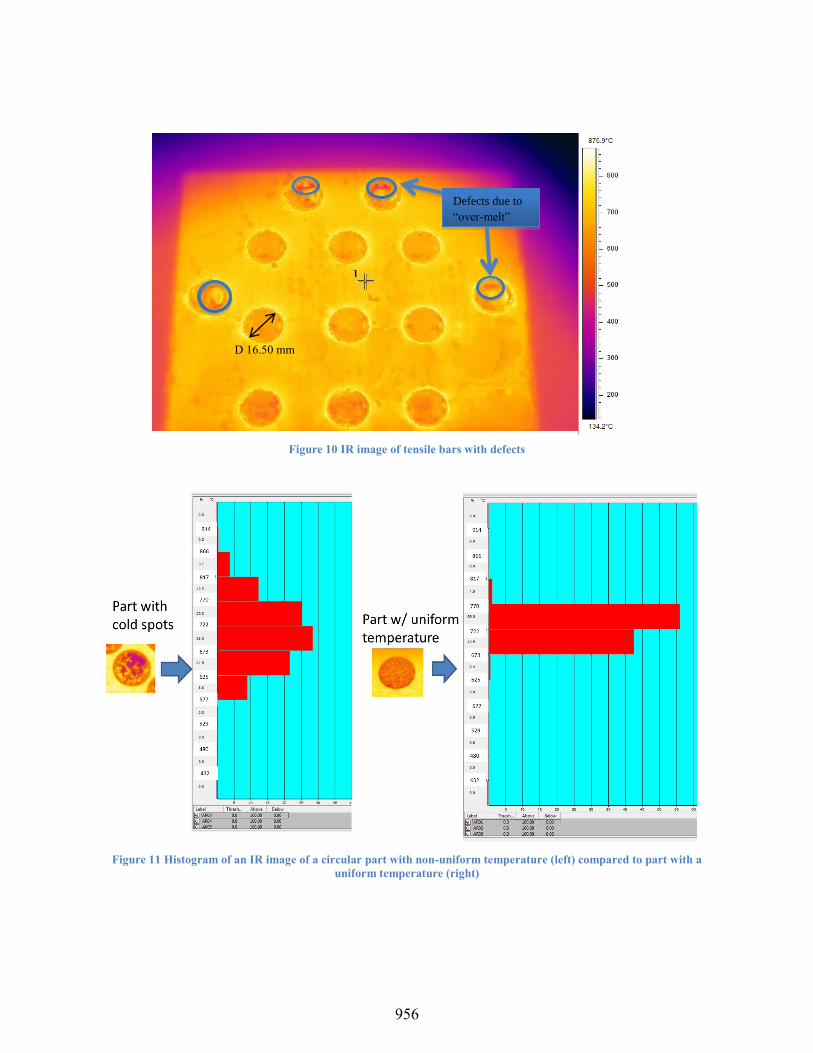
Figure 10 IR image of tensile bars with defects
Figure 11 Histogram of an IR image of a circular part with non-uniform temperature (left) compared to part with a
uniform temperature (right)
Defects due to
“over-melt”
D 16.50 mm
956
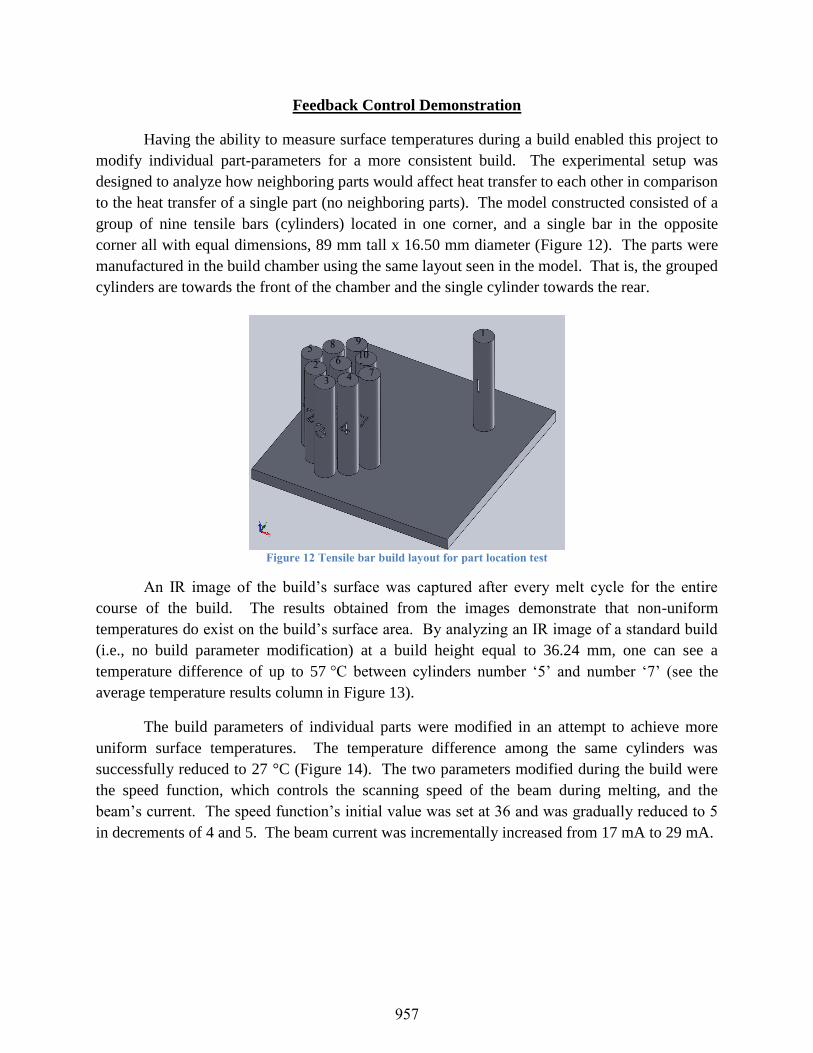
Feedback Control Demonstration
Having the ability to measure surface temperatures during a build enabled this project to
modify individual part-parameters for a more consistent build. The experimental setup was
designed to analyze how neighboring parts would affect heat transfer to each other in comparison
to the heat transfer of a single part (no neighboring parts). The model constructed consisted of a
group of nine tensile bars (cylinders) located in one corner, and a single bar in the opposite
corner all with equal dimensions, 89 mm tall x 16.50 mm diameter (Figure 12). The parts were
manufactured in the build chamber using the same layout seen in the model. That is, the grouped
cylinders are towards the front of the chamber and the single cylinder towards the rear.
Figure 12 Tensile bar build layout for part location test
An IR image of the build’s surface was captured after every melt cycle for the entire
course of the build. The results obtained from the images demonstrate that non-uniform
temperatures do exist on the build’s surface area. By analyzing an IR image of a standard build
(i.e., no build parameter modification) at a build height equal to 36.24 mm, one can see a
temperature difference of up to 57 °C between cylinders number ‘5’ and number ‘7’ (see the
average temperature results column in Figure 13).
The build parameters of individual parts were modified in an attempt to achieve more
uniform surface temperatures. The temperature difference among the same cylinders was
successfully reduced to 27 °C (Figure 14). The two parameters modified during the build were
the speed function, which controls the scanning speed of the beam during melting, and the
beam’s current. The speed function’s initial value was set at 36 and was gradually reduced to 5
in decrements of 4 and 5. The beam current was incrementally increased from 17 mA to 29 mA.
1
2
3 4
5
5 6
5 7
5
85
9
5 105
957
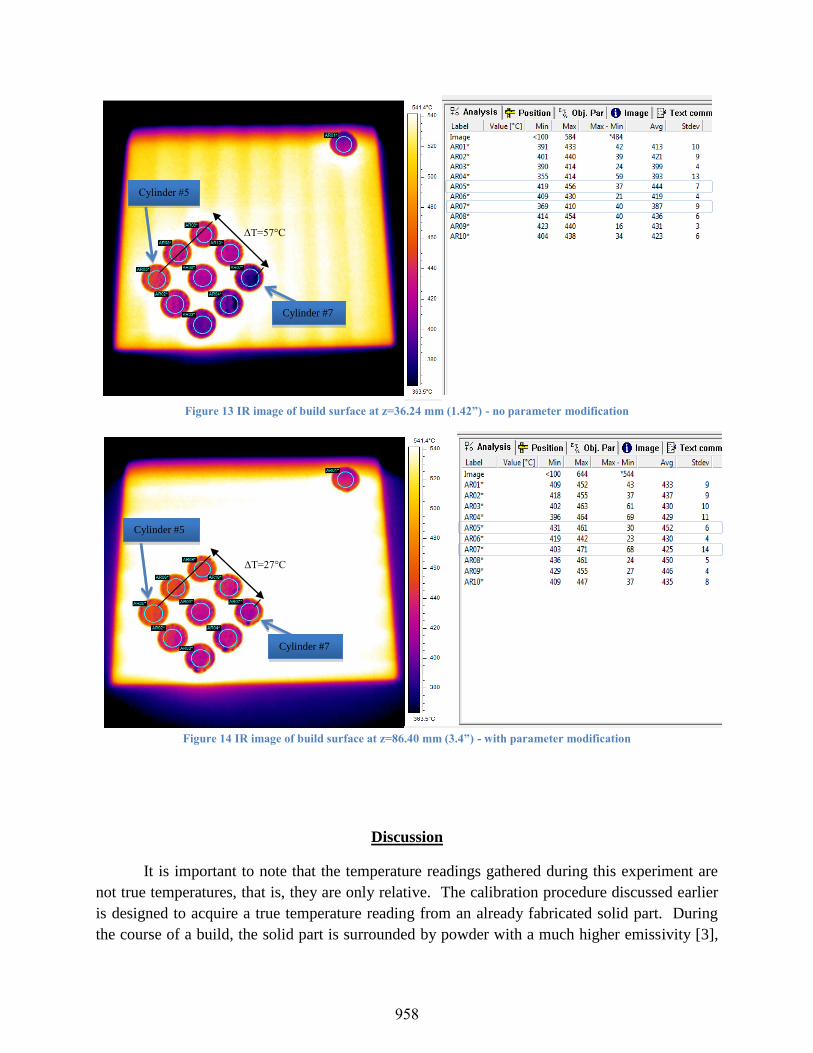
Figure 13 IR image of build surface at z=36.24 mm (1.42”) - no parameter modification
Figure 14 IR image of build surface at z=86.40 mm (3.4”) - with parameter modification
Discussion
It is important to note that the temperature readings gathered during this experiment are
not true temperatures, that is, they are only relative. The calibration procedure discussed earlier
is designed to acquire a true temperature reading from an already fabricated solid part. During
the course of a build, the solid part is surrounded by powder with a much higher emissivity [3],
Cylinder #5
Cylinder #7
ΔT=57°C
Cylinder #5
Cylinder #7
ΔT=27°C
958
which contributes to the reflective sources that the camera reads. This emissivity difference is
evident in Figures 13 and 14 where the powder surrounding the parts appears to be hotter
(brighter color) than the part (darker color), when in fact it is the recently melted part that is
hotter. There is also transient temperature decay factors that need to be researched further, as
this may significantly affect measurements obtained, since a single image is captured only after
all parts have been melted, the parts melted first in the cycle may experience some decay in
temperature and may have a lower temperature than those melted last (e.g. cylinder ‘1’ may be
melted first, and cylinder ‘3’ last).
Further work is needed to obtain the emissivity of the metal powder – the main
contributor to the reflective temperature. Additionally, knowing the emissivity of the powder will
allow for the measurement of the heat up rate of the newly deposited powder layer on the part
surface to investigate and verify quality of the powder before it goes through the melt cycle.
More work is also needed to further test this hypothesis and determine if the temperature
differences measured (e.g. ΔT=57°C) affect part quality, microstructure - mechanical testing,
SEM, and metallographic analyses can be used for these analyses.
Future Work
Future work with the EBM and IR camera integration will consist of activities which
allow both the systematic detection of macro-defects as well as correlation of microstructural
anomalies and defects with thermal history data. Also planned is the development of a predictive
control system whereby data from each IR image will be used as initial values in numerically
solved parabolic differential equations to predict surface temperature evolution between electron
beam scans. This will allow intervention of the build process and spatial adjustments in electron
beam intensity to ensure compliant temperature profiles are maintained throughout the build
process.
The strategy for macro-defect detection involves a digital comparison of thermal images
from each layer of the build to target images developed from the build information file. A
threshold of acceptance will be determined experimentally and applied to a detection algorithm.
The determination of a defect can either take place during part fabrication or after the build is
complete. In the first case, a detected defect may result in the interruption of the build process
pending input from the system user. The output of this detection system will be a report
indicating part acceptance or rejection. Post-build part inspections (destructive and non-
destructive) will confirm effectiveness of the detection system. The study of resulting
microstructure and correlation to the EBM process will require statistically valid sampling of
specimen micrographs mapped to their location within the part and orientation relative to the part
build axis. This correlation activity will also include appropriate mechanical testing to
complement study of microstructure.
959
Of utmost significance in the integration of thermal imaging capability with the EBM
system is the possibility of developing a real-time predictive control system. The nature of the
build process is such that ample time is available between beam cycles to allow numerical
processes to be carried out and beneficial changes to be made to process parameters. Together
with experimentally determined properties such as emissivity and thermal conductivity of the
metal powders (and the consolidated regions), temperature data captured immediately after a
scan can be used to simulate the thermal environment as it evolves prior to electron beam
scanning on the subsequent layer. Initial efforts in this direction will involve the use of a PC
running LabVIEW®, custom simulation and control software, and a Digital Signal Processor
(DSP) development kit. Ultimately, a stand-alone system will be developed using a Field
Programmable Gate Array (FPGA) and DSP chip along with other needed components
Also, the development of a procedure to determine the metal-powder emissivity, which
will help accurately quantify the entire surface temperatures. Additionally, fundamental
correlations between process parameters, the melt’s temperature, part placement, and the part
properties should be established. A thorough investigation of the transient heat transfer
dynamics occurring inside the vacuum chamber will also be investigated.
Conclusions
A thermal imaging system was successfully integrated into the Arcam A2 EBM system.
To achieve the objective of acquiring temperature distributions on the surface bed, solutions and
procedures were developed such as installing an IR camera within the Arcam A2 EBM system
and determining the emissivity of a metal sample constructed in the EBM process. Determining
the emissivity of an EBM fabricated part allows for temperature reading with a certainty of ± 5%
with the current experimental setup, but more work is needed to account for other influencing
factors that may minimize this uncertainty.
An automated solution was developed to acquire IR images during the build.
Additionally, influencing factors (e.g. part placement, neighboring parts) on the non-uniformity
of the surface temperature were explored. The immediate benefits of the incorporated thermal
imaging system include the in-process identification of over-melting, temperature distribution
magnitudes, internal part defects, and temperature gradient control– all of which have an effect
on part quality. Thermal imaging is a suitable feedback monitoring system for this powder bed
process. Thermal imaging will enable measurement of the effects of process parameters (such as
speed function and beam’s current) on the melt temperature, therefore allowing the
implementation of layer-by-layer build modifications to maintain uniform or prescribed
temperature distributions within the build chamber, resulting in improved and more controlled
part quality.
960

References
[1] Cormier, D., Harryson, O., West., H., (2004). Characterization of H13 steel produced via
electron beam melting. Rapid prototyping journal, vol. 10, 1, pp. 35-41.
[2] Weger, A., Witt, G., (2011). Process monitoring in laser sintering using thermal imaging.
German Research Foundation DFG, pp. 405-414.
[3] Schwerdtfeger, J., Singer, R.F., Körner, C. (2012). In situ flaw detection by IR-imaging
during electron beam melting. Rapid Prototyping Journal, Vol. 18, 4, pp. 259-263.
[4] Maldague, X.P.V. (2001). Theory and practice of infrared technology for nondestructive
testing. New York, NY: John Wiley & Sons, Inc.
[5] FLIR’s User Manual- Thermacam Research Professional 2.10 (2010).
[6] Cengel, Y.A. (2007). Heat and mass transfer: A practical approach. New York, NY:
McGraw-Hill.
[7] Castrejon-Garcia, R., Castrejon-Pita, J.R., Castrejon-Pita, A.A. (2010). Design, development,
and evaluation of a simple blackbody radiative source. AIP Review of Scientific
Instruments.
[8] Nakos, J.T. (2004). Uncertainty analysis of thermocouple measurements used in normal and
abnormal thermal environments at Sandia’s Radiant Heat Facility and Lurance Canyon
Burn Site. Albuquerque, NM: Sandia National Laboratories.
[9] N.I. (2009. NI 9213 Operating instructions and specifications. National Instruments.
[10] Holman, J.P. (2001). Experimental methods for engineers. Boston, MA: McGraw-Hill.
[11] Klinger, T., (2003). Image processing with labview and IMAQ vision. Upper Saddle River,
NJ: Prentice Hall.
[12] Cormier, D., Harryson, O., West., H., (2004). Characterization of H13 steel produced via
electron beam melting. Rapid Prototyping Journal, Vol. 10, 1, pp. 35-41.
[13] Elfstrom, I. (2011). EBM Process. Power point presentation.
961