Embed Size (px)
Citation preview

University of South FloridaScholar Commons
Graduate Theses and Dissertations Graduate School
April 2018
Integration and Cross-Coupling of a Notched-Turbine Symbiotic Power Source for ImplantableMedical DevicesSamuel PerezUniversity of South Florida, [email protected]
Follow this and additional works at: http://scholarcommons.usf.edu/etd
Part of the Biomedical Engineering and Bioengineering Commons, Electrical and ComputerEngineering Commons, and the Other Education Commons
This Dissertation is brought to you for free and open access by the Graduate School at Scholar Commons. It has been accepted for inclusion inGraduate Theses and Dissertations by an authorized administrator of Scholar Commons. For more information, please [email protected].
Scholar Commons CitationPerez, Samuel, "Integration and Cross-Coupling of a Notched-Turbine Symbiotic Power Source for Implantable Medical Devices"(2018). Graduate Theses and Dissertations.http://scholarcommons.usf.edu/etd/7215
Integration and Cross-Coupling of a Notched-Turbine Symbiotic
Power Source for Implantable Medical Devices
by
Samuel Pérez Minaya
A dissertation submitted in partial fulfillment
of the requirements for the degree of
Doctor of Philosophy
Department of Electrical Engineering
College of Engineering
University of South Florida
Major Professor: Sylvia Thomas, Ph.D.
Arash Takshi, Ph.D.
Jing Wang, Ph.D.
Delcie Durham, Ph.D.
Lennox Hoyte, M.D.
Date of Approval:
March 19, 2018
Keywords: energy harvesting, implantation, power efficiency, notched turbine, MPPT,
DC-DC converter
Copyright © 2018, Samuel Pérez Minaya

DEDICATION
This dissertation is dedicated to my beautiful wife Dorka Pérez (Kyla) for always
believing in me and giving me such unwavering support and to my lovely daughters Shania and
Chenella for helping me realize and understand the meaning and purpose of my life. My goal is
to show how much I love you because my words cannot describe it well enough.

ACKNOWLEDGMENTS
I want to thank God, The Holy Spirit and my Lord and Savior Jesus Christ for saving me
and for blessing me with a wonderful life in a family that has always given me more than I could
ever ask for. Kyla, Shania and Chenella I love more than words can express. I am thankful to
my extended family, my mother Noemi and my father Manuelico who gave me the best example
of hard work and dedication and taught me to persevere no matter what obstacles may stand in
my way. I am thankful to all my brothers and sisters: Angel, Iran, Rebeca, Natanael, David,
Ruth, Debora, Omni and Bethania for their unfailing love and support throughout the years. I
love you all dearly.
This dissertation was possible by the collaborative effort of my major professor Dr.
Sylvia Thomas and the wonderful team she leads: The AMBIR research group whose members
were a wonderful asset in the completion of this work, not only technically but also morally and
spiritually. Thank you William Serrano, Manopriya Devisetty, Majdi Ababneh, Kavyashree
Puttananjegowda, Ridita Khan, Nirmita Roy, Katty Pierre-Charles and Idi Tulloch for his
support in the calculations of efficiency.
I want to give a special thanks to my friend and collaborator Dr. Henry Cabra for his
wonderful support, enthusiasm and counseling during the last few years.
I also extend my gratitude to the entire staff of the Nanotechnology Research and
Education Center (NREC) especially Mr. Richard Everly for sharing his instrumentation
methods and ideas and to the X-labs director Dr. Michael Celestine for providing the high

accuracy measurement equipment needed in the characterization of the turbine models used in
this work.
I am indebted to Dr. Sylvia Thomas for her understanding, support, trust in me, and
invaluable guidance during the course of this work. To Mr. Bernard Batson, thanks for your
friendship, encouragement and support in the Sloan Program, which helped extend the life of my
research in so many ways.
Finally, I would like to extend my gratitude to my home church Templo La Hermosa of
Valrico, my pastors, Luis and Julia Toro and the entire congregation for keeping me constantly
in their prayers and encouraging me to reach higher for God’s glory.

i
TABLE OF CONTENTS
LIST OF TABLES
LIST OF FIGURES
ABSTRACT
CHAPTER 1: INTRODUCTION
1.1 Overview
1.2 Research Objectives
1.3 Contributions and Relevance of Research
1.4 Organization
CHAPTER 2: BACKGROUND
2.1 Implantable Power Sources and Generators
2.1.1 Implantable Power Generators
2.1.2 Chemical Implantable Power Generators
2.1.3 Thermoelectric Implantable Power Generators
2.1.4 Piezoelectric Implantable Power Generators
2.1.5 Electromagnetic Implantable Power Generators
2.1.6 Radioisotope Implantable Power Generators
2.1.7 RF Transcutaneous Induction Power Generators
2.2 Fabrication Methods
2.2.1 Computer Numeric Control (CNC) Machining
2.2.2 3D Printing
2.2.3 Selective Laser Sintering (SLS)
2.2.4 Stereo Lithography Apparatus (SLA)
2.2.5 Vacuum Casting
2.2.6 Injection Molding
2.3 Justification of Research
CHAPTER 3: PRELIMINARY STUDIES AND RESULTS
3.1 The Power Generator
3.1.1 Bench-Top Characterization
3.1.2 Linearity
3.2 Frequency Response Analysis
3.3 Slip Analysis and Characterization
iv
v
xi
1
1
5
7
7
9
9
11
11
12
13
13
16
16
17
18
18
19
20
20
20
21
27
27
29
32
32
34

ii
CHAPTER 4: SYMBIOTIC INTRACORPORIAL POWER SOURCE (SIPS) DESIGN
AND SIMULATIONS
4.1 Overview
4.2 Voltage Rectification
4.2.1 Full Rectification
4.2.2 Partial Rectification
4.3 DC to DC Conversion
CHAPTER 5: HEMODYNAMIC ANALYSIS OF THE CIRCULATORY SYSTEM
5.1 Principles of Blood Flow
5.2 Anastomoses and Cross-Coupling of SIPS
5.3 Artery-to-Artery Anastomosis
5.4 Arteriovenous Anastomosis
5.5 Blood Components
5.5.1 Plasma
5.5.2 Blood Cells
5.6 Density, Viscosity and Hematocrit
5.7 Platelet Activation
5.8 Biomaterials and Hemocompatibility
CHAPTER 6: TESTING METHODS
6.1 Structural Integrity
6.2 Testing Methodology
6.3 Data Collection Approach
CHAPTER 7: DESIGN, FABRICATION AND ASSEMBLY
7.1 Introduction
7.2 Model Design
7.2.1 MST Model Design
7.2.2 LST Model Design
7.2.3 OTI-1 Model Design
7.2.4 OTI-2 Model Design
7.3 Model Fabrication
7.3.1 Zortrax M200 3D Printer
7.3.2 MST Model Fabrication
7.3.3 LST Model Fabrication
7.3.4 OTI-1 Model Fabrication
7.3.5 OTI-2 Model Fabrication
CHAPTER 8: SYSTEM TESTING
8.1 Testing Circuits
8.1.1 Rectifier
8.1.2 Variable Load
8.2 Nitrogen Gas Flow Energy Harvesting
8.2.1 Equipment
8.2.2 Setup
39
39
41
41
43
44
48
48
52
52
54
55
56
56
57
58
59
61
61
61
62
64
64
64
65
68
69
71
72
73
76
77
78
79
81
81
82
83
86
87
87

iii
8.3 Water Flow Energy Harvesting
8.3.1 Equipment
8.3.2 Setup
8.4 Simulated Blood Flow Energy Harvesting
8.4.1 Equipment
8.4.2 Setup
CHAPTER 9: TESTING RESULTS AND DISCUSSION
9.1 Nitrogen Flow Harvesting Results
9.1.1 AC Power and Efficiency
9.1.2 DC Power
9.1.2.1 MST DC Power
9.1.2.2 OTI-1 DC Power
9.1.2.3 OTI-2 DC Power
9.2 Water Flow Harvesting Results
9.2.1 AC Power and Efficiency
9.2.2 Water Flow Harvesting DC Power
9.2.2.1 MST DC Power
9.2.2.2 OTI-1 DC Power
9.2.2.3 OTI-2 DC Power
9.3 Simulated Blood Flow Harvesting Results
9.3.1 AC Power and Efficiency
9.3.2 DC Power
9.3.2.1 OTI-1 DC Power
9.3.2.2 OTI-2 DC Power
CHAPTER 10: CONCLUSIONS AND FUTURE WORKS
10.1 Introduction
10.2 LST Conclusions
10.3 MST Conclusions
10.4 OTI-1 Conclusions
10.5 OTI-2 Conclusions
10.6 Materials Conclusions
10.7 Research Objectives Conclusions
10.8 Future Works
10.8.1 Emergency Notification System
10.8.2 Thrombus Detection System
REFERENCES
APPENDICES
Appendix A: Copyright Notices
Appendix B: Glossary of Terms
91
91
92
94
94
95
97
97
97
105
105
108
108
114
114
116
119
121
122
122
122
127
128
128
132
132
133
134
134
135
136
138
140
141
141
143
152
153
154
ABOUT THE AUTHOR End Page

iv
LIST OF TABLES
Table 2.1 State of the art generator types and comparison with proposed system.
22
Table 2.2 Power requirements of most commonly used IMDs[39].
26
Table 3.1 Induced voltage and current[65].
31
Table 3.2 Calculated RPM from generator’s frequency response and percent
difference between |Z| and Z-real.
35
Table 7.1 Size comparison between original 3.175X turbine model with generator
from [28] and the new miniaturized turbine (MST) with generator proposed
in this work.
66
Table 7.2 Size comparison between the large scale turbine (LST) with generator and
the optimized turbine for implantation 1 (OTI-1) with generator.
70
Table 7.3 Improved aspect ratio (length: height) with optimization and
miniaturization
71
Table 7.4 Size comparison between the OTI-1 turbine with generator and the OTI-2
turbine with generator.
72
Table 8.1 Measured values of shear rate, shear stress and viscosity for varying RPM
96
Table 10.1 Characterization data of the OTI-1 SIPS using simulated blood flow as a
harvesting source
135
Table 10.2 Characterization data of the OTI-2 SIPS using simulated blood flow as a
harvesting source
136
Table 10.3 Peak power density for LTS, MST, OTI-1 and OTI-2 turbines in mW/cc
140

v
LIST OF FIGURES
Figure 1.1 Common implantable medical devices. 2
Figure 1.2 Multi-sensor network for early detection of diseases and continuous
monitoring of known conditions[19].
4
Figure 2.1 Symbiosis of the SIPS 10
Figure 2.2 Typical energy harvesting systems[19]. 15
Figure 2.3 Computer controlled machining (top-down process) [69] 18
Figure 2.4 Trends in 3D printer sales from 2007 to 2015 [70] 19
Figure 2.5 State of the art generator types and power comparison with proposed system. 25
Figure 3.1 Armature and magnetic-ring configuration. 27
Figure 3.2 Permanent magnet orientation. 29
Figure 3.3 Actual generator armature and rotor next to a dime for size comparison. 29
Figure 3.4 Three-phase generator coil set up. 30
Figure 3.5 Test circuit used for generator characterization. 30
Figure 3.6 Voltage (top) and current (bottom) linear response w.r.t. kRPM. 33
Figure 3.7 Generator’s phase and impedance measured with respect to frequency in Hz. 34
Figure 3.8 Motor & generator modes of an electric machine. 36
Figure 3.9 Micro-generator single coil characterization shows negative slip with
increasing rotational speed using a 10 Ω load.
38
Figure 4.1 Symbiosis of SIPS revisited. 39
Figure 4.2
SIPS block diagram illustrating integration of its salient features.
40

vi
Figure 4.3
One full-wave rectifier per phase. 42
Figure 4.4 Full wave, three-phase rectifier circuit. 43
Figure 4.5 P-SAC TINA simulation results with a transformer and single rectifier diode. 44
Figure 4.6 SIPS circuit comprising minimized P-SAC and DC-DC converter. 45
Figure 4.7 Simulation results of SIPS circuit of Figure 4.6. 46
Figure 5.1 Bernoulli’s principle of blood flow[76]. 49
Figure 5.2 Blood pressure levels in the circulatory system [77]. 50
Figure 5.3 Inlet pressure vs. volume flow rate of a notched-blade turbine [28]. 51
Figure 5.4 Dual stator turbine connection between a high pressure artery (input) and a
lower pressure artery (output) with flow direction.
53
Figure 5.5 Vascular tree of the human body[55]. 53
Figure 5.6 Dual stator turbine connection between an artery (input) and a vein (output)
with flow direction.
54
Figure 5.7 Arteriovenous anastomosis (right), and arteriovenous graft (left) [78]. 55
Figure 7.1 Notched-Turbine model, scale 3.175X, 2.5 inch HDD motor [28]. 65
Figure 7.2 Flow velocity profile of MST fluid in a rotating mesh. 67
Figure 7.3 Top view of flowlines with arrow heads representing the direction of flow
and background contour colors representing the presence or absence of
turbulent behavior.
67
Figure 7.4 LST design implementing changes stemming from first miniaturization
effort findings.
69
Figure 7.5 Artificial heart on the left and the Zortrax M200 3-D printer used to create it
[87]
73
Figure 7.6 Zortrax printer in action printing the LST blade assembly (top), lid (lower
left) and casing (lower right)
75
Figure 7.7 Miniaturized-scale turbine (MST) 3D printed in ABS and assembled for
testing in a transparent holder.
76

vii
Figure 7.8 LST casing rotor and lid 3D printed in ABS on the left and CNC-machined
LST assembled for testing on the right.
77
Figure 7.9 Optimized turbine for implantation (OTI-1) 3D-printed in ABS and
machined in PMMA with different barbed connectors and blade-assembly-
loaded generator.
78
Figure 7.10 OTI-2 parts: Blade assembly (bottom left), generator (bottom right) and
PMMA casing with barbed connectors, along with LTC 3108 femto (top
right)
79
Figure 8.1 Voltage source representing the sinusoidal output from the turbine system’s
generator, connected to a variable load L1, used for AC testing.
82
Figure 8.2 Turbine system generator (V1ac) connected to rectifying circuit (D1, C1)
and to variable load L1 for DC testing.
82
Figure 8.3 Schottky rectifier, CW from top left: Typical forward current, typical reverse
current, total capacitance and forward current derating current characteristic
curves[104].
83
Figure 8.4 Variable load configuration for testing AC and DC output with and without
rectifier (bottom left) and high impedance measurement load on the right.
84
Figure 8.5 Rectifiers and DC to DC converters used to convert harvested energy to DC
and boost it to an appropriate level for IMD’s.
85
Figure 8.6 Setup of nitrogen flow through the turbine system for energy harvesting 87
Figure 8.7 Circuit diagram for measuring AC voltage and current at the load. 88
Figure 8.8 Circuit used for DC voltage and current measurements. 89
Figure 8.9 Actual lab setup described by the circuits of Figures 8.5 and 8.6 90
Figure 8.10 Principle of operation of ultrasonic flowmeter used in this work[89]. 92
Figure 8.11 Closed-loop circuit setup used to evaluate the MST, OTI-1 and OTI-2
turbines’ ability to harvest energy from water flow.
92
Figure 8.12 Water pump, tubing, push –fit connectors and valves used on closed-loop
circuit.
92
Figure 8.13 Left to right: Microscale, vortex mixer and viscometer with attachments. 95

viii
Figure 8.14 Shear of fluid between a moving and stationary plate under laminar flow
conditions.
96
Figure 9.1 Assembled MST on the left and its components on the right.
98
Figure 9.2 MST (N) AC power in mW vs load resistance in KΩ at increasing RPM. 99
Figure 9.3 MST(N) AC power in mW vs generated voltage in volts at increasing RPM
(left) and efficiency curves vs load current in mA (right)
100
Figure 9.4 LST (N) AC power in mW vs load resistance in KΩ at increasing RPM. 101
Figure 9.5 LST (N) AC power in mW vs voltage generated at increasing RPM (left) and
efficiency vs AC load current in mA (right)
102
Figure 9.6 OTI-1 (N) AC power vs load resistance (left), power vs voltage (right) and
efficiency vs load current in mA (bottom)
103
Figure 9.7 (N) AC OTI-2 power vs load resistance (left), power vs voltage (right) and
efficiency vs load current in mA (bottom)
104
Figure 9.8 MST (N) DC power, DC load voltage/current, RPM and generator voltage
against load resistance, using TI BQ 25504 to boost the voltage sent to the
load.
106
Figure 9.9 MST (N) DC power, DC load voltage/current, RPM and generator voltage
against load resistance, using LTC 3105 to boost the voltage sent to the load.
107
Figure 9.10 OTI-1 (N) DC power, DC load voltage/current, RPM and generator voltage
against load resistance, using BQ25504 to boost the voltage sent to the load.
109
Figure 9.11 OTI-1 (N) DC power, DC load voltage/current, RPM and generator voltage
against load resistance, using LTC 3105 to boost the voltage sent to the load.
110
Figure 9.12 OTI-2 (N) DC power, DC load voltage/current, RPM and generator voltage
against load resistance, using BQ25504 to boost the voltage sent to the load.
111
Figure 9.13 OTI-2 (N) DC power, DC load voltage/current, RPM and generator voltage
against load resistance, using LTC3105 to boost the voltage sent to the load
to 5 volts.
112
Figure 9.14 OTI-2 (N) DC power, DC load voltage/current, RPM and generator voltage
against load resistance, using LTC3105 to boost the voltage sent to the load
to 3.5 volts.
113

ix
Figure 9.15 MST (W) AC power in mW vs load resistance in KΩ for changing RPM,
pressure difference in PSI and flow Q in liters/min
115
Figure 9.16 MST (W) AC power in mW vs generated rms voltage in volts for different
RPM, pressure difference in PSI and flow Q in mL/m (left) and efficiency vs
load current in mA (right)
116
Figure 9.17 OTI-1 (W) AC power in mW vs load resistance in KΩ for changing RPM,
pressure difference in PSI and flow Q in liters/min
117
Figure 9.18 OTI-1 (W) AC power in mW vs generated rms voltage in volts for different
RPM, pressure difference in PSI and flow Q in mL/m (left) and efficiency vs
load current (right)
117
Figure 9.19 OTI-2 (W) AC power in mW vs load resistance in KΩ for changing RPM,
pressure difference in PSI and flow Q in liters/min
118
Figure 9.20 OTI-2 (W) AC power in mW vs generated rms voltage in volts for different
RPM, pressure difference in PSI and flow Q in mL/m (left) and efficiency vs
load current in mA (right)
118
Figure 9.21 MST (W) DC power, DC load voltage/current, RPM and generator voltage
against load resistance, using TI BQ 25504 to boost the voltage sent to the
load at 2600 RPM (left) and at 2100 RPM (right).
119
Figure 9.22 MST (W) DC power, DC load voltage/current, RPM and generator voltage
against load resistance, using LTC 3105 to boost the voltage sent to the load.
120
Figure 9.23 OTI-1 (W) DC power, DC load voltage, DC load current, RPM and RMS
generator voltage against load resistance, using TI BQ 25504 (left) and LTC
3105 (right)
121
Figure 9.24 OTI-2 (W) DC power, DC load voltage, DC load current, RPM and RMS
generator voltage against load resistance, using TI BQ 25504 (left) and LTC
3105 (right)
123
Figure 9.25 OTI-1 (SB) AC power in mW vs load resistance in KΩ for changing RPM,
pressure difference in mmHg and flow Q in mL/min.
124
Figure 9.26 OTI-1 (SB) AC power in mW vs generated rms voltage in volts for different
RPM, pressure difference in mmHg and flow Q in mL/m (top) and efficiency
vs load current (bottom)
125
Figure 9.27 OTI-2 (SB) AC power in mW vs load resistance in KΩ for changing RPM,
pressure difference in PSI and flow Q in mL/min.
126

x
Figure 9.28 OTI-2 (SB) AC power in mW vs generated rms voltage in volts for different
RPM, pressure difference in mmHg and flow Q in mL/m and efficiency vs
load current in mA (right)
126
Figure 9.29 OTI-1 (SB) DC power, DC load voltage, DC load current, RPM and rms
generator voltage against load resistance, using LTC 3108 supercap (left)
and LTC 3108 femto (right)
129
Figure 9.30 OTI-2 (SB) DC power, DC load voltage, DC load current, RPM and rms
generator voltage vs load resistance, using BQ 25504 above 1000 RPM (left)
and below 1000 RPM (right)
130
Figure 9.31 OTI-2 (SB) DC power, DC load voltage, DC load current, RPM and rms
generator voltage against load resistance, using LTC 3108 supercap (left)
and LTC 3108 femto (right)
131

xi
ABSTRACT
The purpose of this research is to design and integrate a symbiotic notched-turbine
energy generator for implantation as a cross-coupled system capable of continuously and
perpetually powering an electronic implantable medical device (IMD), which is a device
designed to operate inside the body of a higher mammal to enhance, correct or provide the body
with a function that has deviated from the norm or has stopped altogether. The list of IMDs
available for implantation keeps growing every year, one of the newest being the VBLOC,
produced by EnteroMedics®, and approved by the Food and Drug Administration (FDA) on
January 15th
, 2015[1], [2] to treat obesity in the United States, in lieu of the more dangerous and
costly bariatric surgery widely used to treat the same condition. Some of the more traditional
IMDs, such as cardiac defibrillator, pacemaker and insulin pumps require the use of a battery
system for their operation.
The powering of IMDs is a topic of growing importance and as such, the energy released
by the hydrodynamic action of the cardiovascular system of a higher mammal is presented in this
work as a source of energy that can be converted into electricity by use of a micro turbine,
loaded with magnetic rings that induce a time-varying magnetic field onto a set of insulated coils
through the process of electromagnetic induction (EMI) in accordance with Faraday’s Law.
This work goes beyond mere power production, and focuses on the process required to
integrate this power source with an IMD, when it is coupled to the cardiovascular system for
drawing hydro-mechanical power for conversion to electricity and to the IMD of choice to

xii
deliver the conditioned power, thus replicating a symbiotic process. The harvested energy in the
form of a time-varying tri-phase sine wave is therefore rectified, conditioned and made available
for use to the IMD.
The proposed 3-phase generator has a volume of 1.02 cm3 and has the potential to be
implemented as a dual or quad system that doubles or quadruples the single generator power
capabilities accordingly. The rectifying and conditioning circuits may be housed in a
hermetically sealed container, covered with a bio-compatible material such as, ultra-high
molecular weight polyethylene (UHMWPE), polymethylmethacrylate (PMMA) or titanium,
which can afford the best implantation properties such as non-absorbability, durability, hardness
and biocompatibility [4]. Additionally, the prevention of blood clotting is of paramount
importance in any IMD, which can be helped, for example by treating its surface with Tethered-
Liquid Perfluorocarbons (TLP) to prevent bio-film formation of the blood that typically leads to
infections and clotting[5].

1
CHAPTER 1: INTRODUCTION
1.1 Overview
The great innovations of the last century have ushered continuous progress in many areas
of technology, especially in the form of miniaturization of electronic circuits. This progress
shows a trend towards consistent increases in memory density, processing speed and power
density; and towards a decrease in power requirements due to miniaturization. It is worth noting
that of all these, power density has seen the least improvement [11].
It is not surprising that many efforts are being made to rectify such disparity, since lower
cost has given rise to the proliferation of portable electronic devices that need some form of
power to operate. Usually, the supply of this power is in the form of rechargeable batteries and
power conditioning circuits that work very well together to supply the demands for power.
Although this is a good solution for extracorporeal (outside the body) devices, it is not the
optimal solution for a group of portable devices called intra-corporeal devices found implanted
inside the body of many medical patients around the world. These devices can be divided into
low power and high power devices, where the former require between 30 µW and 10 mW, and
the latter require between 1.4 W to 4 W (pediatric VADs and partial support VADs ) and 4- 15
W (adult VADs) to operate [12]–[14].
It is the hypothesis of the author that a single or potentially multiple IMDs can be
permanently powered from a single notched-turbine micro-generator when a symbiotic intra-
corporeal power source (SIPS) is used to integrate it with the IMD(s) of choice.

2
This implies the elimination of the ubiquitous battery that accompanies every powered
IMD currently in the market, and subsequently, the elimination of harmful material such as
lithium, silver and vanadium oxide (just to name a few) that are part of primary batteries in such
systems.
Figure 1.1 Common implantable medical devices. All except one - foot drop implants - require
battery technology to operate. Modified from [68].
This research will make it possible to integrate a power source that converts mechanical
energy to electrical energy and uses that energy to supply most IMDs on account of the high
power generated when compared to currently available devices. The process will provide a
roadmap for many laboratories to move from the conceptual and simulation phases to the
operational phase by use of a SIPS. Thus eliminating the need for the current approach; that is,
placement of a battery inside the body, which will eventually be removed when its life-time has

3
ended, subjecting the patient to dangerous and expensive procedures that may set them back
financially and compromise their health by the inherent risks of post-surgical infection and
complications[10].
The problems stated above beg for a solution which can actually be reached through the
completion of the work proposed. By using an electromagnetic generator whose rotor is moved
by the action of a notched turbine, induced energy, in the form of time-changing sinusoids, can
be rectified and stored in a capacitor and conditioned for use by an IMD.
It is the author’s belief that in the not-too-distant future, many individuals with genetic
predisposition to certain diseases will benefit from continuous monitoring that is only possible
by the use of multiple sensors placed intra-corporeally as depicted on Figure 1.1[15]. Once
implanted, these sensors can be permanently powered by a SIPS and may signal the presence of
certain markers that indicate the early development of certain diseases, such as cancer,
Alzheimer’s, diabetes, high blood pressure, heart disease, ovarian cancer and liver cancer, etc.
Alzheimer’s patients particularly may benefit from continuous GPS monitoring that is able to
pin-point their location at all times. It is lamentable that many individuals are given a terminal
prognosis simply because the disease was not detected early enough to implement the necessary
treatment.
This scenario can become a thing of the past if multiple sensors (Figure 1.2) can be
implanted for early detection of many treatable diseases, especially those for which the patient
has a family history or a genetic predisposition. The development and application of this
technology will spur the expansion of a new field that can be appropriately termed personalized
continuous preventive telemedicine (PCPTM).

4
Figure 1.2 Multi-sensor network for early detection of diseases and continuous monitoring of
known conditions[19].
It is not uncommon for certain individuals with a family history of breast cancer to
undergo a prophylactic radical mastectomy as a preventive treatment. Even though this is an
effective way of preventing the incidence of cancer, according to [16], it is impossible to remove
all of the breast tissue that could become cancerous. It is not surprising then that 10% of these
patients still develop breast cancer and have to be treated with radiation and/or chemotherapy
only after the cancer has developed into a palpable tumor or has been detected through a blood
test that indicates the presence of a specific marker.

5
These markers are simply proteins that can be detected in the blood of the patient, such
as, CA15.3 used to find breast and ovarian cancer[17].
The proposed system would power an array of LOC (lab on a chip) sensors that would
continuously test the blood for abnormal marker levels[18], thus eliminating the need for radical
procedures that sometimes are justified, but often are fomented by cancer phobia.
The diagram of Figure 2.2 shows the many possibilities proposed by [19] for energy
extraction from various sources. Of these only thermal, vibration, RF and motion are candidates
for implantable devices. The thermal energy gradient device necessitates placement near the
surface of the skin, which makes it dependent on the environment. Therefore, the constant and
stable generation of power may be hampered due to changes in temperature associated with the
individual’s surroundings, severely restricting the power extraction ability of the generator.
Vibration devices in the form of piezoelectric transducers that operate continuously have
also been proposed[20], but have not demonstrated to generate enough power to sustain the
operation of any IMD, since their power production is only a few microwatts.
Radiofrequency (RF) harvesting is the topic of continuous research for systems that
require very little power, but it is not always possible to maintain certain signal strength around
the body, which also absorbs some of the signal before it reaches the transducer, rendering the
system useless as an implantable generator.
1.2 Research Objectives
The notched-turbine micro energy generator (NTEG) is a novel system developed at the
AMBIR group at USF which produces 750 mW of power as a 3.5 X prototype, at low pressures
and moderate angular speeds[6].

6
The main objective of this research is to integrate the NTEG with a power conditioning
circuit, making it possible for it to power an IMD without the need for a battery. This requires
that the NTEG be miniaturized to an implantable size and that its performance be optimized by
changing its configuration and casing in a novel manner, as follows:
1. A single-magnetic-ring NTEG may be modified as a dual-stator, dual-rotor generator
to produce a power increase up to double its power output.
2. The NTEG’s casing is redesigned to separate the coils from the rotating magnetic
ring, thus preventing the fluid that impacts the rotor from entering the coil space and
avoiding damage to the coils and fouling of the blood in the rotor cavity.
3. The coil-ring configuration is modified to allow growth of the coils in the outward
radial direction, increasing the current induction capability of the generator with a
minimal increase in volume and producing a divergent-induction power source. In
other words, the power increases as the coils grow in the outward radial direction.
This term is basically an analogy loosely based on the concept of the divergence of a
vector field.
4. The modified NTEG is integrated with a rectifier circuit and an energy storage device
such as a capacitor or inductor and the stored energy is properly conditioned by
means of a switched power control circuit to supply an IMD.
5. The integrated system is tested in-vitro and its ability to power an IMD is
demonstrated.
6. The system may be tested in-vivo, and its ability to power an IMD is demonstrated.

7
1.3 Contributions and Relevance of Research
The above stated objectives represent innovations that improve the NTEG and make it
possible for the proposed system to be used as a symbiotic intra-corporeal power source (SIPS)
which – as far as the author is aware- is capable of a ten-fold increase in available power when
compared to any implantable generator currently available in industry or in academia[7], [8].
The relevancy of the proposed research can be readily seen by the fact that of all the
IMDs that have been implanted and are currently in use to date, none is powered by a perpetual
power source such as the proposed SIPS. Therefore those devices that require electrical power
are supplied by batteries that will eventually need to be replaced.
Even though it is possible to recharge these batteries through the skin by using a
transcutaneous wireless power transfer system[9], such systems still present multiple
disadvantages that cannot be overcome unless the device is redesigned to eliminate the battery as
the main source of power. Only then it is possible for the IMD to draw the power it needs from
the energy already available inside of the body in which it is implanted.
The novel contributions of the SIPS in this work clearly show that although many
approaches to solving the problem of continuous power have been proposed[10], they do not
present a complete solution. Please see section 3 (Background) of this work for an overview of
some of these systems and how they may be improved to satisfy the power requirements of most
IMDs.
1.4 Organization
This work is organized in the following manner: Chapter 1 focuses on the introduction to
this body of work by driving home the relevance of the research and the proposed system.

8
Chapter 2 presents the background information necessary to understand this work and
presents new terminology and concepts that are unique to understanding the same, as well as the
fabrication methods available at the time of its completion.
Chapter 3 covers preliminary results stemming from the characterization of the generator
proposed for harvesting energy from flow, while chapter 4 presents the design and simulation of
the symbiotic intra-corporeal power source (SIPS) and the necessary circuits for rectification and
voltage boosting to the level appropriate for use by an implantable medical device (IMD).
Chapter 5 covers important concepts of the human circulatory system and how they are
pertinent to this work. Chapter 6 covers the methods proposed for use to test validity of the
research and chapter 7 presents the design and fabrication and assembly of four different turbines
used to determine the power response of the system at different levels of miniaturization.
Chapter 8 presents the testing process for each of the turbines used and chapter 9 shows
the results obtained from testing every turbine using three specific fluids, nitrogen gas, water and
simulated blood and analyzes the results. Finally, chapter 10 summarizes and draws conclusions
on the results found in chapter 9 and discusses the potential areas for future works stemming
from this research.

9
CHAPTER 2: BACKGROUND
The human body is a rich source of energy and as such, the proposed system will
demonstrate a specific and efficient way to harness it and convert it to electrical energy, which
can then be used to power most IMDs. Although many an approach has been taken to address
the need for electrical power inside the human body, to the author’s knowledge, these have not
been successful in demonstrating the generation of enough power to sustain continuous operation
of most IMDs in the market. These technologies will be discussed in the current section, along
with a comparison with the proposed system to highlight the differences with, and advantages of
the SIPS. The notched turbine micro-generator from which the SIPS is derived will also be
discussed.
2.1 Implantable Power Sources and Generators
At this juncture, it is important that the differences between power sources and generators
be clearly explained. A generator can be understood as a device able to convert one form of
energy to another. In low power applications it is known as a transducer, and it simply produces
what can be termed as “raw power” that cannot be readily used by a working device. For this
power to become useful, it needs to be rectified and conditioned to maximize the power transfer
to a loading circuit. The generator then needs to be coupled to the conditioning circuit through a
process of integration that transforms the generator into a power source[21]. Although an
extensive research effort has been mounted in the area of implantable generators (MEMS micro-
generators, piezo-electric generators, and electromagnetic generators) both in industry and in
academia, the effort is lacking in the area of implantable power sources.

10
The proposed SIPS is a system designed for cross-coupling to the cardiovascular system
for energy harvesting, and to the IMD of choice for energy supply.
This symbiotic process is shown in Figure 2.1 and it allows for a unique mutually
beneficial relationship between the cardiovascular system (CVS) from which the energy is
extracted and the power source that conditions and delivers this energy at a specific location that
ultimately benefits the system from which the initial energy came. A concrete example of this
relationship can be seen when the proposed system is used to power a cardiac defibrillator, where
the main organ of the CVS (the heart) pumps the blood through the turbine section of the SIPS.
Figure 2.1 Symbiosis of the SIPS
Following rectification and storage, the energy is delivered to the defibrillator which is
able to analyze the heart’s EKG (electrocardiogram) and correct any abnormal rhythm by
“shocking” the heart with just the right amount of energy to convert the rhythm to a normal one
or stop it all together and allow the heart’s own electrical impulse to start anew in an organized
manner. It can then be said that there is a symbiotic relationship between the CVS and the SIPS.
This research is important because as it turns out, all active (requiring electrical power) IMDs in
operation to date are operated by transducers (generators) that convert chemical reactions to

11
electrical power, called batteries. These generators lack something very important: perpetual
operation through the lifetime of the IMD, whether the device operates in continuous (constant
power delivery) or discontinuous mode (on-demand power delivery)[22].
2.1.1 Implantable Power Generators
In this section, several implantable power generators are presented and their output is
compared to the power requirement of the IMDs available in the market. It is important to keep
in mind that the power output claimed by these devices is “raw power”, while the power
requirement of the IMDs is “treated power” or “conditioned power” as would be available as an
output from a power source. (See section 4.2)
The generation of power inside the human body is a highly researched area of bio-
medical engineering, which has produced four main types of harvesting transducers, such as
chemical, thermoelectric, piezoelectric and electromagnetic, as well as a plethora of implantable
power generators. The following sub-sections are dedicated to the analysis of these generators
and how they can be improved to meet the power needs of most IMDs.
2.1.2 Chemical Implantable Power Generators
The most commonly used implantable generator to date is the chemical generator,
otherwise known as a battery. The battery is able to convert chemically stored energy to
electricity when a REDOX chemical reaction takes place inside the battery’s cells. These
batteries already pack a specific amount of potential chemical energy at the moment of
implantation and are rated, for a given application (pacemaker, defibrillator, glucose sensor, etc.)
to last 5, 10 or 15 years. These times are only ratings and it has been widely documented[23]
that they are frequently replaced before the rated time, since the healthcare system (due to safety
concerns) will not allow for the complete exhaustion of the battery before replacing it.

12
Powering implantable devices with batteries is therefore not in the best interest of the
patient, since the procedure to replace it can be dangerous, costly and may negatively affect the
patient’s wellbeing both physically and psychologically. But this is the only option available
today. These batteries do satisfy the power needs of all IMDs, but only temporarily. Both intra-
corporeal batteries need to be made to last longer than the lifetime of a patient to be acceptable as
the ultimate energy solution that is actually needed and proposed in this work.
This is not actually possible at this time, since only nuclear batteries can actually comply
with this requirement, but have been eliminated as an implantable power source option by the
medical community due to its inherent risks and dangers[24].
2.1.3 Thermoelectric Implantable Power Generators
The thermoelectric effect tells us that there is a linear relationship between the current
flowing in a conductor and the heat felt on the surface of such conductor. Additionally, this
process can be reversed; that is, the temperature difference between two pieces of metal
connected by the wires of a galvanometer will produce a current that can be detected as the
galvanometer’s needle is deflected, which is called the Seibeck effect that is used to create the
thermoelectric generator (TEG) described in [3]. The greater the difference in temperature
between the two conducting plates, the greater the generated current.
For the implantable TEG in [12], the greatest temperature differential was found to be
near the surface of the skin. But even though the power generated is sufficient to power the
IMDs with lowest consumption, such as, cardiac pacemakers, it is not enough energy to power
the mid-range and high consumption devices, such as, insulin pumps and cochlear implants.

13
2.1.4 Piezoelectric Implantable Power Generators
The piezo-electric effect is also a major area of research that continues to investigate
ways to convert changes in mechanical stress of a piece of material to electricity. This is
possible because certain materials, known as piezoelectric, will create a voltage potential across
electrodes when subjected to pressure or vibration. Since the optimal pressures and vibrations
necessary for maximum power extraction are normally above the levels produced inside the
human body, these generators tend to be very inefficient and not very practical as implantable
systems. One possible way to remedy this inherent condition is to use muscle movement to
activate a high-frequency mechanical oscillator to which the piezoelectric device is coupled.
These vibrations can then be converted to electric power that can be conditioned for use by an
IMD.
2.1.5 Electromagnetic Implantable Power Generators
Two main types of implantable electromagnetic generators (EMG) have been proposed in
the art, which convert mechanical motion into electricity by the process of electromagnetic
induction. These are:
1. The wound coil (traditional winding), where a copper wire is wound around a
magnetic core which increases the magnetic permeability of the coil, thus ensuring a
flux increase through the coil, which maximizes current induction.
2. The micro-fabricated coil, which is usually fabricated through a MEMS process and
consists of copper lines that spiral out from the center of the coil to a specified outer
diameter. Even though these coils are very small and can be easily implanted in the
body, they are not very efficient, since the power produced by a coil is largely
dependent on factors that are greatly affected by the geometry of a MEMS coil.

14
These factors include the wire’s resistance, the cross-sectional area transverse to the
magnetic flux, the wire length (and number of turns N), the wire’s cross-sectional area, the
damping factor and the coil impedance.
All these factors can be understood at the light of Faraday’s Law, which states that when
a conducting wire is exposed to a time-changing magnetic field, an induced voltage (proportional
to the number of field lines that cross the wire) can be measured between the ends of the wire. In
other words, the potential difference V in Eq. 2.1 represents the changing magnetic field with
respect to time.
V= - dΘ/dt ( Eq. 2.1 )
If the wire is wound into the shape of a coil, then the field lines will cross the wire N
times, where N is the number of turns of the wire, and V will increase proportionally. If the wire
is wound several times in a stacking fashion, the flux links with all the wire loops in the coil then
by integration over the area of each loop, a total potential difference can be found. If a load RL is
then connected to the ends of the coil, a current will flow.
This current, like all currents in a wire will create a magnetic field that will oppose the
field that created it, giving rise to an electromagnetic force Emf. When the magnetic field lines
(flux) moves across the coil and the lines link with the wire orthogonally, the Emf is maximized
and the mechanical energy that caused the magnetic field to change (move across) is transformed
into electrical energy (current flowing in the conductor). This maximization of energy
conversion depends on the angle of linkage, the speed of change of the field and the opposing
force created by the flowing current; this opposition is called damping, Emd.
Emf = Emd*dx/dt. ( Eq. 2.2 )

15
The generator proposed in this work is of the type described and its configuration is
presented in section 3.1, where the induced voltage across the coil terminals varies directly w.r.t.
the speed of the rotor, which comprises the permanent magnets that produce the flux.
As the speed of the rotor increases, so does the induced voltage. Conversely, the greater
the magnetic field density B (determined by the strength of the magnets) the greater the
induction. Additionally, it can be stated that the greater the N, the greater the damping.
Therefore, there is a limit since the increase in the N will also cause the coil’s resistance (Rc) to
increase, causing the current flow and subsequently the Emf to decrease. The power delivered to
the load PL is proportional to
P = V2/ (RL+Rc+jωL), (Eq. 2.3)
where Rc will dominate the coil impedance at the low frequencies (below 500 Hz) expected
when the proposed SIPS is placed inside the human body.
Figure 2.2 Typical energy harvesting systems[19].

16
2.1.6 Radioisotope Implantable Power Generators
During the decade of the 70’s much soul-searching went on as scientists struggled with
the idea that in order to keep a patient alive, it was necessary to place a nuclear battery inside of
them to power electronic IMDs that could either defibrillate their heart to allow for the
termination of a disorganized rhythm and the commencement of an organized one (defibrillator),
or send a continuous signal to the heart muscle when the sino-atrial or atrioventricular nodes
failed (a pacemaker). Although a number of patients today still have nuclear systems implanted
in their bodies, this practice was soon discontinued after the development of the lithium ion
battery. The dangers of having a radioactive material inside the body were all too real and had to
be discontinued. Today we face a similar danger from the lithium ion battery which must be
replaced, not by a more efficient battery, but by a generator that makes the IMD a self-powered
device capable of continuous operation beyond the lifetime of the patient. But gauging the
lifetime of a person can be rather difficult, if not impossible, since a young person’s lifetime
would be potentially longer than that of a middle age or advanced age one with the same
condition. This is why a battery does not really qualify as a solution to the problem of whether
an intra-corporeal system is capable of supplying power beyond the lifetime of a patient.
2.1.7 RF Transcutaneous Induction Power Generators
In this work it is recommended that any harvesting of energy from the flow of blood in
the cardiovascular system be limited to no more than 10% of the capacity of the heart. But this
restriction does not apply to transcutaneous induction power generators (TIPG) since they don’t
qualify as an energy harvesting system, but they need to be considered here since they address
the same problem of powering IMD’s without the use of a battery.

17
TIPGs work under the principle that a coil outside of the body is set as an antenna that
transmits a sinusoidal carrier signal of a certain frequency and another coil inside the body acting
as a receiving antenna passes the energy to an energy conditioning circuit that makes it suitable
for use by an IMD[100]. This transfer of energy across the skin (transcutaneous) has the
advantage of not being limited by the output of the heart, so in theory it can achieve high power
outputs in the order of 1-10 W[101], which is enough to power all low-power and most high-
power IMDs such as LVADs. But there are drawbacks as well; according to [102], the transfer
of power across the skin has to deal with changes in the dielectric characteristics of the skin due
to changes in the interstitial fluid’s electrolyte balance, adipose tissue variability (which changes
the thickness of the skin), movement and displacement of the implanted coil due to scar tissue
formation among others.
TPIGs can be used to transfer both power and information across the link established
between the two coils, but two separate frequencies must be used, and tuning the coils can be
time consuming and cumbersome even with the use of sophisticated lab equipment that is not
available to the end-user patient. This is why this technology is listed as dependent on
extracorporeal power sources and equipment on Table 2.1.
2.2 Fabrication Methods
The fabrication of implantable medical devices is a very rigorous endeavor that requires
the use of biocompatible materials that have become standard in the production of such systems,
as they have withstood the U.S. Federal Drug Administration (FDA) approval process.
It is important to be clear that our goal in this work is not to seek such approval, but to
demonstrate a proof of concept that is necessary to proceed to more lofty goals outlined in the
future works chapter.
18
The subsections below describe the different manufacturing processes available to our
team. Each affords a certain level of benefits and drawbacks of which cost is probably the most
significant.
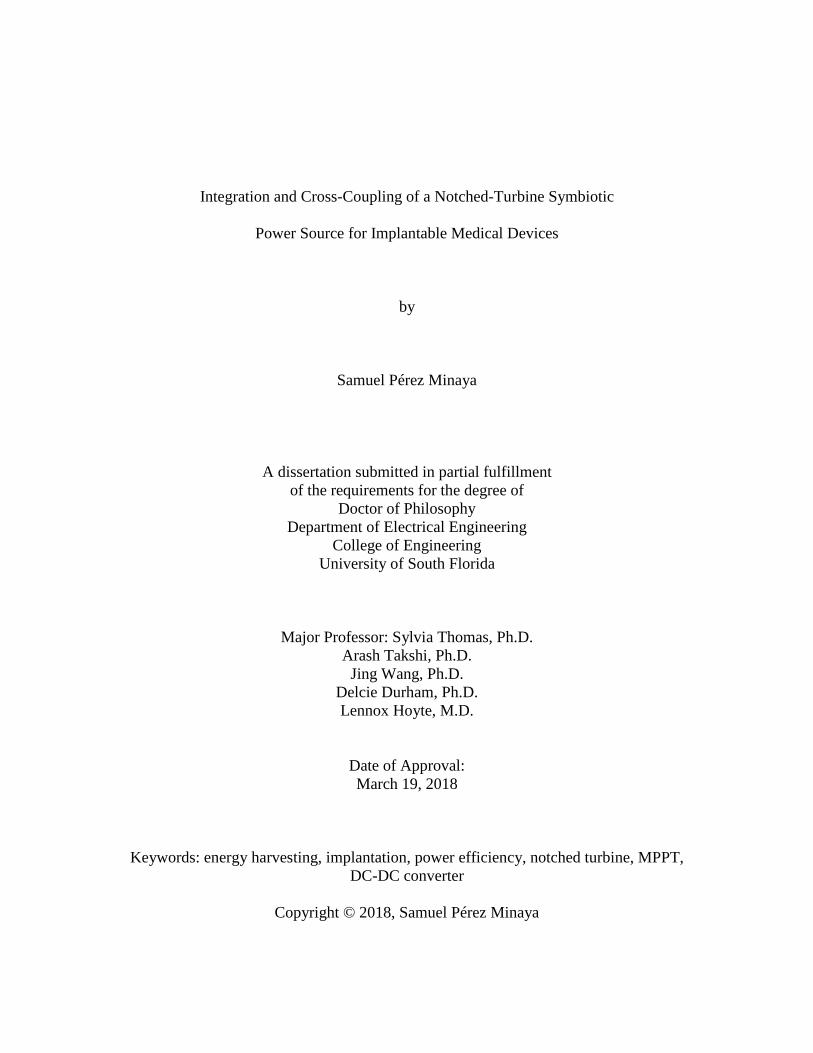
2.2.1 Computer Numeric Control (CNC) Machining
This manufacturing process allows a computer program to control the manufacturing
tool. It is a top down process where a grinder (or any other applicable tool) removes material
from a block until the desired shape is achieved [69].
Figure 2.3 Computer controlled machining (top-down process)[69].
The tool is capable of operating at different angles, depending on the number of degrees
of freedom, thus obtaining a 3-dimensional object with good resolution. Figure 2.3 shows this
process in action, allowing for higher accuracy and faster production than a human operator
would achieve. This process can be used on different materials, such as metals, wood and
plastics. In this work CNC was used to manufacture only the casings of the turbines, but not the
blade assembly, due to the complexity of the part.
2.2.2 3D Printing
This manufacturing process uses a bottom up approach where layers of material are
deposited on a fixed platform until a 3-dimmensional structure is erected. The material is

19
extruded from a hot nozzle that melts the threaded filament and moves to a particular position
following a Cartesian coordinate system. The sales of 3D printers has skyrocketed in the past
decade, as prices drop and the printing quality improves. Figure 2.4 shows this trend.
The two most commonly used materials are ABS, derived from petroleum and used
widely in industry, especially on automobiles, and PLA which is biodegradable, but more brittle
than ABS.
Figure 2.4 Trends in 3D printer sales from 2007 to 2015 [70].
2.2.3 Selective Laser Sintering (SLS)
This process is also a bottom up process in which a laser is used to melt a material in
powder form, allowing it then to cool and solidify. This process is repeated until a 3-
dimensional part is built from the ground up. This process is used widely in rapid prototyping,
but sometimes the resulting part has to be treated to achieve higher surface smoothness and
better structural integrity[71].

20
2.2.4 Stereo Lithography Apparatus (SLA)
SLA is also a bottom up or additive approach to manufacturing where a container filled
with a photo-sensitive material (polymer resin) is irradiated with a UV laser to harden the
material at very specific points. The laser is controlled by a computer that reads the CAD STL
file that describes of the part being produced[72].
The SLA process is able to achieve great surface smoothness and detail, but it is limited
on the types of material (metals for example) that it can process.
2.2.5 Vacuum Casting
This process is much more involved than the ones previously discussed, since it involves
the making of a silicon mold where the hot metal or polymer such as polyurethane can be
poured. Prior to the pouring the mold is evacuated to prevent the formation of air pockets or
trapped gases that would compromise the integrity of the part. The labor intensity of this process
makes it more costly than SLA, SLS and 3D printing, but the quality of the finished part is of
higher order and the choice of materials is more extensive[73].
2.2.6 Injection Molding
This process is the precursor to any casting process because it delivers a finished mold
that can be filled with the molten metal, plastic or polymer of your choice. Many IMD parts are
now made in this manner using biocompatible materials from metals to polymers and plastics.
This allows for mass production of parts, thus reducing the cost associated with the more
traditional CNC machining process[74]. Injection molding works well with small parts such as
the turbines considered in this work, but it is more costly than using a 3D printer or using limited
CNC machining, which are both are available at USF.

21
2.3 Justification of Research
Figure 1.1 shows the most common implantable medical devices in use today, some of
which require electrical power to operate. Of these, in 2011, implantable cardioverter
defibrillators alone accounted for 133,263 procedures at an annual cost of $5.5 billion, with a
cost per procedure of $40,000, while heart pace makers accounted for 235,567 implantations at a
total cost of $4.5 billion and a cost per procedure of $20,000 [25].
Medical care costs continue to rise every year and it is expected that the costs of surgical
interventions to place these devices will continue to rise every year. Additionally, the inherent
problem of device tethering to extracorporeal or intra-corporeal power sources continue to cause
unavoidable complications (stemming from the replacement of the device due to exhausted
batteries), such as increased rate of infections that can lead to yet more device replacements.
This turns into a vicious cycle because the replacement process increases the infection
rate and the recommended treatment for infection is device replacement, all the while increasing
the cost of treatment and the threat to patient survival. This research presents an elegant solution
where this vicious cycle of device re-implantation, repeated infections and increased care cost
can be avoided[26]. The proposed SIPS offers a framework for a single implantation surgery
over the life of the patient, thus improving two very important factors: the healthcare cost and the
quality of life to the patient.
Table 2.1 shows the state of the art in power generators for energy harvesting. These
systems are diverse in the source of energy that they convert and in the method used for
conversion. But all convert some sort of energy (kinetic, thermal, solar, infrared ultrasonic and
radio frequency) into electrical energy by use of a transducer (piezoelectric, electromagnetic,
thermoelectric, photovoltaic and resonating circuit).

22
Although some of these produce a high power output, they are not implantable because
their size is too large, as seen with the piezoelectric foot transducer described in [27] or the EM
induction generators from [28].
Other systems although implantable, are restricted by their inability to operate
continuously; such is the case of the piezoelectric system embedded in an orthopedic implant that
converts the energy produced while walking to electricity. This means that some patients would
not be able to benefit from this technology if their IMD requires a continuous supply of power
for operation. One potential solution would be to use a rechargeable battery is charged during
daily walking periods. But if the patient is unable to walk for a certain period of time due to
injury or illness the system would not function as intended. Other systems exhibit a dependency
on an extracorporeal source (DECS) for their operations, such as, thermal, solar, infrared,
ultrasonic and radio frequency[27]-[30].
Table 2.1 State of the art generator types and comparison with proposed system.
Adapted from [37].
Energy Source Harvesting
Method
Power Advantages Disadvantages Reference
Kinetic
Foot pressure
Piezo 1 W Very high power Not implantable [27]
Kinetic
(Fluid flow and
Pressure)
EM Induction 0.75 W High power, low fluid
shear stress, notched
turbine.
Large size, Not implantable [28]
Kinetic:
Orthopedic
implant
pressure
Piezo 4.8 mW Implantable Generation of energy
requires walking,
dependency on
extracorporeal source
(DECS)
[29]
Kinetic: Blood
pressure
fluctuations
Piezo 2.3 µW Implantable Very low power 27]
Kinetic:
Vibration
driven
generator-
VDRG
Electrostatic 80 µW Implantable Pre-charge voltage source
needed, low power
[30]

23
This limits the device’s ability to work as intended if the conditions for conversion are
not present, such as the correct temperature differential between the inside and outside surfaces
of the patient’s skin as is the case of the thermal transducer. The solar transducer is implantable
just under the skin to allow for the photoelectric effect to take place as the light travels through
the skin. This may be dependent on the melanin concentration and may not work for every
individual.
Table 2.1 Continued.
Energy Source Harvesting
Method
Power Advantages Disadvantages Reference
Kinetic:VDRG
EM Induction 400µW No separate voltage
source
Maximum voltage 0.1 volts [31]
Kinetic: VDRG
EM Induction
400
µW
Tested in-vivo:
Pacemaker on dog
Generator maintained 1.6
volts for 30 min at 200
BPM (high heart rate)
[32]
Thermal Seibeck
effect
TEG
30 µW Limited power range,
Environment dependent
[33]
Solar
Solar cells 647
µW
Not intimately
invasive, moderate
power
DECS, Not practical -[67]
Infra-Red Photovoltaic
cells under
the skin
4mW High power Battery recharging system
(not perpetual), DECS
[34]
Ultrasonic MEMS
resonator
21.4
nW
Safer than RF, no
interference.
Power too low, DECS,
slow.(0.9 volts in 15s)
[35]
Wireless radio
frequency
Transcutaneo
us Induction
link
150
mW
High Power, no battery
needed
Limited carrier frequency
due to tissue absorptions,
patient mobility restricted
due to DECS
[36]
Cardiovascular
pressure and
flow
EM Induction 417
µW
Tested in-vivo
(ICD on pig)
High shear stress turbine
and casing materials
favored thrombi formation
[7]
Cardiovascular
pressure and
flow
EM Induction 10 mW High power, low shear
stress axial notched
turbine, perpetual,
flexible integration,
implantable, no DECS
Not yet tested in-vivo. Proposed
work.

24
If the solar cells are mounted extra-corporeally such as on sunglasses, the generated
energy could be transferred to a cochlear implant wirelessly or through a contact at the mastoid
process behind the ears where the legs of the glasses usually rest.
This would require the use of materials that can prevent the growth of microorganisms
and their penetration into the body at the skin-device boundary. This development would greatly
benefit patients with ventricular assist devices (VADs) that require a minimum of 8-10 watts to
operate, which is only possible with a power line that penetrates the skin and connects to the
VAD, not to mention the millions of patients that undergo dialysis, placement of chest tubes or
post-surgical drainage system on a daily basis.
The cardiovascular generator from [7] is similar to the SIPS since it draws power from
the same source, the hydrodynamic energy of the circulatory system. But this is where the
similarities end, since it uses a tesla turbine with a series of disks that causes hemolysis
(destruction of red blood cells) due to the high shear forces to which they are exposed[38]. The
turbine was tested in-vivo, but only operated for approximately 15 minutes before it stopped due
to the blood coagulation response caused in part by the hemolysis. This is avoided in the SIPS
design by using innovations such as the notched blade and distributed pressure flow[28].
Additionally the generator was only able to produce approximately 4% of the power claimed by
the SIPS. Table 2.2 indicates that this Tesla generator would be able to power only a couple of
the devices listed, while the SIPS could potentially power 100% of them.
It is clear then that the proposed system has the necessary characteristics to ensure
continuous operation that does not depend on extracorporeal events or sources and does not need
a battery to operate or to maintain a charge.

25
0.00001
0.0001
0.001
0.01
0.1
1
10
100
1000
Type of Energy harvesting devices
Power(mW) Ultrasonic [32]
Piezo [17]
TEG [30]
Electrostatic [27]
EM induction [28]
EM induction [29]
CVS-EMI Gen [6]
Infra Red [31]
Piezo [26]
CVS-EMI Gen(Proposed) [41]
RF -Transc. [33]
Po
wer
in m
illiw
atts
Figure 2.5 State of the art generator types and power comparison with proposed system.
The proposed SIPS is then in a separate category characterized by continuous and
perpetual operation in the milliwatt range and has built-in flexibility to power one or potentially
multiple IMDs simultaneously. Figure 2.5 shows a comparison between the different generators
of Table 2.1 in terms of power production and type. Notice that the scale is logarithmic and the
proposed system is shown highlighted in an orange glow on the right side of the figure.
Only one other system[6] can be directly compared to the proposed system since both use
a turbine for harvesting electrical energy from the CVS by use of an EMI generator. Both
advantages and disadvantages are considered on Table 2.1.

26
Table 2.2 Power requirements of most commonly used IMDs[39].
The ultrasonic system has the lowest power production and the wireless RF, a
transcutaneous power transfer system, is shown at the top. But it suffers from serious
limitations, such as limited frequency of operation (due to absorption by the skin) and the
dependence on extracorporeal conditions position and orientation of the external coil with
respect to the implanted coil. An external power source is also needed to power the external coil,
making the proposed system preferable.

27
CHAPTER 3: PRELIMINARY STUDIES AND RESULTS
The results obtained up to now include, the bench-top characterization of the micro-
generator, a 3-phase, 12 pole, 6 magnet asynchronous generator that is capable of producing
enough power to source multiple IMDs simultaneously. Additionally, the design and simulation
of the power source and conditioning circuit (PSAC) and Power Boosting Circuits is presented
and analyzed, as well as its frequency analysis to determine the necessary impedance matching
for maximum power transfer.
3.1 The Power Generator
In this project, a one-inch hard-disk drive motor is used as a 3-phase asynchronous
brushless generator is used to produce raw power.
Figure 3.1 Armature and magnetic-ring configuration.

28
The cartoon of Figure 3.1[40] shows the configuration of the coil armature with respect
to the magnetic ring. Notice that by placing the magnetic ring in the center, the coils extend
outward radially allowing for a divergent induction system (DIS). One great advantage of the
DIS as opposed to the outward-ring, convergent induction system (CIS) used in [28], is that the
rotor (and magnetic ring) can be made smaller, and therefore, the turbine can also be reduced in
size and weight. Therefore, not only is the motor’s diameter reduced by a factor of 3 with
respect to [28], but the rotor’s diameter is also reduced by a factor of 2, allowing the turbine’s
diameter to be reduced by a factor of 6, not to mention the depth. This is a very significant
contribution, because the turbine’s speed is inversely proportional to its mass, according to
Newton’s second law of motion. The turbine (and the generator’s rotor) with a smaller mass will
then move faster, and the induced voltage will increase proportionally.
The micro-generator, when rotating at a specific RPM, will produce a sinusoidal signal at
each of its phased outputs at a frequency that is directly proportional to its speed of rotation and
number of its magnetic poles. This behavior can be described by the equation,
f [Hz] = RPM*P/120, ( Eq. 3.1 )
where P is the number of poles (North and South) in the magnetic ring oriented as shown in
Figure 4.2[40], and the quotient 120 is a conversion factor (60*2) that converts RPMs, or
revolutions per minute to Hertz or cycles per second, given that there are 60 seconds in one
minute and that two passes of alternating N – S poles are necessary to complete one sinusoidal
cycle of the output signal. In our specific case, since the magnetic ring is a 12 pole ring,
f = RPM*12 / 120, or simply f = RPM/10.

29
Figure 3.2 Permanent magnet orientation
3.1.1 Bench-Top Characterization
The characterization of the 18.5 mm (0.74 in) motor shown below in Figure 3.3, was
conducted by connecting its coil terminals to the test circuit shown in Figure 3.4. The rotor (9.4
mm) and coil armature have been separated and are shown next to a dime (17.9 mm) for better
visualization and size comparison.
Figure 3.3 Actual generator armature and rotor next to a dime for size comparison.

30
V+
VM1
A +
AM
1
R1 1
k
+
VG1
Figure 3.4 Three-phase generator coil set up
The 9 armature coils compose 3 sets of 3 coils each that are connected internally. The 3 coils of
the first set are connected in series and their voltages are added since they receive induction
simultaneously. The second set receives induction 120 degrees apart from the first, and the third
set 240 degrees apart from the first or 120 degrees from the second. Figure 3.4 shows this
relationship with each output voltage V, measured between the corresponding “line” and the
“neutral” points. The neutral is a reference wire that is connected to all 3 sets and acts as a
ground, but can be obviated if any two phased outputs are taken in series. In this case, the
outputs add up to less than twice the individual phase outputs, since their peaks do not exactly
match in phase and only add constructively over part of the period of the sinusoid.
Figure 3.5 Test circuit used for generator characterization

31
Rotational
Speed
Load: R
Ohms 10
kRMP
Vlow
AC
Vhigh
AC
Ilow AC
mA
IhighAC
mA
0.5 0.04 0.07 2 3
1 0.117 0.205 6.39 8.08
1.6 0.189 0.327 10 12
2 0.22 0.385 12.4 14.5
2.4 0.242 0.426 13 16
2.6 0.263 0.46 14 17.3
3 0.348 0.607 18.43 22.88
3.3 0.383 0.668 20.28 25.11
3.6 0.419 0.73 22.5 26.8
3.9 0.448 0.781 23.8 29.27
4.4 0.48 0.83 25.15 31.11
4.5 0.52 0.905 27.4 33.7
Generator Bench-Top Characterization
No Load Voltage
(Open Circuit)
The motor was connected in generator mode by coupling the rotor to a VM 16
Milltronics programmable drill capable of maintaining constant rotational speeds from 0 to 8,000
RPM. The rotor was set to rotate in increments of 500 RPM.
Table 4.1 shows the open circuit voltage obtained from one coil set with respect to
ground (V low) and in series with the contiguous phase (V high). The corresponding currents I-
low (using a single phase) and I-high(two contiguous phases) through a 10.1 Ω purely resistive
load were also measured with an XTECH True RMS multi-meter. A Tektronix T DS 3052
oscilloscope was also used to verify the sinusoidal shape, frequency and amplitude of the voltage
and current output by connecting it in parallel with the open-circuit coil and in parallel with the
load.
Table 3.1 Induced voltage and current[65].
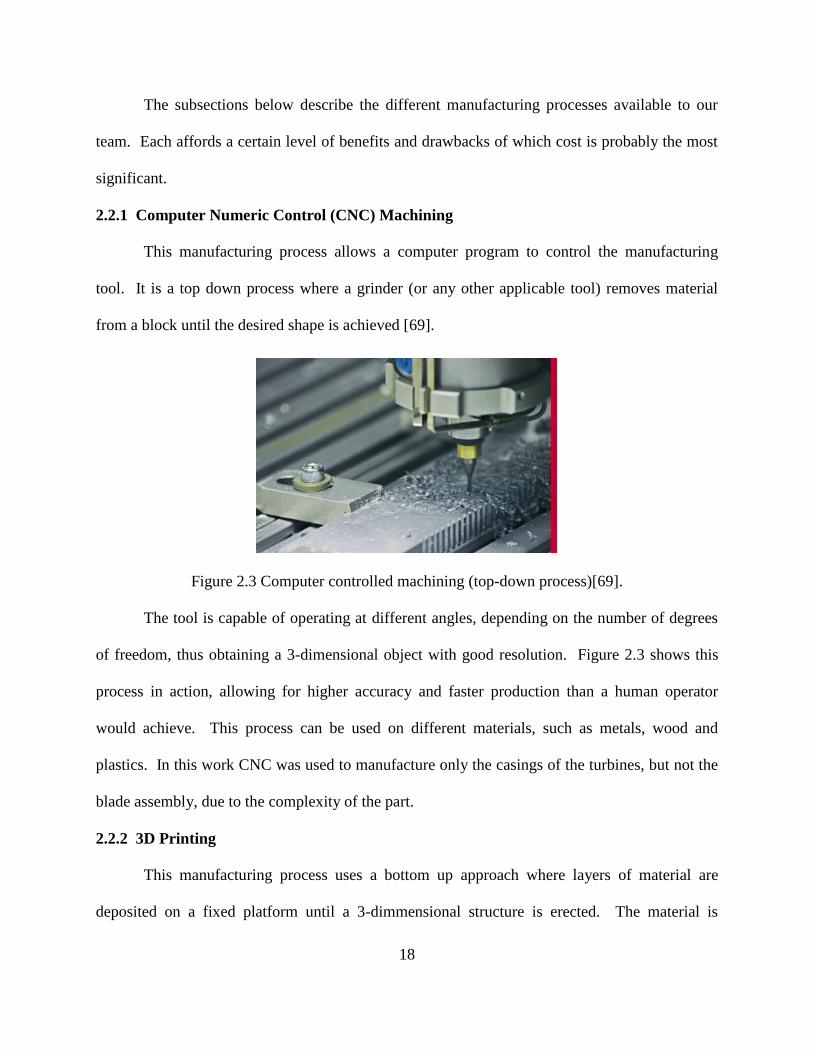
The case study presented in [7] describes an implantable Tesla turbine and generator able
to produce 0.4 mW of power at 1770± 237 RPM and pressure differential of 37.8±5.4 mmHg
when connected to the circulatory system of a 60 Kg domestic pig. These findings clearly show
32
that the circulatory system of a higher mammal (including humans, since it is closest to the pig’s
in anatomy and physiology[41]) can maintain the pressure and flow necessary for a small
millimeter turbine to rotate at above 1000 RPM. It can be seen from the data in Table 3.1 and a
simple power calculation that the SIMS would be able to approximately double this output under
similar conditions as untreated power alone.
Theoretically, the SIMS would also be able to supply energy to up-to 6 independent
power sources that can supply energy to at least one different IMD each. Although the proposed
work does not call for a demonstration of these capabilities due to scope constraints, the SIPS
versatility and potential for expansion is definitely established and presented as a future works
topic.
3.1.2 Linearity
The measurements taken from the table are plotted below and show that the micro-
generator has a very linear response to changes in RPM as seen on Figure 3.6.
This is important because it gives one a clear picture when selecting an operating point
around the constant systolic/diastolic fluctuations in blood pressure that are inherent to the
circulatory system. The figures below show the linearity of the induced voltage, both Vhigh and
Vlow, as well as the currents I high and I low flowing through a 10.1 Ω load, where Vhigh and
Ihigh represent the voltage and current from two contiguous coils whose phases partially add
constructively, as opposed to Vlow and Ilow where only one coil is used.
3.2 Frequency Response Analysis
The frequency response of the generator was analyzed with a VersaSTAT4 model 400
frequency analyzer. One coil set (single phase output) was connected to the analyzer as the
frequency was changed from 0 to 100 KHz. The coil’s impedance components Z-real and Z-

33
imag, as well as the phase angle were then obtained and tabulated. Table 3.2 below shows the
results. Additionally, the RPM corresponding to each frequency was calculated using Eq. 3.1.
Figure 3.6 Voltage (top) and current (bottom) linear response w.r.t. kRPM
As expected, at low frequencies, the coil’s impedance was found to be real and the
percent difference between the magnitude of the total impedance |Z| and Z-real are negligible.
This percent difference will only be approximately one tenth of 1% for any of the three phased
outputs, as measured with respect to ground. Notice that the phase change is also negligible at
very low frequencies around 126 Hz, or the equivalent 1260 RPM.
As the frequency increases, though, this difference becomes more significant and any
impedance matching circuit must include an imaginary component if maximum power transfer is
to be achieved. One of the constraints inherent to any cardiovascular generator is that there is a
limit as to how fast the turbine is able to rotate.
34
0
20
40
60
80
100
1 100 10000
Z Phase Deg. vs. Freq (Hz)
Z Phase
1
10
100
1000
1 100 10000
|Z| (Ωs) vs Freq(Hz)
Zmag
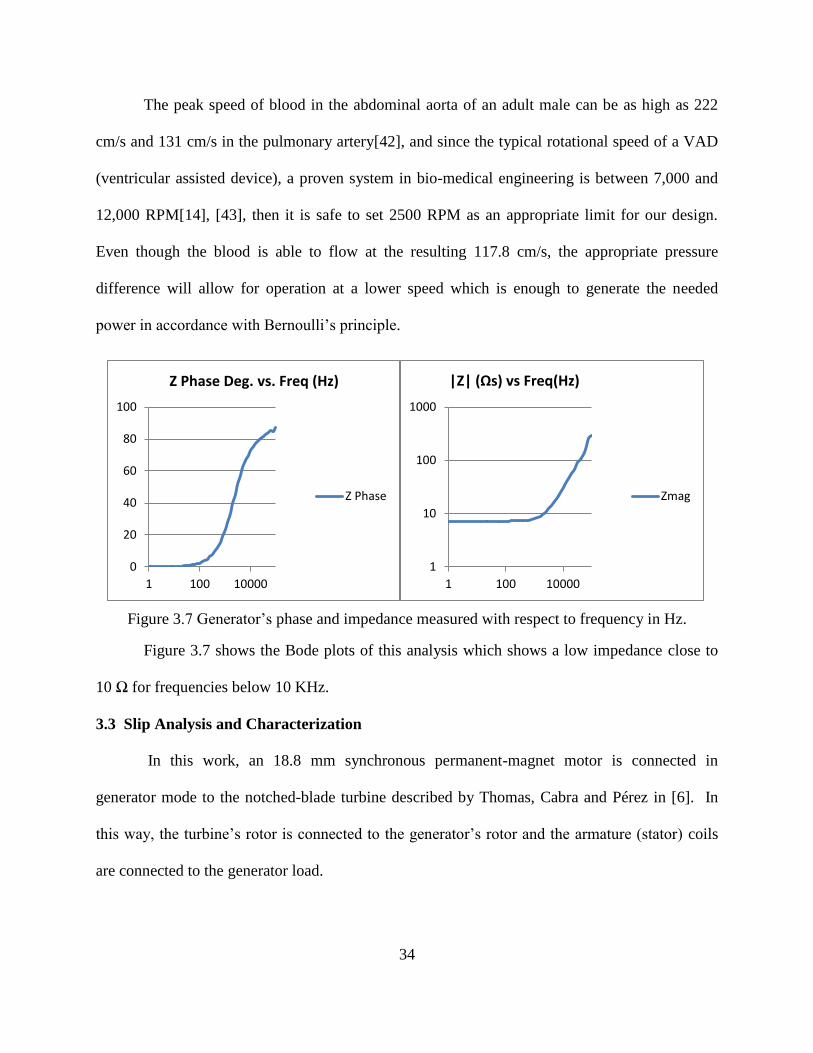
The peak speed of blood in the abdominal aorta of an adult male can be as high as 222
cm/s and 131 cm/s in the pulmonary artery[42], and since the typical rotational speed of a VAD
(ventricular assisted device), a proven system in bio-medical engineering is between 7,000 and
12,000 RPM[14], [43], then it is safe to set 2500 RPM as an appropriate limit for our design.
Even though the blood is able to flow at the resulting 117.8 cm/s, the appropriate pressure
difference will allow for operation at a lower speed which is enough to generate the needed
power in accordance with Bernoulli’s principle.
Figure 3.7 Generator’s phase and impedance measured with respect to frequency in Hz.
Figure 3.7 shows the Bode plots of this analysis which shows a low impedance close to
10 Ω for frequencies below 10 KHz.
3.3 Slip Analysis and Characterization
In this work, an 18.8 mm synchronous permanent-magnet motor is connected in
generator mode to the notched-blade turbine described by Thomas, Cabra and Pérez in [6]. In
this way, the turbine’s rotor is connected to the generator’s rotor and the armature (stator) coils
are connected to the generator load.

35
Since the generator is no longer synchronized to a stator-specific frequency like the
motor was, it is termed an asynchronous (induction) permanent-magnet brushless generator able
to induce a voltage into its coils when its rotor is moved by the coupled turbine.
Table 3.2 Calculated RPM from generator’s frequency response and percent difference between
|Z| and Z-real.
RPM Frequency
(Hz)
Z
Phase
Zmag %Diff.
Z-real & |Z|
10000 1000 23.13 7.95935 8.37%
7943.28 794.3282 18.7816 7.71127 5.47%
6309.57 630.9573 15.0074 7.54423 3.47%
5011.87 501.1872 12.1617 7.44418 2.27%
3981.07 398.1072 9.71716 7.37504 1.45%
3162.28 316.2278 7.66803 7.32918 0.90%
2511.89 251.1886 6.21161 7.3035 0.59%
1995.26 199.5262 4.91185 7.28232 0.37%
1584.89 158.4893 3.85159 7.27079 0.23%
1258.93 125.8925 3.10152 7.26304 0.15%
1000 100 2.41602 7.25723 0.09%
794.328 79.43282 1.91782 7.25406 0.06%
630.957 63.09573 1.54752 7.25175 0.04%
501.187 50.11872 1.22457 7.25009 0.02%
398.107 39.81072 0.95714 7.24901 0.01%
316.228 31.62278 0.77091 7.24831 0.01%
251.189 25.11886 0.61283 7.24761 0.01%
Additionally, since this generator will be used as an implantable power source coupled to
the cardiovascular system of a higher mammal; and the cardiac cycles of systole and dyastole
continuously change the blood pressure in the circulation that moves the turbine, then the
induced sinusoid will be also variable, both in frequency and in amplitude since the induced
voltage (and its frequency) is proportional to the speed of change of the magnetic field that
produces it (as stated in previous sections).

36
In any power generator it is important to track any changes in voltage, phase and slip.
The voltage, which is the electric potential or force able to move electrons in a given direction is
a common measurement. Not so well understood, the phase and slip are comparissons between
two different signals, where the phase is the separation of the peaks or vallies of two signals in
degrees or radians.
Figure 3.8 Motor & generator modes of an electric machine. Torque and current vs synchronous
speed (Ns) and slip[75].
In our case, three sinusoids are generated all of which are separated 120 degrees from the
next. The slip (in a typical synchronous or asynchronous generator) is a measure of the frequency
difference between the frequency of the rotor (shaft speed, ωr) that rotates past each armature
coil and that of the resulting induced signal seen at the armature coil terminals (synchronous
speed ωs – the speed at which the rotor, in a traditional generator, is synchronized to the grid).

37
The slip (see Figure 3.8[44]) is a number between 0 and 1 that reveals: 1) Whether the
device is operating as a motor (positive slip) or as a generator (negative slip) 2) In large
generators connected to the grid, it shows whether or not the power generator is synchronized to
the grid 3) In wind turbine generators, it indicates whether enough power is being extracted from
the system.
For the microgenerator used in this work, the author is only concerned with the fact that
the device is capable of operating as a generator when rotating at the variable speeds provided by
the circulatory system (approximately 500 to 2500 RPM). Obviously, the speeds in the 500 to
1000 RPM range will not induce as much voltage into the coils, but it is necessary to consider
the entire range as a measure of the potential of the SIPS to manage small amounts of energy and
convert it into useful power.
The specific operating speed range will be determined by the location of implantation,
which will be discussed in later sections. The slip equation,
s = (ωs-ωr) / ωs ( Eq. 3.2 )
shows that when the rotor speed, ωr is the same as the synchronous speed ωs, the rotor is idle
and there is no induction and no torque, as is seen in Figure 3.8[45]. When ωr increases past ωs,
the machine works as a generator and is able to produce power or convert the torque experienced
by the turbine into useful electrical energy.
It can be seen from the graph of Figure 3.9 that the slip of our generator is appropriately
negative. The points on the graph were obtained by measuring the frequency fs (in Hz) of the
signal induced at one of the stator coils and using slip Eq. 3.2, with the rotor speed ωr obtained
from Eq. 3.1.

38
-9.00%
-8.00%
-7.00%
-6.00%
-5.00%
-4.00%
-3.00%
-2.00%
-1.00%
0.00%
0 1000 2000 3000 4000
Slip vs RPM - Generator Mode
In order to measure the frequency fs, the set up of section 3.1.1 was used with a 10 Ω
load across a single coil of the generator. The frequency was then measured from the coil signal
obtained with the oscilloscope.
It must be noted that for a particular generator (or motor), for a small enough slip,
between 0 and 0.1, the slip is directly proportional to the torque. And for larger slip values
above 0.1, the torque is inversely proportional to the slip[46]. By inspecting the graphs in
Figures 3.8 and 3.9, it is important to notice that the slip values of our generator in Figure 3.9 are
below 0.1 (10%) and that the graph is actually directly proportional to the torque graph of Figure
3.8. Notice that at the linear part of the slip curve in Figure 3.9 is in the expected RPM
operational speed range (500 to 2500 RPM). Since the power is proportional to the torque, the
author can expect to extract the power needed to support his hypothesis that the SIMS would be
able to power an apropriately chosen IMD.
Figure 3.9 Micro-generator single coil characterization shows negative slip with increasing
rotational speed using a 10 Ω load.

39
CHAPTER 4: SYMBIOTIC INTRACORPORIAL POWER SOURCE (SIPS) DESIGN
AND SIMULATIONS
4.1 Overview
In this section, it will be shown how the process of energy extraction from the circulatory
system is possible and what implementation options are available to ensure that enough power is
obtained to source the IMD of choice. This is a process of integration through which each part
of the system is coupled and optimized for implantation, maximum power transfer and
efficiency, in that order. If implantation is not optimized, then the other too may be sacrificed to
negotiate a suitable operating point that still manages to provide the power needed for as many
IMDs as possible.
Figure 4.1 Symbiosis of SIPS revisited.
The symbiotic relationship of the SIPS with the circulatory system is revealed for the first
time in Figure 2.1. The graph is updated and reprinted in this section as Figure 4.1 for ease of
understanding. The intersecting areas of Figure 4.1 (each marked with a star) are explained
further to ensure integration.

40
Notice that the area between the Circulatory System and the SIPS is where the turbine
operates, since it is the point of interface between these two areas of the system. In other words,
it is where the mechanical energy is transferred to the generator’s rotor. Likewise, the area
between the Circulatory System and the IMD can be termed Implantable Biocompatible
Electrodes (IBE), which is a topic of extensive on-going research in biomedical engineering, but
is not a proposed topic of investigation in this work. Suffice it to say that the SIPS provides the
necessary energy for many types of IMDs which may require different types of electrode
systems.
Figure 4.2 SIPS block diagram illustrating integration of its salient features.
The last area to consider, and the one that will be extensively discussed in this work, is
that which lies between the SIPS and IMD circles. This area (including the Turbine) is presented
as a block diagram in Figure 4.2 below. Here, it can be seen that the circulation of blood (fluid
input to fluid output) provides impulse to the notched blades and should maintain a constant flow
of blood with only 10% in pressure drop in the circulatory system, as described by Cabra in [28].
If 10 mW of power is extracted, it could also be described as a power harvest of approximately 1
mW per mmHg.

41
Since two generators’ permanent-magnet rings connect to the turbine on either side, the
turbine action is balanced and the two rings will rotate simultaneously, in opposite (clockwise
and anti-clockwise) directions. The resulting moving magnetic fields then induce a current into
the armature coils and each voltage can be measured at the coil ends. This voltage and current
will increase with the rotational speed and will need to be rectified, then stored in a capacitor
before the output can source the IMD.
The following sections depict different PSAC configurations, and present an analysis of
the same, always seeking to minimize the size, maximize power and increase efficiency.
4.2 Voltage Rectification
As it was explained in previous sections, the raw power obtained from our generator has
to be rectified and conditioned to accommodate the requirements of the IMD. This AC to DC
conversion must be analyzed to ensure that the size of the circuit is minimized and the output DC
level is maximized. There are multiple ways to achieve these goals depending on the available
real estate and the amount of power needed.
4.2.1 Full Rectification
A full wave rectifier presents the advantage of maximum power extraction, but it will
occupy a greater area. Figure 4.3 below[47] shows a typical full-wave rectifier able to extract
power with every excursion of the oscillating signal. But notice that for every peak of the
sinusoid (positive and negative), two diodes conduct at the same time and there is a double
internal loss per phase.
If the generator output is 0.9 volts (see table 4.1), then for a typical diode with 0.7
internal drop, then there is not enough amplitude to support a 1.4 volt drop across two diodes,
and the output is zero.

42
Figure 4.3 One full-wave rectifier per phase.
If Schottky diodes are used with a typical voltage drop of 0.3 volts, then there is 0.3 volts
available per phase at the output and 0.9 volts per generator, which becomes 1.8 volts for a dual-
generator system. This is still not sufficient to power most an active IMDs such as, a pacemaker,
cardiac defibrillator, neurological stimulator, drug pump or cochlear implant[39]. From table 3.1
it can be seen that in order to obtain 0.9 volts out of this generator, the turbine must be able to
maintain a rotational speed of 4.5 kRPM, which is not may not be supported by the circulatory
system. Additionally, a full wave rectifier per phase with a dual generator system would mean
24 diodes and 6 capacitors, a very expensive proposition in terms of real estate. Therefore,
another solution must be explored that would help in minimizing real estate and maximizing
power output.
Another approach is to use a 3-phase, full-wave rectifier as shown in Figure 4.4[48].
Here all 3-phases are rectified using a set of only 6 diodes, thus reducing the number of diodes
per generator by 6. This is encouraging since the space available for implantable devices is
limited and must be reduced whenever possible to minimize the impact on the body.
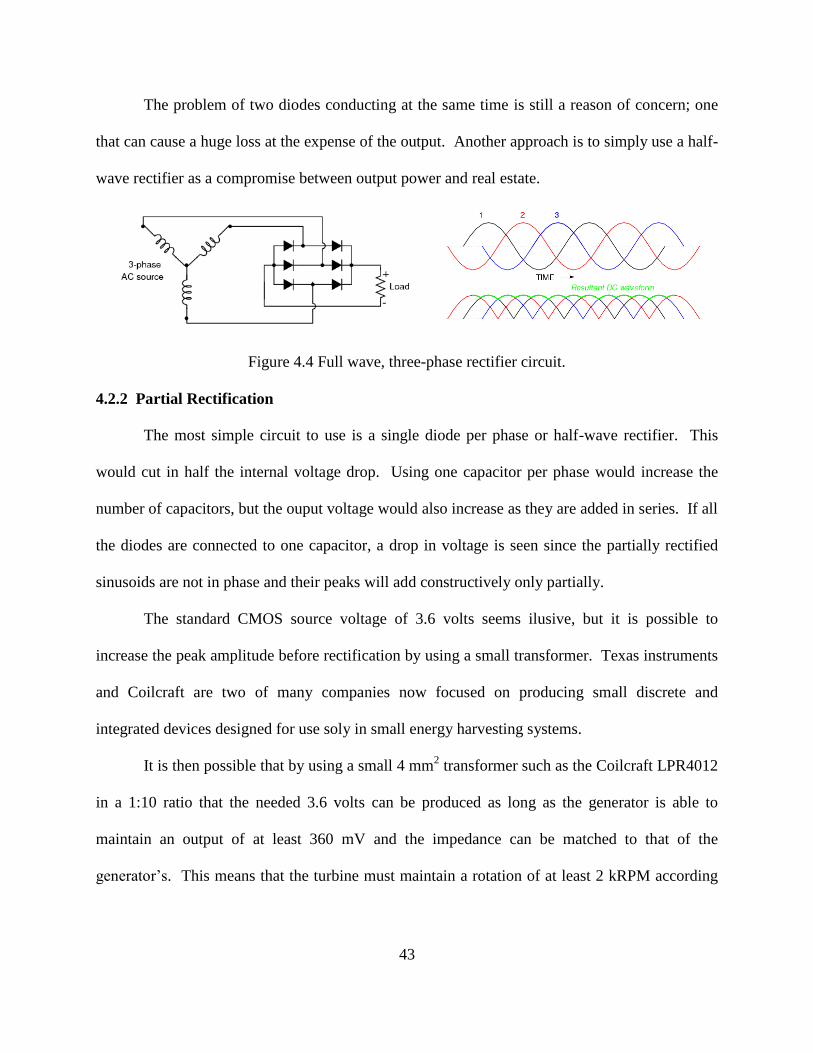
43
The problem of two diodes conducting at the same time is still a reason of concern; one
that can cause a huge loss at the expense of the output. Another approach is to simply use a half-
wave rectifier as a compromise between output power and real estate.
Figure 4.4 Full wave, three-phase rectifier circuit.
4.2.2 Partial Rectification
The most simple circuit to use is a single diode per phase or half-wave rectifier. This
would cut in half the internal voltage drop. Using one capacitor per phase would increase the
number of capacitors, but the ouput voltage would also increase as they are added in series. If all
the diodes are connected to one capacitor, a drop in voltage is seen since the partially rectified
sinusoids are not in phase and their peaks will add constructively only partially.
The standard CMOS source voltage of 3.6 volts seems ilusive, but it is possible to
increase the peak amplitude before rectification by using a small transformer. Texas instruments
and Coilcraft are two of many companies now focused on producing small discrete and
integrated devices designed for use soly in small energy harvesting systems.
It is then possible that by using a small 4 mm2 transformer such as the Coilcraft LPR4012
in a 1:10 ratio that the needed 3.6 volts can be produced as long as the generator is able to
maintain an output of at least 360 mV and the impedance can be matched to that of the
generator’s. This means that the turbine must maintain a rotation of at least 2 kRPM according
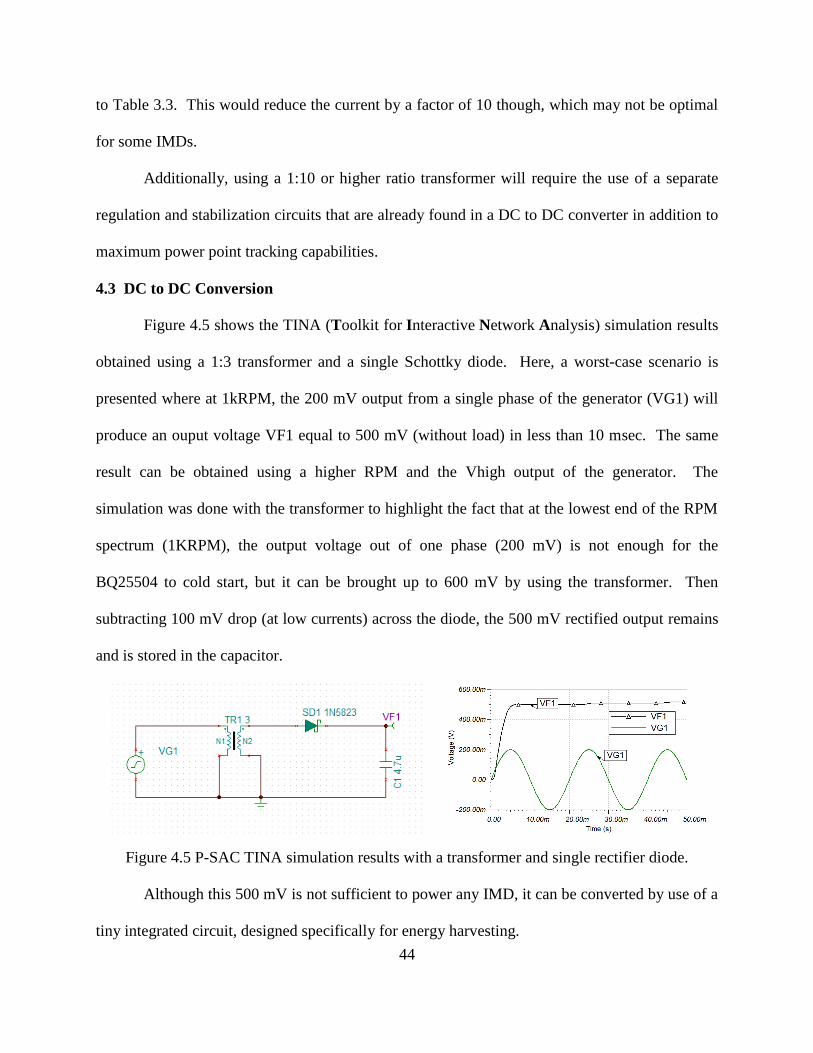
44
to Table 3.3. This would reduce the current by a factor of 10 though, which may not be optimal
for some IMDs.
Additionally, using a 1:10 or higher ratio transformer will require the use of a separate
regulation and stabilization circuits that are already found in a DC to DC converter in addition to
maximum power point tracking capabilities.
4.3 DC to DC Conversion
Figure 4.5 shows the TINA (Toolkit for Interactive Network Analysis) simulation results
obtained using a 1:3 transformer and a single Schottky diode. Here, a worst-case scenario is
presented where at 1kRPM, the 200 mV output from a single phase of the generator (VG1) will
produce an ouput voltage VF1 equal to 500 mV (without load) in less than 10 msec. The same
result can be obtained using a higher RPM and the Vhigh output of the generator. The
simulation was done with the transformer to highlight the fact that at the lowest end of the RPM
spectrum (1KRPM), the output voltage out of one phase (200 mV) is not enough for the
BQ25504 to cold start, but it can be brought up to 600 mV by using the transformer. Then
subtracting 100 mV drop (at low currents) across the diode, the 500 mV rectified output remains
and is stored in the capacitor.
Figure 4.5 P-SAC TINA simulation results with a transformer and single rectifier diode.
Although this 500 mV is not sufficient to power any IMD, it can be converted by use of a
tiny integrated circuit, designed specifically for energy harvesting.
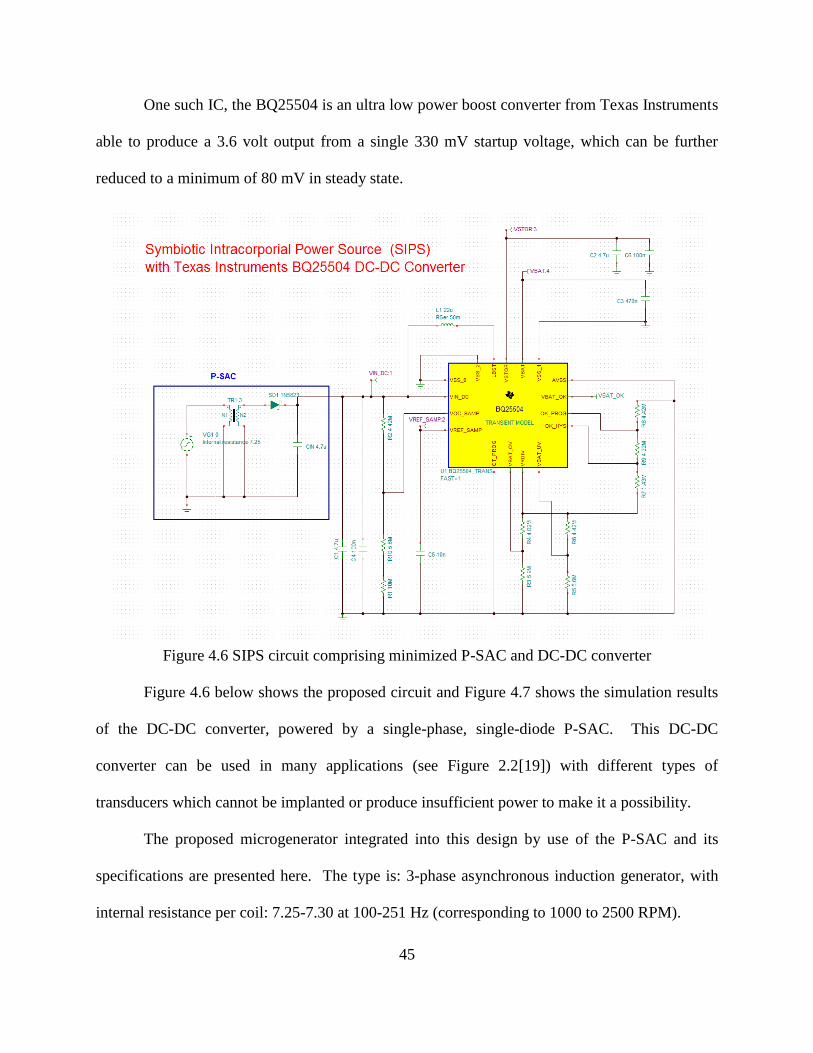
45
One such IC, the BQ25504 is an ultra low power boost converter from Texas Instruments
able to produce a 3.6 volt output from a single 330 mV startup voltage, which can be further
reduced to a minimum of 80 mV in steady state.
Figure 4.6 SIPS circuit comprising minimized P-SAC and DC-DC converter
Figure 4.6 below shows the proposed circuit and Figure 4.7 shows the simulation results
of the DC-DC converter, powered by a single-phase, single-diode P-SAC. This DC-DC
converter can be used in many applications (see Figure 2.2[19]) with different types of
transducers which cannot be implanted or produce insufficient power to make it a possibility.
The proposed microgenerator integrated into this design by use of the P-SAC and its
specifications are presented here. The type is: 3-phase asynchronous induction generator, with
internal resistance per coil: 7.25-7.30 at 100-251 Hz (corresponding to 1000 to 2500 RPM).
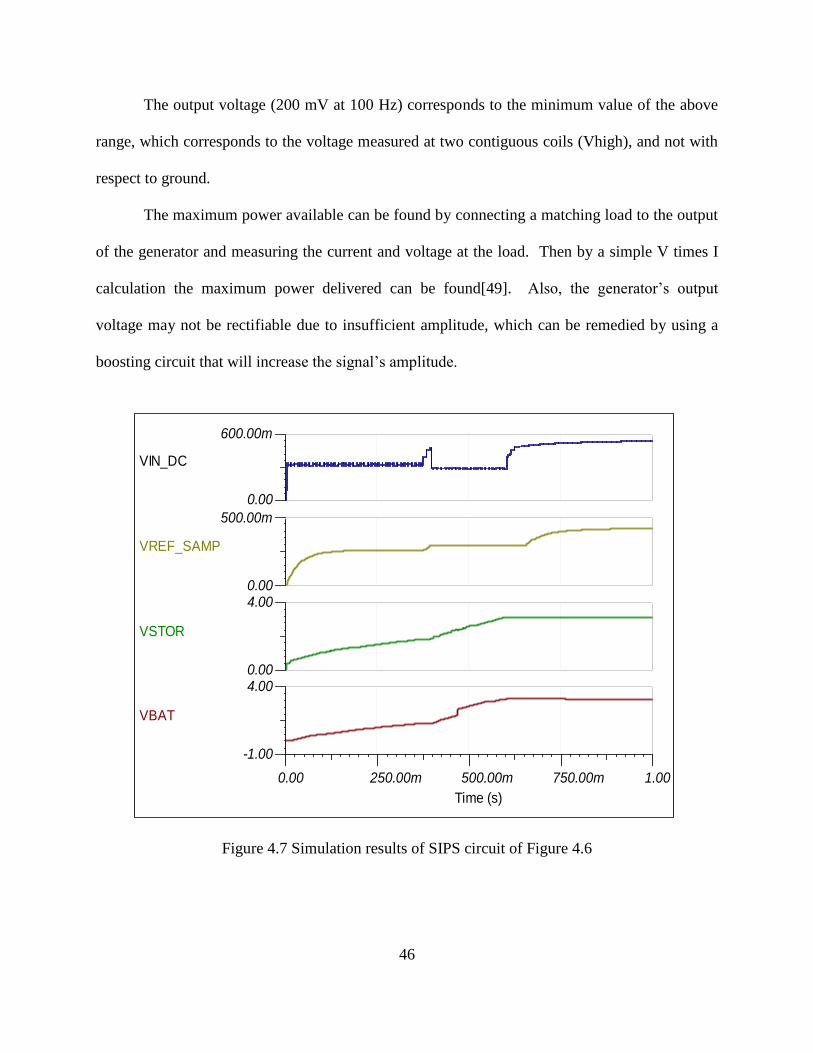
46
The output voltage (200 mV at 100 Hz) corresponds to the minimum value of the above
range, which corresponds to the voltage measured at two contiguous coils (Vhigh), and not with
respect to ground.
The maximum power available can be found by connecting a matching load to the output
of the generator and measuring the current and voltage at the load. Then by a simple V times I
calculation the maximum power delivered can be found[49]. Also, the generator’s output
voltage may not be rectifiable due to insufficient amplitude, which can be remedied by using a
boosting circuit that will increase the signal’s amplitude.
Figure 4.7 Simulation results of SIPS circuit of Figure 4.6
T
Time (s)
0.00 250.00m 500.00m 750.00m 1.00
VIN_DC
0.00
600.00m
VREF_SAMP
0.00
500.00m
VSTOR
0.00
4.00
VBAT
-1.00
4.00

47
One option is to use a transformer which can be used to boost to a much higher voltage
and obviate the need of the DC-DC converter, but transformers used in this manner are much
bulkier, incur winding and core losses that produce more heat than is desired in IMD
applications. The author will continue the approach of using a DC-DC converter and consider
other converters, such as the LTC 3105 and LTC 3108, since they offer the advantage of starting
at a lower input voltage than the BQ25504. The circuits above can then be implemented without
the transformer by simply allowing the generator to rotate at a higher RPM and by using two
contiguous coils in series, producing the higher voltage and current (Vhigh and Ihigh in Table
3.1) that are needed.

48
CHAPTER 5: HEMODYNAMIC ANALYSIS OF THE CIRCULATORY SYSTEM
The cardiovascular system of a higher mammal is a vast source of energy that supports
life not only in the physiological sense through the constant exchange of nutrients and waste
products at the cellular level, but mechanically as well, maintaining consistent pressure and flow
of the blood. Most of this energy goes unused and can be classified as pressure energy, kinetic
energy and volumetric potential energy.
5.1 Principles of Blood Flow
The continuous pumping action of the heart (a mechanical pump) in the circulatory
system helps maintain pressure on the sides of the vessels and imparts kinetic energy to the
blood.
The greatest energy can be seen in the aortic arch as the blood leaves the left ventricle on
its way to the major vessels of the body. As the blood moves farther from the heart, the arteries
narrow and bifurcate (divide) into smaller arteries, arterioles and finally capillaries, where the
exchange of nutrients and waste products takes place.
Since the blood has mass, the kinetic energy that it carries is proportional to ½ mv2,
where v is the velocity of the blood. If the diameter of the vessel is decreased, by the law of
conservation of mass, the velocity v, must increase in order to move the same mass through the
vessel. The pressure is said that has been converted to kinetic energy. Once past the narrowing
part, the flow will resume as before and the pressure increases back to the level prior to the
narrowing.

49
This is a very important application of Bernoulli’s principle[51], illustrated below in
Figure 5.1[52], where the total energy of flow through a narrowed portion is conserved by
converting pressure energy to kinetic energy and vice-versa.
At two different points, P1 and P2 of a vessel with corresponding cross-sectional areas
A1 and A2, where A2 < A1, it follows that P1 > P2 and velocity v2 > v1.
Figure 5.1 Bernoulli’s principle of blood flow[76].
The movement of blood in the blood vessels is therefore determined by the pressure
difference between to given points. This allows for the placement of our generator in different
areas of the body as long as the pressure differential is sufficient to maintain proper flow and
sustain turbine action. Figure 5.2[42] below shows a measure of the energy distribution due to
both pressure energy and kinetic energy of the blood in the circulatory system. Here both the
highest pressure in mmHg and the highest speed in cm/s can be found in the aorta.
From Figure 5.2 below, it can be seen that the average pressure found in the aorta is
about 100 mmHg, which is average of the systolic and diastolic pressures, while the average
flow rate out of the left ventricle of an adult into the aorta is approximately 5 L/min.

50
This means that the average power the heart produces can be calculated by the product of
the pressure and the flow rate. Using simple conversions into SI unit, a pressure of 100 mmHg is
100*133.32 Pa and a flow of 5L/min is 5*(.001 m3/60sec), or .0000833 m
3/sec, therefore, the
power produced by the heart is 1.111 Watts. Using the same rational, the power produced by the
heart in one stroke (70 mL) is 15.5 mW. In order to use this power judiciously, a rule of thumb
for power extraction can be instituted here, limiting it to no more than 10% of the cardiac output,
which means that no more than 111.1 mW should be extracted from the heart’s output per
minute or no more than 1.55 mW should be extracted per stroke for every beat. On average, the
length of a beat is typically 1 second, then 1.55 mJ of energy per second can be extracted from
the heart. From Table 2.2 it can be seen that cochlear implants are at the top of the power
consumption chain with 10 mW, so in order to power 100% of the devices on the table, care
must be taken to store enough energy in a capacitor and use it intermittently if the rule of thumb
established above is strictly enforced.
Figure 5.2 Blood pressure levels in the circulatory system[77].

51
According to Bernoulli’s principle, pressure can be converted into kinetic energy thus
ensuring that the speed of the flow is sufficient to maintain the proper rotational speed of the
turbine as described in previous sections.
The following section explores different ways to connect the turbine to the different
vessels of the circulatory system in order to maintain such speed.
According to [28], the 3.5X design of the notched turbine generator will produce a 10%
drop in blood pressure when the turbine is connected to a closed-loop system. Figure 5.3 shows
the relationship between the inlet pressure and the associated volume flow rate.
Figure 5.3 Inlet pressure vs. volume flow rate of a notched-blade turbine[28].
Assuming that the outlet pressure is held constant at 13.333 KPa, changes in the inlet
pressure will determine how much of a drop the system will experience. The relationship is
inversely proportional, that is, the lower the inlet pressure, the lower the drop in pressure to the
system.
The small turbine proposed as an integral part of the SIPS would have a much smaller
working volume, which may lead to a similar drop in system pressure assuming all other
conditions and variables are not changed.

52
The exact calculation and measurement of this drop will be accomplished as a
hemodynamic test bench analysis once the turbine’s 3D model is printed.
Additionally, inherent compensatory mechanisms that adjust the blood pressure in major
vessels by controlling the resistance of distal vessels must be considered (autoregulation of organ
blood flow[53]), since they ensure the correct perfusion of organs within a wide range of blood
pressure limits below the normal 120/80 mm Hg defined by the American Heart Association
(AHA).
The ultimate decision to implant a SIPS rests with the physician that knows best the
patient’s history and have ascertained the best course of action for treating their patient.
5.2 Anastomoses and Cross-Coupling of SIPS
In order to covert mechanical energy into electrical energy, the blood in the circulatory
system must be diverted into the SIPS’ turbine to produce the alternating electromagnetic waves
at the stator coils that are then rectified and conditioned for use by an active implantable medical
device (AIMD). The input and output to the turbine must then be surgically connected
(anastomosed) to the circulatory system in one of several ways, according to the ne ed for power
and location of the AIMD. This connection can be made in parallel or in series and will be
termed according to the type of vessels with which the connection is made.
5.3 Artery-to-Artery Anastomosis
This is a naturally occurring connection, necessary for the efficient perfusion of
important tissues in every higher mammal. The most famous example being the Circle of Willis
found at the base of the brain which ensures adequate perfusion to this most important organ in
the body[54]. Therefore, the proposed system can be anastomosed by connecting its input to a
high pressure artery, and its output to a lower pressure artery as can be seen on Figure 5.4.
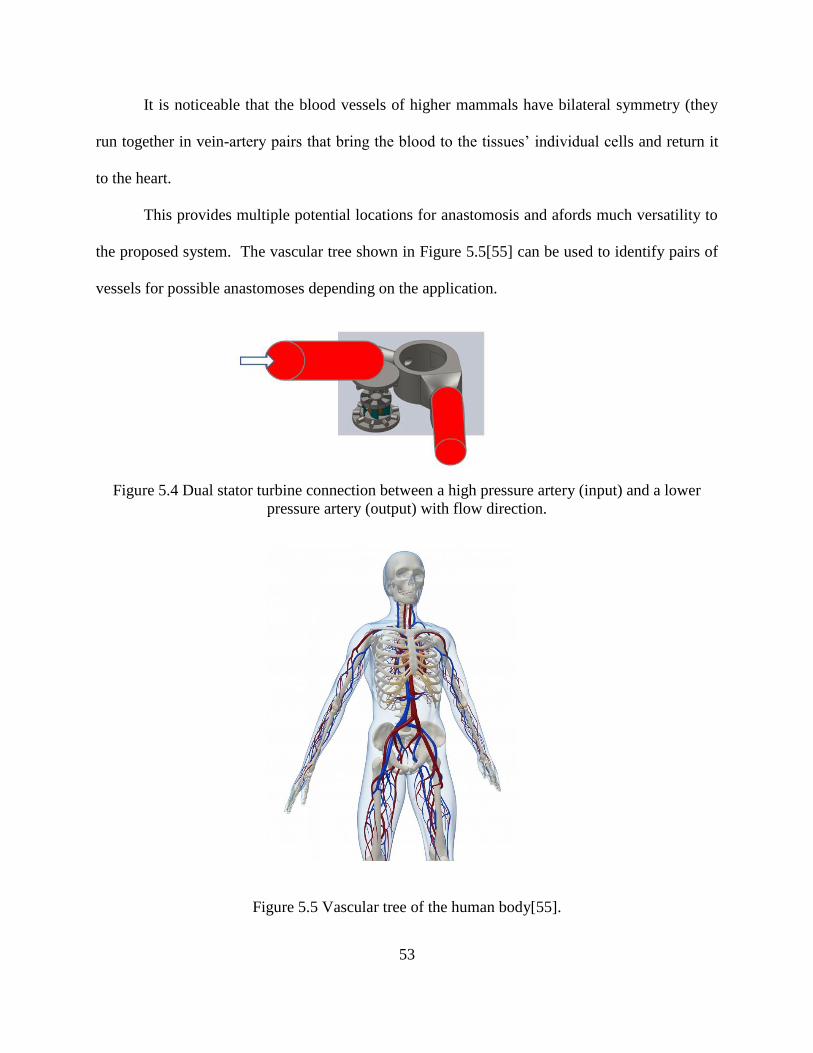
53
It is noticeable that the blood vessels of higher mammals have bilateral symmetry (they
run together in vein-artery pairs that bring the blood to the tissues’ individual cells and return it
to the heart.
This provides multiple potential locations for anastomosis and afords much versatility to
the proposed system. The vascular tree shown in Figure 5.5[55] can be used to identify pairs of
vessels for possible anastomoses depending on the application.
Figure 5.4 Dual stator turbine connection between a high pressure artery (input) and a lower
pressure artery (output) with flow direction.
Figure 5.5 Vascular tree of the human body[55].
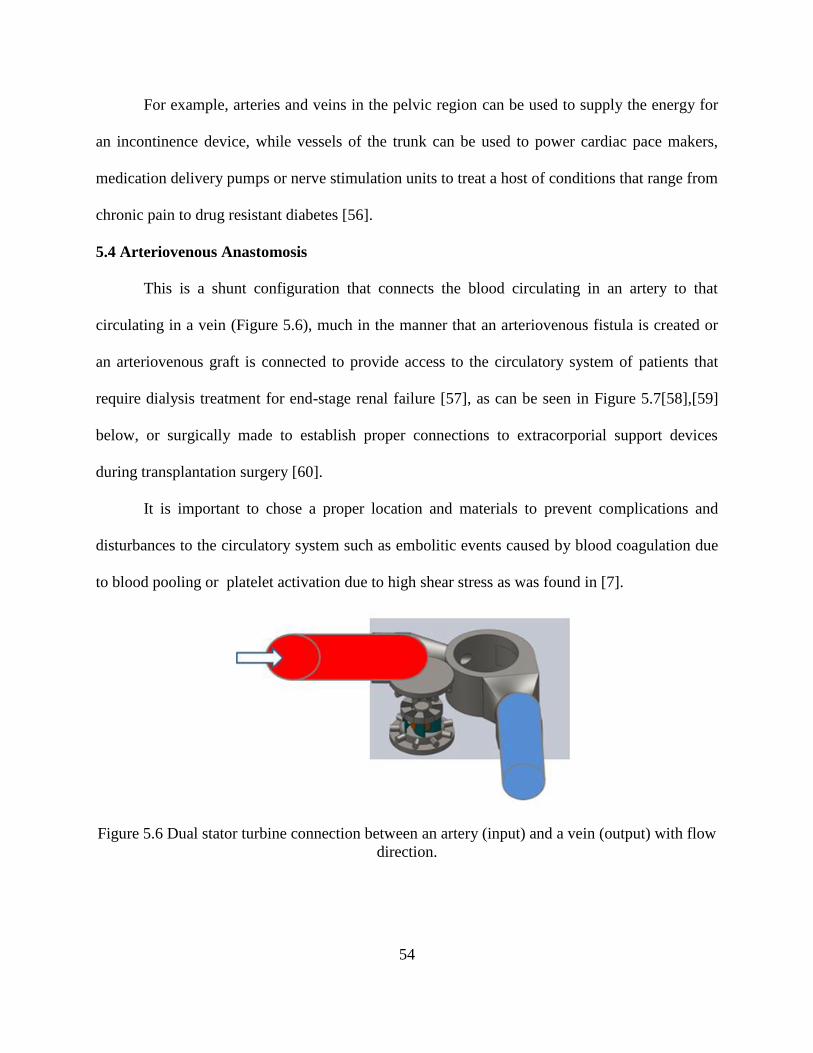
54
For example, arteries and veins in the pelvic region can be used to supply the energy for
an incontinence device, while vessels of the trunk can be used to power cardiac pace makers,
medication delivery pumps or nerve stimulation units to treat a host of conditions that range from
chronic pain to drug resistant diabetes [56].
5.4 Arteriovenous Anastomosis
This is a shunt configuration that connects the blood circulating in an artery to that
circulating in a vein (Figure 5.6), much in the manner that an arteriovenous fistula is created or
an arteriovenous graft is connected to provide access to the circulatory system of patients that
require dialysis treatment for end-stage renal failure [57], as can be seen in Figure 5.7[58],[59]
below, or surgically made to establish proper connections to extracorporial support devices
during transplantation surgery [60].
It is important to chose a proper location and materials to prevent complications and
disturbances to the circulatory system such as embolitic events caused by blood coagulation due
to blood pooling or platelet activation due to high shear stress as was found in [7].
Figure 5.6 Dual stator turbine connection between an artery (input) and a vein (output) with flow
direction.

55
The proper site takes advantage of the high pressure of the arterial circulation and ensures
prompt return of the blood to the heart for continued flow to the lungs and throughout the rest of
the body.
Figure 5.7 Arteriovenous anastomosis (right), and arteriovenous graft (left) [78]
The turbine in the SIPS will see a pressure difference between its input and output, thus
ensuring a steady fast flow from the artery into the vein of choice [61]. This flow is
indispensable to produce the maximum rotational velocity possible, since the voltage depends on
the flux linkage between the magnetic field from the magnets and the coils [10].
5.5 Blood Components
The blood is probably the most important fluid in the human body as it carries out very
important functions, such as oxygenation of body cells such as the transport of cells that carry O2
and CO2 (RBC), fight infection (WBC) and even prevent hemorrhage when injuries occur
(Platelets). Blood is composed of plasma and elements of differing forms. In this section those
functions are considered very briefly in order to come to a better understanding of the
importance of biocompatibility and hemo-compatibility in the design and implementation of
IMDs.

56
5.5.1 Plasma
Plasma is a yellowish fluid that makes up about 60% of the volume of whole blood and is
composed of mostly water (91.5%), several proteins (7%) and traces of solutes (1.5%) that give
it a density of 1.4 times that of water[103].
Plasma is the lifeline of all cells in the body, as it carries the blood cells, oxygen, carbon
dioxide, hormones, glucose, clotting factors, and nutrients, just to name a few.
5.5.2 Blood Cells
There are three important types of blood cells considered here, the Erythrocytes (~7.8 µm
in diameter), also known as red blood cells (RBC) because they give the whole blood its red
color, stemming from the iron in their hemoglobin, a specialized protein that is able to grab a
hold of molecules of O2 and CO2 during transportation to and from the body cells and as well as
to and from the alveoli.
RBCs are able to pick up O2 and drop off CO2 at the lungs and conversely drop O2 and
pick up CO2 at the cellular level. They have a concave shape on both the front and back because
they don’t have a nucleus. This allows them to squeeze into hard to reach places and perform
their functions[79].
Leukocytes, also known as white blood cells (WBC) are specialized for fighting
infections and are able to identify foreign microorganisms that may cause harm to the body.
Thrombocytes or platelets are fragments of cells about 2 µm in diameter in the shape of a
flying saucer and are of great importance to our work, since they can be activated to change
shape, grow dendrites and release coagulation factors that start a chain reaction that culminates
in the formation of a clot[80] which would alter the normal functioning of our turbine and
produce adverse systemic effects.

57
5.6 Density, Viscosity and Hematocrit
Density is defined as weight divided by volume. When considering fluids, both gases
and liquids, density is simply the weight of the fluid in Kg per unit volume in liters or its
equivalent cubic meters or cubic centimeters (cc). At standard temperature and pressure (STP),
nitrogen is a gas and has a density of 1.2504 Kg/m3, while water at STP has a density of 1 g/cc or
1000 Kg/m3. Conversely, human blood at 37
oC, has an average density of 1060 Kg/m
3.
The concept of viscosity is less straight forward than density, since there are different
types of viscosity. Two important types of viscosity are: kinematic viscosity, which is defined as
a fluid’s natural resistance to flow when only gravity is acting on the fluid. The other type is
dynamic viscosity (Vd) which is related to kinematic viscosity (Vk) by the density (ρ) of the
fluid.
Vd = Vk* ρ (Eq 5.1)
Kinematic viscosity is measured in centistokes (cSt) while dynamic viscosity is measured
in units of Pascal times seconds (Pa*s) or in centipoise (cP), in honor of Jean Poiseuille who
discovered the way incompressible fluids flow under laminar (non-turbulent) conditions. The
law of Poiseuille states that the flow rate of an incompressible fluid in a cylindrical vessels such
as a vein or artery is proportional to the pressure difference between the ends of the vessel
multiplied by the fourth power of its radius, and that the flow rate is inversely proportional to the
fluid’s density η times the length of the vessel L. A constant of proportionality consisting of the
fluid’s density and the number π produce the following equation,
dV/dt = dP π r4/8ηL (Eq. 5.2).
The normal range of viscosity in the human blood is between 3 and 4 cP, and is linked to
the concept of hematocrit, which is simply the ratio of RBCs to the whole blood in the system.

58
The greater the amount of RBCs, the higher the density and the viscosity. This causes the
blood to move more slowly due to a higher resistance to flow. This higher density may help our
turbine because the blood would have more momentum, and the higher viscosity would generate
a flow speed that produces a steady, lower RPM rate. This is beneficial only if the generator in
the design presented in chapter 2 is able to produce high enough voltage levels at low RPMs
rather than high current levels.
5.7 Platelet Activation
Three different mechanisms by which platelets are activated will be considered in this
section. One of them is well understood, which is due to injury or breaking in the continuity of a
blood vessel. The other two, are due to changes in the flow of blood, such as abrupt acceleration
or deceleration. These cause high shear stress of the endothelium (cells that form the inside
walls of the blood vessels) and pooling or circular flow respectively and are not as well
understood as the former[81].
It can be concluded that care must be taken not to disturb the natural flow of blood to
prevent this platelet activation. One way to do this is by using biocompatible materials such as
Ni-Ti alloy and also by designing a turbine that limits high shear rates and prevents pooling of
the blood inside the blade assembly chamber. Another way to reduce the possibility of platelet
activation is by reducing the operating volume in the blade assembly chamber as well as the
contact time between the blood and the inside of the chamber. The reason for this is that under
normal circumstances the endothelium secretes chemical compounds such as nitric oxide that
inhibit the activation of platelets, and since the inside of the turbine would not have these cells, it
is quite possible that a longer time in the chamber could trigger platelet activation[82].

59
5.8 Biomaterials and Hemocompatibility
A study of any implantable medical device would not be complete without an analysis of
its compatibility with the human body, especially one that is designed to be in contact with the
most intimate part of our anatomy, the circulatory system. Therefore it is important to discuss
not only biocompatibility, but hemo-compatibility as well.
Biomaterials can be defined as simply as artificial or otherwise materials that can be used
to augment, assist or even replace some biological system[83]. The same can be said for hemo-
compatible materials with the added caveat that they must not react with or otherwise obstruct
the normal functioning of the circulatory system, especially its most sensitive components, the
blood cells. Therefore, hemolysis or the damage of RBCs, WBC’s, platelets, etc must be
avoided at all cost. The sensitivity of the platelets to high shear rates or low shear rates that
cause blood recirculation and stagnation is also of grave concern. It is for these reasons that it is
important to adhere to tried and true methods that have shown success in the use of devices with
intimate implantation requirements, those in contact with blood as it courses through the network
of vessels that make up the circulatory system.
Although there are several approaches to the problem of hemo-compatibility, such as the
use of hemo-compatible materials like titanium (considered to be the most biocompatible
material) and some alloys (Ni-Ti or Co-Cr used in cardiovascular stents)[83], no approach is
100% effective and the use of anticoagulants is still necessary whenever a blood-contacting IMD
is implemented. Another approach is to use ceramics such as SiC in a process called plasma
enhanced chemical vapor deposition (PECVD) at temperatures as low as 80 oC[84] in the form
of coatings, a process for which the Silicon Carbide Group at USF has been recognized
worldwide[85].

60
Other materials used in stents, such as hemo-compatible polymers may be used as an
internal coating covering the inside of the casing and composing the blade assembly, they are not
as durable as the hemo-compatible metals mentioned above, but they are certainly much cheaper.
In this work the proposed materials were not tested. Rather, this information is presented
to help those continuing this line of research to select which is the best option to implement, out
of those already established systems. In other words, the conclusions chapter will include some
suggestions, since the applied materials research needed to implement the hemocompatibility
requirement in the current work is beyond the scope of this dissertation.

61
CHAPTER 6: TESTING METHODS
In order to complete the integration of the EMI generator with an IMD, the circuits and
designs presented in the previous sections must now be implemented.
6.1 Structural Integrity
The fabrication of turbine that is to operate in a closed loop system must be approached
by making sure that the material is strong enough to prevent fracturing of the turbine walls under
the pressure of the fluid, that the 3D printer’s minimum feature size is small enough to prevent
leaking of fluid through the walls and that biocompatible and non-thrombogenic materials be
identified. Additionally, the circuit of Figure 4.6 may be manufactured on printed circuit board
and assembled into the casing of the generator along with the turbine, which is to be coupled to
the single or dual generator of Figure 5.3.
6.2 Testing Methodology
The testing of the proposed energy harvesting system will be completed in the following
manner:
1. No more than 3 turbine models are to be tested in-vitro.
2. Each. model consists of a turbine rotor with notched blades which are to be mounted
onto the rotor of the generator and enclosed by the casing. The blades, casing and
connectors will be designed by use of a computer assisted design (CAD) software and
3D printed using a system and material compatible with biomedical research[64].

62
3. Preliminary testing of the system will be completed using nitrogen gas and mass flow
controller and pressure gauges to determine the pressure difference and flow
necessary to rotate the blades and harvest the energy needed to power most
implantable medical devices.
4. Secondary testing will consist of creating an closed-loop system where water is
circulated through the turbine. The energy harvested will be documented at different
RPMs as well as the differential pressure (pressure drop) and flow across the system.
5. Final testing will be conducted in the same manner as in step 4 above, replacing water
with a blood simulant that carries the same properties of density and viscosity as
blood.
This testing phase will show the actual performance of the assembled device in order to
determine whether any changes or adjustments are necessary and to see new potential
applications and the possibilities of future works.
6.3 Data Collection Approach
In order to measure the raw energy harvested by the system, a variable impedance load
will be connected to the output of the generator and the voltage and current measured. The
speed of the rotor will be assessed by the frequency of the generated sinusoidal wave as
explained in section 2.1 above. This will produce a set of AC power curves that elucidate the
actual capabilities of the proposed system as well as the system’s ability to power an actual
IMD, but first the AC sinusoidal wave must be rectified using a simple, low-drop Schottky diode
and smoothing capacitor. The rectified wave will produce a DC level capable of driving the TI-
BQ25504 DC to DC converter or other voltage booster.

63
The output of the booster can then be connected to a variable DC load to measure the
voltage, current and power necessary to maintain proper operation of a typical IMD.
The following chapters present the execution, results and analysis of the proposed work
to include the fabrication of a large scale turbine (LST) as described and tested by [28],[63] and
its miniaturized version or miniature scale turbine (MST), as well as two iterations that optimize
the miniaturized version for implantation or Optimized Turbine for Implantation (OTI).

64
CHAPTER 7: DESIGN, FABRICATION AND ASSEMBLY
7.1 Introduction
The design and fabrication of the proposed implantable miniaturized turbine followed a
very methodical and empirical approach to ensure that any needed changes were implemented on
the fly instead of arriving at final conclusions and then implementing changes, and to prevent, as
much as possible, relegating those changes to future works.
The aforementioned method followed the following steps.
1. Miniaturization and testing of the MST that could be iterated and adjusted in
accordance with findings and goals.
2. Fabrication and testing of LST implementing changes born out of the preliminary
findings in step 1 and to have a point of departure for further miniaturization. This
also allowed the author to consider other potential applications of a larger system.
3. Fabrication and testing of two additional turbines (OTI-1 and OTI-2) that followed
recommended changes for optimization of the MST needed to meet the implantation
power density goals of being small enough for implantation yet harvest enough
energy to power most IMDs currently available.
7.2 Model Design
Using the work proposed by [28] as a point of departure, a notched-turbine model at
3.175X scale was chosen as a point of departure to achieve the miniaturization and optimization
proposed in this work. Figure 7.1 below shows the original blade assembly, rotor and casing.
Section 7.2.1 will address the size difference between the original model and the MST.

65
Figure 7.1 Notched-Turbine model, scale 3.175X, 2.5 inch HDD motor [28]
7.2.1 MST Model Design
Using the design specifications provided as a guideline, a 3D model for the MST was
drawn for simulation and fabrication.
Table 7.1 shows a comparison between the size of the original turbine in Figure 7.1 and
that of the MST proposed in this work. Notice that although most dimensions are reduced only
by a factor of 3, the total casing volume, which is very important for implantability, was reduced
by a factor of 44; while the operating volume, which represents the amount of fluid that is
necessary to fill the chamber and keep the turbine in operation, was reduced by a factor of 25.
The fact that the generator’s volume was only reduced by a factor of 4.51 is actually a
positive and encouraging development, since the power density remains higher than if the
volume followed a trend as that of the casing and rotor’s chamber. Simply stated, the casing’s
reduction is approximately 10 times that of the generator’s, resulting in a power density increase.
The results shown on Figure 7.2 seek to demonstrate the proper flow of the fluid as the
rotor rotates while submerged in the fluid. Notice that the high speed (colored red) spots behind
some of the blades represent points of high shear forces acting on the blades.

66
In the physical implementation, this is not necessarily the case because the fluid is
actually driving the rotor, instead of the rotor driving the blade assembly.
Table 7.1 Size comparison between original 3.175X turbine model with generator from [28] and
the new miniaturized turbine (MST) with generator proposed in this work.
Salient Feature 3.175X Original
Model
MST Reduction Ratio
Blade Assembly Diameter (mm) 34.00 10.60 3.21
Blade Assembly Height (mm) 21.00 7.10 2.96
Nozzle Diameter (mm) 3.50 1.20 2.92
Inlet Diameter (with connector)
(mm)
15.40 4.50 3.42
Outlet Diameter (with connector)
(mm)
15.40 4.50 3.42
Casing Diameter (mm) 48.50 14.50 3.34
Casing Height (with lids) (mm) 35.50 9.00 3.94
Casing Volume (mL) 65.58 1.49 44.13
Inlet Angle of Incidence (deg) 100.00 100.00 N/A
Outlet Angle of Departure (deg) 0.00 0.00 N/A
Rotor Chamber Diameter (mm) 35.00 11.50 3.04
Rotor Chamber Heigh (mm)t 23.00 8.40 2.74
Rotor Chamber Volume (mL) 22.13 0.87 25.36
Operating Volume (mL) 25.00 1.00 25.00
Generator Height (mm) 8.30 3.80 2.18
Generator Diameter (mm) 27.00 18.80 1.44
Generator Volume (mL) 4.75 1.05 4.51
Also notice the dark blue region to the left of the outlet along the negative x-axis. This
suggests the possibility of pooling in this area, so a further reduction in the diameter of the outlet
would be beneficial, since it is highly desirable to prevent the pooling of blood in an implantable
system.

67
Figure 7.2 Flow velocity profile of MST fluid in a rotating mesh.
Figure 7.3 Top view of flowlines with arrow heads representing the direction of flow and
background contour colors representing the presence or absence of turbulent behavior.

68
Figure 7.3 shows the flow trajectory represented by flow lines with arrow heads,
indicating the proper direction of flow. This flow drives the rotor in the CCW direction
producing an electromagnetic field that generates a current when a load is connected to the
output of the generator that is connected to the rotor. The fluid is then seen exiting the chamber
at the outlet. The contour colors in the background show a laminar flow inside the rotor chamber
and at the outlet and nozzle. The inlet chamber on the other hand shows a bit of turbulent
behavior that can be ameliorated by reducing the size of the inlet and increasing the size of the
nozzle. This would decrease the nozzle velocity slightly, but it would be a good compromise
between performance and optimal flow conditions.
The next subsection introduces the LST model in which the difference in inlet and outlet
diameter has been decreased, and the shape of the blades has been adjusted to improve flow
conditions.
7.2.2 LST Model Design
The changes proposed in this section include, a widening of the blades on the blade
assembly to reduce the action of shear forces behind the blades, seen highlighted in the bottom
left corner of Figure 7.4. The front angle of the blades remains the same and so does the angle of
incidence on the blade as the fluid leaves the nozzle and impacts the front of the blade. The inlet
nozzle diameter was increased and the inlet diameter reduced to facilitate passage of the fluid
without stagnation. Finally, the outlet was slightly decreased to match the reduced height of the
new model. All dimensions appear on Table 7.2. The changes proposed were implemented on a
large model (LST) and a new miniaturized model optimized for implantation (OTI-1) which is
presented in section 7.2.3 below. This allowed the author to derive a new reduction ratio table
for a comparison similar to that of Table 7.1.

69
Figure 7.4 shows the CAD drawing of the new LST, to include the casing and a lid that is
secured to the casing at six points around the assembly. This turbine is then miniaturized and
analyzed to establish a new low profile system.
The inlet and outlet connectors are not displayed, but are attached after fabrication. The
entire process is discussed in section 7.3, Model Fabrication. Table 7.2 shows the size
comparison and reduction ratios between the LST and the OTI-1.
7.2.3 OTI-1 Model Design
In this section, the new optimized LST model is miniaturized to create the OTI-1,
resulting in improved flow (when compared to the MST), higher aspect ratio (width: height) and
rounded corners, all very important features for IMDs.
Figure 7.4 LST design implementing changes stemming from first miniaturization effort
findings. All dimensions are in inches and angles in degrees. Starting at the top left corner,
the lid, blade assembly and casing are shown in a CCW direction around the page.
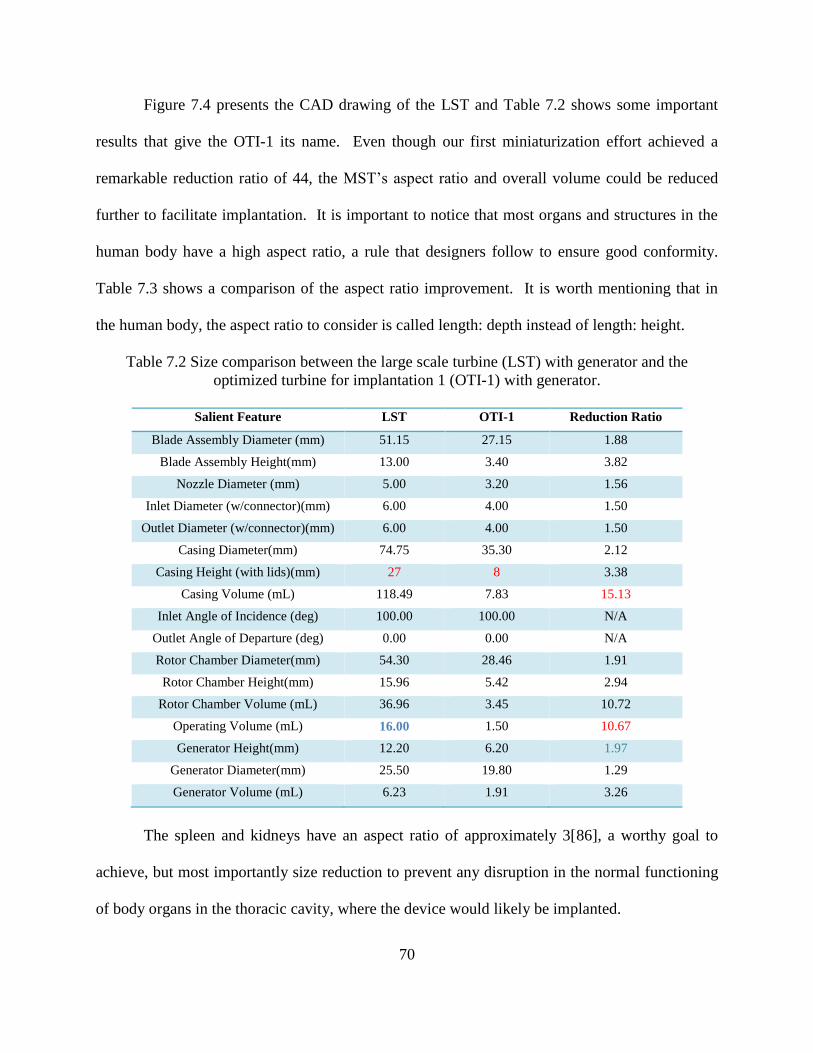
70
Figure 7.4 presents the CAD drawing of the LST and Table 7.2 shows some important
results that give the OTI-1 its name. Even though our first miniaturization effort achieved a
remarkable reduction ratio of 44, the MST’s aspect ratio and overall volume could be reduced
further to facilitate implantation. It is important to notice that most organs and structures in the
human body have a high aspect ratio, a rule that designers follow to ensure good conformity.
Table 7.3 shows a comparison of the aspect ratio improvement. It is worth mentioning that in
the human body, the aspect ratio to consider is called length: depth instead of length: height.
Table 7.2 Size comparison between the large scale turbine (LST) with generator and the
optimized turbine for implantation 1 (OTI-1) with generator.
Salient Feature LST OTI-1 Reduction Ratio
Blade Assembly Diameter (mm) 51.15 27.15 1.88
Blade Assembly Height(mm) 13.00 3.40 3.82
Nozzle Diameter (mm) 5.00 3.20 1.56
Inlet Diameter (w/connector)(mm) 6.00 4.00 1.50
Outlet Diameter (w/connector)(mm) 6.00 4.00 1.50
Casing Diameter(mm) 74.75 35.30 2.12
Casing Height (with lids)(mm) 27 8 3.38
Casing Volume (mL) 118.49 7.83 15.13
Inlet Angle of Incidence (deg) 100.00 100.00 N/A
Outlet Angle of Departure (deg) 0.00 0.00 N/A
Rotor Chamber Diameter(mm) 54.30 28.46 1.91
Rotor Chamber Height(mm) 15.96 5.42 2.94
Rotor Chamber Volume (mL) 36.96 3.45 10.72
Operating Volume (mL) 16.00 1.50 10.67
Generator Height(mm) 12.20 6.20 1.97
Generator Diameter(mm) 25.50 19.80 1.29
Generator Volume (mL) 6.23 1.91 3.26
The spleen and kidneys have an aspect ratio of approximately 3[86], a worthy goal to
achieve, but most importantly size reduction to prevent any disruption in the normal functioning
of body organs in the thoracic cavity, where the device would likely be implanted.

71
The LST has a similar aspect ratio, but it is too large for implantation, on the other hand,
OTI-1 has an aspect ratio of 4.41, which suggests that further reduction in volume would also
reduce the aspect ratio if the height remains the same, making it more suitable for use in the
thoracic cavity. This is why a second optimized turbine was introduced and is presented in
section 7.2.4 below, the OTI-2.
Table 7.3 Improved aspect ratio (length: height) with optimization and miniaturization.
Model Aspect Ratio
3.175x 1.37
MST 1.61
LST 2.77
OTI-1 4.41
OTI-2 3.13
7.2.4 OTI-2 Model Design
The miniaturization and optimization process that culminated with the OTI-2, offers a
reduction factor of 2.4 in the casing volume (3.25 mL), which reduces the displacement of local
organs, preventing increases in intrathoracic pressure when implanted. This miniaturization also
reduces the operating volume by a factor of 3 (0.5 mL) which demands less blood from the
circulatory system to remain in operation.
Table 7.4 compares the two turbines showing the highest reduction ratios highlighted in
red. Table 7.3 above also makes a final comparison of aspect ratios of all turbines considered in
this work, where the OTI-2 seems to have an aspect ratio (3.13) closest to the aspect ratio of the
spleen and kidneys (3) found in the left upper quadrant of the abdominal space and the
retroperitoneal space, respectively. In the next section the fabrication of these models is

72
considered and their features are compared as this work comes closer to the goals established in
the beginning chapters.
Table 7.4 Size comparison between the OTI-1 turbine with generator and the OTI-2 turbine with
generator.
Salient Feature OTI-1 OTI-2 Reduction Ratio
Blade Assembly Diameter(mm) 27.15 15.00 1.81
Blade Assembly Height(mm) 3.40 3.00 1.13
Nozzle Diameter (mm) 3.20 3.00 1.07
Inlet Diameter (w/connector) (mm) 4.00 3.50 1.14
Outlet Diameter (w/connector)(mm) 4.00 3.50 1.14
Casing Diameter(mm) 35.30 23.50 1.50
Casing Height (with lids)(mm) 8 7.5 1.07
Casing Volume (mL) 7.83 3.25 2.41
Inlet Angle of Incidence (deg) 100.00 100.00 N/A
Outlet Angle of Departure (deg) 0.00 0.00 N/A
Rotor Chamber Diameter(mm) 28.46 16.40 1.74
Rotor Chamber Height(mm) 5.42 3.40 1.59
Rotor Chamber Volume (mL) 3.45 0.72 4.80
Operating Volume (mL) 1.50 0.50 3.00
Generator Height(mm) 6.20 3.80 1.63
Generator Diameter(mm) 19.80 18.80 1.05
Generator Volume (mL) 1.91 1.05 1.81
7.3 Model Fabrication
Once the 3D CAD design was completed in SolidWorks, it was printed using a Zortrax
M200 3D printer. The Zortrax M200 was selected for its quality and affordability, ease of use
and history of good performance in the prototyping of biomedical devices in dentistry, medical

73
education and research [88]. The artificial heart depicted on Figure 7.3 below is an example of a
research device printed with the M200 shown on the right.
Figure 7.5 Artificial heart on the left and the Zortrax M200 3-D printer used to create it[87].
7.3.1 Zortrax M200 3D Printer
The Zortrax M200 is a remarkable 3D printer that uses proprietary software called Z-
suite, a simple and easy-to-use rendition software that converts Stereolithography (STL) files
generated in any CAD software, to a Z-code file that the printer can understand.
Every model printed consists of 3 parts: The raft, which is a platform that securely
attaches to the heated plate and supports every layer of the model. The model itself is the second
part of the print and the third is the supports used to ensure accurate model replication especially
for angled parts that hang from the main structure. The build volume is 200x200x180 cubic mm
and the parts are built on a heated, perforated, metal plate. The layer height can be selected from
90 to 400 micrometers. At 90 micrometers (less than the diameter of human hair), the details
achieved are very resolved and approximate the quality of that of an injection-molded part.
Support structures are optional, which allowed sparked the idea to design the parts and
print them in an orientation that did not require the use of support structures.
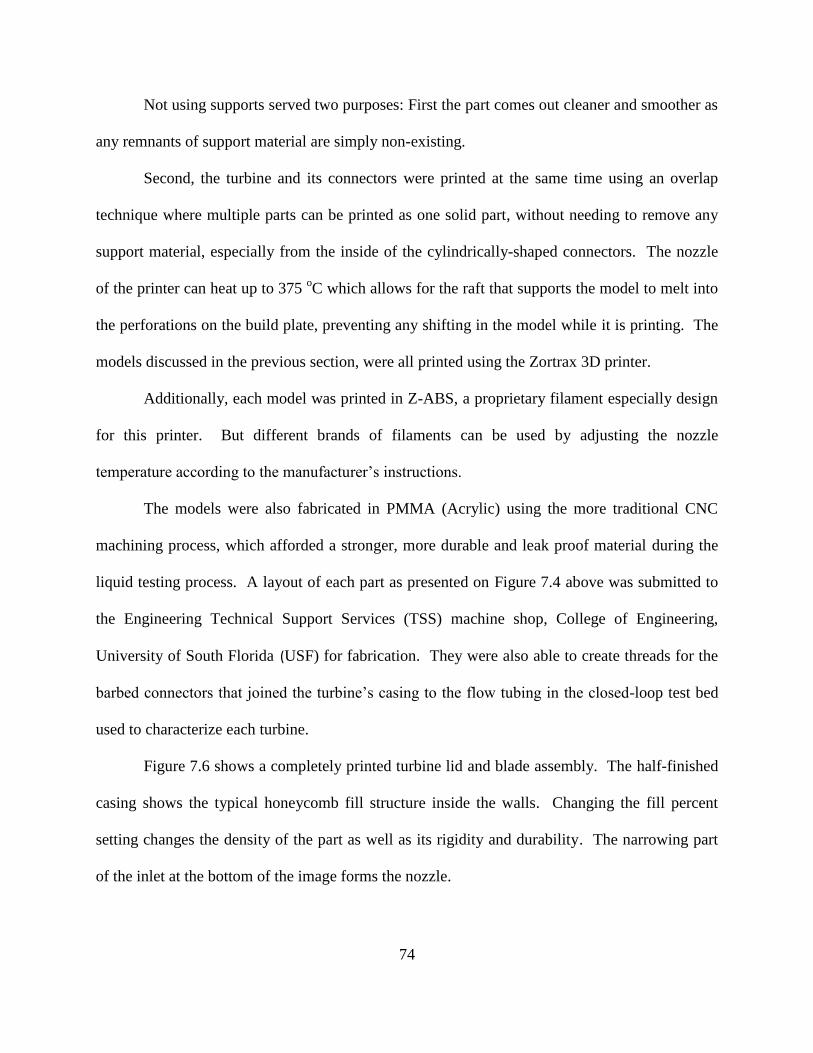
74
Not using supports served two purposes: First the part comes out cleaner and smoother as
any remnants of support material are simply non-existing.
Second, the turbine and its connectors were printed at the same time using an overlap
technique where multiple parts can be printed as one solid part, without needing to remove any
support material, especially from the inside of the cylindrically-shaped connectors. The nozzle
of the printer can heat up to 375 oC which allows for the raft that supports the model to melt into
the perforations on the build plate, preventing any shifting in the model while it is printing. The
models discussed in the previous section, were all printed using the Zortrax 3D printer.
Additionally, each model was printed in Z-ABS, a proprietary filament especially design
for this printer. But different brands of filaments can be used by adjusting the nozzle
temperature according to the manufacturer’s instructions.
The models were also fabricated in PMMA (Acrylic) using the more traditional CNC
machining process, which afforded a stronger, more durable and leak proof material during the
liquid testing process. A layout of each part as presented on Figure 7.4 above was submitted to
the Engineering Technical Support Services (TSS) machine shop, College of Engineering,
University of South Florida (USF) for fabrication. They were also able to create threads for the
barbed connectors that joined the turbine’s casing to the flow tubing in the closed-loop test bed
used to characterize each turbine.
Figure 7.6 shows a completely printed turbine lid and blade assembly. The half-finished
casing shows the typical honeycomb fill structure inside the walls. Changing the fill percent
setting changes the density of the part as well as its rigidity and durability. The narrowing part
of the inlet at the bottom of the image forms the nozzle.
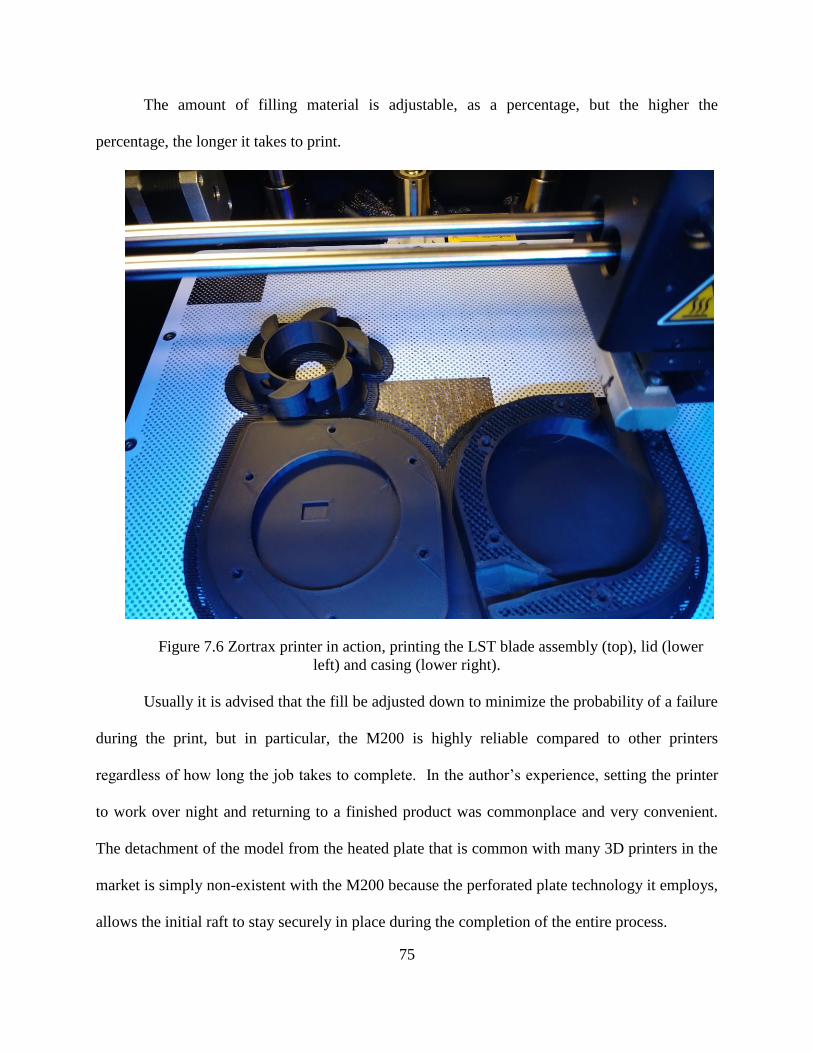
75
The amount of filling material is adjustable, as a percentage, but the higher the
percentage, the longer it takes to print.
Figure 7.6 Zortrax printer in action, printing the LST blade assembly (top), lid (lower
left) and casing (lower right).
Usually it is advised that the fill be adjusted down to minimize the probability of a failure
during the print, but in particular, the M200 is highly reliable compared to other printers
regardless of how long the job takes to complete. In the author’s experience, setting the printer
to work over night and returning to a finished product was commonplace and very convenient.
The detachment of the model from the heated plate that is common with many 3D printers in the
market is simply non-existent with the M200 because the perforated plate technology it employs,
allows the initial raft to stay securely in place during the completion of the entire process.
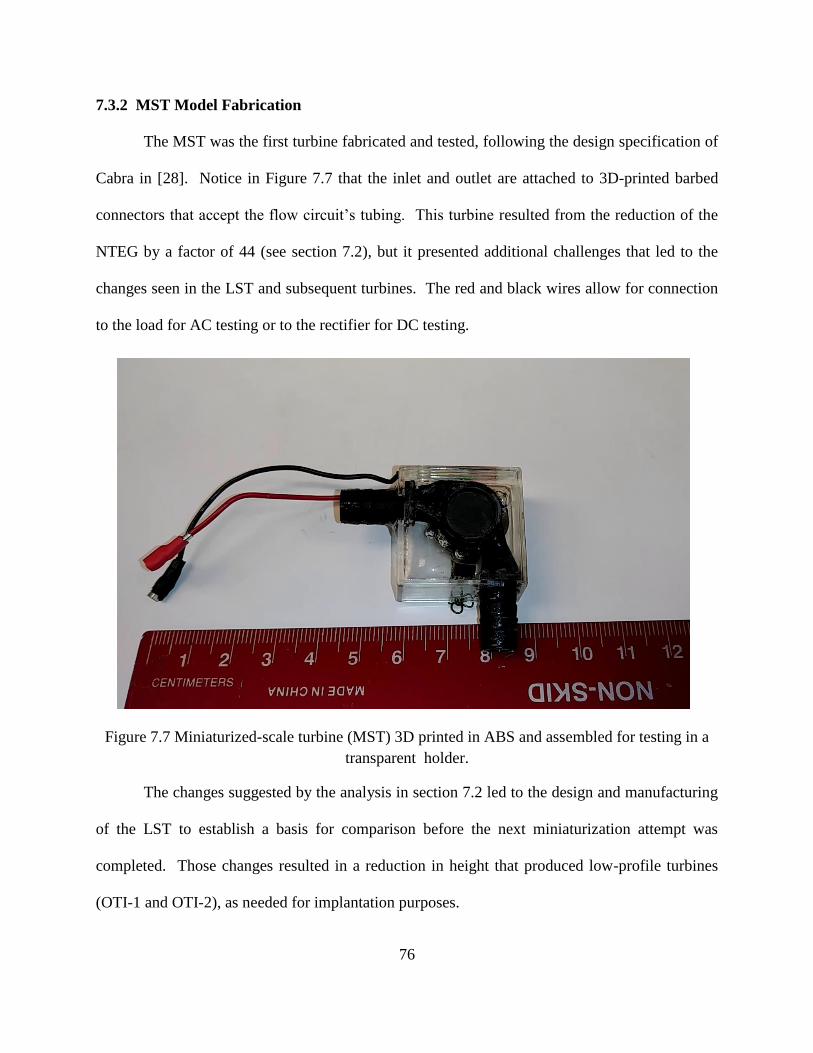
76
7.3.2 MST Model Fabrication
The MST was the first turbine fabricated and tested, following the design specification of
Cabra in [28]. Notice in Figure 7.7 that the inlet and outlet are attached to 3D-printed barbed
connectors that accept the flow circuit’s tubing. This turbine resulted from the reduction of the
NTEG by a factor of 44 (see section 7.2), but it presented additional challenges that led to the
changes seen in the LST and subsequent turbines. The red and black wires allow for connection
to the load for AC testing or to the rectifier for DC testing.
Figure 7.7 Miniaturized-scale turbine (MST) 3D printed in ABS and assembled for testing in a
transparent holder.
The changes suggested by the analysis in section 7.2 led to the design and manufacturing
of the LST to establish a basis for comparison before the next miniaturization attempt was
completed. Those changes resulted in a reduction in height that produced low-profile turbines
(OTI-1 and OTI-2), as needed for implantation purposes.
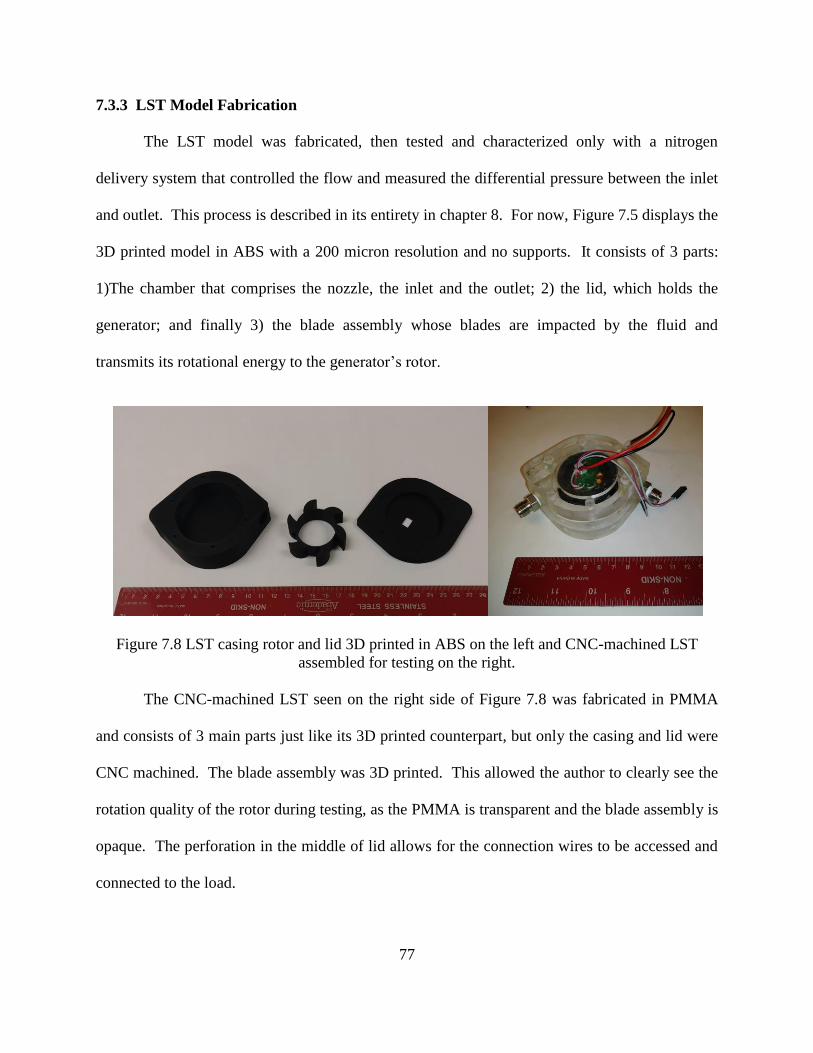
77
7.3.3 LST Model Fabrication
The LST model was fabricated, then tested and characterized only with a nitrogen
delivery system that controlled the flow and measured the differential pressure between the inlet
and outlet. This process is described in its entirety in chapter 8. For now, Figure 7.5 displays the
3D printed model in ABS with a 200 micron resolution and no supports. It consists of 3 parts:
1)The chamber that comprises the nozzle, the inlet and the outlet; 2) the lid, which holds the
generator; and finally 3) the blade assembly whose blades are impacted by the fluid and
transmits its rotational energy to the generator’s rotor.
Figure 7.8 LST casing rotor and lid 3D printed in ABS on the left and CNC-machined LST
assembled for testing on the right.
The CNC-machined LST seen on the right side of Figure 7.8 was fabricated in PMMA
and consists of 3 main parts just like its 3D printed counterpart, but only the casing and lid were
CNC machined. The blade assembly was 3D printed. This allowed the author to clearly see the
rotation quality of the rotor during testing, as the PMMA is transparent and the blade assembly is
opaque. The perforation in the middle of lid allows for the connection wires to be accessed and
connected to the load.

78
7.3.4 OTI-1 Model Fabrication
The OTI-1 is the first step in miniaturization and optimization for implantation, and it is
based on the low-profile shape of the LST. Figure 7.9 shows the OTI-1 both 3D-printed in ABS
(bottom left) and machined in PMMA. The top left and top right images depict completely
assembled devices ready to be tested with nitrogen gas and water.
Figure 7.9 Optimized turbine for implantation (OTI-1) 3D-printed in ABS and machined in
PMMA with different barbed connectors and blade-assembly-loaded generator.
The center of Figure 7.6 displays the motor used as a generator for OTI-1, notice that the
blades fit tightly around the circumference of the rotor while the stator sits below the blades and
is held in place by the casing. The bottom center shows a casing without barbed connectors. A
single connector is shown at the 7-cm ruler mark. These connectors can be 3D printed as part of
the casing, as seen at the bottom left of the figure. The brass version can be seen at the top left,
which can be used with certain applications.

79
7.3.5 OTI-2 Model Fabrication
The last turbine considered is the OTI-2, which takes the OTI-1 as a starting point. Its
fabrication was also done in ABS through 3D printing and machined in PMMA. It is smaller in
diameter and height than the OTI-1, as is described in Table 7.4.
Figure 7.10 shows the parts of the unassembled OTI-2. Notice that the notched-blade
assembly was 3D printed in ABS, while the casing was machined in PMMA. Once the blade
assembly is mounted on the generator (bottom right), they are sealed onto the casing. The
rotation of the blade assembly can be clearly seen on the underside of the casing as it turns.
Figure 7.10 OTI-2 parts: Blade assembly (bottom left), generator (bottom right) and PMMA
casing with barbed connectors, along with LTC 3108 femto (top right)
The circuit seen here in the top right corner of the image is a DC to DC converter that
will be explained in later chapters. The machining of this turbine tested the limits of the
machining capabilities at USF.

80
New desk-top CNC machines will soon be available in the market and our research group
too will be able to machine even smaller parts needed to continue this work in the future.
Finally, this turbine was tested in nitrogen gas, in water and in simulated blood using flow
especially designed flow circuits and test beds.

81
CHAPTER 8: SYSTEM TESTING
Once the turbines were fabricated and assembled with their respective generators, they
could be considered as energy harvesting systems capable of producing treated power that could
be verified and calculated from measured values by connecting the system to a variable load and
finding the voltage across the load and the current through the load. The product of these two
numbers gives us a measure of the power produced or generated by each turbine. This power
will depend on mainly on two factors: The rotational speed of the turbine in RPM and the load
connected to the generator’s output. Even though these turbines use a 3 phase generator, only
two internally connected phases were connected to the load for AC voltage and current
measurements and to a single Schottky diode rectifier coupled to a DC to DC converter for DC-
load measurements. These measurements were obtained by varying the load at different flow
and pressure difference conditions.
8.1 Testing Circuits
The circuit shown in Figure 8.1 depicts the voltage harvested from the flow as AC
voltage source V1ac. This voltage is either connected directly to variable load L1 or to a
rectifying circuit composed of a Schottky diode and a 470 µF capacitor as is shown in Figure 8.2.
These circuits were assembled by soldering all components onto a perforated prototyping board
and fitting them with pin connectors. This strategy allowed led to making them modular for
interconnection between the energy-harvesting turbine system for AC measurements using the
circuit of Figure 8.1 or DC measurements using the circuit of Figure 8.2.

82
Figure 8.1 Voltage source representing the sinusoidal output from the turbine system’s generator,
connected to a variable load L1, used for AC testing.
8.1.1 Rectifier
The rectifier circuit was also assembled separately on a perforated board and outfitted
with pin connectors that couple to the generator. Notice that this is a Schottky low-drop diode
with internal resistance that increases with increases in current flow, therefore producing a higher
voltage drop when the turbine is operating at higher RPM.
Figure 8.2 Turbine system generator (V1ac) connected to rectifying circuit (D1, C1) and to
variable load L1 for DC testing.
Figure 8.3 shows the Schottky diode I-V curves that determine how much useful voltage
is left after rectification. This rectification is necessary to change the raw power produced by the
generator into useful power that can be used by an IMD.

83
Figure 8.3 Schottky rectifier, CW from top left: Typical forward current, typical reverse
current, total capacitance and forward current derating current characteristic curves[104].
8.1.2 Variable Load
Figure 8.4 shows the rectifier circuit connected to the variable load, which is composed
of two variable high precision potentiometers (1 KΩ to the left and 10 KΩ the right of the first
proto board) that can be selected individually by choosing the position of the jumper seen above
the second potentiometer. The board seen on the right shows 5 potentiometer connected in series
configuration to allow for the measurement of very small currents that are typical with
pacemakers and other low power IMDs.

84
Figure 8.4 Variable load configuration for testing AC and DC output with and without rectifier
(bottom left) and high impedance measurement load on the right.
The energy harvested from each flow tested (nitrogen, water and simulated blood) is of a
sinusoidal form and needs to be rectified before it can be used by a device. The rectifier seen in
Figure 8.4 is a single diode rectifier and a capacitor. This single diode approach makes it simple
to construct, test and diagnose any issues during testing. Also a single diode (as opposed to a full
bridge) reduces the loss incurred before the DC level it produces can be fed to the DC to DC
converter depicted in the diagram of Figure 8.8. Figure 8.5 shows the four DC to DC converters
used in this work.
1. TI BQ25504 in the bottom right corner of the figure. This board is made by Texas
Instruments and delivers 3.3 volts DC from a minimum input of 0.3 volts DC and a
input impedance of 3 KΩ.
2. LTC 3105 in the bottom left corner of the picture. This converter is made by LTI
semiconductors and is able to produce a variety of voltage levels available at two
outputs, the low drop output (LDO) at 1.5, 2.2 and 3 volts DC, and the standard

85
output (SO) at 1.8, 3.3 and 5 volts DC from a minimum input of 0.25 volts DC, with a
maximum power of 80 mW, and input impedance of 13 KΩ.
3. LTC 3108 Supercapacitor is seen at the top right of the figure. This board is made by
LTI semiconductors and it is configurable to 2.3, 3.3, 4.1 or 5.0 volts available at two
outputs (Vout and Vout2) from a minimum input of 0.2 volts. Its input impedance
was found to be 8 Ω and a bank of four 1F, 2.7-volt supercapacitors.
4. LTC 3108 femto, top left corner of the figure, is the smallest of the four and it
produces an output of 2.2 volts DC from minimum input of 0.2 volts and input
impedance of 12.4 Ω.
Each of these boards was used to boost the DC voltage produced by the rectifier and
maintain a regulated output that can be used by an IMD. Once the DC to DC converter is
integrated with the turbine, the assembly becomes an energy harvesting system that takes energy
from flow and converts it to raw electrical energy that is rectified and then boosted and regulated
by the DC to DC converter.
Figure 8.5 Rectifiers and DC to DC converters used to convert harvested energy to DC and boost
it to an appropriate level for IMD’s. CW from the top-left, LTC 3108 femto, Schottky diode
rectifier, LTC 3108 Supercap, TI Bq25504, 3 Phase rectifier and LTC 3105 DC booster.
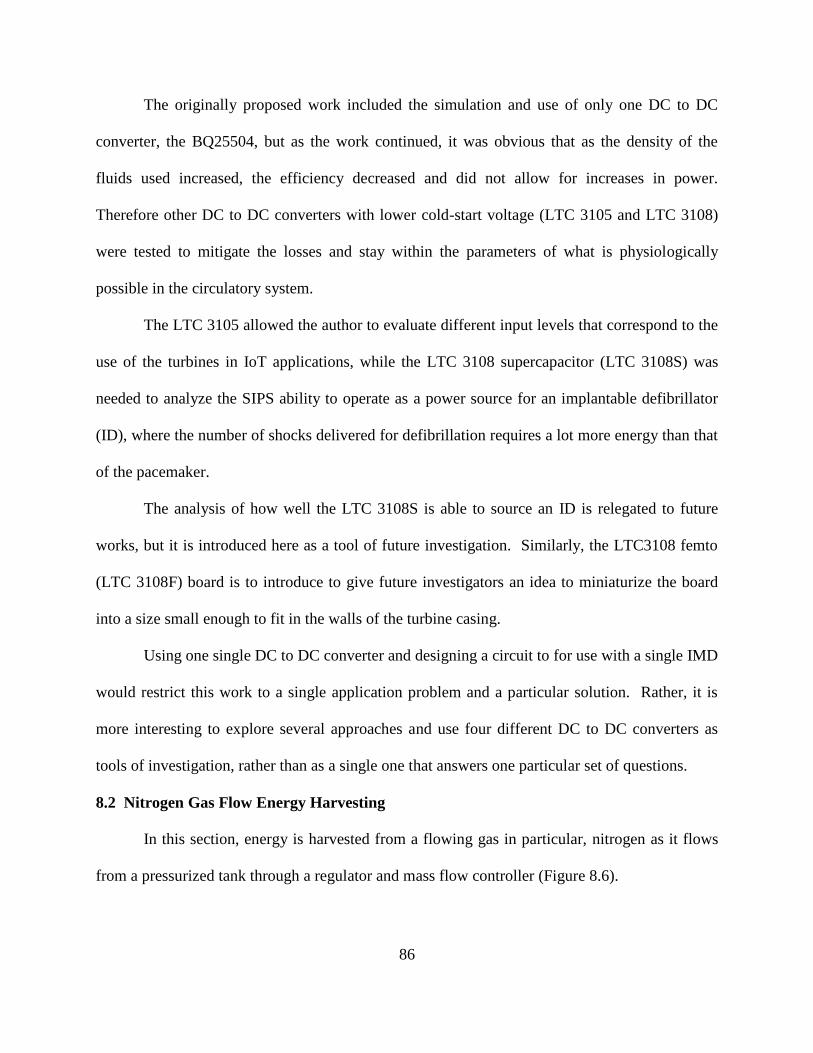
86
The originally proposed work included the simulation and use of only one DC to DC
converter, the BQ25504, but as the work continued, it was obvious that as the density of the
fluids used increased, the efficiency decreased and did not allow for increases in power.
Therefore other DC to DC converters with lower cold-start voltage (LTC 3105 and LTC 3108)
were tested to mitigate the losses and stay within the parameters of what is physiologically
possible in the circulatory system.
The LTC 3105 allowed the author to evaluate different input levels that correspond to the
use of the turbines in IoT applications, while the LTC 3108 supercapacitor (LTC 3108S) was
needed to analyze the SIPS ability to operate as a power source for an implantable defibrillator
(ID), where the number of shocks delivered for defibrillation requires a lot more energy than that
of the pacemaker.
The analysis of how well the LTC 3108S is able to source an ID is relegated to future
works, but it is introduced here as a tool of future investigation. Similarly, the LTC3108 femto
(LTC 3108F) board is to introduce to give future investigators an idea to miniaturize the board
into a size small enough to fit in the walls of the turbine casing.
Using one single DC to DC converter and designing a circuit to for use with a single IMD
would restrict this work to a single application problem and a particular solution. Rather, it is
more interesting to explore several approaches and use four different DC to DC converters as
tools of investigation, rather than as a single one that answers one particular set of questions.
8.2 Nitrogen Gas Flow Energy Harvesting
In this section, energy is harvested from a flowing gas in particular, nitrogen as it flows
from a pressurized tank through a regulator and mass flow controller (Figure 8.6).
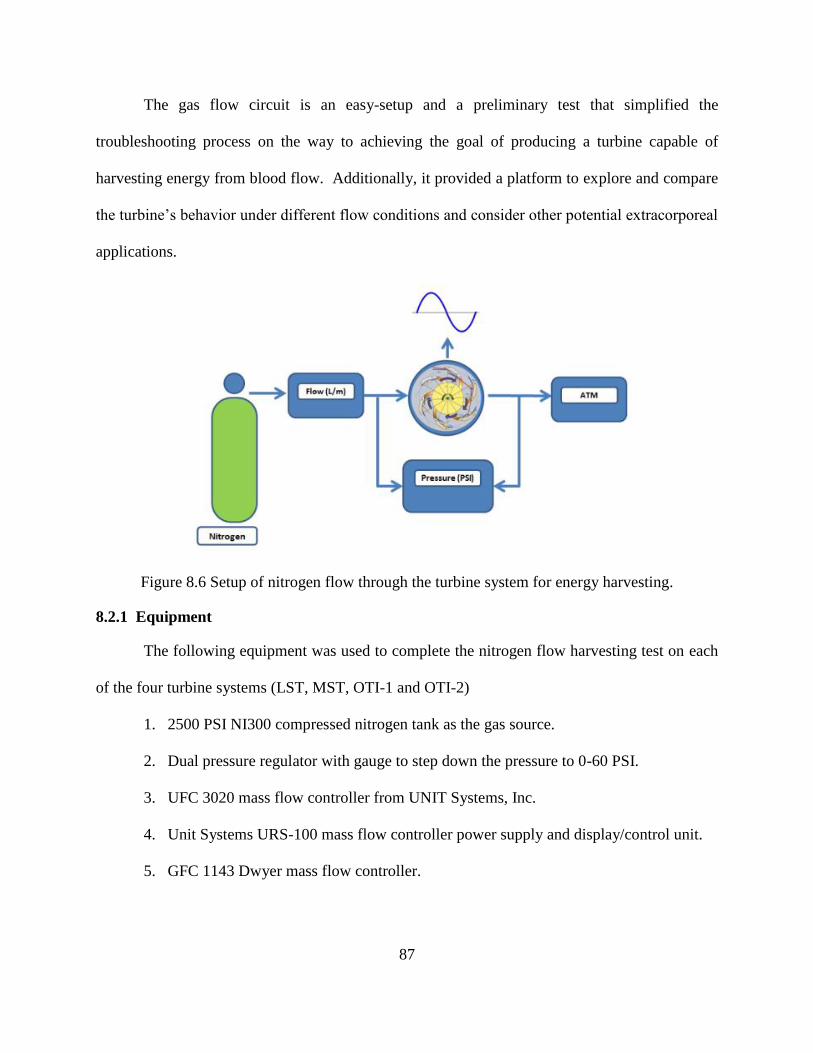
87
The gas flow circuit is an easy-setup and a preliminary test that simplified the
troubleshooting process on the way to achieving the goal of producing a turbine capable of
harvesting energy from blood flow. Additionally, it provided a platform to explore and compare
the turbine’s behavior under different flow conditions and consider other potential extracorporeal
applications.
Figure 8.6 Setup of nitrogen flow through the turbine system for energy harvesting.
8.2.1 Equipment
The following equipment was used to complete the nitrogen flow harvesting test on each
of the four turbine systems (LST, MST, OTI-1 and OTI-2)
1. 2500 PSI NI300 compressed nitrogen tank as the gas source.
2. Dual pressure regulator with gauge to step down the pressure to 0-60 PSI.
3. UFC 3020 mass flow controller from UNIT Systems, Inc.
4. Unit Systems URS-100 mass flow controller power supply and display/control unit.
5. GFC 1143 Dwyer mass flow controller.

88
6. Tektronix TDS 3052 oscilloscope to measure the RMS voltage and frequency from
the turbine’s generator output.
7. Phillips PM2534 system multimeter used to measure the current through the load.
8. Hewlett Packard 34401A multimeter for measuring the voltage across the load.
8.2.2 Setup
The output from the turbine in Figure 8.6 was coupled to the input indicated by the short
arrow in Figure 8.7 below. This configuration allowed for the measurements to be recorded in
video format by focusing the camera on the various displays, providing a big picture permanent
record of how the different meters adjusted to changes in the load, being careful to turn the
potentiometer slowly enough for the instruments to acquire and display the measured values,
thus ensuring greater accuracy.
Figure 8.7 Circuit diagram for measuring AC voltage and current at the load.
As the gas flowed from the tank, depicted in Figure 8.6, the turbine rotated at an RPM
commensurate with the flow, generating a sinusoidal voltage wave measured by the circuit in
Figure 8.7. The flow output from the turbine was allowed to vent into the atmosphere (ATM)
and the differential pressure gauge measured the difference in pressure between the input and the
output. The resulting power curves obtained are presented in chapter 9

89
Figure 8.8 Circuit used for DC voltage and current measurements.
Again, the voltage output from the turbine system is used as a voltage input to this circuit
and is indicated by a short arrow that goes into the rectifying circuit (Figure 8.8). Notice that the
output from the regulator now becomes the input to the DC to DC converter that boosts the
voltage from tenths of volts to 2.2 or 3.3 volts depending on the converter used. The load was
then connected to the output of this DC to DC converter and the DC voltage and current are
measured across and through said load.
Figure 8.9 shows the actual physical set up used in the AMBIR lab. The instruments seen
here are described in the previous section. This setup was used for DC voltage and current
measurements. The same instruments were used for AC measurements, with minor changes that
are described by the circuits of Figures 8.6 and 8.7. In other words the rectifying circuit and the
DC-DC converter were not used and the meters were set to measure AC voltage and current
RMS values.
The use of the UFC 3020 mass flow controller enhanced the testing process by allowing
for the testing of the turbines under lower flow rates when compare to the GFC 1143 controller.
This controller was simpler to setup though, since it has a built in display unit while the UFC
3020 had to be connected to a separate display on the URS 100 power supply.

90
Figure 8.9 Actual lab setup described by the circuits of Figures 8.5 and 8.6
Once the setup was completed, the pressure difference across the turbine, Pd was
adjusted incrementally and the load changed gradually. At each incremental point, the following
measurements were taken:
1. AC Measurements: Generator voltage and frequency in Hz, Vg and fg from which the
RPM was calculated; the current through the load from which the power to the load
was calculated; and finally, the differential pressure, Pd between the inlet and outlet,
and the voltage produced by the flowmeter, Vf from which the efficiency and flow
were calculated.
2. DC Measurements: Generator ac voltage and frequency, Vg and fg, from which
theflow power and RPM were calculated, the DC voltage across the load VL, as
delivered by the rectifier and the current through the load IL, from which the power
delivered to the load was calculated; and finally, the pressure difference across the
turbine and flowmeter voltage from which the flow was calculated.

91
8.3 Water Flow Energy Harvesting
After testing each turbine using the nitrogen flow circuit, a new closed-loop circuit was
devised using a small water pump that moved the water from a reservoir through the turbine and
through an ultrasonic flowmeter, allowing the water to flow unrestricted back into the reservoir.
8.3.1 Equipment
The following equipment was used to complete the water flow harvesting test on three
turbines systems, the MST, OTI-1 and OTI-2.
1. Sealed water reservoir.
2. One Cynergy3 Ultrasonic flowmeter.
3. One ZKSJ DC30A-1230 Brushless DC pump.
4. Two 0-5 PSI, DPG-101, calibrated Dwyer pressure gauges.
5. Tektronix TDS 3052 oscilloscope to measure the RMS voltage and frequency from
the turbine.
6. Phillips PM2534 system multimeter to measure the output of the flowmeter.
7. Hewlett Packard 34401A multimeter for measuring voltage across the load.
8. Extech Instruments TrueMultimeter 430 to measure the current through the load.
The ultrasonic flowmeter used is preferable to a rotational flowmeter, because it does not
obstruct or slow down the flow; it simply senses the signal from each of two ultrasonic
generators and calculates the difference in arrival times by making use of the Doppler effect
principle[89]. See Figure 8.10 for a visual representation of this process.
Figure 8.11 shows the closed-loop circuit implemented to test three of the turbines’
ability to harvest energy from water flow. The MST, OTI-1 and OTI-2 were evaluated.

92
Figure 8.10 Principle of operation of ultrasonic flowmeter used in this work[89].
8.3.2 Setup
Figure 8.11 Closed-loop circuit setup used to evaluate the MST, OTI-1 and OTI-2 turbines’
ability to harvest energy from water flow.
A small DC brushless 2 LPM pump (Figure 8.12) was used to pump water from a 1-liter
reservoir through a valve into the turbine, causing the turbine’s blade assembly to rotate and the
generator’s rotor along with it.
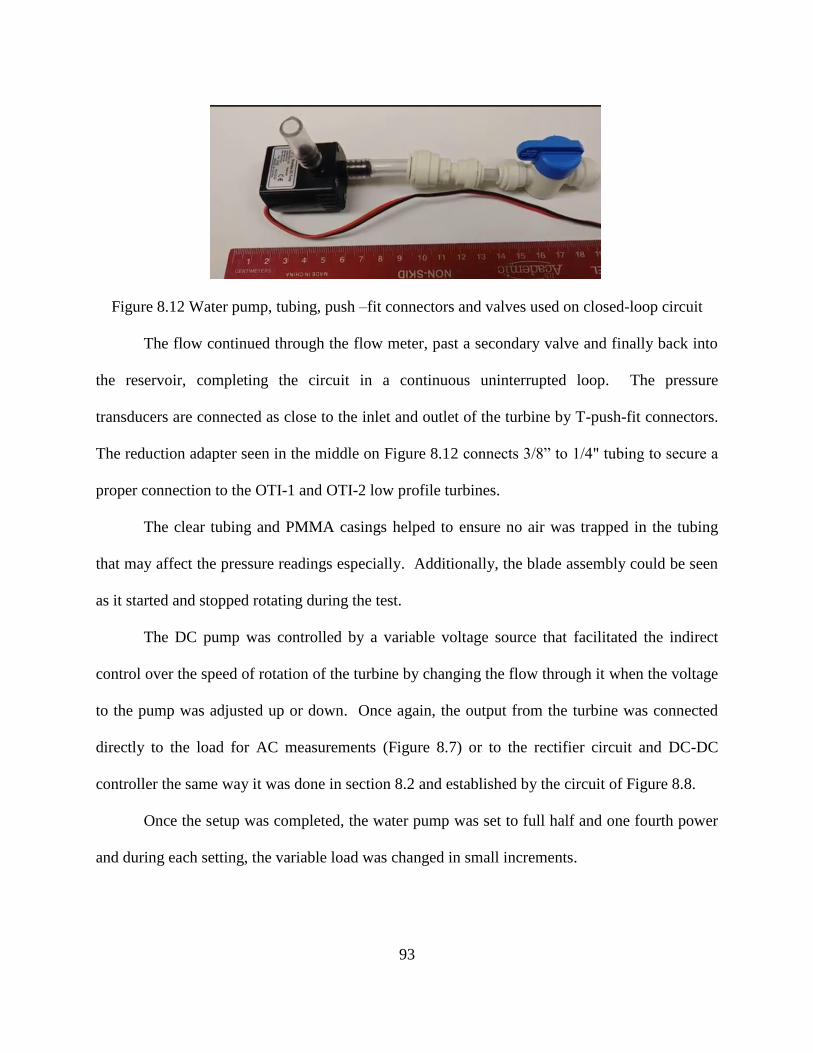
93
Figure 8.12 Water pump, tubing, push –fit connectors and valves used on closed-loop circuit
The flow continued through the flow meter, past a secondary valve and finally back into
the reservoir, completing the circuit in a continuous uninterrupted loop. The pressure
transducers are connected as close to the inlet and outlet of the turbine by T-push-fit connectors.
The reduction adapter seen in the middle on Figure 8.12 connects 3/8” to 1/4" tubing to secure a
proper connection to the OTI-1 and OTI-2 low profile turbines.
The clear tubing and PMMA casings helped to ensure no air was trapped in the tubing
that may affect the pressure readings especially. Additionally, the blade assembly could be seen
as it started and stopped rotating during the test.
The DC pump was controlled by a variable voltage source that facilitated the indirect
control over the speed of rotation of the turbine by changing the flow through it when the voltage
to the pump was adjusted up or down. Once again, the output from the turbine was connected
directly to the load for AC measurements (Figure 8.7) or to the rectifier circuit and DC-DC
controller the same way it was done in section 8.2 and established by the circuit of Figure 8.8.
Once the setup was completed, the water pump was set to full half and one fourth power
and during each setting, the variable load was changed in small increments.

94
At each incremental point, the following measurements were taken:
1. AC Measurements: Generator voltage and frequency in Hz, Vg and fg from which
the RPM was calculated; the current through the load from which the power to the
load was calculated; and finally, the differential pressure, Pd between the inlet and
outlet, and the voltage produced by the flowmeter, Vf from which the efficiency and
flow were calculated, respectively.
2. DC Measurements: Generator ac voltage and frequency, Vg and fg, from which the
flow power and RPM were calculated, the DC voltage across the load VL, as
delivered by the rectifier and the current through the load IL, from which the power
delivered to the load was calculated; and finally, the pressure difference across the
turbine and flowmeter voltage from which the flow was calculated.
8.4 Simulated Blood Flow Energy Harvesting
In this section an in-vitro test of the OTI-2 turbine system was conducted in order to
estimate the power harvested from blood flow in the circulatory system of a higher mammal by
using a specially formulated fluid that displays some of the same characteristics as human blood,
in particular, its consistency; more specifically, its density and viscosity. The fluid was
circulated using the closed-loop system described in section 8.3 by use of a small variable pump.
8.4.1 Equipment
In addition to the equipment described in section 8.3, three more important pieces of
equipment were used to prepare and characterize the simulated blood (SB) solution, namely, a
U.S. Solid microscale, a Genie 2 Fisher Vortex mixer and a Smart-Series Fungilab rotational
viscometer. Figure 8.13 shows this equipment as described from left to right.

95
The section on setup below describes the SB preparation in detail and the characterization
necessary to match the viscosity of human blood.
Figure 8.13 Left to right: Microscale, vortex mixer and viscometer with attachments.
8.4.2 Setup
In order to more accurately approximate the flow of blood in the human body some
changes were made to the fluid (water) used in section 8.3. Using the conclusions in [105] a 600
mL solution was prepared, consisting of 38.15% Glycerol, 49.07% water and 12.78% Sodium
Iodide (NaI) powder by weight.
The mixture was shaken vigorously in a 1 liter sealed flask and agitated for 15 minutes
using the Ginie 2 vortex mixer. 10.6 mL of the solution was poured into the Fungilab sample
container seen in Figure 8.13. The system was set to measure viscosity of the fluid using spindle
TR9, seen on the far right in Figure 8.13. The spindle was placed inside the filled sample
container and then set to rotate at 100, 60, 50 and 30 RPM. The test was conducted at standard
temperature and pressure (STP) with a lid and the results were entered into Table 8.1 below.

96
The values of viscosity obtained were found to be within normal values found in human
blood, as reported by [90], as a Mean ± Standard Deviation of 4.4 ± 0.6 (cP) and by [91] as 5.83
cP. The shear rate as seen in Figure 8.14 is the gradient of the velocity as the layers of fluid in
motion move closer to a static or stationary structure. In the case of a blood vessel, the center of
the vessel is where the blood moves the fastest, decreasing as the rings of fluid (assuming
laminar flow) get closer to the endothelium. The endothelial cells are deformed under high
shear, and this deformation is called shear stress, which is the force per unit area that is needed to
ensure gradient behavior depicted in the figure.
Table 8.1 Measured values of shear rate, shear stress and viscosity for varying RPM
RPM Shear Rate( /s) Shear Stress (Pa) Viscosity (Cp)
100 34 1.6 4.2
60 20.4 0.9 4.5
50 17 0.8 5.2
30 10 0.6 5.5
The equipment setup and measurements taken during the simulated blood harvesting
process were identical to those presented previously and used for the water flow harvesting.
The aorta, which is the largest vessel in the human body has a diameter of 31.1 mm ± 3.9
mm (females) and 33.6 mm ± 4.1 mm (males)[92] and is where the highest blood speeds are
seen, between 430 cm/s to 720 cm/s, increasing with age[93].
Figure 8.14 Shear of fluid between a moving and stationary plate under laminar flow conditions.

97
CHAPTER 9: TESTING RESULTS AND DISCUSSION
For each setup, gas, water and simulated blood, both AC and DC measurements were
taken and annotated in an Excel spreadsheet, from which the voltage and current were used to
calculate the power. The rotation of the turbine at each frequency setting was calculated using
Eq. 3.1. The resulting plots are presented in the following subsections and discussed in chapters
9 and 10.
9.1 Nitrogen Flow Harvesting Results
Nitrogen gas was chosen to conduct the turbine testing because it is a safe, inexpensive
and very commonly used gas in industry and in academia with a myriad of applications.
Additionally, it allowed for the use of already available setup in the AMBIR lab.
9.1.1 AC Power and Efficiency
Testing results for all four turbines are presented in the order of implementation that led
to the modifications necessary to optimize for implantation, starting with the miniaturize scale
turbine (MST)
Figure 9.1 shows the assembled MST on the left and its components (casing, blade
assembly and generator) on the left. AC power curves generated using nitrogen gas as an energy
harvesting source can be seen in Figure 9.2 on a logarithmic scale. The efficiency was calculated
by dividing the electrical power generated by the turbine by the inherent power from the flow of
nitrogen through the nozzle, which can be expressed as,
Pflow = ρ Q v-noz2 / 2 (Eq. 9.1)
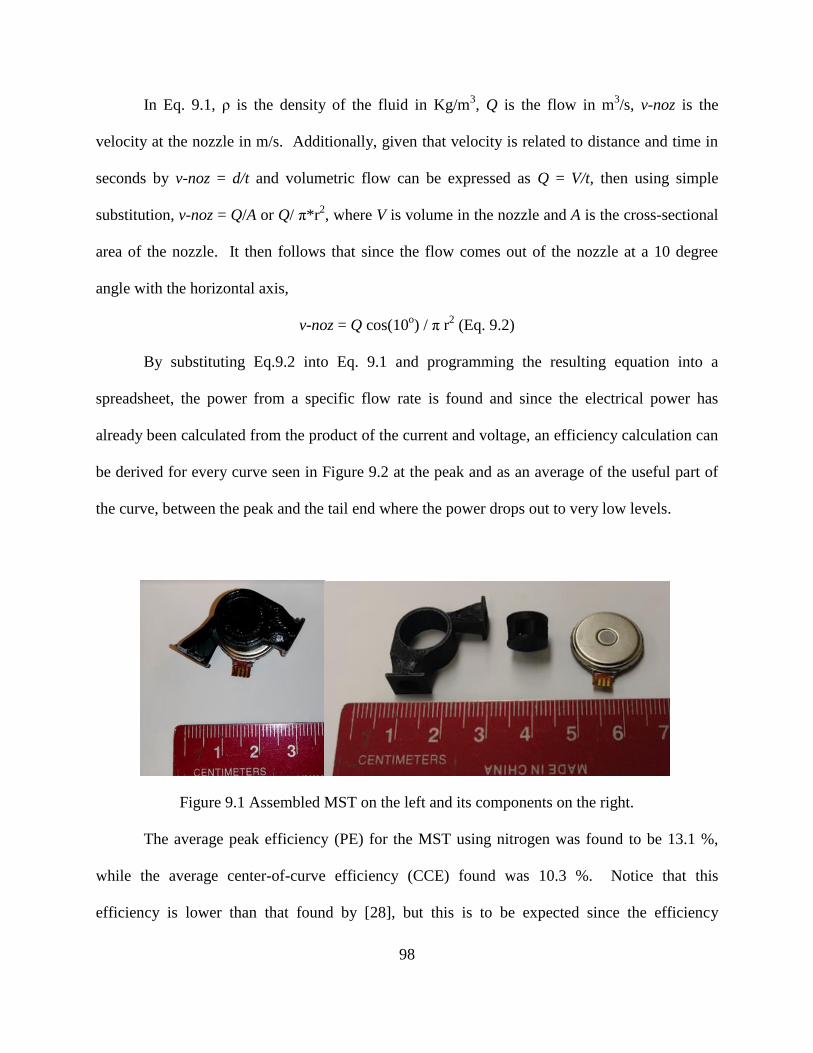
98
In Eq. 9.1, ρ is the density of the fluid in Kg/m3, Q is the flow in m
3/s, v-noz is the
velocity at the nozzle in m/s. Additionally, given that velocity is related to distance and time in
seconds by v-noz = d/t and volumetric flow can be expressed as Q = V/t, then using simple
substitution, v-noz = Q/A or Q/ π*r2, where V is volume in the nozzle and A is the cross-sectional
area of the nozzle. It then follows that since the flow comes out of the nozzle at a 10 degree
angle with the horizontal axis,
v-noz = Q cos(10o) / π r
2 (Eq. 9.2)
By substituting Eq.9.2 into Eq. 9.1 and programming the resulting equation into a
spreadsheet, the power from a specific flow rate is found and since the electrical power has
already been calculated from the product of the current and voltage, an efficiency calculation can
be derived for every curve seen in Figure 9.2 at the peak and as an average of the useful part of
the curve, between the peak and the tail end where the power drops out to very low levels.
Figure 9.1 Assembled MST on the left and its components on the right.
The average peak efficiency (PE) for the MST using nitrogen was found to be 13.1 %,
while the average center-of-curve efficiency (CCE) found was 10.3 %. Notice that this
efficiency is lower than that found by [28], but this is to be expected since the efficiency

99
0.01
0.1
1
10
100
0 0.2 0.4 0.6 0.8 1 1.2
Po
we
r (m
W)
R-load (KOhm)
300 RPM 551 RPM 1011 RPM 2082 RPM 3042 RPM 4766 RPM
96.7 uW
132.5 uW
486.4 uW
23.4 mW
4.13 mW
1.6 mW
decreases with increasing miniaturization due to increase of internal friction at the turbine’s
bearings. Notice that since the generator is actually a motor extracted from a 1-inch hard drive,
designed to rotate at high RPMs, the power increases with increasing RPM, but this increase is
mainly due to high current (Figure 9.3). This tells us that even though there is an increase in
power, a low output voltage from the generator may limit the performance of the system due to
rectification losses.
Figure 9.2 MST (N) AC power in mW vs load resistance in KΩ at increasing RPM
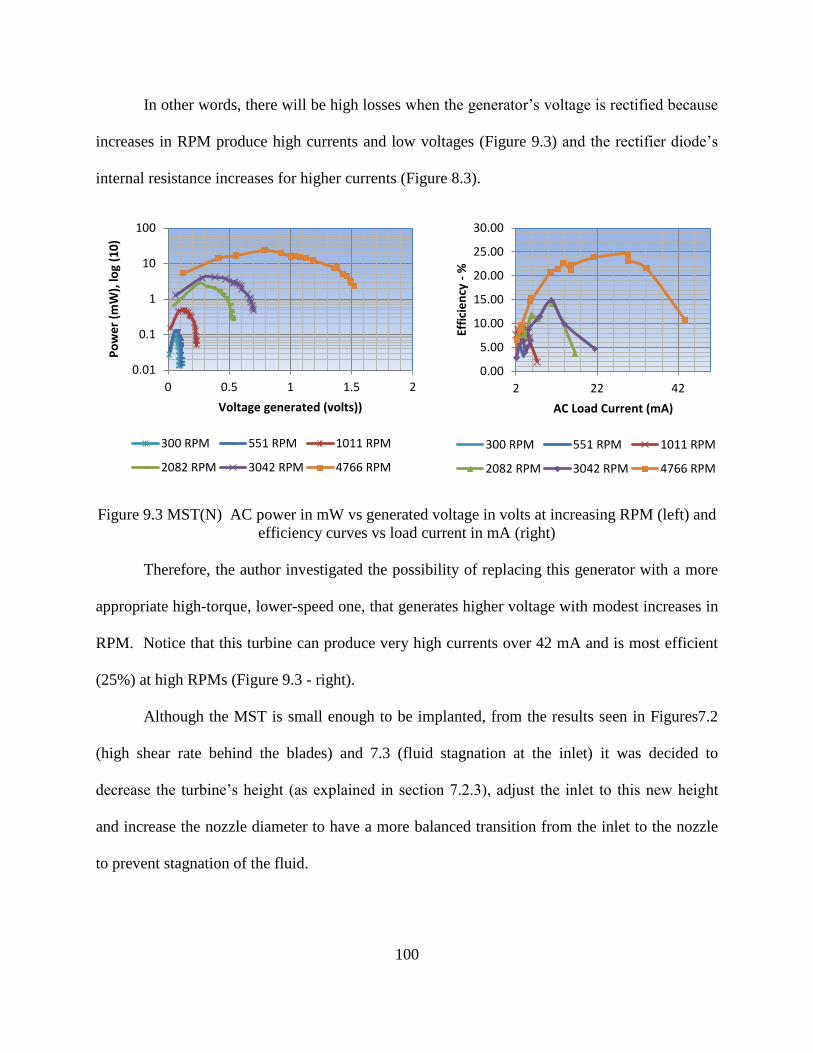
100
0.01
0.1
1
10
100
0 0.5 1 1.5 2
Po
we
r (m
W),
log
(10
)
Voltage generated (volts))
300 RPM 551 RPM 1011 RPM
2082 RPM 3042 RPM 4766 RPM
In other words, there will be high losses when the generator’s voltage is rectified because
increases in RPM produce high currents and low voltages (Figure 9.3) and the rectifier diode’s
internal resistance increases for higher currents (Figure 8.3).
Therefore, the author investigated the possibility of replacing this generator with a more
appropriate high-torque, lower-speed one, that generates higher voltage with modest increases in
RPM. Notice that this turbine can produce very high currents over 42 mA and is most efficient
(25%) at high RPMs (Figure 9.3 - right).
Although the MST is small enough to be implanted, from the results seen in Figures7.2
(high shear rate behind the blades) and 7.3 (fluid stagnation at the inlet) it was decided to
decrease the turbine’s height (as explained in section 7.2.3), adjust the inlet to this new height
and increase the nozzle diameter to have a more balanced transition from the inlet to the nozzle
to prevent stagnation of the fluid.
Figure 9.3 MST(N) AC power in mW vs generated voltage in volts at increasing RPM (left) and
efficiency curves vs load current in mA (right)
0.00
5.00
10.00
15.00
20.00
25.00
30.00
2 22 42
Effi
cie
ncy
- %
AC Load Current (mA)
300 RPM 551 RPM 1011 RPM
2082 RPM 3042 RPM 4766 RPM

101
0
20
40
60
80
100
0 2 4 6 8 10
Po
we
r (m
W)
R-load (KΩ)
304 RPM 505 RPM 1293 RPM 1742 RPM
Since these changes would significantly alter the original design ratios (inlet to nozzle
ratio increases, the blades become wider and width to height ratio increases) the recommended
changes had to be implemented first at a large scale. So the large scale turbine was designed in
Solidworks and 3D printed, then tested with a high torque generator able to produce a high
voltage output, enough to mitigate the losses incurred by rectification.
Figure 9.4 LST (N) AC power in mW vs load resistance in KΩ at increasing RPM.
The LST was tested with nitrogen gas and the power curves are seen in Figure 9.4, which
provide a new starting point for miniaturization, but this time the changes made would produce
miniaturized turbines optimized for implantation.
As expected, Figure 9.5 shows the efficiency curves (right) for the LST with peak
efficiency over 50% at 1742 average RPM, which agrees with the findings by [28].
Furthermore, the power vs voltage curves are on the left, and it is clear that the voltage is
high compare to the current in each of the power curves. A similar high Vout generator was
needed for the MST, so negotiations were initiated with a European company to design a
miniaturized generator for the next generation of optimized turbines, but due to budget
limitations and time constraints it was not possible to acquire the needed generator.

102
0
10
20
30
40
50
60
70
80
90
0 5 10 15 20 25
Po
we
r (m
W)
Voltage generated (volts)
304 RPM 505 RPM
1293 RPM 1742 RPM
It was then decided to use a larger high speed motor harvested from a laptop hard drive
(center top of Figure 7.6) that fit the low profile need for implantation and could produce higher
voltages than the smaller generator of the MST, even if the voltage to current ratio was lower
than desired.
Figure 9.5 LST (N) AC power in mW vs voltage generated at increasing RPM (left) and
efficiency vs AC load current in mA (right)
By miniaturizing the LST a new turbine was designed and printed, named the OTI-1 that
would be based on the optimization recommendations proposed earlier. The OTI-1 is compared
with the LST in Table 7.2, where a 15-fold volume reduction of the casing was achieved, as well
as a 10-fold reduction in operating volume. The power curves of the OTI-1 can be seen in
Figure 9.6, along with power vs voltage curves.
Notice that the OTI-1 produces higher power per RPM than the MST, as well as higher
voltage as seen on the right side of the figure. The average PE and average CCE were found to
be improved, 19% and 17.5% respectively. With no rectification losses, the question was posed;
can this turbine be made smaller than a typical pacemaker battery?
0.00
10.00
20.00
30.00
40.00
50.00
60.00
1 3 5 7 9 11
Effi
cie
ncy
- %
AC Load Current (mA)
304 RPM 505 RPM
1293 RPM 1742 RPM

103
0.01
0.1
1
10
100
1000
0 0.5 1
Po
we
r (m
W)
R-load (KΩ)
550 RPM, 0.2 PSI 1560 RPM
2630 RPM 2840 RPM
3620 RPM
119.83 mW
8.98 mW
3.4 mW
487.6 µW
30.75 mW
0.01
0.1
1
10
100
1000
0 1 2 3 4 5
Po
we
r (m
W),
log
(10
)
Voltage generated (volts))
550 RPM, 0.2 PSI 1560 RPM
2630 RPM 2840 RPM
3620 RPM
0
5
10
15
20
25
0 20 40 60 80
Effi
cie
ncy
- %
AC Load Current (mA)
550 RPM, 0.2 PSI 1560 RPM
2630 RPM 2840 RPM
3620 RPM
Figure 9.6 OTI-1 (N) AC power vs load resistance (left), power vs voltage (right) and efficiency
vs load current in mA (bottom)

104
0
2
4
6
8
10
12
14
16
0 0.5 1
Po
we
r (m
W)
R-load (KOhm)
1200 RPM 1800 RPM2140 RPM 3300 RPM3410 RPM
0
2
4
6
8
10
12
14
16
0 0.5 1 1.5 2P
ow
er
(mW
)
R-load (KOhm)
1200 RPM 1800 RPM2140 RPM 3300 RPM3410 RPM
In order to answer the question posed, it was time to return to the original 18.8 mm
generator of Figure 7.7 and design, 3D print and test a new turbine casing, blade assembly and
connectors. It was named the optimized turbine for implantation number two (OTI-2).
Figure 9.7 (N) AC OTI-2 power vs load resistance (left), power vs voltage (right) and efficiency
vs load current in mA (bottom)
0.10
1.00
10.00
100.00
0 5 10 15 20 25 30
Effi
cie
ncy
- %
(Lo
g)
AC Load Current (mA))
1200 RPM 1800 RPM 2140 RPM
3300 RPM 3410 RPM

105
The PMMA casing was also fabricated to use as an inspection port under nitrogen flow,
as it is transparent and it was possible to monitor the turbine’s behavior. Later, under liquid flow
testing small air bubbles were injected into the system to observe the flow characteristics through
the clear tubing and casing. For now, the results of the tests using nitrogen as a harvesting
source can be seen on Figure 9.7.
9.1.2 DC Power
Once the OTI-2 was made smaller, more flow pressure was needed to overcome the
inertia of the smaller generator with a higher internal friction. But for applications where low
RPM is not a requirement, these are very good results.
Following the miniaturization of the LST down to the OTI-1 and the subsequent
optimization to the OTI-2, up to 120 mW of raw power was harvested. The next logical step was
to convert this raw power to a DC level by using the rectifier seen at the top center of Figure 8.5.
The rectifier was connected to the MST, OTI-1 and OTI-2 turbines. The rectified voltage was
then connected to the TI BQ25504 and the LTC 3105 DC to DC converters of Figure 8.5.
9.1.2.1 MST DC Power
The resulting graphs are seen in Figure 9.8 for the TI BQ25504 converter and Figure 9.9
for the LTC 3105 converter. High flow rate was needed to increase the RPM in order to
compensate for the rectification losses that can amount to be more than 50%. For this reason, the
Vin-rms voltage is much higher than the 300 mV needed by the BQ25504. The same happens
with the LTC 3105 results with a slight increase of RPM. Both were able to maintain
approximately 3.1 volts at the load with a peak power around 1.5 mW for the BQ25504 and 0.9
mW for the LTC 3105.

106
0
0.1
0.2
0.3
0.4
0.5
0.6
0.7
0
0.5
1
1.5
2
2.5
3
3.5
0 10 20 30 40 50 60
DC
Lo
ad C
urr
ent
(mA
)
DC
Lo
ad v
olt
age(
Vo
lts)
R-Load (KOhm)
V-load (Volts) I-load (mA)
1
501
1001
1501
2001
2501
3001
3501
0
0.2
0.4
0.6
0.8
1
1.2
1.4
1.6
0 10 20 30 40 50 60
RP
M
Po
we
r (m
W)
R-load (KOhm)
P-load (mW) RPM
0
0.2
0.4
0.6
0.8
1
0
0.5
1
1.5
2
2.5
3
3.5
0 10 20 30 40 50 60
Vin
-rm
s (V
olt
s)
DC
Lo
ad V
olt
age
(Vo
lts)
R-Load (KOhm)
V-load (Volts) Vin-rms (volts)
Figure 9.8 MST (N) DC power, DC load voltage/current, RPM and generator voltage against
load resistance, using TI BQ 25504 to boost the voltage sent to the load.
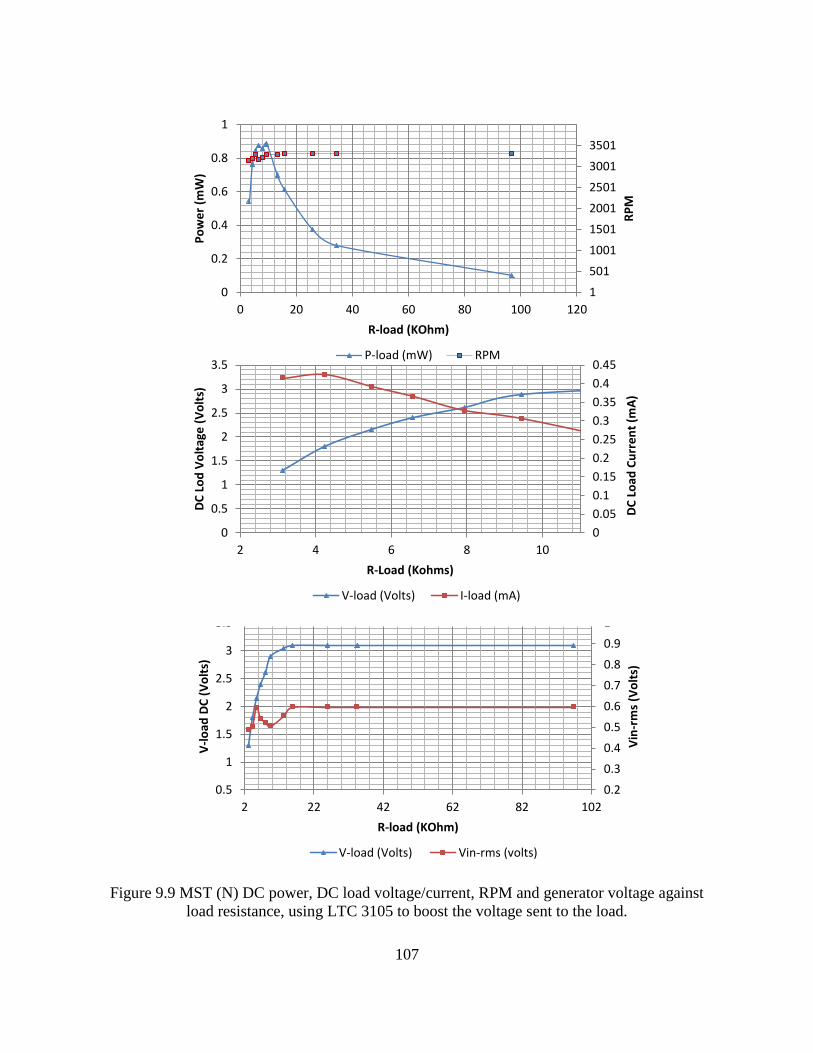
107
0.2
0.3
0.4
0.5
0.6
0.7
0.8
0.9
1
0.5
1
1.5
2
2.5
3
3.5
2 22 42 62 82 102
Vin
-rm
s (V
olt
s)
V-l
oad
DC
(V
olt
s)
R-load (KOhm)
V-load (Volts) Vin-rms (volts)
0
0.05
0.1
0.15
0.2
0.25
0.3
0.35
0.4
0.45
0
0.5
1
1.5
2
2.5
3
3.5
2 4 6 8 10
DC
Lo
ad C
urr
en
t (m
A)
DC
Lo
d V
olt
age
(V
olt
s)
R-Load (Kohms)
V-load (Volts) I-load (mA)
1
501
1001
1501
2001
2501
3001
3501
0
0.2
0.4
0.6
0.8
1
0 20 40 60 80 100 120
RP
M
Po
we
r (m
W)
R-load (KOhm)
P-load (mW) RPM
Figure 9.9 MST (N) DC power, DC load voltage/current, RPM and generator voltage against
load resistance, using LTC 3105 to boost the voltage sent to the load.

108
9.1.2.2 OTI-1 DC Power
The resulting graphs for the OTI-1 turbine are presented in Figure 9.10 for the TI
BQ25504 converter and Figure 9.11 for the LTC 3105 converter. High flow rate was needed to
increase the RPM in order to compensate for the rectification losses causing the Vin-rms voltage
to be higher than expected for both converters. Both converters were able to maintain
approximately between 1.5 and 3.1 volts at the load at a peak power around 1.4 mW for the
BQ25504 and 1.05 mW for the LTC 3105.under similar load conditions.
The generator in the OTI-1 is larger than the generator in the MST, so it is expected to
see that OTI-1 requires about 1000 RPM less to maintain the 3.1 volts when compared to the
MST.
9.1.2.3 OTI-2 DC Power
This is the last turbine to consider for the DC power harvesting from nitrogen flow, and
the results can be seen in Figure 9.12 for the BQ25504 and Figures 9.13 and 9.14 for the LTC
3105. The turbine used 5000 RPM to maintain a DC voltage of 3.1 volts for former and 4500
RPM and 3000 RPM to maintain 5 volts and 3.5 volts respectively for the latter. This
demonstrates the versatility of the LTC 3105 converter as it can power any system that uses a rail
voltage between 1.8 and 5 volts. This is a wide margin, but the turbine must rotate at high
RPMs. All in all, it is surprising that the BQ25504 requires 5050 RPM to deliver a peak power
of 1.46 mW, while the LTC3105 requires 4570 RPM and delivers 3.27 mW and 3050 RPM to
deliver 1.05 mW.

109
0
0.25
0.5
0.75
1
1.25
1.5
0
0.5
1
1.5
2
2.5
3
3.5
4
4.5
0 2 4 6 8 10 12
Vin
-rm
s (V
olt
s)
DC
Lo
ad V
olt
age
(V
olt
s)
R-Load (KOhm)
V-load (Volts) Vin-rms (volts)
0
500
1000
1500
2000
2500
3000
0.4
0.6
0.8
1
1.2
1.4
1.6
0 2 4 6 8 10 12
RP
M
Po
we
r (m
W)
R-load (KOhm)
P-load (mW) RPM
0
0.1
0.2
0.3
0.4
0.5
0.6
0.7
0.8
0.9
0
0.5
1
1.5
2
2.5
3
3.5
0 2 4 6 8 10 12
DC
Lo
ad C
urr
en
t (m
A)
DC
Lo
ad v
olt
age
(Vo
lts)
R-Load (KOhm)
V-load (Volts) I-load (mA)
Figure 9.10 OTI-1 (N) DC power, DC load voltage/current, RPM and generator voltage against
load resistance, using BQ25504 to boost the voltage sent to the load.
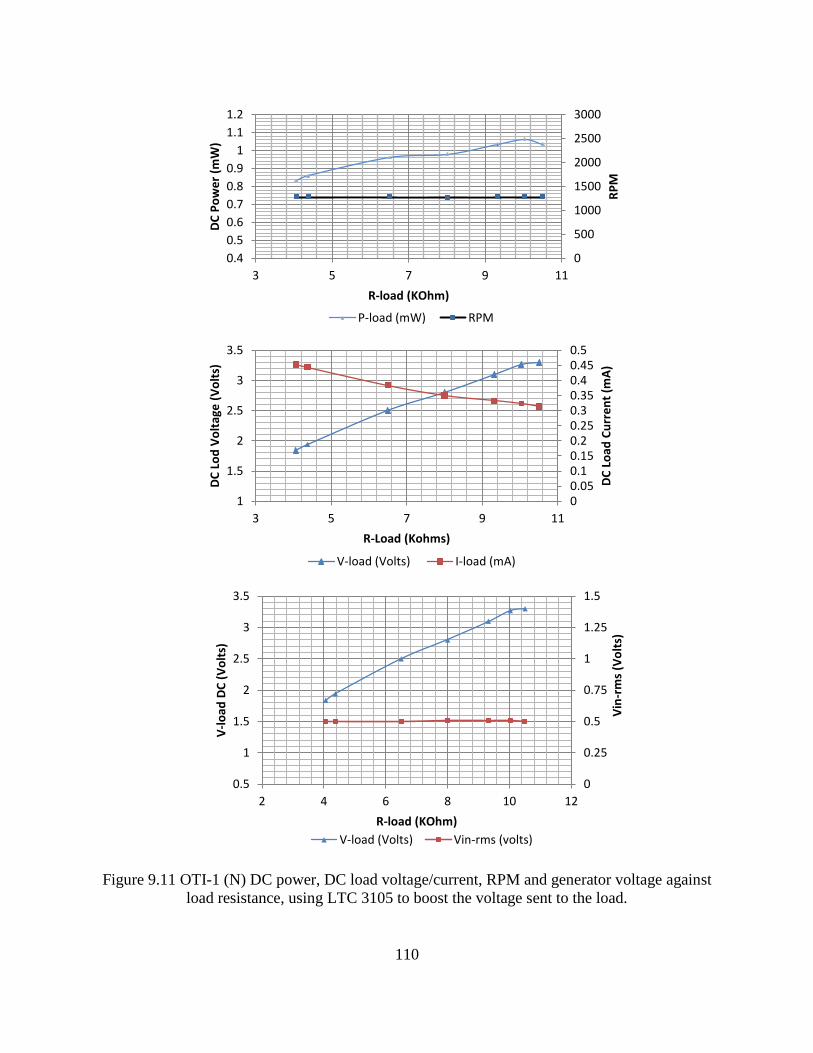
110
0
500
1000
1500
2000
2500
3000
0.4
0.5
0.6
0.7
0.8
0.9
1
1.1
1.2
3 5 7 9 11
RP
M
DC
Po
we
r (m
W)
R-load (KOhm)
P-load (mW) RPM
00.050.10.150.20.250.30.350.40.450.5
1
1.5
2
2.5
3
3.5
3 5 7 9 11
DC
Lo
ad C
urr
en
t (m
A)
DC
Lo
d V
olt
age
(V
olt
s)
R-Load (Kohms)
V-load (Volts) I-load (mA)
0
0.25
0.5
0.75
1
1.25
1.5
0.5
1
1.5
2
2.5
3
3.5
2 4 6 8 10 12
Vin
-rm
s (V
olt
s)
V-l
oad
DC
(V
olt
s)
R-load (KOhm)
V-load (Volts) Vin-rms (volts)
Figure 9.11 OTI-1 (N) DC power, DC load voltage/current, RPM and generator voltage against
load resistance, using LTC 3105 to boost the voltage sent to the load.

111
4000
4200
4400
4600
4800
5000
5200
5400
5600
5800
6000
0.6
0.7
0.8
0.9
1
1.1
1.2
1.3
1.4
1.5
1.6
0 2 4 6 8 10 12
RP
M
Po
we
r (m
W)
R-load (KOhm)
P-load (mW) RPM
0
0.1
0.2
0.3
0.4
0.5
0.6
0.7
0.8
0
0.5
1
1.5
2
2.5
3
3.5
0 2 4 6 8 10 12
DC
Lo
ad C
urr
en
t (m
A)
DC
Lo
ad v
olt
age
(Vo
lts)
R-Load (KOhm)
V-load (Volts) I-load (mA)
0
0.2
0.4
0.6
0.8
1
1.2
1.4
1.6
1.8
2
0
0.5
1
1.5
2
2.5
3
3.5
0 2 4 6 8 10 12
Vin
-rm
s (V
olt
s)
DC
Lo
ad V
olt
age
(V
olt
s)
R-Load (KOhm)
V-load (Volts)
Figure 9.12 OTI-2 (N) DC power, DC load voltage/current, RPM and generator voltage against
load resistance, using BQ25504 to boost the voltage sent to the load.

112
0
0.2
0.4
0.6
0.8
1
1.2
1.4
1.6
0
1
2
3
4
5
6
0 2 4 6 8 10 12
DC
Lo
ad C
urr
ent
(mA
)
DC
Lo
d V
olt
age
(Vo
lts)
R-Load (Kohms)
V-load (Volts) I-load (mA)
0
1000
2000
3000
4000
5000
6000
7000
1
1.5
2
2.5
3
3.5
0 2 4 6 8 10 12
RP
M
DC
Po
we
r (m
W)
R-load (KOhm)
P-load (mW) RPM
0
0.2
0.4
0.6
0.8
1
1.2
1.4
1.6
1.8
2
0.5
1
1.5
2
2.5
3
3.5
4
4.5
5
5.5
2 4 6 8 10 12
Vin
-rm
s (V
olt
s)
V-l
oad
DC
(V
olt
s)
R-load (KOhm)
V-load (Volts) Vin-rms (volts)
Figure 9.13 OTI-2 (N) DC power, DC load voltage/current, RPM and generator voltage against
load resistance, using LTC3105 to boost the voltage sent to the load to 5 volts.
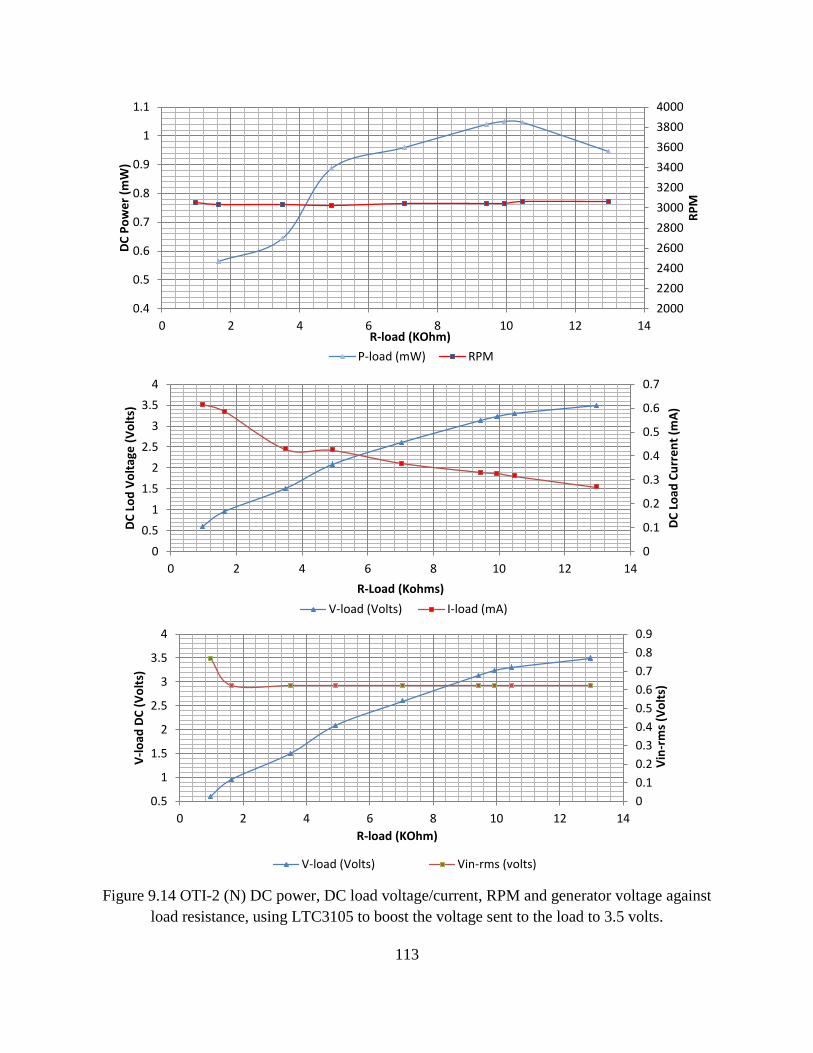
113
0
0.1
0.2
0.3
0.4
0.5
0.6
0.7
0
0.5
1
1.5
2
2.5
3
3.5
4
0 2 4 6 8 10 12 14
DC
Lo
ad C
urr
en
t (m
A)
DC
Lo
d V
olt
age
(V
olt
s)
R-Load (Kohms)
V-load (Volts) I-load (mA)
0
0.1
0.2
0.3
0.4
0.5
0.6
0.7
0.8
0.9
0.5
1
1.5
2
2.5
3
3.5
4
0 2 4 6 8 10 12 14
Vin
-rm
s (V
olt
s)
V-l
oad
DC
(V
olt
s)
R-load (KOhm)
V-load (Volts) Vin-rms (volts)
2000
2200
2400
2600
2800
3000
3200
3400
3600
3800
4000
0.4
0.5
0.6
0.7
0.8
0.9
1
1.1
0 2 4 6 8 10 12 14
RP
M
DC
Po
we
r (m
W)
R-load (KOhm)
P-load (mW) RPM
Figure 9.14 OTI-2 (N) DC power, DC load voltage/current, RPM and generator voltage against
load resistance, using LTC3105 to boost the voltage sent to the load to 3.5 volts.

114
9.2 Water Flow Harvesting Results
In the next part of the evaluation the turbines were tested using water because the test
could provide a basis of departure for estimating their performance using a variety of Newtonian
fluids with similar density as water and foresee some performance issues that may need to be
addressed before the in-vitro testing. In the following sections the versatility of these turbines
can be seen as they are tested using a liquid as a harvesting source.
9.2.1 AC Power and Efficiency
The power curves using water flow as a harvesting source were calculated by multiplying
the voltage and current at the load and the efficiency was calculated by first finding the power of
the fluid flow through the turbine under the influence of the difference in pressure between its
inlet and its outlet and then dividing the electrical power found at the load by the power
produced by the flow. Using the Pressure-Volume-Work principle and Eq’s 9.3, 9.4 and 9.5
below, where,
m’=v’ ρ (Eq. 9.3)
and m’ is the mass flow rate in Kg/sec, v’ is the volumetric flow rate in m3/sec., and ρ is the
density of the fluid in Kg/m3. Then, if by dividing the pressure difference across the turbine by
the density of the fluid, the associated work can be calculated using Eq. 9.4
W = (Pin – Pout)/ρ (Eq. 9.4)
where W is the work in J/Kg, Pin and Pout are the pressure at the inlet and outlet of the turbine
respectively in Pa (J/m3) and ρ is the density of the fluid in Kg/m
3.
Finally, using Eq. 9.5 the power from the flow was found as,
P = m’ W (Eq. 9.5)

115
0.01
0.51
1.01
1.51
2.01
2.51
3.01
3.51
0 0.2 0.4 0.6 0.8 1 1.2
Po
we
r (m
W)
R-load (KOhm)
2291 RPM, 2.38 PSI, 99.08 mL/m 1828 RPM, 1.4 PSI, 91.5 mL/m
777 RPM, 0.3 PSI, 89.42 mL/m
where P is the power in J/sec (Watts), m’ is the mass flow rate in Kg/sec. and W is the work in
J/Kg. By using substitution of Eq’s 9.3 and 9.4 into Eq. 9.5, and programming the results into a
spreadsheet multiple points can be calculated to obtain the average peak efficiency (PE) and the
average center-of-curve efficiency (CCE) as was done previously in section 9.1.
Figure 9.15 shows the power against load resistance curves for the MST, while Figure
9.16 shows the power against rms voltage generated.
Figure 9.15 MST (W) AC power in mW vs load resistance in KΩ for changing RPM, pressure
difference in PSI and flow Q in liters/min.
The performance of these turbines in water is limited by their ability to rotate as freely as
possible the way they did in nitrogen. Because water is much denser than nitrogen and the
turbine blade assembly is submerged in water, the turbine is unable to achieve high RPMs, so
only three power curves were plotted. This difference in density will also translate into a
decrease in efficiency and lower output voltage as suggested by Figure 7.16 where the generator
was only able to reach a 500 mV rms output. The MST’s average CCE efficiency in water was
found to be 8.1% and the PE, 9.1%

116
0.01
0.1
1
10
0 0.2 0.4 0.6
Po
we
r (m
W)
Voltage generated (rms volts)
2291 RPM, 2.38 PSI, 99.08 mL/m
1828 RPM, 1.4 PSI, 91.5 mL/m
777 RPM, 0.3 PSI, 89.42 mL/m
Figure 9.16 MST (W) AC power in mW vs generated rms voltage in volts for different RPM,
pressure difference in PSI and flow Q in mL/m (left) and efficiency vs load current in mA
(right)
The pressure difference in PSI represents the PSI drop across the turbine that sustains the
given flow and produces the RPM rotation given. The power curves for OTI-1 can be seen in
Figures 9.17 and 9.18 and those for OTI-2 appear in Figures 9.19 and 9.20.
9.2.2 Water Flow Harvesting DC Power
In order to find the power curves of the DC load, the single diode rectifier was connected
to the MST, OTI-1 and OTI-2 turbines. The rectified voltage was then connected to the TI
BQ25504 and the LTC 3105 DC to DC converters of Figure 8.5. These two converters afforded
two different startup voltages at 385 mV and 200 mW minimum respectively.
0
2
4
6
8
10
12
0 10 20 30
Effi
cie
ncy
- %
AC current at the load (mA)
2291 RPM, 2.38 PSI, 99.08 mL/m1828 RPM, 1.4 PSI, 91.5 mL/m777 RPM, 0.3 PSI, 89.42 mL/m

117
0.01
0.1
1
10
0 0.2 0.4 0.6 0.8 1 1.2
Po
we
r (m
W),
Lo
g(1
0)
R-load (KOhm)
1750 RPM, 3.04 PSI, 955 mL/m 1560 RPM, 3.04 PSI, 858 mL/m
730 RPM, 1.38 PSI, 663 mL/m 240 RPM, 0.425 PSI, 438 mL/m
0.01
0.1
1
10
0 0.1 0.2 0.3 0.4
Po
we
r (m
W)
Voltage generated (volts))
1750 RPM, 3.04 PSI, 955 mL/m
1560 RPM, 3.04 PSI, 858 mL/m
730 RPM, 1.38 PSI, 663 mL/m
240 RPM, 0.425 PSI, 438 mL/m
Figure 9.17 OTI-1 (W) AC power in mW vs load resistance in KΩ for changing RPM, pressure
difference in PSI and flow Q in liters/min
Figure 9.18 OTI-1 (W) AC power in mW vs generated rms voltage in volts for different RPM,
pressure difference in PSI and flow Q in mL/m (left) and efficiency vs load current (right)
0.01
0.1
1
10
100
0 5 10 15 20
Effi
cie
ncy
-%
(Lo
g)
AC Load Current (mA)
1750 RPM, 3.04 PSI, 955 mL/m
1560 RPM, 3.04 PSI, 858 mL/m
730 RPM, 1.38 PSI, 663 mL/m
240 RPM, 0.425 PSI, 438 mL/m
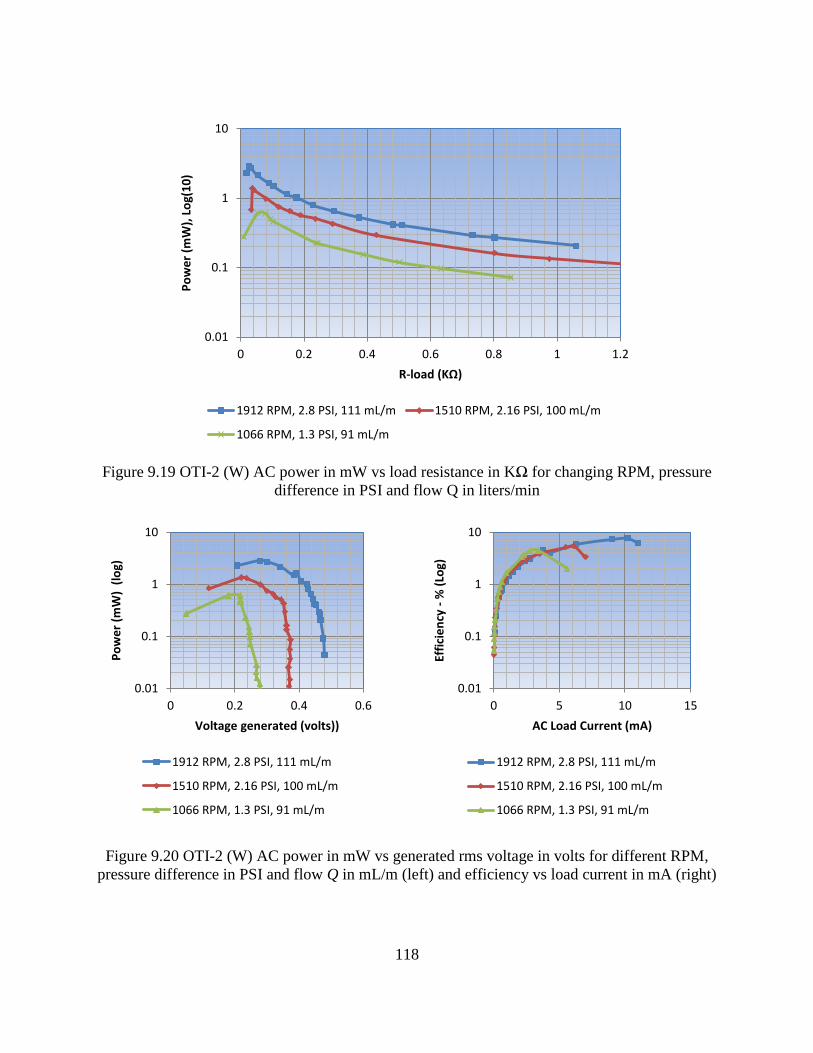
118
0.01
0.1
1
10
0 0.2 0.4 0.6 0.8 1 1.2
Po
we
r (m
W),
Lo
g(1
0)
R-load (KΩ)
1912 RPM, 2.8 PSI, 111 mL/m 1510 RPM, 2.16 PSI, 100 mL/m
1066 RPM, 1.3 PSI, 91 mL/m
0.01
0.1
1
10
0 0.2 0.4 0.6
Po
we
r (m
W)
(lo
g)
Voltage generated (volts))
1912 RPM, 2.8 PSI, 111 mL/m
1510 RPM, 2.16 PSI, 100 mL/m
1066 RPM, 1.3 PSI, 91 mL/m
Figure 9.19 OTI-2 (W) AC power in mW vs load resistance in KΩ for changing RPM, pressure
difference in PSI and flow Q in liters/min
Figure 9.20 OTI-2 (W) AC power in mW vs generated rms voltage in volts for different RPM,
pressure difference in PSI and flow Q in mL/m (left) and efficiency vs load current in mA (right)
0.01
0.1
1
10
0 5 10 15
Effi
cie
ncy
- %
(Lo
g)
AC Load Current (mA)
1912 RPM, 2.8 PSI, 111 mL/m
1510 RPM, 2.16 PSI, 100 mL/m
1066 RPM, 1.3 PSI, 91 mL/m

119
1000
1500
2000
2500
3000
0
0.1
0.2
0.3
0.4
0 100 200 300 400 500
RP
M
Po
we
r (m
W)
R-load (KOhm)
Pload-dc (mW) RPM
0
0.05
0.1
0.15
0
1
2
3
4
5
0 100 200 300 400 500 DC
Lo
ad c
urr
en
t (m
A)
DC
Lo
ad v
olt
age
(Vo
lts)
R-Load (KOhm)
Vdc (volts) Idc(mA)
0
0.2
0.4
0.6
0.8
1
0
0.5
1
1.5
2
2.5
3
3.5
0 100 200 300 400 500
Vin
-rm
s (V
olt
s)
DC
Lo
ad V
olt
age
(V
olt
s)
R-Load (KOhm)
Vdc (volts) Vin-rms (volts)
9.2.2.1 MST DC Power
The graphs that resulted from the testing of the MST are seen in Figure 9.21 using the TI
BQ25504 DC to DC converter and Figure 9.22 using the LTC 3105 converter.
Figure 9.21 MST (W) DC power, DC load voltage/current, RPM and generator voltage against
load resistance, using TI BQ 25504 to boost the voltage sent to the load at 2600 RPM (left)
and at 2100 RPM (right).
0
1000
2000
3000
0
0.1
0.2
0.3
0 100 200 300 400
RP
M
Po
we
r (m
W)
R-load (KOhm)
Pload-dc (mW) RPM
0
0.05
0.1
0.15
0
1
2
3
4
5
0 100 200 300 400 DC
Lo
ad c
urr
en
t (m
A)
DC
Lo
ad v
olt
age
(Vo
lts)
R-Load (KOhm)
Vdc (volts) Idc(mA)
0
0.2
0.4
0.6
0.8
1
0
0.5
1
1.5
2
2.5
3
3.5
0 100 200 300 400
Vin
-rm
s (V
olt
s)
DC
Lo
ad V
olt
age
(V
olt
s)
R-Load (KOhm)
Vdc (volts) Vin-rms (volts)
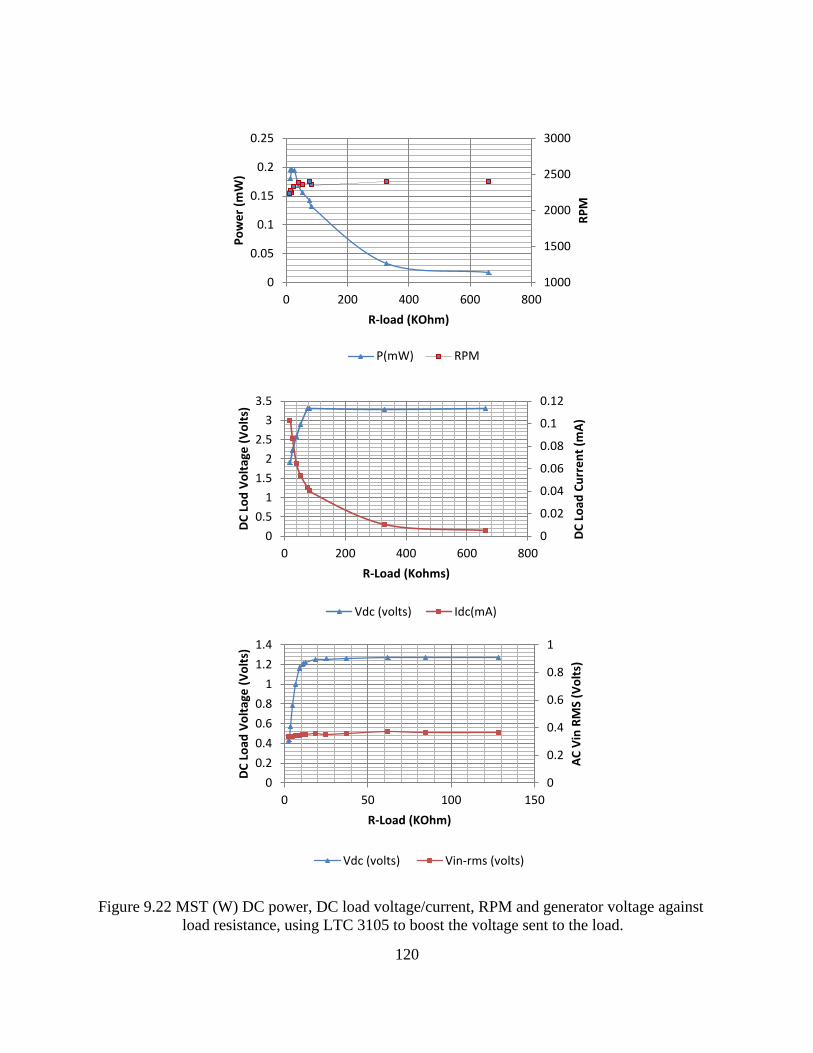
120
1000
1500
2000
2500
3000
0
0.05
0.1
0.15
0.2
0.25
0 200 400 600 800
RP
M
Po
we
r (m
W)
R-load (KOhm)
P(mW) RPM
0
0.02
0.04
0.06
0.08
0.1
0.12
0
0.5
1
1.5
2
2.5
3
3.5
0 200 400 600 800
DC
Lo
ad C
urr
en
t (m
A)
DC
Lo
d V
olt
age
(V
olt
s)
R-Load (Kohms)
Vdc (volts) Idc(mA)
0
0.2
0.4
0.6
0.8
1
0
0.2
0.4
0.6
0.8
1
1.2
1.4
0 50 100 150
AC
Vin
RM
S (V
olt
s)
DC
Lo
ad V
olt
age
(V
olt
s)
R-Load (KOhm)
Vdc (volts) Vin-rms (volts)
Figure 9.22 MST (W) DC power, DC load voltage/current, RPM and generator voltage against
load resistance, using LTC 3105 to boost the voltage sent to the load.

121
9.2.2.2 OTI-1 DC Power
In a similar manner to the DC measurements in nitrogen, the OTI-1 DC measurements
graphs using water flow as a harvesting source were obtained.
Figure 9.23 OTI-1 (W) DC power, DC load voltage, DC load current, RPM and RMS generator
voltage against load resistance, using TI BQ 25504 (left) and LTC 3105 (right)
400
600
800
1000
0
0.2
0.4
0.6
0.8
1
0 50 100 150 200
RP
M
Po
we
r (m
W)
R-load (KOhm)
Pload-dc (mW) RPM
400
900
1400
0
0.05
0.1
0.15
0.2
0 50 100 150
RP
M
Po
we
r (m
W)
R-load (KOhm)
Pload-dc (mW) RPM
0
0.05
0.1
0.15
0.2
0.25
0
1
2
3
4
5
0 100 200 300
DC
Lo
ad c
urr
en
t (m
A)
DC
Lo
ad v
olt
age
(Vo
lts)
R-Load (KOhm)
Vdc (volts) Idc(mA)
0
0.05
0.1
0.15
0.2
0
0.5
1
1.5
2
0 50 100 150
DC
Lo
ad c
urr
en
t (m
A)
DC
Lo
ad v
olt
age
(Vo
lts)
R-Load (KOhm)
Vdc (volts) Idc(mA)
0.335
0.355
0.375
0.395
0
1
2
3
4
0 100 200 300 AC
Vin
RM
S (V
olt
s)
DC
Lo
ad V
olt
age
(V
olt
s)
R-Load (KOhm)
Vdc (volts) Vin-rms (volts)
0
0.2
0.4
0.6
0.8
1
0
0.5
1
1.5
0 50 100 150 AC
Vin
RM
S (V
olt
s)
DC
Lo
ad V
olt
age
(V
olt
s)
R-Load (KOhm)
Vdc (volts) Vin-rms (volts)

122
In Figure 9.23 one can see the behavior of the OTI-1 using water. Since the OTI-1 has a
larger diameter than the MST, the RPM is much lower than that of the MST to maintain 3.1 volts
at the load using the BQ25504. But the LTC 3105 was only able to maintain between 1 and 2
volts at the load, perhaps due to differences in input impedance.
9.2.2.3 OTI-2 DC Power
Lastly, Figure 9.24 shows the behavior of turbine OTI-2 in water, using both the
BQ25504 and the LTC 3105. Notice that the BQ25504 is able to maintain 3.1 volts at the load
demanding 2000 RPM from the generator which then generates almost 500 mV, half of which is
lost at the rectifier. The LTC 3105 on the other hand is only able to source up to 2.5 volts to the
load. This can be seen by comparing the power curves, where the LTC 3105 only produces 130
µW and the BQ255 is able to produce over 500 µW.
9.3 Simulated Blood Flow Harvesting Results
The turbines’ behavior has examined through a thorough characterization process using
nitrogen and water as harvesting sources. This chapter is concluded by examining the results of
the in-vitro tests conducted on the two turbines that were optimized for implantation, the OTI-1
and the OTI-2.
9.3.1 AC Power and Efficiency
The power curves using simulated blood (SB) flow as a harvesting source were
calculated by multiplying the voltage and current at the load and the efficiency was calculated by
the same methodology employed in the previously with water and explained in section 9.2.1 with
small adjustments for the density ρ since the density of blood is slightly higher than that of water.
Figure 9.25 displays the AC power.

123
Figure 9.24 OTI-2 (W) DC power, DC load voltage, DC load current, RPM and RMS generator
voltage against load resistance, using TI BQ 25504 (left) and LTC 3105 (right)
1000
1500
2000
2500
3000
3500
0
0.1
0.2
0.3
0.4
0.5
0.6
0 200 400 600
RP
M
Po
we
r (m
W)
R-load (KOhm)
Pload-dc (mW) RPM
2000
2500
3000
3500
0
0.05
0.1
0.15
0 200 400 600 800
RP
M
Po
we
r (m
W)
R-load (KOhm)
Pload-dc (mW) RPM
0
0.05
0.1
0.15
0.2
0.25
0.3
0
1
2
3
4
5
0 200 400 600
DC
Lo
ad c
urr
en
t (m
A)
DC
Lo
ad v
olt
age
(Vo
lts)
R-Load (KOhm)
Vdc (volts) Idc(mA)
0
0.05
0.1
0.15
0
1
2
3
0 200 400 600 800 DC
Lo
ad c
urr
en
t (m
A)
DC
Lo
ad v
olt
age
(Vo
lts)
R-Load (KOhm)
Vdc (volts) Idc(mA)
0
0.2
0.4
0.6
0.8
1
0
0.5
1
1.5
2
2.5
3
3.5
0 200 400 600
AC
Vin
RM
S (V
olt
s)
DC
Lo
ad V
olt
age
(V
olt
s)
R-Load (KOhm)
Vdc (volts) Vin-rms (volts)
0
0.2
0.4
0.6
0.8
1
0
0.5
1
1.5
2
2.5
3
0 200 400 600 800A
C V
in R
MS
(Vo
lts)
DC
Lo
ad V
olt
age
(V
olt
s)
R-Load (KOhm)
Vdc (volts) Vin-rms (volts)

124
0.01
0.11
0.21
0.31
0.41
0.51
0.61
0.71
0.81
0.91
0 0.2 0.4 0.6 0.8 1 1.2
Po
we
r (m
W)
R-load (KOhm)
460 RPM, 58 mmHg, 598.7 mL/m 200 RPM, 37 mmHg, 503 mL/m
The power vs load resistance curves can be seen in Figure 9.25 and the power vs the
generated voltage, Vin-rms appear in Figure 9.26. Given that these turbines are optimized for
use as implantable devices, this time it is important to minimize the RPM to ensure that the
pressure drop across the turbine is as small as possible to prevent any adverse effects in the body.
The peak and average efficiencies were calculated and found to be PE = 10.2% and CCE =
4.3%. These low efficiency values were expected, since the turbine is immersed in the fluid and
has to rotate at lower speeds to prevent shear rates associated with hemolysis and platelet
activation.
Figure 9.25 OTI-1 (SB) AC power in mW vs load resistance in KΩ for changing RPM,
pressure difference in mmHg and flow Q in mL/min
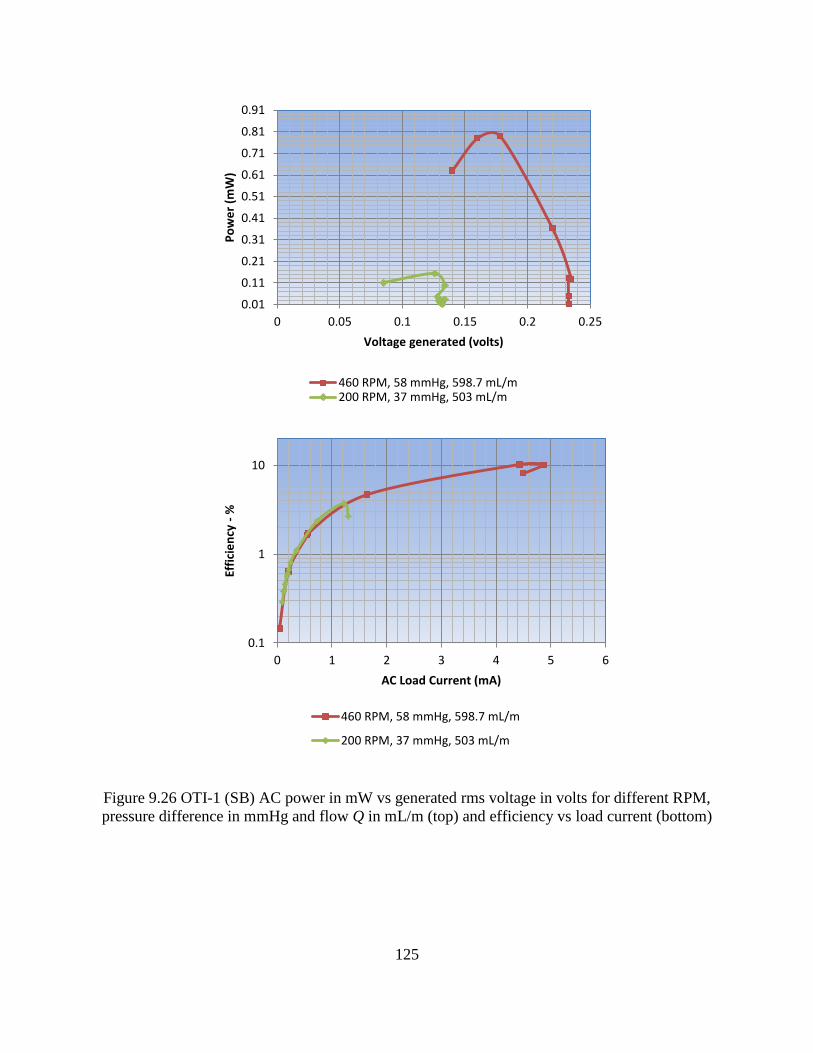
125
0.1
1
10
0 1 2 3 4 5 6
Effi
cie
ncy
- %
AC Load Current (mA)
460 RPM, 58 mmHg, 598.7 mL/m
200 RPM, 37 mmHg, 503 mL/m
0.01
0.11
0.21
0.31
0.41
0.51
0.61
0.71
0.81
0.91
0 0.05 0.1 0.15 0.2 0.25
Po
we
r (m
W)
Voltage generated (volts)
460 RPM, 58 mmHg, 598.7 mL/m200 RPM, 37 mmHg, 503 mL/m
Figure 9.26 OTI-1 (SB) AC power in mW vs generated rms voltage in volts for different RPM,
pressure difference in mmHg and flow Q in mL/m (top) and efficiency vs load current (bottom)

126
0.01
0.1
1
0 0.05 0.1 0.15 0.2 0.25
Po
we
r (m
W)
Voltage generated (volts))
850 RPM, 57 mmHg, 88 mL/m
460 RPM, 37 mmHg, 67 mL/m
0
0.02
0.04
0.06
0.08
0.1
0.12
0.14
0.16
0.18
0.01
0.11
0.21
0.31
0.41
0.51
0.61
0 0.2 0.4 0.6 0.8 1 1.2
Po
we
r (m
W),
Lo
g(1
0)
R-load (KOhm)
850 RPM, 57 mmHg, 88 mL/m
460 RPM, 37 mmHg, 67 mL/m
Figure 9.27 OTI-2 (SB) AC power in mW vs load resistance in KΩ for changing RPM, pressure
difference in PSI and flow Q in mL/min
Figure 9.28 OTI-2 (SB) AC power in mW vs generated rms voltage in volts for different RPM,
pressure difference in mmHg and flow Q in mL/m and efficiency vs load current in mA (right)
In Figures 9.27 and 9.28 the AC power curves for OTI-2 are displayed. This turbine is in
fact smaller than OTI-1 allowing for easier implantation, but at a reduced power tradeoff. See
Table 7.4 for feature size comparisons between OTI-1 and OTI-2.
0
1
2
3
4
5
6
7
8
0 2 4 6 8 10
Effi
cie
ncy
- %
AC Load Current (mA)
850 RPM, 57 mmHg, 88 mL/m
460 RPM, 37 mmHg, 67 mL/m

127
The power that in seen in Figure 9.25 is sufficient to power many IMDs including a
pacemaker which only requires approximately 10 to 20 µW according to [94].
This power is considered raw power that needs to be rectified and rectification losses are
very substantial. So at this juncture the author decided to investigate a way to dispense with the
rectifier by using a DC to DC converter that accepts either polarity and given the fact that low
RPMs produce low frequencies seen by the converter as a changing polarity at the input, the
LTC 3109 converter was considered because it allows both polarities. The LTC 3109 evaluation
board was not available in time so an experiment was devised with the LTC 3108 which is able
to produce 2.2 volts from an input 20 mV or higher. It was hoped that the LTC 3108 would see
at least 20 mV during the positive half cycle of the generator’s output and still be able to produce
enough power to source the most common IMDs available.
9.3.2 DC Power
Two LTC 3108 DC to DC converters were used to proceed with the turbine evaluations
and it was found that in fact the converter could be connected directly to the generator without
using a rectifier in between. This is possible because the cold start unit of the DC to DC
converter has a reverse voltage protection diode that attenuates any negative spikes that may
surge in the input voltage [95] as is the case of the BQ25504. In the case of the LTC family, the
Zener diode seen at input pin C1 on the LTC3108 will also ground a negative peak [96].
Therefore the generator output’s sinusoidal negative half cycle is grounded, while the low
frequency positive half cycle is passed and seen as a variable fluctuating positive level which is
accepted by the converter according to the datasheet. This allowed the avoidance of the losses
associated with the rectifier and it was possible to run the turbines at lower RPMs to reduce the
pressure drop across the turbine to the lowest possible level.

128
Although this is not the recommended use of these converters, connecting the output of
the generator directly to the converter facilitated the completion of this work, showing the proof
of concept presented by the thesis in section 1.1, that it is possible to use the SIPS to harvest
enough energy from the flow of the blood in the circulatory system for powering an IMD.
9.3.2.1 OTI-1 DC Power
The resulting power, voltage, current, RPM and Vin-rms graphs are seen in Figure 9.29
for the LTC 3108 supercap DC to DC converter (left) and for the LTC 3105 femto converter
(right). Both converters manage to maintain over two volts at the load , but the LTC 3108
Supercap was only able to produce between 50 and 60 µW due to the fact that it demands a lot of
current to charge its capacitors, while the femto passes all the power tothe load.
9.3.2.2 OTI-2 DC Power
The BQ25504 was then tested with the OTI-2, which produced some meaningful results
presented below. Figure 9.30 displays the results using the BQ25504 with no rectifier. Figure
9.31 shows the findings using the LTC 3108 supercap and LTC 3108 femto also without
rectification. It is quite remarkable that the OTI-2 being a smaller turbine is able to achieve a
higher voltage over 3 volts when connected directly to the LTC 3108 femto, and that is so
because there is close match in impedance between the two.
The original 18.8 mm diameter generator has an input impedance of approximately 7.3 Ω
per coil, but when two contiguous phases are taken together they add up to 14.6 Ω, which is very
close to the input impedance of the LTC 3108 femto board’s of 12.6 Ω. This matching is only
possible at very low frequencies, where the real part of the complex impedance dominates and
the imaginary part approaches zero.

129
Figure 9.29 OTI-1 (SB) DC power, DC load voltage, DC load current, RPM and rms generator
voltage against load resistance, using LTC 3108 Supercap (left) and LTC 3108 femto (right)
100
150
200
250
300
350
400
0
0.01
0.02
0.03
0.04
0.05
0.06
0.07
0 200 400 600 800 1000
RP
M
Po
we
r (m
W)
R-load (KΩ)
Pload-dc (mW)
0
100
200
300
400
500
0
0.02
0.04
0.06
0.08
0.1
0.12
0 100 200 300 400
RP
M
Po
we
r (m
W)
R-load (KΩ)
Pload-dc (mW) RPM
0
0.005
0.01
0.015
0.02
0.025
0.03
0.035
0
0.5
1
1.5
2
2.5
0 200 400 600 800
DC
Lo
ad c
urr
en
t (m
A)
DC
Lo
ad v
olt
age
(Vo
lts)
R-Load (KΩ)
Vdc (volts) Idc(mA)
0
0.02
0.04
0.06
0.08
0.1
0.12
0
0.5
1
1.5
2
2.5
3
0 100 200 300 400
DC
Lo
ad c
urr
en
t (m
A)
DC
Lo
ad v
olt
age
(Vo
lts)
R-Load (KΩ)
Vdc (volts)
0
0.02
0.04
0.06
0.08
0.1
0
0.5
1
1.5
2
2.5
0 200 400 600 800
AC
Vin
RM
S (V
olt
s)
DC
Lo
ad V
olt
age
(V
olt
s)
R-Load (KΩ)
Vdc (volts) Vin-rms (volts)
0
0.05
0.1
0.15
0.2
0.25
0.3
0
0.5
1
1.5
2
2.5
0 100 200 300 400
AC
Vin
RM
S (V
olt
s)
DC
Lo
ad V
olt
age
(V
olt
s)
R-Load (KΩ)
Vdc (volts) Vin-rms (volts)

130
Figure 9.30 OTI-2 (SB) DC power, DC load voltage, DC load current, RPM and rms generator
voltage vs load resistance, using BQ 25504 above 1000 RPM (left) and below 1000 RPM (right)
0
500
1000
1500
2000
2500
0
0.05
0.1
0.15
0.2
0.25
0.3
0 200 400 600 800
RP
M
Po
we
r (m
W)
R-load (KOhm)
Pload-dc (mW) RPM
02004006008001000120014001600
00.010.020.030.040.050.060.070.080.09
0 500 1000
RP
M
Po
we
r (m
W)
R-load (KOhm)
Pload-dc (mW) RPM
0
0.02
0.04
0.06
0.08
0.1
0.12
0.14
0
1
2
3
4
5
0 200 400 600 800
DC
Lo
ad c
urr
en
t (m
A)
DC
Lo
ad v
olt
age
(Vo
lts)
R-Load (KOhm)
Vdc (volts) Idc(mA)
0
0.005
0.01
0.015
0.02
0.025
0.03
0.035
0.04
0.045
0
1
2
3
4
5
0 200 400 600 800
DC
Lo
ad c
urr
en
t (m
A)
DC
Lo
ad v
olt
age
(Vo
lts)
R-Load (KOhm)
Vdc (volts) Idc(mA)
0
0.1
0.2
0.3
0.4
0.5
0.6
0
0.5
1
1.5
2
2.5
3
3.5
0 200 400 600 800
AC
Vin
RM
S (V
olt
s
DC
Lo
ad V
olt
age
(V
olt
s)
R-Load (KOhm)
Vdc (volts) Vin-rms (volts)
0
0.05
0.1
0.15
0.2
0.25
0.3
0
0.5
1
1.5
2
2.5
3
3.5
0 200 400 600 800
AC
Vin
RM
S (V
olt
s)
DC
Lo
ad V
olt
age
(V
olt
s)
R-Load (KOhm)
Vdc (volts) Vin-rms (volts)

131
Figure 9.31 OTI-2 (SB) DC power, DC load voltage, DC load current, RPM and rms generator
voltage against load resistance, using LTC 3108 supercap (left) and LTC 3108 femto (right)
This work is concluded in the next chapter, where conclusions are drawn based on the
findings in the previous chapters. Recommendations for future works are also presented in an
attempt to push the present effort forward.
-200
300
800
1300
1800
0
0.01
0.02
0.03
0.04
0.05
0.06
0.07
0 200 400 600 800
RP
M
Po
we
r (m
W)
R-load (KOhm)
Pload-dc (mW) RPM
200
400
600
800
1000
0
0.02
0.04
0.06
0.08
0.1
0 200 400 600 800
RP
M
Po
we
r (m
W)
R-load (KOhm)
Pload-dc (mW) RPM
0
0.01
0.02
0.03
0.04
0
0.5
1
1.5
2
2.5
3
0 200 400 600 800
DC
Lo
ad c
urr
en
t (m
A)
DC
Lo
ad v
olt
age
(Vo
lts)
R-Load (KOhm)
Vdc (volts) Idc(mA)
0
0.01
0.02
0.03
0.04
0.05
0.06
0
1
2
3
4
0 200 400 600 800
DC
Lo
ad c
urr
en
t (m
A)
DC
Lo
ad v
olt
age
(Vo
lts)
R-Load (KOhm)
Vdc (volts) Idc(mA)
0
0.02
0.04
0.06
0.08
0.1
0
0.5
1
1.5
2
2.5
0 200 400 600 800
AC
Vin
RM
S (V
olt
s)
DC
Lo
ad V
olt
age
(V
olt
s)
R-Load (KOhm)
Vdc (volts) Vin-rms (volts)
0
0.02
0.04
0.06
0.08
0.1
0
1
2
3
4
0 200 400 600 800A
C V
in R
MS
(Vo
lts)
DC
Lo
ad V
olt
age
(V
olt
s)
R-Load (KOhm)
Vdc (volts) Vin-rms (volts)

132
CHAPTER 10: CONCLUSIONS AND FUTURE WORKS
10.1 Introduction
In this work four notched-blade turbines were designed, the LST, MST, OTI-1 and OTI-2
using a CAD program. The MST’s flow characteristics were simulated, which led to the design
and fabrication of the LST and to the optimization of the OTI-1 and OTI-2. The CAD design
was used to fabricate the turbines by 3D printing in ABS. They were then integrated into an
energy harvesting and delivery system (EHDS) by coupling each one to a generator whose
output voltage was rectified and boosted by a DC to DC converter.
The resulting EHDS was extensively tested by use of three test beds designed to
specifically evaluate the system’s ability to harvest energy from three separate and distinct fluid
flows: Nitrogen, water and simulated blood, the results of which can be found in chapter 9 of
this work.
It is important to alert the reader to the circumstances that impinged on the flow and
quality of our results as a lessons learned and improvements checklist for those who are
interested in continuing furthering this research effort. Many lessons were learned, but in
particular four are worthy of consideration at this time:
1. The surface quality, specifically of the inside of the casings of 3D printed models
may increase the resistance to the fluid flow when compared to a molded or machined
parts with a very smooth finish.
2. The generators used provided high currents at various RPMs, but very little voltage,
which decreased their performance at the low RPMs needed for implantation. A

133
more appropriate generator can be designed and manufactured for around U.S.
$10,000 or less, greatly improving the performance of the system and decreasing the
size of the turbines even more. A well-tuned generator that produces a high voltage
and moderate currents at low RPMs would take advantage of high viscosity fluids
that provide higher torque at lower speeds.
3. Impedance matching between the generator and the rectifier and DC to DC
conversion system needs to be studied more closely to ensure that the turbine is
operating at its optimum potential.
4. Experimentation of blade designs that decrease the resistance between the back of the
blade and the fluid even more. New simulations and fabrication are recommended
that take into consideration the blade’s ability to cut through the fluid as it turns. This
will help improve performance even in high viscosity fluids such as water and blood
when compared to gases.
10.2 LST Conclusions
The LST was integrated and now is considered the large scale turbine energy harvesting
system, LST-EHDS. It demonstrated great potential for applications in harvesting energy from
any gas at moderate flow rates of tens of liters per minute. Industrial processes that use gasses
such as nitrogen, oxygen, argon, etc. for many fabrication and manufacturing processes can
benefit from installing this turbine in their process lines and harvest the flow energy to power
internet of things (IoT) devices that can continuously monitor and report wirelessly normal
and/or abnormal findings in their environment.
The findings can then be communicated directly to computers that control conveyor belts
that carry parts in an assembly line, for example.

134
The addition of an LST EHDS to any industrial process would increase safety for the
workers and provides a mechanism to prevent damage to the machines by stopping the process if
a critical finding warrants it.
10.3 MST Conclusions
The MST, just like the LST now becomes the MST-EHDS. This system was tested both
with nitrogen gas and water to examine its ability to harvest and deliver power to a circuit. It
produced up to 23.4 mW of raw power using nitrogen flow and up to 3 mW using water flow as
an energy source. This system can be used to replace many batteries found in a home, office or
industrial setting. It has a very small operating volume of 1 mL, requiring small flows and low
pressure requirements down 0.2 PSI. It is small enough to be non-obstructing even when
supplying power to small systems with limited real estate. It demonstrated a very robust
behavior given to the wide blade design with increased flow contact area when compared to the
OTI-1 and OTI-2.
10.4 OTI-1 Conclusions
This system once integrated is considered a symbiotic intra-corporeal power source
which is a specialized EHDS and is the topic of this dissertation. In this work it was found to
provide enough power to source three out five IMDs listed on table 2.2: Most pacemakers and
defibrillators which require between 30 and 100 µW and some neurological stimulators at 30 µW
to 2 mW. Of course the high end of these ranges is outside the peak DC power of 71 µW found
for the OTI-1 at a very low 225 RPM and 468 mL/m flow (see Table 10.1). With some
impedance matching this SIPS can go beyond this range now that a rectifier is not being used.

135
An LTC 3109 DC to DC converter may accept the unrectified input of both the positive
and negative half cycles produced by the generator when operating at the low RPMs required for
implantation.
Table 10.1 Characterization data of the OTI-1 SIPS using simulated blood flow as a harvesting
source
Optimized Turbine for Implantation 1 (OTI-1)
DC Measurements (2.3 volts) LTC 3108 femto Simulated blood
Vdc (volts) Idc(mA)
Vin-rms (volts) Freq(Hz) RPM R (KΩs)
Pload-dc (mW)
Pd (mmHg)
Q (mL/m)
2.35 0.004 0.092 23 230 587.5 0.0094 36 468
2.35 0.0047 0.092 23 230 500 0.011045 36 468
2.35 0.0049 0.092 23 230 479.5918 0.011515 36 468
2.35 0.0068 0.101 23 230 345.5882 0.01598 36 468
2.35 0.0082 0.092 21 210 286.5854 0.01927 36 468
2.35 0.0124 0.092 23 230 189.5161 0.02914 36 468
2.35 0.0148 0.101 20 200 158.7838 0.03478 36 468
2.35 0.0216 0.092 23 230 108.7963 0.05076 36 468
2.35 0.026 0.101 23 230 90.38462 0.0611 36 468
2.2 0.0324 0.092 23 230 67.90123 0.07128 36 473
1.1 0.101 0.101 19 190 10.89109 0.1111 35 473
0.7 0.0675 0.101 19 190 10.37037 0.04725 35 478
0.44 0.0435 0.101 19 190 10.11494 0.01914 35 483
225
36 468.5
10.5 OTI-2 Conclusions
Due to better impedance matching between the generator and the LTC 3108 DC to DC
converters, especially the femto, the OTI-2 SIPS outperformed (88 µW) the OTI-1 (71 µW) even
though it is smaller and has a smaller generator. But it required approximately 650 RPM with a
flow of 600 mL/m to operate and caused a drop of 62 mmHg.(see Table 10.2). Ideally, no more
than 10% of the blood pressure should be harvested from the circulatory system in order to
reduce the potential for hypoperfusion and ischemia distal to the implantation site, that is if the
SIPS is connected in series configuration (see chapter 5).

136
An alternative is to connect the SIPS in a parallel configuration that takes advantage of
the great potential pressure difference between an artery and a vein, which can be as much as 120
mmHg during systole (time when the left and right ventricles contract and pump the blood into
the aorta and the main pulmonary artery respectively) and 80 mmHg during diastole (time when
the ventricles are at rest, receiving blood from the atria).
Table 10.2 Characterization data of the OTI-2 SIPS using simulated blood flow as a harvesting
source
OTI-2 13x 3mm notched-turbine rotor
DC Measurements (3.6 volts) LTC 3108-femto Simulated
Blood
Vdc (volts)
Idc (mA)
Vin-rms (volts)
Freq (Hz) RPM R (KΩs) Pload-dc (mW)
Pd (mmHg) Q (mL/m)
3.6 0.006 0.042 66 660 600 0.0216 65 663
2.9 0.007 0.038 67 670 439.3939 0.01914 65 663
2.8 0.007 0.038 67 670 424.2424 0.01848 65 663
2.68 0.012 0.042 65 650 221.4876 0.032428 65 663
2.3 0.025 0.042 65 650 90.55118 0.05842 65 648
1.69 0.052 0.042 66 660 32.25191 0.088556 66 633
1.37 0.044 0.042 67 670 31.06576 0.060417 65 663
1.12 0.037 0.042 65 650 29.94652 0.041888 65 663
660 65.125 657.375
10.6 Materials Conclusions
The ultimate use of a SIPS in an actual commercial application is strictly dependent on
the use of materials and procedures that are hemo-compatible.
At this juncture, the implementation of hemo-compatible materials in the current work is
limited to making the argument or recommendation for use of a certain process. There are many
options for making an IMD hemo-compatible, but three of them are most readily available to the
author and have potential for collaboration between research groups at USF and are presented
here for consideration:

137
1. SiC deposition for coating our turbine blade assembly and the inside of the casing by
using PECVD in association with the SiC group at USF. This process could trigger a
new area of investigation and collaboration for the AMBIR group and can open the
doors to many researchers interested in continuing the present effort.
2. The second option is to use the traditional machining process of metals with
highquality and high durability mentioned in chapter 5. This process is costly, as we
don’t have the machinery and expertise to complete that process at USF, so the
designs would have to be submitted to a third party for fabrication. The Heartmate
II® left ventricular assist device (HM2 VAD), flagged as a system with low
thromboembolic risk by [97] uses Ti as a bulk material and then runs it through a
process that renders the blood-contacting surface smooth and textured (with Ti
microspheres) in different sections of the device to improve its hemo-compatibility.
3. The third option is to make the parts out of a less expensive metal and then coat their
surface to comply with the specifications outlined by ISO 14708-1:2014 as they apply
to IMDs. This process is highly beneficial to our research group as a means to study
the deposition of hemo-compatible coatings such as the diamond like coating (DLC)
using ion beam sputtering (IBS) which has demonstrated improved compatibility over
TiN[98]. This last option has a lot of merit as a research avenue, but requires the
acquisition of new equipment that can provide years of investigation potential for the
AMBIR lab.
Only those materials and procedures that are strictly necessary for proof of concept were
utilized in this work, such as PMMA and ABS. Although they are biocompatible, they are
minimally hemo-compatible and thus not sufficient to conclude that our system is ready for in-

138
vivo investigations. The research objectives presented in chapter 1 are revisited in the next
section to clarify their interpretations in light of the findings in chapter 9.
10.7 Research Objectives Conclusions
In section 1.2 it was stated that the objective of this research was to miniaturize the
NTEG originally developed by [28] at USF’s AMBIR group, down to an implantable size that
could power most common low power IMDs such as a pacemakers or defibrillators without the
need for a battery. This established a maximum power need of 10 mW as the high end of our
goal (Table 2.1). But this goal was set assuming that a dual generator system with 6 phases
operating simultaneously could be implemented and furthermore, that the results of a single
phase could be multiplied by 6. This is still possible if each phase is connected to a transformer
as found in chapter 2, but a system like that would be too large to implement as an implantable
medical device unless smaller, high voltage generators were used. It is possible though to use
such a device as an extracorporeal energy harvesting system using the current generators capable
of producing 10mW of power for IoT applications.
The goal of creating a SIPS is still possible by implementing two phases in series. This
approach produced very good results comparable to the battery of many IMDs implanted up to
now.
One of the most commonly implanted IMDs is the pacemaker, with average size of
48x43x7 cubic mm or14.57 cc [99], compared to size of the generators in this work, 1.49 cc
(MST), 7.83 cc (OTI-1) and 3.25 cc (OTI-2), with an average of 4.2 cc, which is well below half
the size of a typical pacemaker. And since half of the real estate of a pacemaker is taken by its
battery, these generators have a higher power density than the typical pacemaker’s lithium ion
battery.

139
The claims of section 1.2 and Table 2.1 (10 mW) therefore were achieved when looking
at the performance of the MST in water, since the claim was based on the performance
measurements in water obtained by [28].
The fourth row of Table 3.1 appears bolded to indicate the goal that was set to achieve,
powering most IMDs by staying around 2,000 RPM. It can be seen that at 2000 RPM the power
produced by 2 coils taken in series is 5.44 mW, while the power of a single coil is 2.728 (half as
much). Figure 9.15 shows this achievement, 3 mW, or 1.6 mW per phase with a slight increase
in RPM for a total of 10 mW when a dual coil system with 6 phases is used. This is of course a
calculation, and only empirical data from an experiment can prove these hypotheses as the
discussion moves to the future works section of this work. It was important to the author that
every avenue of possibilities be explored as it pertains to the potential application of these
turbine systems, so the research did not conclude with the miniaturization that produced the
MST, rather it continued to the development of the OTI-1 and OTI-2 which produced very good
results not only for implantation, but for extra-corporeal applications as well.
It is hereby concluded that the stated goals were achieved and a baseline for comparison
was established for future research. See Table 10.3 below for a summary of power density in
mW/cc of the four turbines evaluated in chapter 8.
In this section various ideas are presented to show how the SIPS can be used and
improved upon to meet the power needs of an ever increasing number of IMDs with increased
capabilities. The use of the SIPS in areas not demonstrated in this work are vast and very
diverse, but need to be explored so that those interested in bio-energy harvesting systems can
continue this research and make it an increasingly exciting field of investigation.

140
Table 10.3 Peak power density for LTS, MST, OTI-1 and OTI-2 turbines in mW/cc
Turbines Nitrogen Water Simulated Blood
Model
Volume
(cc)
Peak
Power
(mW)
Power Density
(mW/cc)
Peak
Power
(mW)
Power
Density
(mW/cc)
Peak
Power
(mW)
Power
Density
(mW/cc)
LST 49.00 80.00 1.63
MST 1.49 23.40 15.70 3.00 0.13
OTI-1 7.83 120.00 15.33 5.25 0.67 1.06 0.13
OTI-2 3.25 15.76 4.85 2.84 0.87 0.50 0.15
10.8 Future Works
The future looks bright for energy harvesting both inside and outside of the human body.
The time has come to stop envisioning what is to come and start implementing what we know is
needed to make it a reality.
The energy harvesting systems presented in this work have shown to be quite adaptable
and versatile in extracting energy from flow in any environment and taking them to the next level
will necessitate a conscious effort to use all of the coils at the same time by implementing a dual
generator system in which both generators are driven by a single turbine.
This system has the potential of driving 6 devices at the same time, where the output of
from each coil is connected to a different circuit.
Another option is to use a six diode configuration discussed in chapter 2, where 3 phases
per generator are rectified and stored in a capacitor. This approach would apply mainly to IoT
networks, with the single generator approach being reserved for intra-corporeal use to replace the
battery of an IMD. Two considerations that take advantage of this approach are considered
below.

141
10.8.1 Emergency Notification System
The use of the SIPS as a power source allows for the use of multiple modules, one of
which can be dedicated to monitoring the event of a heart attack.
Although implantable defibrillators use this technology, other system can also use it to
ensure prompt notification and treatment. In the event of a heart attack, the SIPS would stop
generating power and the IMD would not function as intended.
The SIPS can be modified to maintain sufficient charge in a supercapacitor (as seen with
the LTC 3108 supercap) to transmit a distress signal understood by any nearby cellphone, which
would automatically dial 911 and transmit the patient’s identification, condition and GPS
coordinates to the emergency response system. An implantable rectenna may be used to
communicate with its environment immediately outside of the body. This system can be
achieved by tuning and enhancing the RF energy harvesting system presented by Pérez and
Ababneh in [66].
10.8.2 Thrombus Detection System
The development of a thrombus (blood clot) is a dangerous event that could potentially
occur with any post-operative patients due to reduced activity or patients with poor circulation or
even with high potassium which contributes to the thickening of the blood. Often a clot is
formed in the deep veins of the legs and is called deep vein thrombosis (DVT). If the clot
dislodges from the walls of the veins (usually near a valve) it is called an embolus, which is more
threatening to the patient because it is now able to travel in the circulatory system and obstruct
the flow of blood to distant tissues and organs which will starve for nutrients and oxygen as a
consequence.

142
It is then imperative that a quick diagnosis be made concerning a patient with a thrombus
so that clot-busting drugs can be administered promptly before the thrombus becomes an
embolus. The development of a blood clot is an event that produces an increase in D-dimer, a
blood marker of endogenous fibrinolysis detectable in patients with DVT[62].
If the proposed generator is made of a biocompatible non-thrombogenic material that is
coated with a blood repellent[5], a patient with a SIPS has the advantage that the SIPS can power
a D-dimer LOC (lab on a chip) that will quickly detect whether the patient has developed a
thrombus. This information can be sent wirelessly to the patient’s cell phone which would dial
911 and report the D-dimer test results and the person’s location, giving the doctor enough time
to save the patient’s life by administering the necessary drugs. This capability can be
investigated and implemented as one of many future works areas that stem from the current
research effort.

143
REFERENCES
[1] E. A. Finkelstein, J. G. Trogdon, J. W. Cohen, and W. Dietz, “Annual Medical
Spending Attributable To Obesity: Payer-And Service-Specific Estimates,” Health Aff.
(Millwood), vol. 28, no. 5, pp. w822–w831, Sep. 2009.
[2] C. L. Ogden, M. D. Carroll, B. K. Kit, and K. M. Flegal, “Prevalence of Childhood and
Adult Obesity in the United States, 2011-2012,” JAMA, vol. 311, no. 8, p. 806, Feb.
2014.
[3] S. Gollakota, H. Hassanieh, B. Ransford, D. Katabi, and K. Fu, “They Can Hear Your
Heartbeats: Non-invasive Security for Implantable Medical Devices,” in Proceedings of
the ACM SIGCOMM 2011 Conference, New York, NY, USA, 2011, pp. 2–13.
[4] J. W. Smith, C. Thorne, W. C. Grabb, and R. W. Beasley, Grabb and Smith’s plastic
surgery. Lippincott Williams & Wilkins, 2007.
[5] D. C. Leslie, A. Waterhouse, J. B. Berthet, T. M. Valentin, A. L. Watters, A. Jain, P.
Kim, B. D. Hatton, A. Nedder, K. Donovan, E. H. Super, C. Howell, C. P. Johnson, T.
L. Vu, D. E. Bolgen, S. Rifai, A. R. Hansen, M. Aizenberg, M. Super, J. Aizenberg, and
D. E. Ingber, “A bioinspired omniphobic surface coating on medical devices prevents
thrombosis and biofouling,” Nat. Biotechnol., vol. 32, no. 11, pp. 1134–1140, Nov.
2014.
[6] H. Cabra, S. Thomas, and S. Pérez, “‘Design, Mathematical Model, and Simulation of a
Novel Mini Notched Impulse Turbine’ - Submitted,” IEEE Trans. Power Syst.
[7] M. Jonsson, A. Zurbuchen, A. Haeberlin, A. Pfenniger, and R. Vogel, “Vascular
Turbine Powering a Cardiac Pacemaker: an In-vivo Case Study,” 2014.
[8] Y. Yang, X.-J. Wei, and J. Liu, “Suitability of a thermoelectric power generator for
implantable medical electronic devices,” J. Phys. Appl. Phys., vol. 40, no. 18, p. 5790,
2007.
[9] G. Wang, W. Liu, M. Sivaprakasam, and G. A. Kendir, “Design and analysis of an
adaptive transcutaneous power telemetry for biomedical implants,” IEEE Trans.
Circuits Syst. Regul. Pap., vol. 52, no. 10, pp. 2109–2117, Oct. 2005.
[10] S. Priya and D. J. Inman, Energy harvesting technologies, vol. 21. Springer, 2009.

144
[11] J. A. Paradiso and T. Starner, “Energy scavenging for mobile and wireless electronics,”
Pervasive Comput. IEEE, vol. 4, no. 1, pp. 18–27, 2005.
[12] E. V. Potapov, M. Loebe, B. A. Nasseri, H. Sinawski, A. Koster, H. Kuppe, G. P. Noon,
M. E. DeBakey, and R. Hetzer, “Pulsatile Flow in Patients With a Novel Nonpulsatile
Implantable Ventricular Assist Device,” Circulation, vol. 102, no. suppl 3, pp. Iii–183–
Iii–187, Nov. 2000.
[13] S. Klotz, B. Meyns, A. Simon, T. Wittwer, P. Rahmanian, C. Schlensak, T. T. Tjan, H.
H. Scheld, and D. Burkhoff, “Partial mechanical long-term support with the CircuLite
Synergy pump as bridge-to-transplant in congestive heart failure,” Thorac Cardiovasc
Surg, vol. 58, no. Suppl 2, pp. S173–S178, 2010.
[14] S. Agarwal and K. M. High, “Newer-generation ventricular assist devices,” Best Pract.
Res. Clin. Anaesthesiol., vol. 26, no. 2, pp. 117–130, Jun. 2012.
[15] http://www.mdtmag.com/article/2014/10/energy-harvesting-ics-power-electric-body
[MDT, “Energy Harvesting ICs Power the Electric Body”, October 7,-2015].
[16] Tuttle, Todd M., et al. "Increasing use of contralateral prophylactic mastectomy for
breast cancer patients: a trend toward more aggressive surgical treatment." Journal of
Clinical Oncology 25.33 (2007): 5203-5209.
[17] “Blood Marker Tests,” Breastcancer.org. [Online]. Available:
http://www.breastcancer.org/symptoms/testing/types/blood_marker. [Accessed: 11-Jan-
2015].
[18] http://www.medicalnewstoday.com/articles/257898.php, [Medical News Today “Tiny
Lab’ Implanted Under Skin Transmits Blood Marker Levels”, January 23, 2015].
[19] “Energy Harvesting ICs Power the Electric Body,” Medical Design Technology.
[Online]. Available: http://www.mdtmag.com/articles/2014/10/energy-harvesting-ics-
power-electric-body. [Accessed: 01-Jan-2015].
[20] M. J. Ramsay and W. W. Clark, “Piezoelectric energy harvesting for bio-MEMS
applications,” 2001, vol. 4332, pp. 429–438.
[21] A. Harb, “Energy harvesting: State-of-the-art,” Renew. Energy, vol. 36, no. 10, pp.
2641–2654, Oct. 2011.
[22] D. C. Bock, A. C. Marschilok, K. J. Takeuchi, and E. S. Takeuchi, “Batteries used to
power implantable biomedical devices,” Electrochimica Acta, vol. 84, pp. 155–164,
Dec. 2012.

145
[23] “ICD Manufacturers Must Increase Battery Life to Cut Costs, Improve Care,” DI
Cardiology. [Online]. Available: http://www.dicardiology.com/article/icd-
manufacturers-must-increase-battery-life-cut-costs-improve-care.[Accessed: 9-Jul-14].
[24] U.S. Environmental Protection Agency, “Proceedings Of Public Hearings: Plutonium
And The Other Transuranium Elements Volume III Additional Materials Received (3-
73)”, 1975
[25] D. A. McIntyre, “The Eleven Most Implanted Medical Devices In America,”
247wallst.com,19-Jul-2011.[Online].Available:http://247wallst.com/healthcare-
conomy/2011/07/18/the-eleven-most-implanted-medical-devices-in-america/.[Jul7,‘14].
[26] “ICD Manufacturers Must Increase Battery Life to Cut Costs, Improve Care,” DI
Cardiology. [Online]. Available: http://www.dicardiology.com/article/icd-
manufacturers-must-increase-battery-life-cut-costs-improve-care.[Accessed: 9-Jul-14].
[27] J. Kymissis, C. Kendall, J. Paradiso, and N. Gershenfeld, “Parasitic power harvesting in
shoes,” in Second International Symposium on Wearable Computers, 1998. Digest of
Papers, 1998, pp. 132–139.
[28] H. Cabra, “Design, Simulation, Prototype, and Testing of a Notched Blade Energy
Generation System,” Grad. Theses Diss., May 2014.
[29] S. R. Platt, S. Farritor, K. Garvin, and H. Haider, “The use of piezoelectric ceramics for
electric power generation within orthopedic implants,” IEEEASME Trans. Mechatron.,
vol. 10, no. 4, pp. 455–461, Aug. 2005.
[30] P. Miao, P.D. Mitcheson, A.S. Holmes, E.M. Yeatman, T.C. Green, and B.H. Stark,
“Mems inertial power generators for biomedical applications,” Microsyst Technol, vol.
12, pp. 1079–1083, 2006.
[31] R. Amirtharajah and A. P. Chandrakasan, “Self-powered signal processing using
vibration-based power generation,” Solid-State Circuits IEEE J. Of, vol. 33, no. 5, pp.
687–695,
[32] H. Goto, D. T. Sugiura, Y. Harada, and T. Kazui, “Feasibility of using the automatic
generating system for quartz watches as a leadless pacemaker power source,” Med. Biol.
Eng. Comput., vol. 37, no. 3, pp. 377–380, May 1999.
[33] Savoie, Richard, and Gary Searle. "Medical device having capacitive coupling
communication and energy harvesting." U.S. Patent No. 8,939,928. 27 Jan. 2015.
[34] K. Goto, T. Nakagawa, O. Nakamura, and S. Kawata, “An implantable power supply
with an optically rechargeable lithium battery,” Biomed. Eng. IEEE Trans. On, vol. 48,
no. 7, pp. 830–833, 2001.

146
[35] Y. Zhu, S. O. R. Moheimani, and M. R. Yuce, “Ultrasonic Energy Transmission and
Conversion Using a 2-D MEMS Resonator,” IEEE Electron Device Lett., vol. 31, no. 4,
pp. 374–376, Apr. 2010.
[36] Bert Lenaerts and Robert Puers, “An inductive power link for a wireless endoscope,”
Biosens. Electron., no. 22, pp. 1390–1395, 2007.
[37] J.A. Paradiso, T. Starner, “Energy scavenging for mobile and wireless electronics,”
IEEE Pervasive Computing, Vol.4, Issue 1, pp.18-27, 2005
[38] S. Am and H. Nh, “Human red blood cell hemolysis in a turbulent shear flow:
contribution of Reynolds shear stresses.,” Biorheology, vol. 21, no. 6, pp. 783–797, Dec.
1983.
[39] X. Wei and J. Liu, “Power sources and electrical recharging strategies for implantable
medical devices,” Front. Energy Power Eng. China, vol. 2, no. 1, pp. 1–13, 2008.
[40] “8-pole magnetic ring, 12 slot stator,” Daido Electronics. [Online]. Available:
http://www.daido-
electronics.co.jp/english/analysis/magnetic_field/images/image01.png.
[41] W. R. Douglas, “Of pigs and men and research,” Space Life Sci., vol. 3, no. 3, pp. 226–
234, Jun. 1972.
[42] Wilson, N., et al. "Normal intracardiac and great artery blood velocity measurements by
pulsed Doppler echocardiography." Heart 53.4 (1985): 451-458.
[43] A. S. Manolis and T. A. Manolis, “Totally Implantable Artificial Heart: Still a Major
Challenge,” Hosp. Chron., vol. 9, no. 1 Sup, pp. 60–62, May 2014.
[44] “Tesla polyphase induction motors : Ac Motors - Electronics Textbook,” All About
Circuits. [Online]. Available: http://www.allaboutcircuits.com/vol_2/chpt_13/7.html.
[Accessed: 19-Jan-2015].
[45] T. R. Kuphaldt, Lessons In Electric Circuits, Volume II – AC, 6th ed., vol. 2, 6 vols.
[46] “INDUCTION MOTORS: ROTATING FIELD, SLIP and TORQUE (part 2),”
Industrial Electronics Information for Manufacturing Applications. [Online]. Available:
http://www.industrial-electronics.com/Electric-Motors-
Drives_5b.html#sthash.FeQ7gM3T.dpuf.
[47] W. Storr, “Full Wave Rectifier and Bridge Rectifier Theory,” Basic Electronics
Tutorials. [Online]. Available: http://www.electronics-tutorials.ws/diode/diode_6.html.
[Accessed: 19-Jan-2015].

147
[48] “Rectifier circuits : Diodes And Rectifiers - Electronics Textbook,” All About Circuits.
[Online]. Available: http://www.allaboutcircuits.com/vol_3/chpt_3/4.html. [Accessed:
19-Jan-2015].
[49] Y. Yang, G. Dong Xu, and J. Liu, “A Prototype of an Implantable Thermoelectric
Generator for Permanent Power Supply to Body Inside a Medical Device,” J. Med.
Devices, vol. 8, no. 1, pp. 014507–014507, Dec. 2013.
[50] C. Peters, J. Handwerker, D. Maurath, and Y. Manoli, “An ultra-low-voltage active
rectifier for energy harvesting applications,” in Circuits and Systems (ISCAS),
Proceedings of 2010 IEEE International Symposium on, 2010, pp. 889–892.
[51] W. Nichols, M. O’Rourke, and C. Vlachopoulos, McDonald’s blood flow in arteries:
theoretical, experimental and clinical principles. CRC Press, 2011.
[52] “Bernoulli Equation.” [Online]. Available: http://hydrogen.physik.uni-
wuppertal.de/hyperphysics/hyperphysics/hbase/pber.html.
[53] Richard E. Klabunde, Cardiovascular Physiology Concepts, Second. Lippincott
Williams & Wilkins, 2011.
[54] W. B. Lo and H. Ellis, “The Circle Before Willis: A Historical Account of the
Intracranial Anastomosis,” Neurosurgery, vol. 66, no. 1, pp. 7–18, Jan. 2010.
[55] Study Blue, “Arteries and Veins”, [Online]. Available:
https://s3.amazonaws.com/classconnection/84/flashcards/7928084/jpg/veins-arteries-
14CC9D6E1881216A64A-thumb400.jpg
[56] “Implantable Pulse Generators ‘Stimulate’ Medical Device Industry,” Medical Design
Technology. [Online]. Available:
http://www.mdtmag.com/articles/2012/01/implantable-pulse-generators-
%E2%80%98stimulate%E2%80%99-medical-device-industry.[Accessed: 07-Jul-14].
[57] M. J. Brescia, J. E. Cimino, K. Appel, and B. J. Hurwich, “Chronic Hemodialysis Using
Venipuncture and a Surgically Created Arteriovenous Fistula,” N. Engl. J. Med., vol.
275, no. 20, pp. 1089–1092, Nov. 1966
[58] “Coronary anastomosis,” TheFreeDictionary.com. [Online]. Available: http://medical-
dictionary.thefreedictionary.com/Coronary+anastomosis. [Accessed: 19-Jan-15].
[59] Mayo Clinic, “Riverside.” [Online]. Available:
http://www.riversideonline.com/health_reference/Bladder-
Kidney/DA00078.cfm?RenderForPrint=1. [Accessed: 19-Jan-2015].

148
[60] H. B. Bittner, J. Garbade, S. Lehmann, M. J. Barten, and F. W. Mohr, “Extra-Corporeal
Membrane Oxygenation Support in Cardiac Transplantation,” J. Heart Lung
Transplant., vol. 32, no. 4, pp. S257–S257, 2013.
[61] R. G. Carroll, “CARDIOVASCULAR PRESSURE-FLOW RELATIONSHIPS: WHAT
SHOULD BE TAUGHT?,” Adv. Physiol. Educ., vol. 25, no. 2, pp. 8–14, Jun. 2001.
[62] P. S. Wells, D. R. Anderson, M. Rodger, M. Forgie, C. Kearon, J. Dreyer, G. Kovacs,
M. Mitchell, B. Lewandowski, and M. J. Kovacs, “Evaluation of D-Dimer in the
Diagnosis of Suspected Deep-Vein Thrombosis,” N. Engl. J. Med., vol. 349, no. 13, pp.
1227–1235, Sep. 2003.
[63] Henry Cabra and S. Thomas, “Design, Simulation and Prototyping Model of a
Miniaturized Bio Energy Generation System,” Technical Proceeding of the 22nd
IASTED International Symposia on Modeling and Simulation, MS, 2011.
[64] H. Cabra and S. W. Thomas, “Fabrication of cross flow bio microturbine”,
http://cap.ee.imperial.ac.uk/~pdm97/powermems/2010/posterpdfs/ 183_Cabra_158.pdf
[65] Majdi M. Ababneh, Samuel Pérez, Henry Cabra, and Sylvia Thomas,’’ Design of A
Novel Mini Notched Turbine With Optimized Power Management Circuit,’’ The 8th
international Renewable Energy Congress, March 2017
[66] Majdi M. Ababneh, Samuel Pérez, and Sylvia Thomas, “Optimized Power Management
Circuit for Implantable Rectenna for In-Body Medical Devices,’’ The 12th IEEE
international conference on Power Electronics and Drive Systems, December 2017
[67] Song, Kwangsun, et al. "Subdermal flexible solar cell arrays for powering medical
electronic implants." Advanced healthcare materials 5.13 (2016): 1572-1580.
[68] “Life is Easy with IoT”, IoThought. [Online]. Available:
http://iothought.com/wearables-of-internet-of-medical-things [ Accessed: March 4,
2015]
[69] “WHAT IS CNC MACHINING? AN OVERVIEW OF THE CNC MACHINING
PROCESS.”, Astro Machine. [Online] Available: http://astromachineworks.com/what-
is-cnc-machining/ [Accessed: March 4, 2015]
[70] “What is 3D Printing? The definitive guide to additive manufacturing”, [Online].
Available: https://www.3dhubs.com/what-is-3d-printing#materials [Accessed: 19-Jan-
2015]
[71] "Material properties and fabrication parameters in selective laser sintering process", [Ian
Gibson, Dongping Shi, , Rapid Prototyping Journal, Vol. 3 Issue: 4, pp.129-136, 1997]
[Online].Available:http://www.emeraldinsight.com/doi/full/10.1108/135525497101918
36[Accessed: Match 5, 2018]

149
[72] “CNC MACHINING VS SLA AND SLS”, Steve, WayKen [Online]. Available:
https://www.waykenrm.com/cnc-machining-vs-sla-and-sls.html [Accessed: Nov 8,
2017]
[73] “Vacuum Casting”, AFS and The Institute [Online]. Available:
http://www.afsinc.org/content.cfm?ItemNumber=6911 [Accessed: March, 17, 2018]
[74] “Mass Production of Medical Devices by Metal Injection Molding”, MD+DI, John L.
Johnson. [Online]. Available: htt;://www.mdonline.com/mass=production-medical-
devices-metal-injection-molding [Accessed: March 21, 2018]
[75] “Lessons In Electric Circuits”, Tony R. Kuphaldt, under the terms and conditions of the
Design Science License, copyright (C) 2000-2010, Nov. 2015 [Online]. Available:
http://www.malayalam.net/howto/LessonsInElectricCircuits/AC/AC_13.html [Acessed:
20 Jan 2015]
[76] “Bernoulli Equation”, Hyperphysics. [Online]. Available: http://hydrogen.physik.uni-
wuppertal.de/hyperphysics/hyperphysics/hbase/pber.html [Accessed: Nov 2, 2017]
[77] Elaine N. Marieb, Benjamin Cummings Human Anatomy and Physiology, Sixth Ed.,
Pearson, 2004. (Power Point Slides)
[78] Jonathan Daniels, “A V Fistula graft” [Online]. Available:
https://www.youtube.com/watch?v=6I_gzfPFW1U [Accessed: 22 Dec 2017]
[79] “Red blood cells (erythrocytes)”, Encyclopedia Britannica. [Online]. Available:
https://www.britannica.com/science/red-blood-cell [Accessed: June 4, 2017]
[80] “High shear stress can initiate both platelet aggregation and shedding of procoagulant
containing microparticles”, Y. Miyazaki, S. Nomura, T. Miyake, H. Kagawa, C. Kitada,
H. Taniguchi, Y. Komiyama, Y. Fujimura, Y. Ikeda, S. Fukuhara, , Vol. 88, No. 9, pp.
3456–3464, 1996. [Online]. Available: https://www.ncbi.nlm.nih.gov/pubmed/8896411
[Accessed: May 9, 2016]
[81] [81]“Platelet Activation: The Mechanisms and Potential Biomarkers”, Seong-Hoon
Yun,Eun-Hye Sim, Ri-Young Goh, Joo-In Park, and Jin-Yeong Han, , [Online].
Available: https://www.hindawi.com/journals/bmri/2016/9060143/ [Accessed: March
2016]
[82] “High shear stress can initiate both platelet aggregation and shedding of procoagulant
containing microparticles”, Y. Miyazaki, S. Nomura, T. Miyake, H. Kagawa, C. Kitada,
H. Taniguchi, Y. Komiyama, Y. Fujimura, Y. Ikeda, S. Fukuhara, , Vol. 88, No. 9, pp.
3456–3464, 1996. [Online]. Available: https://www.ncbi.nlm.nih.gov/pubmed/8896411
[Accessed: 5-Jan-16]

150
[83] Mihov, D., and B. Katerska. "Some biocompatible materials used in medical
practice." Trakia Journal of Sciences 8.2 (2010): 119-125.
[84] Rajagopalan, T., et al. "Low temperature deposition of nanocrystalline silicon carbide
films by plasma enhanced chemical vapor deposition and their structural and optical
characterization." Journal of Applied Physics 94.8 (2003): 5252-5260.
[85] Register, Joseph J., SiC for advanced biological applications. University of South
Florida, 2014.
[86] Caglar, Veli, et al. "Study of volume, weight and size of normal pancreas, spleen and
kidney in adults autopsies." Forensic Medicine and Anatomy Research 2.03 (2014): 63.
[87] “Zortrax 3D Printed Artificial Heat”, All3DP. [Online]. Available:
https://all3dp.com/zortrax-3d-printed-artificial-heart/ [Accessed: 10 February, 2017]
[88] Dodziuk, Helena. 2016. "Applications of 3D printing in healthcare". Kardiochirurgia i
Torakochirurgia Polska/Polish Journal of Thoracic and Cardiovascular Surgery 13 (3):
283-293. doi:10.5114/kitp.2016.62625
[89] “A quarterly letter of the Instrumentation Testing Association”, ITA News. [Online].
Available:
http://www.instrument.org/enews/2010/Spring2010/ITAEnewsSpring2010_files/Page43
5.htm [Accessed: March 13, 2018]
[90] Makid Y. Yousif, “Deriving a Blood-Mimicking Fluid for Particle Image Velocimetry
in Sylgard-184 Vascular Models”, 31st Annual International Conference of the IEE
EMBS Minneapolis, Minnesota, USA, September 2-5-6, 2009.
[91] N. Antonova, E. Zvetkova, I. Ivanov and Y. Savov, “Hemorheological changes and
characteristic parameters derived from whole blood viscometry in chronic heroin
addicts”, Clinical Hemorheology and Microcirculation , vol 39, pp. 53-61, 2008.
[92] Mao, Song Shou, et al. "Normal thoracic aorta diameter on cardiac computed
tomography in healthy asymptomatic adults: impact of age and gender." Academic
radiology 15.7 (2008): 827-834.
[93] Mohiaddin, RAAD H., DAVID N. Firmin, and DONALD B. Longmore. "Age-related
changes of human aortic flow wave velocity measured noninvasively by magnetic
resonance imaging." Journal of Applied Physiology 74.1 (1993): 492-497.
[94]
Haeberlin, Andreas, et al. "The first batteryless, solar-powered cardiac
pacemaker." Heart rhythm 12.6 (2015): 1317-1323.

151
[95] Instruments, Texas. "bq25504-Ultra Low Power Boost Converter with Battery
Management for Energy Harvester Applications Datasheet." Rev A (2012).
[96] “LTC 3108 –Data sheet”, Technologies, Linear. [Online]. Available:
http://cds.linear.com/docs/en/datasheet/3108fc.pdf [Accessed: Mar 25, 2018]
[97] John, Ranjit, et al. "Low thromboembolic risk for patients with the Heartmate II left
ventricular assist device." The Journal of thoracic and cardiovascular surgery 136.5
(2008): 1318-1323.
[98] Sin, Dong-Choon, Ho-Lun Kei, and Xigeng Miao. ", Surface coatings for ventricular
assist devices.", Coatings for Biomedical Applications. 2012. 264-283.
[99] Mallela, Venkateswara Sarma, V. Ilankumaran, and N. Srinivasa Rao. "Trends in
cardiac pacemaker batteries." Indian pacing and electrophysiology journal 4.4 (2004):
201.10.8
[100] Hannan, Mahammad A., et al. "Energy harvesting for the implantable biomedical
devices: issues and challenges." Biomedical engineering online 13.1 (2014): 79.
[101] Wang, Bob, Aiguo Patrick Hu, and David Budgett. "Maintaining middle zero voltage
switching operation of parallel–parallel tuned wireless power transfer system under
bifurcation." IET Power Electronics 7.1 (2014): 78-84.
[102] Bocan, Kara N., and Ervin Sejdić. "Adaptive transcutaneous power transfer to
implantable devices: A state of the art review." Sensors 16.3 (2016): 393
[103] [102] Grabowski, Sandra Reynolds, and Gerard J. Tortora. Principles of anatomy and
physiology. Wiley, 2000.
[104] “Dual Surface Mount Schottky Barrier Diode SDM40E20L/s/c/a datasheet”, Diodes
Incorporated [Online] Available:
https://www.diodes.com/assets/Datasheets/ds30298.pdf, [Accessed: Feb 27, 2018]
[105] Yousif, Majid Y., David W. Holdsworth, and Tamie L. Poepping. "Deriving a blood-
mimicking fluid for particle image velocimetry in sylgard-184 vascular
models." Engineering in Medicine and Biology Society, 2009. EMBC 2009. Annual
International Conference of the IEEE. IEEE, 2009.

152
APPENDICES

153
Appendix A: Copyright Notices
The following notice is for the material in Chapter 7, 8 and 9.

154
Appendix B: Glossary of Terms
SIPS Symbiotic Intra-corporeal Power Source
NTEG Notched Turbine Energy Generator
PSAC Power Source and Conditioning
IMD Implantable Medical Device
VAD Ventricular Assist Device
MPPT Maximum Power Point Tracking
v-noz Nozzle velocity
Pflow Power from flow of gas or fluid
W Work
m’ Mass Flor Rate
v’ Volumetric Flow Rate
ρ Fluid Density in kg/m3
PR Mechanical Rotor Power
ID Diode Current
PE Peak Efficiency
CCE Center of Curve Efficiency
Q Flow in m3/s
SiC Silicon Carbide
Pd Pressure Difference
Pin Pressure at the inlet
Pout Pressure at the Outlet
ƒ Operating Frequency,

155
RPM Revolutions per Minute
RL Load Resistance
MEMS Microelectromechanical Systems
IoT Internet of Things
PCPTM Personalized Continuous Preventive Telemedicine
MST Miniaturized Scale Turbine
LST Large Scale Turbine
OTI-1 Optimized Turbine for Implantation 1
OTI-2 Optimized Turbine for Implantation 2
UHMWPE Ultra-high Molecular Weight Polyethylene
PMMA Polymethylmethacrylate
ABS Acrylonitrile Butadiene Styrene
PLA Polylactic Acid
156
ABOUT THE AUTHOR
Samuel Pérez Minaya is a retired U.S. Air Force (USAF) MSgt who immigrated to the
United States from the Dominican Republic in January 1988. He joined the USAF the same year
and completed his undergraduate studies in Computer Engineering at the University of Nebraska
at Omaha, in 2003. He later earned a M.Sc. in Electrical Engineering from The University of
South Florida (USF) in 2010. That same year, he retired from the USAF after 21 years of service
and was accepted into the doctoral program at USF where he later joined the advanced materials
bio & integration research laboratory (AMBIR).
As a research assistant under the direction of Dr. Sylvia Thomas, he has participated in
numerous educational and research endeavors that span integrated circuit processing, nanofiber
synthesis by electrospinning, and material analysis and characterization by scanning electron
microscopy (SEM) and Atomic Force Microscopy (AFM). Some of his interests include
nanomaterials and nanotechnology, nano electromechanical systems (NEMS), micro
electromechanical systems (MEMS), internet of things (IoT) applications, sensor technology and
design, energy harvesting and sustainable systems. His educational philosophy focuses on
capturing the students’ interest and attention through applications and realistic simulations that
bring any subject to life, allowing students to immerse themselves in the subject and to take
control of the learning process, using the teacher as a resource and not a as sage. His final work
at the AMBIR lab includes the integration of miniaturized turbines as energy harvesting systems
for intracorporeal and extracorporeal applications, which is the topic of his most recent work.