Embed Size (px)
Citation preview

1
Integrating Wind And Solar Energy In India
For A Smart Grid Platform
February, 2013
Farhan Beg
Under the supervision of
Mr Gajendra Behari Director,
Central Electricity Authority
(CEA)
With Support and Editorial By
Mr Peter Meissen
Director
Global Energy Network Institute
San Diego, California,92101

2
Table of Contents Table of Contents .................................................................................................................................. 2
List of Tables &Figures ........................................................................................................................ 4
List of Abbreviations ............................................................................................................................ 5
Abstract .................................................................................................................................................. 6
1. Introduction ....................................................................................................................................... 7
1.2 Transmission ............................................................................................................................. 10
1.3. Distribution ............................................................................................................................... 11
2. India’s Aging Electrical Grid ......................................................................................................... 14
2.1. Power Generation and Infrastructure ................................................................................... 14
2.2. Supply, Demand and Unofficial Connections ........................................................................ 15
2.3. Blackouts - Planned and Unplanned ...................................................................................... 16
2.4 . Transmission and Distribution Losses................................................................................17
2.5. Environmental Ramifications of the Power Sector ............................................................... 19
3. Prognosis and Smart Grid Introduction ....................................................................................... 21
4. Key Drivers of India’s Smart Grid ............................................................................................... 23
4.1. Supply Shortfalls and Continuing Increases in Demand ................................................. 23
4.2. Distributed Energy Resources (DERs) and Loss Reduction ................................................ 24
4.3. Managing the Human Element in System Operations .................................................... 24
4.4 Peak Load Management ..................................................................................................... 26
4.5. Renewable Energy .............................................................................................................. 28
4.6. Technological Leapfrogging ............................................................................................... 29
5. Smart Grid Philosophy ................................................................................................................... 30
5. Smart Grid Technology .............................................................................................................. 31
6.1 Network Operations .................................................................................................................. 33
6.2 Automated Metering Infra-structure Through Smart Meters ............................................. 33
6.3 Home Area Network ................................................................................................................. 34
6.3.1 Wiring...........................................................................................................................35
6.3.2 IEEE 802.3 Ethernet ………………..…………………………………………………..….….……………………..35
6.3.3 Power Line Communication (Home PLug)…………………………………….……………………..…….36
3
6.4. Fibre Optic-based Communication ........................................................................................ 36
6.5. FSAS for Integration of Renewable Generation ................................................................... 36
7. India’s Renewable Energy Scenario .............................................................................................. 38
7.1 Integration of Renewable Energy as a Primary Driver……………………………………………………..…38
7.2. Role of Renewable
Energy……………………………………………………………..…….399
7.3 Wind Energy in India…………………………………………………….…………………..40
7.4 State wide Wind Energy Installations ..................................................................................... 41
7.5 Solar Energy in India ................................................................................................................ 41
7.6. Solar Technologies ................................................................................................................... 43
7.7. Solar Thermal ........................................................................................................................... 44
8. Large-scale Integration of Wind and Solar Energy in the Grid ................................................. 46
8.1. Non Controllable Variability: ................................................................................................. 48
8.2. Extensive Unpredictability ...................................................................................................... 49
8.3. Dependency on Locations:....................................................................................................... 50
Conclusion ........................................................................................................................................... 52
Bibliography ........................................................................................................................................ 53

4
List of Tables & Figures
Figure 1: Indian Electricity Generation by Type, 2000-2012 ................................................................. 8
Figure 2: All India Installed Capacity (as of November 30, 2012) ......................................................... 9
Figure 3: Existing Transmission Lines and Expansion ......................................................................... 10
Figure 4: Growth of transmission system in India ................................................................................ 11
Figure 5: Cost of Power Supply (Paisa/kWh Sold) ............................................................................... 13
Figure 6 India’s Coal Production and Consumption ............................................................................ 15
Figure 7: Indian Distribution system, Crying out for help……………………………………………16
Figure 8: August 2012 Power Blackout in India ................................................................................... 17
Figure 9: T&D Losses in the System………………………………………………………….………18
Figure 10: Comparison of Life-Cycle Emissions (Tons of CO2 Equiv. Per Gig watt Hour)…………..
………………………………...……………………………………………………………………….19
Figure 11: Evolution of Traditional Grid to Smart Grid ....................................................................... 22
Figure 12: Supply and Demand by Region – 2012 ............................................................................... 23
Figure 13: Advanced Metering Infrastructure ...................................................................................... 25
Figure 14: Smart Grids Provide Two-way Communication ................................................................. 27
Figure 15: Various Layers of Smart Grid Infra-Structure ..................................................................... 32
Figure 16: Smart Grid Management ..................................................................................................... 33
Figure 17: Home Area Network Visualization ..................................................................................... 35
Figure 18: India Renewable Index in August 2012 .............................................................................. 39
Figure 19: Wind Power Installment World Ranking (est. August 2012( .............................................. 41
Figure 20: Indian Solar PV Growth in MW .......................................................................................... 43
Figure 21: Annually Installed Solar Thermal Capacity ........................................................................ 45
Figure 22: Variability of Wind Pictograph. .......................................................................................... 47
Figure 23: Wind and Solar Resources in India ............................................................................... 48

5
List of Abbreviations
1. IEA: International Energy Association
2. CEA: Central Electricity Authority
3. CERC: Central Electricity Regulatory Commission
4. CTU: Central Transmission Utility
5. IEGC: International Electricity Grid Code
6. RoW: Right of Way
7. PLF: Plant Load Factor
8. Discom: Distribution Companies
9. T&D: Transmission and Distribution
10. TERI: Tata Energy & Research Institute
11. EPRI: Electrical Power Research Institute
12. DER: Distributed Energy Resources
13. DG: Distributed Generation
14. AMI: Advanced Metering Infrastructure
15. RES: Renewable Energy Sources
16. JNNSM: Jawaharlal Nehru National Solar Mission
17. ICT: Information & Communications Technology
18. SGTF: Smart Grid Task Force
19. ESP: Ethernet Service Provider
20. EV: Electric Vehicles
21. BU: Billion Units
22. GPRS: General Packet Radio Service
23. HAN: House Area Network
24. SCADA: Supervisory Control And Data Acquisition
25. OFC: Optical Fibre Communication
26. FSAS: Frequency Support and Ancillary Services
27. DG: Distributed Generation
28. MNRE: Ministry of New and Renewable Energy
29. GDP: Gross Domestic Product
30. PLC: Programmable Logic Controller
31. PLCC: Power Line Carrier Communication
32. NTPC: National Thermal Power Corporation

6
Abstract
With an ever increasing population coupled with aconstant depletion of fossil fuel
resources and many sites reaching their ultimate capacity, India is in dire need of a Midas
touch or of an Aladdin’s Lamp. A much smarter approach towards the electrical grid is
needed. This smarter approach, technically referred to as the smart grid,promises affordable
electrical environment which seems to be the need of the hour.
India has large untapped resources of wind and solar energy, which if utilized properly,
can fulfill the energy requirements of the country to a large extent. This paper presents the
journey of the Indian power sector through time, analyses various demand and supply
scenarios, which are mutually exclusive,and also assesses various issues facing the Indian
Power System.
This paper proposes that integration of enhanced electrical capacity realized through a
large-scale integration of renewable energy resources, such as wind and solar energy, in the
Indian electrical grid can lead to a smarter grid platform. This platform will ensure increased
efficiency, reliability, and security, as well as reducing the environmental impact of
supplying the electrical power needs of the modern society. The result is an enhanced
electricity management environment and a dynamic programable renewable source
mobilization in India leading to energy independence and an electrical grid that is much more
reliable, secure, efficient, and greener.
Keywords: Smart grid, Wind and Solar energy, Micro sources, Electricity management.

7
1. Introduction
Electricity is a crucial facet of any country’s prosperity. India had an installed power
generation capacity of 210 GW as of November 30, 2012, which is about 154 times the
installed capacity in 1947 (1362 MW).1 Electricity generation growth has been steadily
increasing year after year, and in the year 2011-12 the generation was about 876.8 billion
KwH with a growth of 8% over the previous year. During the 11th
Five Year Plan, the
power sector made considerable progress with a capacity addition of 58 GW, which was
significantly more than the capacity commissioned in the previous plans.2
However, the demand has been consistently outstripping the supply even as power
availability has increased due to significant investments on the supply side. India faces
the challenge of poor reliability and a poor quality of electricity, leading to frequent load
shedding situations in one part of the country or the other.India has witnessed substantial
energy and peak shortages of 8.5% and 11% respectively in the year 2011-123.
The Indian power sector has been undergoing an evolution, from vertically involved
public utilities to unbundled entities, especially with more private assets joining in on the
generation side. The changes have led to steady improvements in efficiency and competition
and offer contingency management with better price signals to encourage the market
participants across the value chain.
Banking on the inspiration from these changes, India targets to set up substantially high
88 GW4 additional capacity during the 12
thFive Year Plan period, which may to a large extent
match the ever growing demand. To better understand the state of the Indian power sector, a
deeper analysis of all the three components, generation, transmission and distribution is
required.
1CEA, General Review 2012
2Ministry of Power, India Energy Statistics, 2011
3IEA International Energy Association, 2012
4All India Energy Statistics, 2012

8
Figure 1: Indian Electricity Generation by Type, 2000-2012 Source:Author, Data obtained from CEA Annual Report 2012
The Indian power generation industry is going through rough times. The sector is battling
several issues, largely related to fuel shortages, which could slow down the industrious pace
of capacity addition witnessed during the 11th
Five Year Pan period. In 2011-2012, a record
capacity addition of over 20,500 MW in a single year was registered in the sector, raising the
total capacity to about 55,000 MW.5 A significant contribution was reported from the private
sector with a share of over 58% during 2011 – 2012 and 42% during the entire five year plan
period. As on July 31 2012, India’s installed capacity (excluding captive plants) stood at
206,456 MW.6
Thermal sources continued to account for two thirds of the capacity at 137,386 MW,
followed by hydropower (19% or 39,291 MW),renewable energy (12.1% or 24,998 MW) and
nuclear power (2.3% or 4780 MW)7 of installed generating capacity.
At present the traditional power generation industry is at a juncture where issues like
capacity additions, enhanced reliability of power supply and quality, need to be addressed
quickly. These issues are paving the way for more investments and easier regulatory norms
for absorption of more renewable energy in the Indian National Grid. India’s power
generation sector consists mainly of coal-based thermal plants.
5Ibid
6Indianpowersector.com, Central Electricity Authority, 2012
7 Central Electricity Regulatory Commission, India, 2013
0
200
400
600
800
1000
1200
2000 2002 2004 2006 2008 2010 2012
Other Renewable
Nuclear
Hydroelectric
Conventional Thermal

9
It is ironic that India, with the fourth largest coal reserves in the world,is perpetually
struggling to meet its coal demand due to deficient coal production because of various policy
and infrastructural bottlenecks. The issues faced by the generation sectorare:
Coal and gas shortages: Thermal power generation suffered a shortfall of 20
BUs during 2011 – 2012, 9 BUs and 11 BUs due to a shortage of coal and gas
respectively.4
Figure 2:All India Installed Capacity (as of November 30, 2012)
Source: Author, with data from Monthly Reports CEA December 2012
Slowdown in hydropower capacity addition: Capacity addition from hydropower
sources slowed in the past couple of years. The year on year growth rates declined to
3.8% 2011-12 from 7.2% in 2006 – 2007.8 This is due to geological changes; to some
extent on local issues; deficiencies in survey and investigation; lack of transparency in
the process of award contracts and inadequacies in project execution.
Brake on nuclear power: In the post- Fukushima scenario, the opposition to nuclear
power in the country has gained ground. Although India has decided to proceed with
its nuclear agenda with greater safety measures, local opposition against the upcoming
nuclear projects could adversely impact its nuclear power ambition.
8www.nldc.in,National Load Dispatch Centre
57%
1%
9%
19%
2% 12%
Coal Diesel Gas Hydro Nuclear Non renewables

10
1.2 Transmission
In India, the power transmission business is a monopoly where the Central Transmission
Utility and the State Transmission Utility have the key responsibility for network planning,
development and execution. The private players have a negligible presence.9 It was only
during the 11th Plan Period that the Inter- State transmission sector was opened for private
sector participation through the establishment of joint ventures with power grid or through
the selection of Transmission System Provider involving competitive bidding.
Figure 3: Existing Transmission Lines and Expansion
Source: Metris Business Solutions, Transmission Lines Expansion in India, 2013
During the 11th
Plan Period (years 2007- 2012 ), open access in transmission was
introduced to promote competition among the generating companies that can now sell to
different distribution licensees across the country as well as consumers with a power demand
greater than 1 MW.10
The growth of transmission system is summarized in Figure 4.
9 Ministry of Power, Government of India, 2013
10ibid

11
Figure 4: Growth of transmission system in India
Source: Author, with data from FICCI and Power Plus Magazine, January 2013
Power transmission is regulated though elaborate and multi-faceted legislations, such as
the Electricity Act 2003 and India Electricity Grid Code (IEGC), and the effective
implementation of these legislations are essential. Greater executing powers need to be given
to the central and the state regulators as well as the system operators. The issues that need to
be addressed at present for both public and private transmission project developers are
procedural delays in land acquisition; obtaining rights of way; environmental and related
statutory clearances; and equipment deployment, particularly in hostile terrain.
1.3. Distribution
Distribution systems provide the critical last mile connectivity in the electricity sector.
The revenue collection, as the subsector of the electrical industry characteristic of this link,
makes it an important segment. Moreover, unlike the other two sectors- generation and
transmission, the distribution consumers (residential, commercial and industrial and often
have conflicting needs:
From2007 to 2011, the overall unit cost increased by 21%; but, the increase has not
been comparable or even proportionate with the increase in the cost of supply. As a
result, the gap between the cost of supply and the average tariff has been widening
over the years. The financial position of the electricity distribution sector has been a
concern for over a decade now. The financial and commercial viability of the state
•The state sector network grew voltage level up to 132 KV during the 50s and 60s and then to 220 kV during the 60s and 70s. Formation of state grids
•During the 3rd Five year plan the concept of regional planning in power sector was introduced.
Integration of the State grids
•Central sector generation utilities viz NHPC and NTPC were created. Evolution of Regional Grids
•In 1989, the transmission wings of Central generating companies were seperated to set up Power Grid Coorporation of India (PGCIL) to give thrust to implementation of tranmission system
Development of inter-regional links
•In 1992 the Eastern region and N-Eastern Region were synchronously interconnected,
Synchronization of Regional grids
•Generation and Transmission system in the country has shifted from an inter regional affair to a national affair giving the optimization of resources to system operators
Evolution of integrated National grid

12
owned distribution utilities is a major issue and is putting at risk the significant
investments being pumped into the electricity sector by private and public players.An
investment to the tune of $300,000 Million is the financial exposure of the Indian
banking industry.11
The estimated loss of all the State distribution utilities has been estimated at Rs 2.4
lakh crore as of March 31, 2012.12
Distribution companies, mostly state-owned, are mired with about $35 billion in
debt.13
Tariffs have not been revised in the last ten years, leading to calls for higher subsidies
to be implemented in the sub-sector to cover costs of inefficiencies; indifference of
consumers towards the efficiency of the appliances they use; augmentation of
distribution network to the ever changing profile of consumers in terms of
consumption levels, and distribution in time and space. In addition electricity theft has
not been checked to the extent that feasible. The electricity distribution losses are
huge and may be as high as 40% in some states, while the country-wide average is
27%.14
The current AT&C losses vary across state utilities, in the range of 12.22%(Himachal
Pradesh) to 72.86% (Jammu &Kashmir),to some extent owing to the fact that the
some areas are thinly populated; while the national average was about 26% in the year
2010-11.15
11
Power Grid Corporation of India Limited, T&D report 2012 12
Ibid 13
Index Mundi, India Public Debt, 2012 14
IndiaWorldEnergy.com, Transmission and Distribution in India, 2013 15
M.S. Bhalla, Transmission and Distribution Loss, Energy and resources Institute (TERIIN), 2012

13
Figure 5: Cost of Power Supply (Paisa/kWh Sold)
Source: Annual Report on Working of State Power Utilities and Electricity Departments 2011-12, Power &
electricity Division, Planning Commission, Government of India
0
100
200
300
400
500
600
Cost of Power Supply
Cost of Powersupply

14
2. India’s Aging Electrical Grid
On July 31 2012,India experienced the largest electrical blackout in history affecting
nearly 670 million people or 10% of the world’s population. The Northern Power Grid that
connects three of the country’s grids discontinued operating as blackouts extended almost
2,000 miles, from India’s eastern border with Myanmar to its western border with Pakistan16
.
Such an enormous power failure paves the way for more stringent regulations throughout
the electricity chain delivery system in the power sector. Indian authorities are leavingno
stone unturned to augment the supply chain of electricity delivery system so as the fragile and
weary electrical power delivery system of India is mended to the extent that such blackouts
do not occur in the near future.
The primary issue is that of adaptability if blackouts occur in India is compared with that
of some other country where electrical supply is far more reliable. The Indian electrical
system is rated as a fragile and an unreliable system. It lacks considerable self-healing and
progressive capabilities that tend to have a cascading effect on the overall health of the
electrical system. Issues facing India’s electrical system have been discussed rather
generously because they are pivotal to the growth of India’s power sector and the economy.
2.1 . Power Generation and Infrastructure
India’s booming economy has put acute pressure on the Indian power supply chain, which
is largely dependent on coal and gas for nearly 80% of its generation. The acute shortage of
coal at the generation sites is hampering the generation of electricity with many of the power
stations running at very low plant load factors (PLFs). While importing of gas from gas-rich
countries is considered uneconomical and not a feasible option, production and refining of
coal in the country is not keeping pace needed to match the demand at the stations. At times
the coal stock may touch the critical level leaving no options for the power stations but to run
at low PLFs.
Such a situation is critical to grid security and its uninterrupted and a continuous
operation. This state of the power generation may be attributed to the presence of a
monopolistic model of coal mining in the country. Coal India Limited has the sole authority
over most of the mines in the country and is not able to keep pace with the demand. This can
be attributed to reasons such as stringent policy regulations, non-availability of advanced
16
Jim Yeardley and Gardiner Harris, “Over Half a Billion Without Power in India as Grids Fail,” The New York
Times, July 31, 2012

15
technology at the mines, difficulties in obtaining clearances, such as environmental, and lack
of an internal organizational structure.
Most of the gas based power stations in the western part of the country are fuel starved
and there is an immense need to either increase the production of gas in the country or import
gas from other countries.
Figure 6: India’s Coal Production and Consumption
Source: Gregor.us India’s Coal Scenario, An Analysis, April 2010
2.2. Supply, Demand and Unofficial Connections
Power infrastructure in India cannot be considered capable of providing a dependable and
a reliable power supply that is taken for grantedlike those in the western countries. An
absence of connectivity results in some 300 million people having no access to electricity
because the grid does not connect to their regions.Although India ranks sixth in the world in
terms of overall electricity production and consumption, the huge population of 1.2 billion
means that per capita levels of electricity consumption remains low at just over 500 kWh per
person per year,as compared to more than 2,600 kWh inChina and nearly 12,000 kWh in the
United States17
.
To efficiently manage the power supply and thereby provide quality power to the
consumers is an uphill task considering the steady increase in the demand that offsets the
supply and demand equation. According to Indian government regulations, each consumer
has to declare the type of connections they require. Often this is not observed due to the lack
of knowledge and non-committal attitude of consumers to the requirements of the distribution
company. In addition, some consumers operating industrial loads may declare their
connections for residential purposes. This practice has a cascading effect that escalates to the
distribution companies that bear the losses.
17
Raul and Mueller, “India Power Bloackout: THe Shape of Things to Come? Market Oracle, August 20, 2012

16
Even when India boasts of a highly industrialized economy and emerging urban lifestyles,
the availability of an electrical connection still seems to be out of reach of many, most
particularly the residents of slums. This definitely does not mean that slums are looming
under dark; but that unofficial power tappings are common in such areas.
Figure 7: Indian Distribution system, Crying out for help. Source: blogs.worldwatch.org
2.3. Blackouts - Planned and Unplanned
The blackout of July, 2012 had its roots in Agra in the state of Uttar Pradesh where
transmission lines were carrying twice the capacity load. The tripping of Agra Gwalior line
resulted in a cascading effect with lines tripping one after the other. The result of the blackout
was a catastrophe and affected nearly 100 million people. Most of the populace of Northern
India had to face the scorching and sweating heat of July. Massive traffic jams of massive
formed in New Delhi as traffic lights stopped working. Hundreds of miners were trapped
underground. Water supply was heavily impacted. Some hospitals faced major difficulties in
the days following the blackout.
What makes India different from the western countries is the way blackouts are treated. In
India, the main issue is not whether or not there will be a blackout. People know that there
will be, often for several hours every day. They prepare for outages and take them head on.
The difference is between planned and unplanned blackouts. Planned outages are often
referred to as rolling blackouts and are common in many places across the country. A rolling
blackout also called load shedding and is an engineering technique employing an intentional
electrical shutdown where electricity delivery is stopped for non-overlapping periods of time.

17
Rolling blackouts are a normal daily event in many developing countries where electricity
generation capacity is underfunded or infrastructure is poorly managed. Where outages are
scheduled, people adjust their activities accordingly. However, unscheduled disruption is
tolerated, and has developed an entire industry of back-up power supply services
Figure 8: August 2012 Power Blackout in India
Source: Bruce Einhirn, et. al., “Modern India By Candlelight,” Bloomberg Businessweek July 31, 2012
2.4. Transmission and Distribution losses:
In India, a large portion (23%) of the electricity generated is lost while transferring power
to the consumers. This is known as T&D (Transmission and Distribution losses). Studies
carried out by various independent agencies including TERI estimate the losses to be as high
as 50 % in some states. Accurate estimation of losses is very important as it directly affects
the sales and the power purchase requirements and hence determines the electricity tariff of a
utility by the Regulatory Authority.
Electrical energy losses mainly occur in the process of transferring power to consumers
as technical as well as commercial losses. The officially declared transmission and
distribution losses in India have risen steadily from about 15% in 1966 – 1967 to about 23%
in 1998 – 1999.18
The continued rising trend in the losses is a matter of serious concern and
dedicated efforts are required to curtail them. According to a study by the Electric Power
Research Institute (EPRI) of the USA, the losses in various elements of the T&D system
usually are on the order as shown below.
18
India Electricity Statistics 2011,Minstry of Power

18
Figure 9: T&D Losses in the System
Source: Author, with data from T&D losses, An Independent Study, The Energy and Resource Institute
System Element
Power losses
Minimum (%)
Power losses
Maximum (%)
Step up Transformers and EHV
transmission system
05 1.0
Step down to sub transmission voltage
level 1.5 3.0
Step down to distribution voltage level 2.0 4.5
Distribution lines and Service
connections 3.0 7.0
Total losses 7.0 15.5

19
2.5. Environmental Ramifications of the Power Sector
In India, power shortages are not the only issue. Traditionally, resources for electricity
generation would be utilized by the simple theory of cheap is good. Although important,
there are certain other parameters that need to be taken into consideration, such as social,
environmental and technological benefits and consequences of the energy sources selection19
.
A figure showing the comparison of different energy sources for life cycle of carbon
emissions is shown below.
Figure 7: Comparison of Life- Cycle Emissions (Tons of Carbon Dioxide Equiv. Per Gig watt Hour)
Source::Paul, J. Meier, Life Cycle Assessment of Electricity Generation Systems and Applications for Climate
Change Policy Analysis, Fusion Technology Institute, University of Wisconsin 2002
It can be easily seen that generating electricity using Coal has the maximum global
warming potential followed by natural gas. In a developing country like India the economics
of producing electricity is of paramount concern while planning for the type of plant to be
installed and more so with the presumption that coal for electricity generation is available at a
regulated price. However, if the consequences of prolonged use of coal for producing
electricity on human health and environment cost as well as efforts required to improve or
alter the path of degradation, it seems the initial low cost of using coal seems a strategically
bad idea when compared to renewable resources for producing electricity.
19
Meier PJ, life cycle assessment of electricity generation systems and applications for climate change policy
analysis(2002)
1041
622
46 39 18 17 14 0
200
400
600
800
1000
1200
Coal NaturalGas
Biomass Solar PV Hydro Nuclear Wind

20
Taking into account the growing economy of India compared to other countries in the
west, switching to cleaner sources of energy is more of a multi-step mechanism rather than a
single step. There is an urgent need for transfer of technology and development of other
financial instruments from the developed world. India is 145th
in the world in the release of
1.25t CO 2 per annum20
.
20
World Energy Council (2010) , 2010 Survey of Energy Resources, London4

21
3. Prognosis and Smart Grid Introduction
India’s electric power framework, known as the grid, has served the country for a long
time is finally reaching it total capacity. Grids capabilities in the present developing socio-
economic scenario are not to be taken for granted. The current electric power grid was
developed over 100 years ago, when the sole purpose of the power system was to transfer
electricity from the generating stations to the consumer for lighting purposes. Primarily coal
was used to generate power and production plants were built for local communities.
With the advancement of technology and industry, the needs of the people grew,
requiring the generation plants to grow to expand and supply the increasing demand for
electricity. But, with the increasing reach of the electrical grid, optimization and control
could not be satisfied by merely increasing the number of generating sites.21
Today, the electrical power system delivers energy to agriculture, industry, commercial
and residential consumers, utilities struggle to keep up with the ever increasing demand for
electricity. Systematically, the hazards associated with relying on an overburdened grid grow
in size, scope and complexity with every passing day. The limited one-way interaction
makes it difficult for the grid to respond to the changing and increasing energy demands of
the 21st century. To its credit, the Ministry of Power’s Vision 2027 program focuses on
transforming and upgrading the Indian power infrastructure into a secure, adaptive,
sustainable and digitally enabled ecosystem that will provide reliable energy with the active
participation of all stakeholders.22
The following graphic illustrates the difference between
traditional power grid and a smart grid.
21
Rahul Tongia, “What the smart Grid Means and Doesn’t Mean for India,” IEEE Smart Grid, July, 2011 22
Virendra Kumar Sharmara, Electricity India, Vision 2027, 2004

22
Figure 8: Evolution of Traditional Grid to Smart Grid
Source: International Energy Agency, 2013
A smart grid makes the transformation from a traditional one way (generation to
consumer) grid to a highly connected and 2 way grid possible by applying the technologies
and various associated operating principles to the grid. More importantly, it enables the
industry’s best ideas for grid modernization to achieve their full potential.23
The smart grid provides two way flow by which electricity and information can be
exchanged between a utility and its customers. It is new network for communications, its
control, computers, automation and introduction of new technologies and tools to work
harmoniously, thus making the grid more efficient, more reliable, more secure and greener.
The smart grid enables newer generation technologies to be integrated, such as wind and
solar energy production. It will soon upgrade and replace the aging electrical infrastructure
and ensure optimized and green electricityproduction.
India’s power system needs are not necessarily the same as those in the advanced and
industrialized countries. The same also goes for the most important power system constraints.
Generally, not all smart grid technologies are equally relevant worldwide. In India, themost
useful technologies would be those that help constrain peak demand and peak load growth at
reasonable cost while cutting losses. As yet,there is not any internationally unified definition
of a smart grid.24
23
U.S. Department of Energy, The Smart Grid: An Introduction, 2008 24
European Regulators Group for Electricity and Gas, Position Paper on Smart Grids: An EREG Conclusions,
December 10, 2009

23
4. Key Drivers of India’s Smart Grid
India is at a preleminary stage of its smart grid deployments with many technologies,
such as advanced metering and remote sensing of renewable generation, still at a very crucial
juncture. Its deployment is being reviewed andtested at certain pilots sites around the country.
Such technologies are undergoing various trials and advanced testing before they could be
deployed around the country. The coherence of many factors would drive India’s adoption of
smart grids,such as reducing all technical and commercial losses to resolve the ongoing
supply/demand gap. India is upgrading its infrastructure to a more advanced electricity
supply solution that has sustainable, low carbon, high growth economic development
goals.Certain factors will drive the adoption of India’s smart grid. These are described in the
following pages.
4.1. Supply Shortfalls and Continuing Increases in Demand
Demand, especially the daytime peak demand of electricity, is continuously outpacing the
India’s power supply. With the rapid growth of the economy and a prosperous industrial
sector with more households buying more electrical appliances, there is a continuing
increase in the demand of electricity. Industries also require a consistently increasing power
supply to match the needs of their growth. Officially, India is falling short by around 12%
for energy demand with a peak energy demand shortfall of 16%.
Addressing the needs of the growing economy and satisfying the needs of a developing
society are the primary drivers for the adoption of smart grid technologies in India. With the
country’s high growth economy, the demand for electricity is forecasted to grow by about
10% per year as long as the gap between supply and demand is not closed.
Figure 9: Supply and Demand by Region – 2012
Source:Author, with data from Central energy Alliance,CEA AnnualReports,2012
Region Energy Peak
Requirement Availability Surplus/Deficit Requirement Availability Surplus/Deficit
MU MU MU % MW MW MW %
Northern 276,121 258,382 -17,739 -6.4 40248 37117 -3131 -7.8
Western 290,421 257,403 -33,018 -11.4 42,352 36,509 -5,843 -13.8
Southern 260,302 237,480 -22,822 8.8 37,599 32,188 -5,411 -14.4
Eastern 99,344 94,657 -4,687 -4.7 14707 13,999 -7,08 -4.8
N. Eastern 11011 9,964 -1,047 -9.5 1,920 1,782 -138 -7.2
24
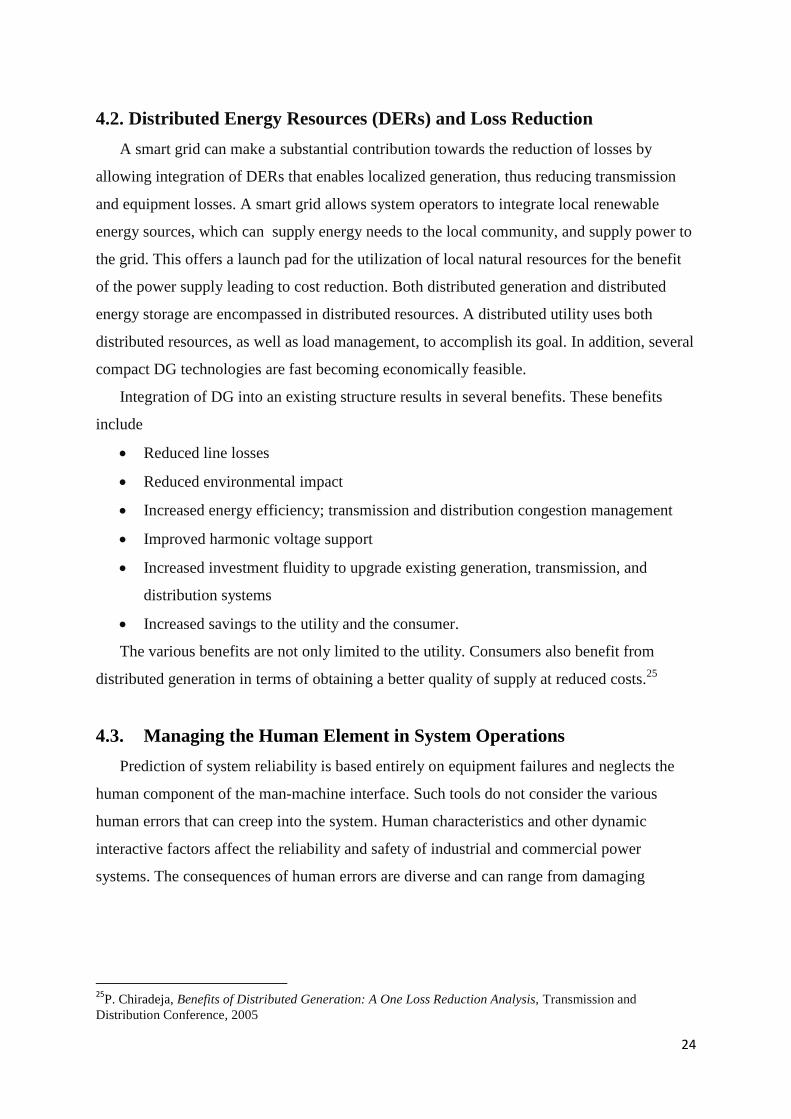
4.2. Distributed Energy Resources (DERs) and Loss Reduction
A smart grid can make a substantial contribution towards the reduction of losses by
allowing integration of DERs that enables localized generation, thus reducing transmission
and equipment losses. A smart grid allows system operators to integrate local renewable
energy sources, which can supply energy needs to the local community, and supply power to
the grid. This offers a launch pad for the utilization of local natural resources for the benefit
of the power supply leading to cost reduction. Both distributed generation and distributed
energy storage are encompassed in distributed resources. A distributed utility uses both
distributed resources, as well as load management, to accomplish its goal. In addition, several
compact DG technologies are fast becoming economically feasible.
Integration of DG into an existing structure results in several benefits. These benefits
include
Reduced line losses
Reduced environmental impact
Increased energy efficiency; transmission and distribution congestion management
Improved harmonic voltage support
Increased investment fluidity to upgrade existing generation, transmission, and
distribution systems
Increased savings to the utility and the consumer.
The various benefits are not only limited to the utility. Consumers also benefit from
distributed generation in terms of obtaining a better quality of supply at reduced costs.25
4.3. Managing the Human Element in System Operations
Prediction of system reliability is based entirely on equipment failures and neglects the
human component of the man-machine interface. Such tools do not consider the various
human errors that can creep into the system. Human characteristics and other dynamic
interactive factors affect the reliability and safety of industrial and commercial power
systems. The consequences of human errors are diverse and can range from damaging
25
P. Chiradeja, Benefits of Distributed Generation: A One Loss Reduction Analysis, Transmission and
Distribution Conference, 2005

25
equipment or property; causing injuries, sometimes fatal to workers; or disrupting scheduled
system operations, all of which have a significant cost to society.26
Indian contracts for outsourcing are relatively inexpensive; so, labor saving is not a prime
driver for the smart grids in India. Advanced metering infrastructure would definitely be
pivotal in reducing recording and other errors such as shade tree readings or even deliberate
errors that lead to significant losses. AMI can also bring about a better User Interface, where
the user can participate in an interactive way. This involvement may lead to a better
monitoring of energy usage, which can reduce costs and better monitor the peak time usage.
Figure 10: Advanced Metering Infrastructure
Source:Public Service Company of Oklahoma, How Advanced Digital Meters Work, 2012
26
D.O. Koval, “Human Element Factors Affecting Reliability and Safety,” IEEE Transactions on Industry
Applications, 1998

26
4.4 Peak Load Management
The smart grid is driven by need and has a different priority for each country, In western
countries; it is driven by labor cost, renewable energy and electric vehicles to reduce the
carbon dioxide footprint. For India, managing peak load is the key driver for smart grid
deployment. Energy cannot be stored in large scale and has to be increased to take care of
increased peak demand or the demand reduced significantly by load shedding.
In the west, supply is increased through peaker plants, which operate during time of high
electricity demand. These plants operate at a high cost, and are used a few hours each day and
usually the most expensive power option. If India follows the western model, the price of
electricity will rise by 35%, a very expensive proposition for a developing country like
India27
.
India’s supply and demand gap is wide enough to persist for many years. A smart grid
would allow more “perceptive” load control, directly or indirectly by controlling the
household demand, switching off the non-critical appliances to reduce the power usage to
prevent peak time deficit, thus preventing the outages and load shedding. This can be done by
either communicating to the consumer about the economic pricing incentives in a dynamic
manner or by having a real time protocol to allow utilities have a direct control over the
devices and setting less important tasks for a time when electricity is cheap and hence acting
as a buffer for fluctuations in the peak energy supply.
By providing incentives related to the operation of appliances, the consumer can control
the amount of electricity they are using in a better way. Such measures can, to an important
extent, mitigate the supply and demand gap. For example, by introducing the right price
signals and smart appliances/devices, a smarter grid can reduce the need for infrastructure
while keeping electricity affordable and reliable. During peak demand periods, the intense
stress on the power system threatens its feasibility and reliability and raises the possibility of
brownouts and blackouts.28
27
Smart Grid for India, Tackling Smart GridChallenges under India Context, July 28, 2011 28
The U.S. Department of Energy, The Smart Grid: An Introduction, 2008

27
Figure 11:Smart Grids Provide Two-way Communication
Source: Smart Grid News, Communication Protocols of Smart Grids, 2012

28
4.5. Renewable Energy
Indian renewable energy industry growth has been increasing at a steep rate in the last
two decades. Even though a significant portion of the contribution of RES to the power
generated is from the hydro power, with almost 20 % still being obtained from this sector, it
has not progressed much on utilizing other renewable sources of energy. Recently, the Indian
power sector has broadened into other renewable energy sources. Wind power is the most
prominent type of renewable energy so far.
Since 2010, significant activities in a few other renewable energy sectors, such as solar,
have also been observed. With the inception of the National Solar Mission in 2010 and the
successful operation of the initial stages of this project, the Indian government has shown its
eagerness to harness the significant potential that solar energy presents for the country. India
can also utilize other renewable energy sources, such as small hydro and biomass plants and
there is a huge potential for it.
Some alternative energies have shown that show little activity recently, like wave, tidal
and geothermal energy, yet have the potential for significant growth in future. As many of the
renewable energy sectors are in the early stages of development, there is significant need and
eagerness from Indian businesses for technology transfer from companies and countries on
the cutting edge of clean technology.
To successfully integrate clean power from renewable sources, such as wind and solar
energy, utilities will need a smart grid to manage problems caused by intermittency (the sun
and wind only produce during certain times of the day) and the power distribution system.
Driven by the need to protect the environment and the desire to tap in all the possible sources
of power, this move would also be a primary driver for the smart grid.29
29
Energy Alternative India, Indian Renewable Energy Guide: Highlights of Indian Renewable Energy Industry
for Foreign Investors, November 30,2001

29
4.6. Technological Leapfrogging
A chance to leapfrog into a new future of electricity is perhaps the most intriguing driver
for India to address it regulations and policies for making the power grid smart. The smart in
a smart grid is information and communication technology, -an area of unique capability in
India. Smart grid deployment involves not only addressing domestic energy challenges; but,
also executing its policy to become a superpower as it involves technology standardization.
India has dedicated research centres and a Smart Grid Task Force working on the deployment
of smart grids in some pilot cities, and then upgrading to a pan-national scale. Technological
standardization is also seen as a critical step in moving up the value chain and is playing a
major role in global technology markets.30
30
Hans de Keulenere,”Smart Grid an Introduction,” Scribd.com, 2008
30
5. Smart Grid Philosophy
We are at the crossroads of a great transformation in the way electricity was perceived
traditionally. A revolutionary makeover from a central, utility controlled network to a grid
that is less central and more interactive with the consumers is coming. The upgrade to a smart
grid promises to widely affect the industry’s entire business model that consisted of vertically
integrated entities and its relationship with all stakeholders in the service chain affecting and
involving utilities: Energy service providers regulators, technology and control dealers, and
users will all be impacted.
A smart grid makes this upgrade possible by bringing together the various concepts,
information technology and other technologies in a common spectrum enabling an
interconnection between the utility and the electric grid. Simply put, a smart grid is the
integration of information and communication technology into the electric transmission and
distribution networks delivering electricity to consumers using a two way digital technology
to enable a more efficient management of consumers’ use of electricity. The technology
makes more efficient use of the grid to identify and correct supply and demand imbalances
instantaneously and detect faults in a self-healing process that improves service quality,
enhances reliability, and reduces costs.31
31
U.S. AID, Smart Grid Vision for India’s Power Sector, 2010
31
5. Smart Grid Technology
With the restructuring and broadening of power sector infrastructure;introduction of new
regulations; open sourcing; and increasing the share of renewable energy in energy
transactions, it is very important to design and operate the Indian grid as a centralized
national smart grid. The combined total capacity of the centralized grid is estimated to be in
the range of 300 GW, consisting of about 40 –50 GW of renewable energy in the next few
years. Integrating renewable energy, with wind as the main energy source would lead to an
increase in the complexity of monitoring and control of such a large grid, because wind is
intermittent rather than constant. Application of advanced synchrophasor measurement
technology, rather than the traditional electric meter, may to some extent provide the needed
interface for the wide area monitoring of such a widespread grid.
The information and communication technology in the Smart Grids enables it to make
envisioned benefits a reality. These technologies encompass a wide range of operations, such
as detecting and identifying faults and a quick response to power outages; providing
consumers with near real-time information on the amount and cost of the power they use;
improving the security of the system; and linking all elements of the grid to enable better
decision making on resource use. With continual up-gradation and modifications these
technologies will produce more and better quality data that will give the utilities more
flexibility and new opportunities to improve their analysis in areas, such as customer load
patterns and tariffs, and thus offer better services to their customers.
Several of the initiatives that have already been introduced into the system include
Supervisory Control and Data Acquisition (SCADA), Distribution Management System
(DMS), Distribution Automation System (DA), Energy management System (EMS),
Automated Meter Reading (AMR), Outage Management System (OMS), Enterprise Resource
Planning (ERP) and Geographical Information System (GIS). Installing the latest technology
and systems in the power system promises a decrease in loss levels and a subsequent increase
in the reliability of the network.
Successful implementation of the smart grid would also require introduction of a Wide
Area Measurement System (WAMS) based technology for achieving grid performance.
Installation of Phasor Measurement Units (PMU’s) at the utilities is a prerequisite for
WAMS.

32
The existing interface involving SCADA/EMS based grid operation has the potential to
provide the steady state view of the power grid.32
Dynamic real time measurements and
visualization of the power infrastructure, which are useful for an optimal working of the grid
as well as introducing corrective measure, can be realized only with the introduction of PMU
based technology.
Smart grid deployment is a journey rather than a onetime event. Taking a cue from this
universally accepted paradigm, India has to observe grass roots revolutionary changes in its
power infrastructure relating to this requirement. What a smart grid can deliver is marginally
driven by specific need. The western countries care more about labor costs, renewable and
electric vehicles (EV). In India, however, load management, especially peak load, is a major
and primary driver. Therefore, more investments are being made related to superior load
management.33
Figure 12: Various Layers of Smart Grid Infra-Structure Source: Data Center Dynamics, Multilayer Infrastructure of Smart Grids
32
Central Electricity Authority, National Electricity Plan Volume III, Transmission, 2007 33
Business Standard, Rahul Tongia: A Smart Solution to Power Shortage, July 5, 2011

33
6.1 Network Operations
The main difference between the traditional power infrastructure and the smart grid is in
the distribution area at the customer/network interfaces. However, in the areas of generation
and transmission, the role the system operators play becomes quite complicated and critical
as it must ensure an efficient, reliable system, as well as the integration of other sources of
energy. An ancillary support system will be required with sophisticated and technologically
advanced energy management systems to oversee and manage all available energy resources
and transmission parameters in every part of the system under a broad variety of operating
conditions and possible future scenarios.
Figure 13: Smart Grid Management
Source:Jason Taylor, “Bulk System Reliability Assessment and the Smart Grid,” Electric Energy T&D
Magazine, January/February. 2013
6.2 Automated Metering Infra-structure Through Smart Meters
Smart metering will be a very important focus area for distibuting utilties. The main
demand driver for this upgrade is the energy accounting backbone created under the
Restructured Accelerated Power Development and Reforms Program (RAPDRP) By
introducing a smart grid infra-structure, the industry can expect a rise in the demand for
metering technologies, such as Automated Meter Reading (AMR) and prepaid metering.
Smart meters will be installed at the customers’ premises to enable a bi-directional
communication between the meters and the uility meter data management system. This two-
way communication will enable the utility company to measurethe demand profile of the
customers in near real time. The real time data also allows the customers to monitor and
control their consumption. Implementation of the tariff of day (TOD) metering encourages
customers to use energy wisely.Smart metering also enables the remote connect and/or
disconnect of unauthorized customers, thus introducing a transparent mechanism and ultimate
control.
34
A Meter Data Management System (MDMS) is required to interface the SAP-ISU
billing system. This system obtains the meter data from the smart meters and is used for
various purposes like billing, planning and load forecasting.Implementation of AMI in India
presents a few challenges :
Smart meters are a relatively new concept in the Indian infrastructure and there are a
few technical challenges with respect to their customization for local conditions, like
security protocals and, at the same time, there are no standards yet formulated for
smart meters.
Suppliers are not yet prepared to bring smart meters in the Indian market as the
technical regulations are not yet coordinated with the utilities and the suppliers and
also because of a lack of skilled personnel.
Worldwide, such projects have been implemented using GPRS and PLC. The PLC
implementation requires a very high quality of power cable framework, which is a
relatively new concept for the Indian conditions. GPRS requires enhanced
provisioning and a superior service quality from the service providers.
AMI facilitates the collection of data that is critical for utility planning and
implementation. Such data also improve the inputs to the retail tariff structure;help with
regulatory compliance; and help customers better understand their consumption and plan
their usage accordingly.34
.
6.3 Home Area Network
Even though the home area network (HAN) is not a primary driver for implementing the
smart grid in India, it provides a definite edge to the idea of complete overhaul of the
traditional power system to a grid of the future. A home area network provides the platform
for smart devices in a home to communicate directly with the grid and enables the consumers
to manage their electricity usage by measuring a home’s electricity consumption more
frequently through a smart meter. With home area networks, utilities can provide their
customers with much better information to manage their electricity bills. The HAN connects
thermostats, refrigerators and other electrical devices to an energy management system.
Smart appliances and devices will adjust their run schedule to reduce electricity demand on
the grid at critical times and lower consumer’s energy bills.35
34
USAID, The Smart Gird Vision for India’s Power Structure, March, 2010 35
Navigant Research, Home Area Networks, 2013

35
6.3.1. Wiring
The basic standard for wiring is the Ethernet. Most of the homes in India lack Ethernet
running in their structures. The cost and effort of retrofitting a home or a building with new
wires is appalling. Speed, reliability and security are often the reasons cited for installing new
wires. The demands for most HAN smart grid applications are between 10kbps and 500 kbps,
thus speed is not seen as a working driver for installing new wires; but, reliability and
security are plausible reasons.
Figure 14: Home Area Network Visualization
Source:Don Brown, “Tech View: Laying the Groundwork for the Coming Smart Grid,”AT&T Home Area
Networks, February 16, 2010
6.3.2. IEEE 802.3 Ethernet
IEEE 802.3, or Ethernet as it is more commonly known, is used widely for establishing
local networks in offices and homes. Systems communicating over Ethernet divide a stream
of data into shorter pieces called frames. Each frame contains source and destination address
and error checking data so that damaged data can be detected and re-transmitted. Ethernet
provides service up to and including the data link layer, which handles data transmission and
error correction.36
36
Robert Metcalfe, The History of Ethernet, NetEvents.tv, 2006.

36
6.3.3. Power Line Communication (HomePlug)
HomePlug GREEN PHY (GP) is a low power, robust data communications technology
that provides data rates of 4-10 Mbps over a building’s existing electrical wiring. To define
the media access control (MAC) and physical layer (PHY) for power line communications in
Home Area Networks (HAN) the GP specification is used and has been recently adopted as a
profile of the IEEE standard 1901 for broadband over power line networks.
6.4. Fibre Optic-based Communication
Reliable voice and data communication is a critical aspect of smart grid deployment. The
need for a capable communication system has been substantiated with the introduction of
dedicated protection schemes, wide area measurement technology, SCADA system and
remote operation. Obtaining real time data of various utilities is a prerequisite for the
successful installation and operation of a smart grid. At present, three basic modes of
communication are used in power system operation:
PLCC
Microwave
Fibre optic
PLCC is an integral part of power systems and is used for protection of the power system
and providing speech communication in some instances. All of the requirements needed for a
capable communication system are met by Optical Fibre Communication (OFC).
6.5. FSAS for Integration of Renewable Generation
Integration of renewable energy in the grid is one of the most important areas for
infrastructure upgrades. The installed generation capacity of renewable generators is expected
to grow rapidly in the near future. India has set ambitious plans to achieve high generation
targets in the next ten years. Considering the high variability and unpredictability of
generation from renewable energy sources, the power generated can be safely absorbed in the
grid if the frequency in the grid is maintained in an appropriate range.
Frequency Support Ancillary Service (FSAS) can be used to complement the daily
changes in the renewable generation. In the future, based on the renewable forecast for the
next day, a dispatch schedule for FSAS can be prepared such that the variation in the
renewable energy generation can be absorbed easily. Thus, FSAS can be used as mechanism
to facilitate renewable energy integration by reducing the impact of variable generation.

37
Taking into account the restrained distress of global warming, the importance of
distributed generation (DG) from cleaner sources, such as wind and solar, is critical. The
Ministry of New and Renewable Energy Sources has proposed that to integrate these
renewable energy sources at grid operator level will require a superior energy management
system and is to be converged at the grid operator level. The smart grids superior capability
of introducing new sources of energy to the grid clearly signifies that more DG can be
integrated into the network. Solar and wind energy are crucial and primary factors of a
cleaner and greener energy future.37
.
37
Stanford University, Renewable energy and Smart Grids: A Case Study, 2008

38
7. India’s Renewable Energy Scenario
7.1. Integration of Renewable Energy as a Primary Driver
Every aspect of India’s energy resource capacity is being tested by the significant and
sustained economic growth as well as by the country’s ambitions to of becoming a super
power. However, the ubiquitous supply and demand gap requires the country’s policy makers
to increase energy supplies.38
Various energy equations have been analysed in the study, after
which the need for integration of renewable energy into available energy sources became
evident. Existing energy resources include:
Oil: Total oil imports from the Gulf and the Pacific account to nearly 80% of the total
oil transactions in the country.39
.Serious issues with energy security are anticipated
with the threat of further increase in the cost per barrel of oil. Moreover, political
instability poses a constant shadow on the future of oil imports to the country.
Coal: National coal companies are failing to meet the coal demanded by the robust
Indian economy. Imported coal, which is of better quality and low soot and ash
content and hence better efficiency, is preferred over the local extract. While
dependence on imported coal is on the rise, supply from the local quarries is slowing
decreasing due to production and analytical constraints.40
Gas: Domestic gas resources are limited. Moreover, regassified-liquid natural gas is
costly and not a feasible option for power generation. A significant augmentation of
gas reserves and production in the recent years has played a part in mitigating the
power needs of the country to a small extent.
Hydel (Hydro-power Electricity):
India is rich in hydel potential; but, harnessing its hydel potential to meet the
requirements is a challenging task. Hydel power projects play a huge part in altering
river ecosystems and disturbing the environment and are being challenged by the
environmentalists and local populations. Moreover, land acquisition and obtaining
clearances from the authorities are other issues impeding the immediate
commissioning of new hydel power projects.41
38
Ernst & Young,Renewable Energy Country Attractiveness Indices, August 2012, Issue 34 39
Ministry of Petroleum Government of India, Annual Report on Petroleum Transactions, 2011 40
Ministry of Coal, Government of India 2012 41
Hydel Power Projects in India, A Report, 2013
39
Robust economic growth, urbanization, prospering industrial areas, and the rise in per
capita consumption are the key factors resulting in a substantial increase in the demand for
electricity in India. Anticipated energy and peaking shortages in the country are estimated to
be 10.3% and 12.9% respectively in 2011 and 2012.42
Energy access is going to remain the
biggest challenge in the foreseeable future.
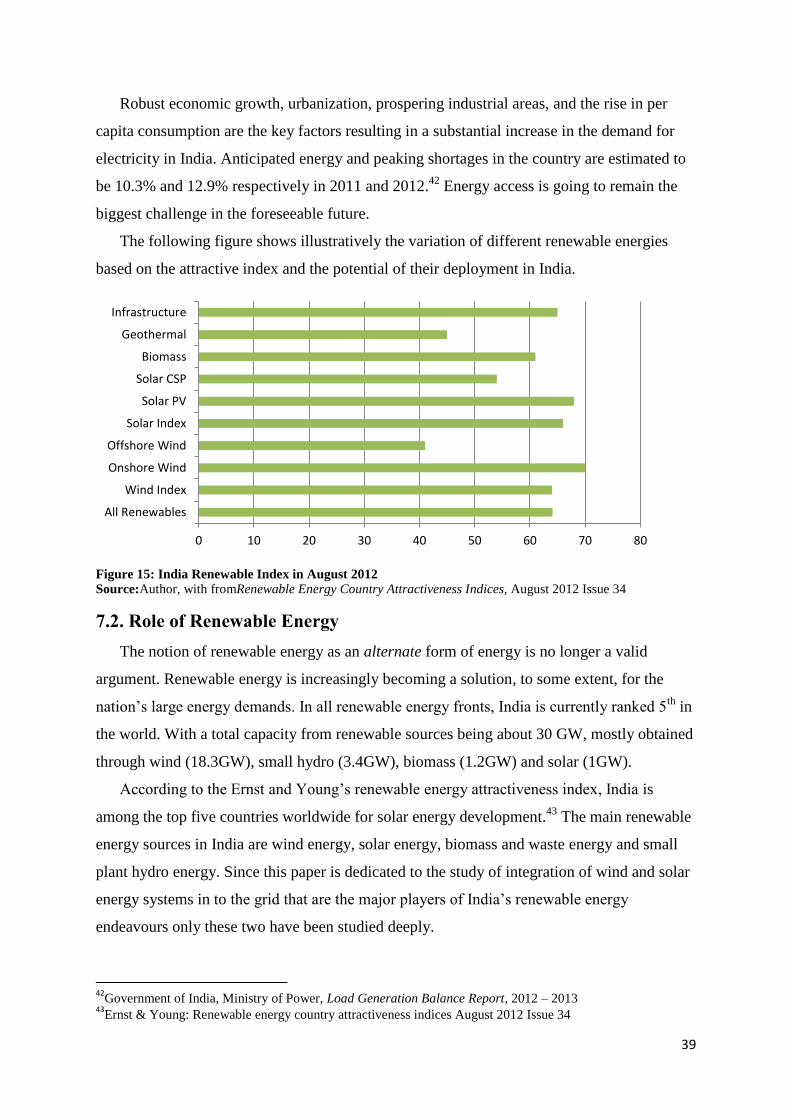
The following figure shows illustratively the variation of different renewable energies
based on the attractive index and the potential of their deployment in India.
Figure 15: India Renewable Index in August 2012
Source:Author, with fromRenewable Energy Country Attractiveness Indices, August 2012 Issue 34
7.2. Role of Renewable Energy
The notion of renewable energy as an alternate form of energy is no longer a valid
argument. Renewable energy is increasingly becoming a solution, to some extent, for the
nation’s large energy demands. In all renewable energy fronts, India is currently ranked 5th
in
the world. With a total capacity from renewable sources being about 30 GW, mostly obtained
through wind (18.3GW), small hydro (3.4GW), biomass (1.2GW) and solar (1GW).
According to the Ernst and Young’s renewable energy attractiveness index, India is
among the top five countries worldwide for solar energy development.43
The main renewable
energy sources in India are wind energy, solar energy, biomass and waste energy and small
plant hydro energy. Since this paper is dedicated to the study of integration of wind and solar
energy systems in to the grid that are the major players of India’s renewable energy
endeavours only these two have been studied deeply.
42
Government of India, Ministry of Power, Load Generation Balance Report, 2012 – 2013 43
Ernst & Young: Renewable energy country attractiveness indices August 2012 Issue 34
0 10 20 30 40 50 60 70 80
All Renewables
Wind Index
Onshore Wind
Offshore Wind
Solar Index
Solar PV
Solar CSP
Biomass
Geothermal
Infrastructure
40
7.3 Wind Energy in India
The wind power programin India was initiated in 1983-84 with the goal of speeding up
the commercialization of wind power in the country and it has progressed rapidly in the last
few years. The relatively short period required for the installation of wind turbines and the
constant advancements made in the wind turbine technology leading to higher reliability and
performance of the turbines has made wind power the preferred choice for energy capacity
additions in the country. The latest estimates indicate the total potential of wind energy in the
country to be at 45,000 MW.44
The wind sector of the country has observed significant
investments, catalysed by the highly indicative wind potential;the availability of wind farm
equipment at subsidized rates; and supportive government policies. Presently, India, with
15,700 MW of wind energy, is at the fifth position with China (44,733 MW), the US (40,180
MW), Germany (27,215 MW) and Spain (20,676 MW) leading in development.45
Wind
power accounts for about 8% of India’s total installed power capacity.
Historically, wind energy has always met and many times exceeded the targets such as
those set in the 10th
(2002-2007) and the 11th
Five Year Plan (2007-2012) periods. During the
10th
plan period, the target set was at 1,500 MW and actual installations were 5,427 MW.
Similarly, in the 11th
plan, the revised target was for 9,000 MW and the actual installations
reached 10,260 MW.46
In 2011, the Centre for Wind Energy Technology, a state run organization, assessed
India’s wind power potential as 102,778 MW at 80 meter height at 2% land availability. This
estimate was significantly higher than earlier estimates of approximate 49,130 MW at 50
metres height, also at 2% land availability. Different research organizations use different
models for mapping wind resources. The Lawrence Berkeley National Laboratory, in a study
assuming a turbine density of 9 MW/square kilometers, concluded the total wind potential in
India, with a minimum capacity factor of 20%, ranges from 2,006 GW at 8 meter hub height
to 3121 GW at 120 meter hub height.47
44
S. P. Sukhatme, “Meeting India’s Future Needs of Electricity Through Renewable Energy Sources, Current
Science, September, 2011. 45
Ministry of New and Renewable Energy, India’s Renewable Energy Sector -Potential and Investment
Opportunities, Government of India, 2010 46
Ministry of New and Renewable Energy, A Report on the Wind Potential in India, Government of India,
May, 2012. 47
Julie Chao, Berkeley Lab Shows Significantly Higher Potential for Wind Energy in India Than Previously
Estimated, Lawrence Berkeley National Laboratory, March, 2012

41
Figure 16: Wind Power Installment World Ranking (est. August 2012(
Source: Author, with from Renewable Energy Country Attractiveness Indices, August 2012 Issue 34
7.4 State wide Wind Energy Installations
The states of Karnataka, Tamil Nadu, Maharashtra and Gujarat have always taken the
lead in terms of total wind installations. Meanwhile the states of Rajasthan, Madhya Pradesh
and Kerala are rapidly catching up. By the end of the 11th
Plan Period in March, 2012, the
total installed capacity had reached a total of 17,351 MW.48
More than 95% of the nation’s
wind energy is concentrated in just five states in southern and western states of India – Tamil
Nadu, Andhra Pradesh, Karnataka, Maharashtra and Gujarat.49
Rajasthan is another emerging
state with strong prospects in wind energy development.
7.5 Solar Energy in India
The Indian subcontinent is blessed with a rich potential of solar energy resource. The
average intensity of solar radiation in India is on the order of 20 MW/square kilometre. India
has a geographical area of 3.287 million square km, and the total solar energy potential may
be as high as 657.4 million MW50
though only 12.5 % of the land area which is about 0.413
million square kilometers can be installed with solar energy platforms because of logistical
and theoretical reasons. Even if 10% of the area is used, the available solar energy can
amount to nearly 8 million MW per year, which is purely for the basis of analysis because the
conversion efficiency of solar energy is low and the energy actually available will be lower
than the estimated values.
48
International Energy Agency, India Wind Energy Report, November, 2012 49
Ishan Purohit and Pallav Purohit, “Wind energy in India: Status and future prospects,” Journal of Renewable
and Sustainable Energy, 2009 50
India Emergy Portal, Solar Thermal, The Energy and Resources Institute (TERI), 2012
2001 2002 2003 2004 2005
51 65 64
140
280
Wind Power Installment in MW

42
Until recently, solar energy has remained dormant in the Indian energy scenario. The total
on-grid capacity has reached 941.48 MW while as the total potential of solar power is 50,000
MW.51
India’s solar energy development is increasing based on the growing supply and
demand- gap; the continual increase in non-renewable fuel prices; the National Solar
Mission; various local initiatives; renewable energy allocations including the solar energy
allocation, as well as advancements in cheap and highly practical technologies. India is on
track to become a solar energy hub based on its vast solar potential.
The Indian gross domestic product is increasing at the rate of 8% and, with this, the
country’s supply and demand gap is only widening, Solar energy, which has not yet been
tapped anywhere near its optimal potential in the country, actually leads the list of possible
renewable sources in the country followed by wind energy and can definitely contribute to
and assist the growing Indian economy by reducing the supply demand gap.
The status of India’ solar energy industry may be summarized so follows:
Most parts of the country, consisting of the central and the western regions, have 300
– 330 sunny days in a year. This has the potential to generation 5000 trillion kWh per
year, which is higher than India’s total energy consumption in a year.
The average extent of solar radiation stands at a prosperous 4-7 kWh per square meter
per day.
Nearly 66 MW of average capacity is already installed in various capacities and
applications consisting of nearly a million industrial photovoltaic systems of which
solar lanterns, home lighting, street lighting systems and solar energy-based water
pumps lead the list.
The Indian Ministry overseeing the solar program has estimated a potential of nearly
20 MW/sq km.
An additional 500 MWs have been proposed by the ministry during the first phase of
the proposed Jawaharlal Nehru Solar Mission due to the solar thermal potential of the
country.
Establishment of research and development centres to come up with cost effective and
efficient conversion technologies has already been initiated in the form of the Solar
Energy Centre, which is dedicated to bringing India’s solar mission up to the level of
the European and the United States Solar Mission.
51
Gyan Research and Analytics, The Potential for Renewable Energy in India, 2012

43
7.6. Solar Technologies
At the end of June 2010, India had an installed solar power capacity of 15.2 MW, which
was based entirely on solar technologies. Off grid applications consisted of nearly 20% of the
total capacity being used.52
India had set a target of achieving 500 MW of grid connected
solar power in the Phase 1 of JNNSM. With Phase 1 in the final stage, large scale PV projects
have been targeted in Phase 2.53
Many projects are being commissioned under state programs
such as in Gujarat, Punjab, West Bengal, Rajasthan and Karnataka, many of these are running
under the aegis of the JNNSM. The domestic manufacturing industry is observing a growing
trend driven by financial incentives and the creation of special economic zones. India’s solar
market holds a net value of nearly INR 3,500 billion (USD 70 billion). As of June 2010,
India’s grid connected solar power stood at a marginal 12.28 MW or 0.7% of the total
renewable capacity.54
Figure 17: Indian Solar PV Growth in MW
Source:Jaideep Malaviya, “India on a Roll to Become a Solar Energy Super Power,” Energy Portal, December,
2012
52 Ministry of New and Renewable Energy, Strategic Plan for New and Renewable Energy Sector, November,
2011 53
Ministry of New and Renewable Energy, Jawaharlal Nehru National Solar Mission, Towards Building a
Solar India 54
Manoj K.Solanki, et. al., “Current Indian Perspective for Unconventional Energy Resources and its
Exploration,” International Journal of Engineering Research & Technology, August, 2012

44
The National Plan for climate change (June 2008) identified the development of solar
technological area in India as a national mission and consequently the JNNSM was launched
in January 2010. JNNSM is one of the many missions currently underway in India. The main
aim of this mission is to facilitate the installation of 22,000 MW of on- and off-grid solar
power, using both photovoltaic and concentrated solar power technologies by 2022.Vidyut
Vyapar Nigam Ltd (NVVN), a power trading arm of the National Thermal Power
Corporation (NTPC), has been designated to bring about a smooth execution of the first
phase of this mission.55
Addressing the shortcomings of the prior schemes through revised and attractive feed-in-
tariff and a single window application process for the quick commissioning of new plants and
RPOs are the main aims of the JNNSM. The CERC is responsible for introducing tariff
revisions every year. Under JNNSM, the NVVN purchases expensive solar power from
developers, bundles it with much cheaper power generated from coal and then sells the
product to various utilities at a marketable tariff.
7.7. Solar Thermal
Solar thermal power systems, also known as concentrating solar power systems use
concentrated solar radiation as a very high temperature energy source to produce electricity
using the conventional heat route. Solar thermal technology is appropriate for applications
with direct, high intensity solar radiation. Much advanced research is already underway in
India to upgrade and develop several types of solar water heating technologies. Forced
circulation flat plate collectors and thermo-siphons are very popular. Even though they have
already been installed in large commercial establishments, they are now being used in the
domestic sector as well. Selectively coated and black paint absorbers on flat plate collectors
are being manufactured and marketed in the country.
The complete blueprint for the flat plate collectors consisting of the black chrome
selective coating for the absorber has been developed in India. Solar thermal power can
occupy a unique position in the India’s energy arsenal. It’s potential to absorb hybrid
technologies and, coupled with storage, could pave way for unlocking the base load power,56
thereby introducing a platform for large scale integration of renewable energy.
55
Ministry of New and Renewable Energy, Jawaharlal Nehru National Solar Mission, Towards Building a
Solar India 56
Council on Energy, Environment and Water Natural Resources Defense Council, Concentrated Solar
Power Heating up India’s Solar Thermal Market under the National Solar Mission, September 2012
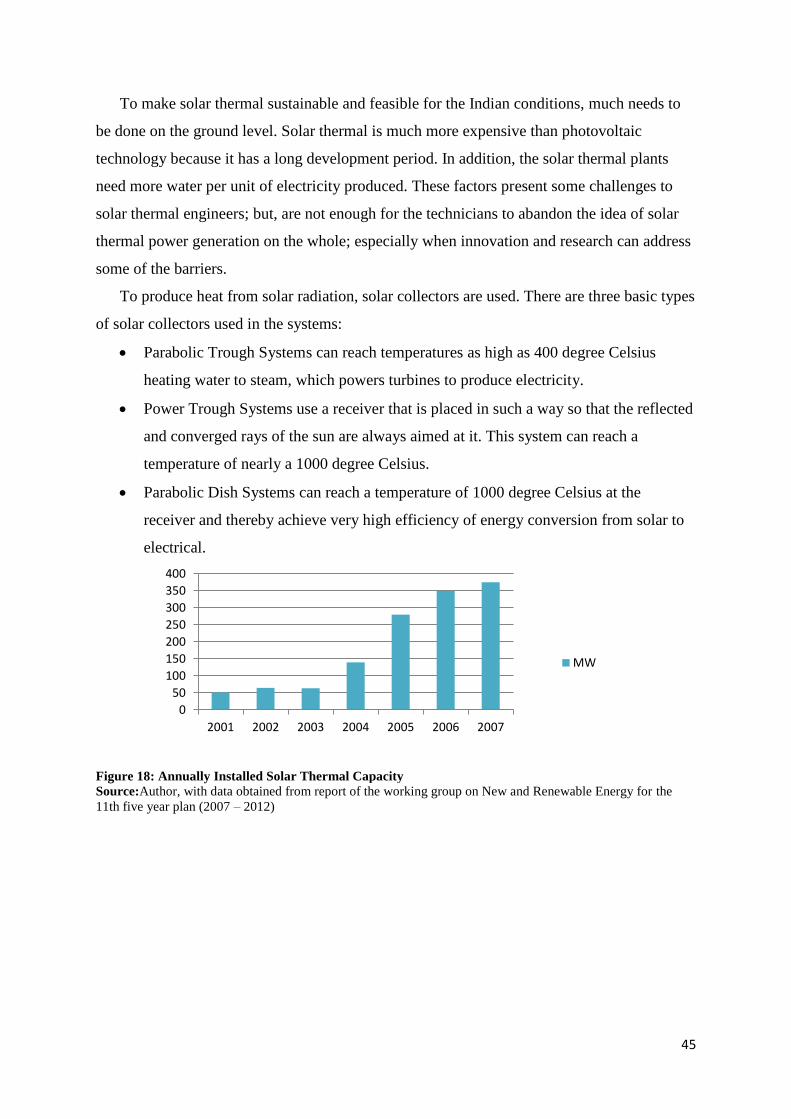
45
To make solar thermal sustainable and feasible for the Indian conditions, much needs to
be done on the ground level. Solar thermal is much more expensive than photovoltaic
technology because it has a long development period. In addition, the solar thermal plants
need more water per unit of electricity produced. These factors present some challenges to
solar thermal engineers; but, are not enough for the technicians to abandon the idea of solar
thermal power generation on the whole; especially when innovation and research can address
some of the barriers.
To produce heat from solar radiation, solar collectors are used. There are three basic types
of solar collectors used in the systems:
Parabolic Trough Systems can reach temperatures as high as 400 degree Celsius
heating water to steam, which powers turbines to produce electricity.
Power Trough Systems use a receiver that is placed in such a way so that the reflected
and converged rays of the sun are always aimed at it. This system can reach a
temperature of nearly a 1000 degree Celsius.
Parabolic Dish Systems can reach a temperature of 1000 degree Celsius at the
receiver and thereby achieve very high efficiency of energy conversion from solar to
electrical.
Figure 18: Annually Installed Solar Thermal Capacity
Source:Author, with data obtained from report of the working group on New and Renewable Energy for the
11th five year plan (2007 – 2012)
0
50
100
150
200
250
300
350
400
2001 2002 2003 2004 2005 2006 2007
MW

46
8. Large-scale Integration of Wind and Solar Energy in the Grid
Integrating wind and solar energy into the grid will allow the grid to be far more reliable,
independent, and efficient and self-remedial in case of power system breakdowns and
blackouts; allowing clusters of local communities to receive power from the local renewable
generation and lead to a grid transition from a non-self-healing infrastructure to a detection
and control infrastructure. To a large extent, this integration is directed towards managing
peak loads; offering new services to meet user needs at an individual level; and improving
asset use. It involves a systems approach to develop and demonstrate the technical,
regulatory, economic and other barriers in the use of renewable energy and distributed
generation.
The major focus for the integration of renewable energy is on wind and solar in India and
while some development is already underway, wind and solar energy both suffer from a
technical issue of intermittency; a variability that cannot be controlled; unpredictability to
some extent; and location dependency. Grid operators and generation owners face three
distinct issues in integrating wind and solar energy into the grid:
Variability of resources: Power plant operators cannot control the wind and solar
output because wind speeds and solar intensity vary dramatically, affecting power
output. To balance the supply and demand on an instantaneous basis, there needs to be
additional energy input as well as peripheral ancillary services, such as voltage and
frequency regulation.
Unpredictability: Availability of wind and solar energy is unpredictable to some
extent. Electricity is only produced when the wind is blowing and the presence of
sunlight is crucial for the working of the PV systems. Systems that use advanced
forecasting technologies can manage unpredictability. Availability of reserves that
stand ready to supply any power when the renewable sources provide less power than
predicted and the presence of dispatchable load to soak up excess power in the case of
renewable generation producing more power than had been predicted are parts of
technological systems.

47
Figure 19: Variability of Wind Pictograph. Source: Variability of Wind, Exit Opinion Polls India Blog
Location Dependence: Quality wind and solar resources that are most feasible for
renewable energy generation are unfortunately based only in specific locations and
unlike various fossil fuels, such as coal, oil, gas or uranium, transporting them to a
generation plant that is grid optimal cannot be done. Generation is co-located with the
resource and often the places where the power is ultimately used is far from these
locations. Connecting wind and solar energy resources to the grid involves the use of
new transmission capacity. Moreover transmission costs are especially high for
offshore wind resources, often utilizing technology not used in land based
transmission lines.
Since wind and sunlight are a universal phenomenon, spatially and temporally outside the
control of human beings, integration of wind and solar energy into the grid consists of
managing certain other controllable features affecting other parts of the grid including the
generation by conventional fuels. Theoretically, these operations occur along a wide range of
time scales, from seconds to years, and may include:
New power evacuation strategies for additive generation resources,
Typical management of load, frequency and voltage control using ancillary
services,
Continuous ramping up of the transmission capacity,
Use of energy storage technologies and processes that bring grid operator dispatch
planning in a common sphere with weather monitoring and forecasting.

48
Figure 20: Wind and Solar Resources in India
Source: Agneya Carbon Ventures, Renewable Energy in India: Past, Present and Future, November, 2004
8.1. Non Controllable Variability:
In the context of renewable energy resources, variability refers to a non-steady output. It
is different from unpredictability, in the sense that even if operators are able to predict wind
and solar output perfectly, the output will still tend to be variable and pose challenges to the
operator. Grid operators need to deal with fluctuations in voltage and frequency on a second
to minute scale that, if left unchecked, can do significant damage to the system, including the
equipment attached with it. A possible method of doing that may be to inject power (active or
reactive) into the grid having a technical characteristic of balancing the actual to the
forecasted power generation which is pivotal to maintaining a steady voltage as well as
frequency on the grid. There may be a number of names and descriptions of such ancillary
services. An overview of the various services observed consists of:
Frequency regulation: Mainly done by automatic generation control (AGC) signals
to renewable generation and occurs on a seconds-to-minutes basis.
Spinning reserves: When a generator goes down or deactivates abruptly in the
system, the spinning reserves come into action providing power within 10 minutes.
Non-spinning reserves: Even though observing the same function as the spinning
reserves, the non-spinning reserves have a much slower response time.

49
Voltage support: These generators are used for reactive voltage in order to increase
the voltage whenever needed.
Black-start capacity: In case of a cascading black-out, these generators are available
to re-start the power system.
In addition, grid operators also need to track the load deviations over the course of the
dayand ensure that supply always matches the demand. The load following function becomes
more important at peak load times of the day when electricity demand increases significantly.
On the flip-side, grid operators have always maintained the voltage and the frequency,
following load shifts and maintaining reserves since the installation of the electrical grid. This
is attributed to the varying nature of loads. Moreover, conventional generation also faces
problems time and again and the scheduled performance is not obtained. Consume demands,
while predictable, have some degree of variability.
Wind and solar generation does not introduce problems that generation operators have
never faced. While as at low penetrations, integrating the renewable energy introduces local
grid specific and primarily device problems, such as harmonics and sub synchronous
resonance; but, at relatively high penetrations, wind and solar generation adds more non-
uniformity to the energy system that grid operators may not have faced before, thus
introducing the need of ancillary services and energy balance over-all.
8.2. Extensive Unpredictability
Unpredictability or uncertainty differs from variability in that variability of solar and
wind generation is present always, as a result of reliance on the ever changing sunlight or
wind speed affecting the system on a moment to moment time scale. Unpredictability on the
other hand, relates to our innate inability to predict whether the wind and sun will be
available for energy generation an hour or a day later. Unit commitment is used by the grid
operators to manage majority of energy on the grid and hence the hour to day uncertainty is
not as significant. Unit commitment refers to the process of scheduling generation
beforehand, generally around a day ahead, with the purpose of meeting the expected load.
Consequently when production does not meet the demand, the grid operator employs
ancillary services to meet the difference.
Renewable energy generation leads to an increase in the spread between supplied and
predicted energy and hence leads to an increased cost, borne ultimately by the consumers. At
present, unit commitment is largely deterministic implying that once a generator is run-
scheduled, it is expected to run at full capacity. This practice shows in the relative

50
predictability and controllability of traditional generation. Availability of resources is ensured
by the operators, generators that hold the supply of energy in order to be ready to balance the
supply and demand and hence protect against possible generator and transmission line
outages.
A complex problem arises when the process of unit commitment and reserve calculation
in order to ensure reliability is calculated based on hypothetical or random data and hence
carries uncertainty. Weather predictions by forecasting technologies predicts the wind and
solar resources at various time frames more accurately and consequently communicates the
predictions to grid operators allowing the operators to schedule and dispatch resources more
effectively. Anticipating solar and wind output levels properly allow the operators to modify
the generator schedules more dynamically and result in optimal use of all the assets by the
grid operator. Advanced unit commitment methods assist the operator in the processes that
prepare the system for potentially uncertain outcomes not predicted by forecasting
technologies.
8.3. Dependency on Locations:
Long term planning, such as the utilization of new transmission lines, is not addressed to
in the day-to-day management of the grid. Even though renewable energy generation plays a
very important role in this scenario, it introduces new challenges. Wind and solar energy
resources are often present in remote areas far from the areas of actual usage. Being far from
load centers, development of sufficient transmission infrastructure is crucial for the
integration of renewable energy into the grid.
Transmission planning policies are highly varied and tend to be affected by regional
politics. Capacity for energy production may be found in one state, pass through another and
finally be utilized in another state. Such disparities in generation capacity, location of
transmission capacity and variations in load size between various locations makes the
development of renewable energy transmission complex, and more so with respect to cost
allocation.

51
Since new transmission infrastructure that will be established will primarily carry
renewable energy generation, variable electricity, certain technical needs come up regarding
the technology used for transmission. Distributed energy resources provide for an alternative
flexible version of the future grid where energy generation and use is local on a micro-grid
thus preventing the transmission losses and capital costs of transmission lines. The electric
grid can be conceptualized as a collection of cluster grids spread all over the country and
working together in order to significantly reduce drastically the energy transmission needs.

52
Conclusion
India is a vast country and home to a plethora of cultures, ideas, religions and a
conscientious economic sphere. Banking on its aspirations to become a superpower in the
near future, India is on track to increasing its economic pace. The huge growth in the
economy is putting an acute stress on the energy sector. Even with vast resources of certain
conventional fuels, such as coal, the abrupt shift from a producer controlled to a vertical
utility controlled infrastructure to bridge the supply and demand gap has put a tremendous
amount of pressure on the producers. Many times, the producers succumb to this frenzy
which results in an unreliable electrical infra-structure in the country. Besides that, the
traditional electrical grid of the country is deemed inefficient and not at the level necessary to
provide services to the growing economy of the country, which is showing in various
reliability reports about India.
Indian policymakers have finally accepted the growing need of reforms in the basic
working of the country’s electric grid. A shift from conventional approach to a modern smart
grid approach is progressing taking inspiration from the advanced western countries. While
as the earlier five year plans would focus on achieving goals by increasing production of
fuels, the 12th
Five Year Plan, shows a slight shift in the mechanism. The plan consists of an
approach to achieve various goals by tapping into more readily available resources, rather
than putting a pressure on the mining industry of the country. Various Missions have been
introduced such as the JNNSM and the National Mission for Wind Energy, that is helping
shed the conventional ideas and to embrace a modern approach.
To achieve the ‘electricity for all’ by 2027 goal, there is but a need to tap into all the
possible renewable energy sources, and optimizing energy use. This can be done by the
introduction of a smart grid in the country, which has already been deployed in certain cities
and Pradesh’s. A smart grid approach will upgrade the electrical infrastructure of the country
to a modern, well connected, efficient and reliable system that provides a platform for the
economic and overall development of the country.
Even though India still in the early stages with regards to the smart grid, it will have to
increase the number of smart grid deployments and take lessons from each initiative so as to
achieve a centralized national smart grid. Technology transfer, security protocols and investor
regulations are core areas on which the policy makers must focus to make the smart grid
deployment a reality for India.
53
Bibliography
1. World Energy Council, 2010 Survey of Energy Rresources,
2. Central Electricity Authority, All India Electricity Statistics 2013
3. Ashish Gupta, “India’s Coal Supply Security: Pushing Imports at the Expense of
Domestic Reforms?” Observer India, 2012
4. Brieuc Hamon,“Survey of Offshore Wind Farms in EU And Their Connecting Grid
Systems,” Global Energy Network Institute (GENI), July 2012,
5. Christine Hertzog, Liz Ude, and Douglas Stuart, Smart Grid Dictionar, Second Edition,
16 June, 2010
6. Eduardo F. Comacho, Tariq Saud, Ian Hiskens, “Control for Renewable Energy and
Smart Grids”, IEEE Xplore, January, 2012.
7. Department of Minerals and Energy, Republic OF South Africa, White Paper in
Renewable Energy, 1998
8. P.C.Maithani, Renewable Energy in India – A Policy Perspective, Ministry of New and
Renewable Energy, January, 2011.
9. DTE Energy, Smart Grid White Paper, February. 2009
10. Stan Mark Kaplan Electric Power Transmission: Background and Policy
Issues,Congressional Research Service, April 2009.
11. Prya Sreedharam, Rebecca Ghanadn, Lakshmi Alagappan, Snuller Price, Arne Olson and
Ranjit Bharvikar, Electricity Grid Evolution In India: A Scoping Study On The Technical
And Planning Needs To Support The National Action Plan, Regulatory Assistance
Project,September, 2011
12. John Baker, ENARD: The IEA Implementing Agreement on Electricity Networks Analysis,
Research and Development, June, 2009.
13. P. Garg, “Energy Scenario and Vision 2020 in India,” Journal of Sustainable Energy and
Environment, October 2012.
14. Stephane de la Rue du Can, Michael McNeil, and Jayant Sathaye,India Energy Outlook:
End Use Demand in India to 2020, Ernest Orlando Lawrence Berkeley National
Laboratory, January, 2009
15. Galvin, Robert and Yeager, Kurt, Perfect Power: How the Microgrid Revolution Will
Unleash Cleaner, Greener, More Abundant Energy, McGraw Hill, 2009
16. The Capitol Net, Smart Grid: Modernizing Electric Power Transmission and
Distribution; Energy Independence, Storage and Security; Energy Independence and
Security Act of 2007 (EISA); Improving Electrical Grid Efficiency, Communication,
Reliability, and Resiliency; Integrating New and Renewable Energy Sources, 2009
17. International Electrotechnical Commission, Grid Integration of Large-capacity
Renewable Energy Sources and Use of Large Capacity Electrical Energy Storage, White
Paper, October, 2012.
18. Hessamoddin Jouybari Moghaddami, “Influence of Electric Vehicle Charging Rates on
Transformer Derating in Harmonic-rich Battery Charger Applications.” Archives of
Electrical Engineering, November, 2012
19. S.L. Clements, M,D, Hadley. T.W. Carroll, Home Area Networks and the Smart Grid,
U.S.Department of Energy, April, 2011
20. U.S. Department of Energy,How the Smart Grid Promotes a Greener Future, 2012

54
21. James Franklin, History of Energy, Franklin Institute, April, 2006
22. Central Electricity Authority, Hydropower Potential of India, Millenium International
Conference on Renewable Energy Technologies, 2012
23. Energy Alternatives India, India Renewable Energy Guide Highlights for Energy Industry
and Foreign Investors, 2001
24. D. S. Arora, Sarah Busche, Shannon Cowlin, Tobias Engelmeier, Hanna Jaritz Anelia
Milbrandt, andShannon Wang, India Renewable Energy Status Report, Background
Report for DIREC,2010
25. Global Wind Energy Council, India Wind Energy Outlook, 2012
26. V. Raghuraman and Sajal Ghosh, Indo-U.S. Cooperation in Energy - Indian Perspective,
Atlantic Council, 2003
27. Pramod S. Dabrase and T.V. Ramachandra, Integrated Renewable Energy System-
Perspectives and Issues, Millenium International Conference on Renewable Energy
Technologies, 2000
28. Muhammad Qamar Raza, Muhammad Ali, Nauman Tareen, Waheed ur Rehman,
Asadullah Khan, and Azam Ul Asar,“Intelligent Load Shedding Using TCP/IP for Smart
Grids,”Energy and Power Engineering, November,2012
29. International Energy Agency, Technology Roadmaps – Smart Grid, February, 2013
30. N,K, Ibraheem and Prabhakar Tiwari Sharma, “Investigation and Analysis of Indian
Power Grid after Regulatory Reforms & Dynamic Pricing,” International Journal
Engineering Science and Technology, 2010
31. Janina Popeanga, “Cloud Computing and Smart Grids,” Database Systems Journal, 2012.
32. Karen Forsten and Daniel Brooks, Integrating Renewables, Role of the Smart Grid,
Electric Power Research Institute, October 27, 2011
33. Shirish Garud and Ishan Purohit, Making Solar Thermal Power Generation in India a
Reality – Overview of Technologies, Opportunities and Challenges, The Energy and
Resources Institute, India, 2009
34. Marilyn A. Brown and Shan Zhou,Smart-Grid Policies: An International Review, School
of Public Policy, Georgia Institute of Technology, September, 2012
35. Natural Resources Canada, An Introduction to Micro Hydro Power System, January, 2005
36. Cemtral Electricity Agency, National Electricity Plan, Government of India, 2012
37. North Delhi Power Limited, Smart Grid Project in India, August, 2011
38. National Energy Technology Laboratory, Smart Grid Implementation Strategy, U.S.
Department of Energy, 2008
39. P.J Van Dujisen, Frank Chen,Modelling Grid Connection for Solar and Wind Energy,
Integrated Engineering Software, 2012
40. European Regulator’s Group for Electricity and Gas,A Position Paper on Smart Grids, An
ERGEG Public Consultation Paper, Ref: E09-EQS-30-04, December 10, 2009
41. Ministry of Power, Power Plus, India Electricity, 2013
42. Mckinsey & Company, Powering India, The Road to 2017, Electric Power and Natural
Gas Practice, 2008
43. Gerald T. Heydt, Anjan Bose, Ward T. Jewell, Mladen Kezunovic, James D. McCalley,
Dennis J. Ray, Peter W. Sauer, Chanan Singh, and Vijay Vittal, Professional Resources
to Implement the “Smart Grid”, North American Power Symposium, October, 2009

55
44. Agneya Carbon Ventures, Renewable Energy in India: Past, Present and Future, November, 2004
45. Roger N. Anderson, The Distributed Storage-Generation “Smart” Electric Grid of the
Future, The Pew Center on Global Climate Change and the National Commission on
Energy Policy, March, 2004
46. Gurlin Singh Lamba, “Smart Grid and its Development Prospects In the Asia-Pacific
Region,” Journal of Emerging Trends in Computing and Information Sciences, January,
2011
47. San Diego Gas and Electric, Smart Grid Deployment Plan 2011-2020, June, 2011
48. U.S. Agency for International Development, Smart Grid Vision for India’s Power Sector,
March, 2010
49. Grayson Heifner, Smart Grid – Smart Customer Policy Needs, International energy
Agency, April 2011
50. Technology development prospects for the Indian Power Sector, IEA
51. Telling our Story, Renewable Energy, International Finance Corporation
52. TERI, National Energy Map for India: Technology Vision 2030 Summary for policy-
makers,
53. The Future of the Electric Grid, An Interdisciplinary MIT Study
54. The Potential Benefits of Distributed Generation And Rate Related Issues That may
Impede Their Expansion A Study Pursuant to Section 1817 Of The Energy Policy Of
2005 US Department Of Energy
55. Uwe Remme, Nathalie Tru deau,Dagmar Graczyk and Peter Taylor, The Potential for
Renewable Energy in India 2012, International energy Agency, February, 2012
56. Caitlin G. Elsworth (Editor),The Smart Grid and Electric Power Transmission, Nova
Publishers, 2011
57. U.S. Agency for International Development, Smart Grid Vision for India’s Power Sector,
2010
58. U.S. Department of Energy, The Smart Grid: An Introduction, 2008
59. World Energy Council, Transmission and Distribution in India, 2012
60. Lukasz Nikonowiczand Jaroslaw Milewski,Virtual Power Plants – General Review:
Structure, Application and Optimization,” Journal of Power Technologies, 2012
61. Williams J.C., The History of Energy, The Franklin Institute’s Resources for Science
Learning Scientists of Energy,2006
62. Bharat J. Mehta, Wind and Conventional Electricity – Comparative Economics for Captive
Power Plants, National Conference on Synergy with Energy, June 2009
63. World Energy Council, World Energy Perspective Smart Grids: Best Practice
Fundamentals for a Modern Energy System – Annexes, 2012