Embed Size (px)
Citation preview
Integrating Nutritional Benefits and Impacts in a Life Cycle Assessment
Framework: A US Dairy Consumption Case Study
Alexi Ernstoff1,4, Victor Fulgoni III2, Martin Heller3, Gregory Keoleian3, Peter Fantke1, Olivier Jolliet4
1 Quantitative Sustainability Assessment, Department of Management Engineering, Technical University of Denmark, Produktionstorvet
424, 2800 Kgs. Lyngby, Denmark 2 Nutrition Impact, LLC, 9725 D Drive North, Battle Creek, MI 49014 3 Center for Sustainable Systems, School of Natural Resources and Environment, University of Michigan, Ann Arbor, MI 48109-1041,
U.S.A 4 School of Public Health, University of Michigan, Ann Arbor MI 48109-2029, U.S.A
ABSTRACT
Although essential to understand the overall health impact of a food or diet, nutrition is not usually considered in food-related life cycle
assessments (LCAs). As a case study to demonstrate comparing environmental and nutritional health impacts we investigate United States
dairy consumption. Nutritional impacts, interpreted from disease burden epidemiology, are compared to health impacts from more tradi-
tional impacts (e.g. due to exposure to particulate matter emissions across the life cycle) considered in LCAs. After accounting for the
present consumption, data relating dairy intake to public health suggest that low-fat milk leads to nutritional benefits up to one additional
daily serving in the American diet. We demonstrate the importance of considering the whole-diet and nutritional trade-offs. The estimated
health impacts of various dietary scenarios may be of comparable magnitude to environmental impacts suggesting the need for investigat-
ing the balance between dietary public health advantages and disadvantages in comparison to environmental impacts.
Keywords: dairy, dietary guidelines, LCA, nutrition
1. Introduction
Dietary guidelines, for instance suggested by the United States government, focus on improving health
through dietary nutrition and do not consider environmental impacts occurring throughout the life cycle of the
recommended diet (van Dooren et al., 2014). On the other hand, food-related Life Cycle Assessments (LCAs)
assessing environmental and public health, tend to neglect nutritional advantages and disadvantages (Heller et
al., 2013). In general, the assessment of emissions and nutrient intake is based on a functional unit relevant to the
study question and the food system of interest. The selection of the functional unit is extremely important in
LCA—specifically within food LCAs this point cannot be further emphasized, as it may change results when
comparing two various food items or diets on different bases. Historically, there has been a large number of
functional units based food LCAs (e.g. based on mass or volume of a single food type, quality corrected mass, a
single nutrient, a full nutrient profile). Food oriented studies have mostly focused on environmental efficiency in
crop or food production, for instance, how to decrease environmental impacts per unit output. (e.g. Garnett,
2013). In order to consider questions of impacts and benefits of dietary choices, i.e. consuming one food over
another, assessment must be conducted in the context of the overall diet. These consumption oriented approach-
es (based e.g. on serving size, or full dietary or meal nutrients) are of growing interest as a means of informing
consumer choices and policy decisions that affect dietary recommendations (e.g. Vieux et al, 2013).
Table 1 summarizes approaches to add nutritional impacts into environmental impact assessments the domain
of application and limitations of each method, leading to the following statements: All present methods are im-
pact oriented and do not enable a comparison of impacts with nutritional benefits. Several indices are themselves
based on the contribution of the food to recommended nutrient intakes rather than based on epidemiological
measures of health benefits and impacts. We expect in general when "quality" adjustments made including nutri-
tional aspects, assessed impacts are reduced for items having positive nutritional benefits such as milk, fruit veg-
etables. This supports our thinking that if we can get to a better assessment of health benefits for products like
milk then environmental impact in terms of expected negative human health impacts will be more balanced.
However, trying to force various benefits and impacts associated to nutrition in the basis for comparison (the tra-
ditional functional unit) does not provide a clear view of the benefit of “positive” nutritional components versus
the impact of “negative” nutritional components.
There is therefore a need to consider health benefits and impacts of nutrition in a parallel way to the latest
quantitative development of the global burden of disease to incorporate diet-related risk factors, and consider
Disability Adjusted Life Years as a basis for an improved index.
Proceedings of the 9th International Conference on Life Cycle Assessment in the Agri-Food Sector
339

Table 1. Summary Table of Identified Approaches to Incorporating Nutrition in Environmental Impact
Assessment
Approach Domain of application Limitation / needs Features of interest for
framework a) Functional unit approaches
Mass- or vol-
ume-based
e.g. per kg
or per liter
Internal (production oriented)
assessments; identifying
hotspots, evaluating abatement
scenarios
Not appropriate for compari-
sons of different foods
Intermediary calculation step
Quality cor-
rected mass
e.g
per kg FPCM
Normalizing product quality
across different production
practices; evaluating scenarios
that affect product quality
Limited to simple nutritional
quality assessments that can
be related to a mass unit; not
appropriate for comparison of
disparate foods
Reconsideration of FPCM
and impacts of allocated
cream in overall diet
scenarios
Single nutri-
tional aspect,
e.g.
per g protein
Evaluating single nutritional
dimensions across foods with
related functions
Limited complexity; does not
capture other nutritional dif-
ferences
Impact and benefit of single
nutrient could be estimated
separately
Nutrient pro-
file
e.g. per index
unit value
More complete nutritional pic-
ture; may be valuable in com-
paring foods
Negative impacts not adapted
for functional unit; most cur-
rent indices based on dietary
recommendations rather than
health outcome
Would be of interest to create
a DALY weighted nutrient
profile
Approach Domain of application Limitation / needs Features of interest for
framework & next
steps b) Consumption oriented approaches
Serving size
per serving
size
Normalizes based on typical
consumption quantities; can be
used as a consumption-based
unit for comparing individual
food items, provided that
health effects of nutrients are
also considered
Does not link with nutrition or
health; inconsistent definitions
of servings
Testing scenario of one addi-
tional serving of milk
Diet-based
for overall diet
Basis for consumption orient-
ed assessment
Requires parallel assessment
of nutritional quality/health;
no basis to evaluate trade-offs
Basis for comparison frame-
work at diet level
Equivalent
nutrition diet
for overall
equivalent diet
Sound basis for comparing
environmental impact of simi-
lar diets
Limited to nutritionally equiv-
alent diets; definition of “nu-
tritional equivalence” may be
limited
Useful in considering iso-
caloric dietary substitution
scenarios
Diet-level nu-
trient profile
e.g. per index
unit value of
overall diet
May offer a comprehensive
nutritional basis for diet com-
parisons
Negative impacts not adapted
for functional unit; most cur-
rent indices based on dietary
recommendations rather than
health outcome
Will be used as a compara-
tive approach
To address these needs, we aim in this paper to 1) present a preliminary framework to show separately envi-
ronmental and nutritional impacts together on a comparable scale, starting from serving size, 2) build on global
burden of disease information and use of the DALY to compare human health impacts and benefits of nutrition,
3) provide a dairy case study to demonstrate the framework and analyze population-scale health effects of die-
tary changes.
Proceedings of the 9th International Conference on Life Cycle Assessment in the Agri-Food Sector
340
2. Methods
2.1. Framework for comparing impacts and nutritional benefits of food
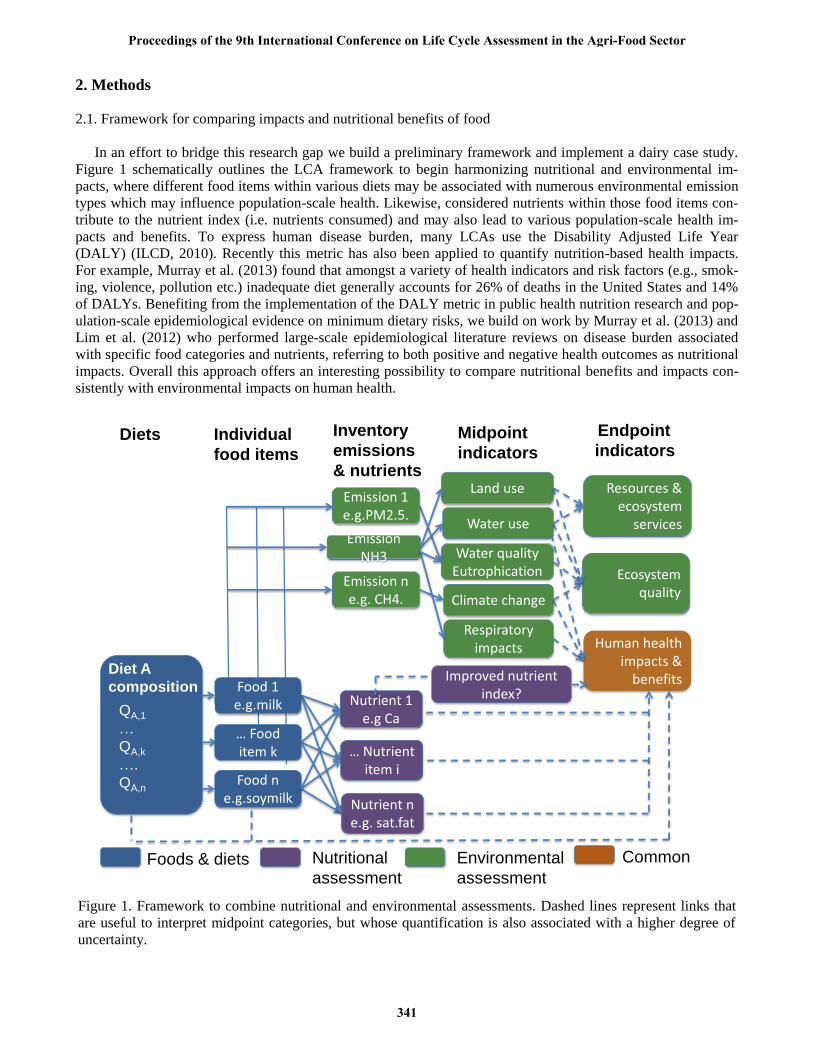
In an effort to bridge this research gap we build a preliminary framework and implement a dairy case study.
Figure 1 schematically outlines the LCA framework to begin harmonizing nutritional and environmental im-
pacts, where different food items within various diets may be associated with numerous environmental emission
types which may influence population-scale health. Likewise, considered nutrients within those food items con-
tribute to the nutrient index (i.e. nutrients consumed) and may also lead to various population-scale health im-
pacts and benefits. To express human disease burden, many LCAs use the Disability Adjusted Life Year
(DALY) (ILCD, 2010). Recently this metric has also been applied to quantify nutrition-based health impacts.
For example, Murray et al. (2013) found that amongst a variety of health indicators and risk factors (e.g., smok-
ing, violence, pollution etc.) inadequate diet generally accounts for 26% of deaths in the United States and 14%
of DALYs. Benefiting from the implementation of the DALY metric in public health nutrition research and pop-
ulation-scale epidemiological evidence on minimum dietary risks, we build on work by Murray et al. (2013) and
Lim et al. (2012) who performed large-scale epidemiological literature reviews on disease burden associated
with specific food categories and nutrients, referring to both positive and negative health outcomes as nutritional
impacts. Overall this approach offers an interesting possibility to compare nutritional benefits and impacts con-
sistently with environmental impacts on human health.
Human healthimpacts &
benefits
Ecosystem quality
Resources & ecosystem
services
Respiratory impacts
Water qualityEutrophication
Land use
Climate change
Water use
QA,1
…
QA,k
….
QA,n
Diet A
composition
Midpoint
indicators
Endpoint
indicatorsDiets Individual
food items
… Food item k
Food n e.g.soymilk
Nutrient 1e.g Ca
… Nutrient item i
Emission 1e.g.PM2.5.
Nutrient n e.g. sat.fat
Emission NH3
Emission ne.g. CH4.
Inventory
emissions
& nutrients
Foods & diets Nutritional
assessment
Environmental
assessment
Common
Food 1e.g.milk
Improved nutrient index?
Figure 1. Framework to combine nutritional and environmental assessments. Dashed lines represent links that
are useful to interpret midpoint categories, but whose quantification is also associated with a higher degree of
uncertainty.
Proceedings of the 9th International Conference on Life Cycle Assessment in the Agri-Food Sector
341

2.2. Dairy case study
a) Functional unit and scope
To test the LCA framework, which includes both nutrition and environmental impacts, we study a dairy case
study. The Dietary Guidelines for Americans (USDA, 2010) recommends adult Americans consume 3 daily
servings (≈740 g/day total) of low-fat or fat–free dairy products, close to doubling current consumption (USDA
ERS. 2012). Previously performed LCAs (e.g. Thoma et al., 2013, Asselin-Balençon et al, 2013) have quantified
various environmental impacts of dairy production in the US. Entirely missing from these LCAs, however, are
the use phase nutritional impacts or benefits on human health due to dairy consumption. Building on the litera-
ture review from Heller et al., (2013), this research aims to incorporate nutrition related health effects of dairy
into an LCA framework to compare them consistently with environmental impacts. We use the serving size as a
common functional unit when combining nutritional and environmental impacts within LCA. This allows easy
comparison with recommended dietary guidelines, based on serving sizes, and can also be easily converted to
mass or volume, as well as to a corresponding nutritional intake or dietary function (e.g. calcium intake). We
consider epidemiologically-based estimations of dairy’s contribution to the global burden of disease and caloric
intake to evaluate the health impacts due to nutritional components. For environmental impact, we focus on
greenhouse gas (GHG) emissions and human health impacts of particulate matter (PM). We select these two im-
pact categories because of their high relevance, and they have been extensively studied in relation to the dairy
industry by Thoma et al. 2013 and Henderson et al. 2013. Additionally, human health effects of PM have also
been assessed through various epidemiological studies (Pelucchi et al., 2009) and can thus be compared with nu-
tritional impacts.
b) Defining the American diet and dietary context
In order to understand how a shift in dairy consumption may affect overall nutritional intake, we must first
define the current “average” diet in the US. We assess two available datasets: The National Health and Nutrition
Examination Survey (NHANES) and the USDA-maintained Loss Adjusted Food Availability (LAFA) data se-
ries (USDA ERS 2012). Survey-based approaches, like NHANES, are known to under-report food intakes; they
are also comprised of as-consumed (e.g., processed) food items, with no consideration of the life cycle of a food
item e.g. from the commodity or ingredient level. LAFA, on the other hand, measures the use of food commodi-
ties (e.g., wheat) by tracking the US marketplace. Generally, the available supply is the difference between the
sum of production, imports and beginning stocks, and the sum of non-food use (e.g. industrial uses), exports, and
ending stocks for a given calendar year. In the LAFA series, the available supplies for over two hundred com-
modities are adjusted by percent loss assumptions, for instance plate waste and food spoilage in order to account
for various processes effecting food loss along the chain farm to retail. Availability adjusted for loss can serve
as a useful proxy for per capita food consumption in the US. While LAFA data is presented at the food com-
modity level (i.e., raw farm products like wheat and corn rather than consumables like bread or tortilla chips),
this level is far more manageable from the environmental impact perspective; LAFA data also allows to account
for supply chain losses, which contribute to environmental impact but are not consumed (and therefore do not
contribute to nutritional health effects).Therefore, we propose using a recent 2010 LAFA data series to define
average US food consumption (the background average US diet) within this proof-of-concept case study. These
data are available both on a weight and on a food pattern equivalent basis, permitting consistent connection be-
tween environmental impact and nutritional data.
c) Scenarios
In general, it is important to consider the nutritional and health effects from consumption of a single food
item within the full dietary context. From average diet information we find that the average US adult diet in-
cludes 1.5 cup equivalents (with around 245 grams of milk per cup) of dairy consumed per person per day, about
half the recommended value. To investigate the shift from average consumption to recommended consumption
we evaluate three dietary scenarios. These are hypothetical examples to implement this framework; unfortunate-
Proceedings of the 9th International Conference on Life Cycle Assessment in the Agri-Food Sector
342

ly there is limited data available to predict actual dietary changes. Starting from the average diet (scenario 0) at
population-scale we investigate the effects if people generally will (Figure 2):
Dairy products1.7 serving
Dairybeef
Beefcattle
Rest of diet0. Average US diet
ΔNutritional value ΔHealth benefits
ΔGreenhouse gas impacts and ΔHealth impacts
Dairy products1.7 serving
1. + 1 serving milk
+1 milkserving
Dairybeef
Beefcattle
+1 milkserving
2. + 1 serving milk – reduction in average diet
3. + 1 serving milk – fats & sugars
Solid fats &added sugars
Rest of diet Solid fats &added sugars
Dairy products1.7 serving
Dairybeef
Beefcattle
Rest of diet Solid fats &added sugars
+a)
- b)
+ a) 122 kcal
averagediet
+1 milkservingDairy products
1.7 servingDairybeef
Beefcattle
Rest of diet Solid fats &added sugars
+a)
- c)fats &sugars
Figure 2. Scenario schematic: Changes in nutritional/health benefits and environmental impacts (green-
house gas, example) associated with one additional serving of milk within the diet.
1. Add an additional serving (1 cup) of “2% milk,” that is fluid milk containing 2% fat, (per capita per day)
to the diet, with no change to the rest of the diet; i.e., this scenario would result in an increased caloric
intake over the average diet baseline. 2. Add an additional serving of 2% milk while subtracting an equal caloric quantity from the overall aver-
age diet. Thus, the 1 cup of milk would be added to a diet that is proportionally reduced by ~122 kcals
(the energy content in 1 cup of 2% milk). The resulting diet would be iso-caloric with the average diet
baseline. 3. Add an additional 1 cup of 2% milk while subtracting an equal caloric quantity of “empty calorie” foods.
This will likely be a proportional representation from the Dietary Guidelines’ “solid fats and added sug-
ars” category. The resulting diet would be iso-caloric with the average diet baseline.
We use these specific scenario decisions based on the following logic: In response to dissemination of dietary
guidelines, consumers may acknowledge the governmental recommendation for increasing lower-fat dairy con-
sumption, and chose to supplement their diet with a low-fat milk product (here considered 2% fat, because it is
the most commonly consumed lower fat form of milk). This dietary change: 1) may not result in compensatory
removal of equivalent calories from the rest of the diet (e.g. Duffy and Popkin 2007); 2) may result in compensa-
tory removal of calories resulting in an a diet approximately iso-caloric to before dairy supplementation; 3) may
result in removal of other beverages such as sodas from the diet (e.g. Cavadini et al. 2000).
Proceedings of the 9th International Conference on Life Cycle Assessment in the Agri-Food Sector
343

3. Results compilation and case study
3.1. Nutrition-oriented assessment and relation to health
To assess nutrition-related health impacts, we use a global burden of disease (GBD) approach, building off of
Murray et al. (2013) and Lim et al. (2012). Specifically, we build on the risk ratios from the GBD sources and
minimum risk thresholds to extend nutrition-oriented work that associates nutritional/dietary benefits and risks
with DALYs.
The benefits associated with increasing dairy consumption are dependent on the status-quo consumption or
dairy products. Within the GBD risk framework, there are no additional health benefits to increase servings
above the consumption threshold corresponding to the reported minimum risk level. Given the adult population
(19+ yrs) in NHANES 2009-2010 had a reported milk intake of 0.87 cup per day (unpublished data), we can cal-
culate the increase in amount of milk to reach the milk consumption threshold corresponding to the minimal risk
level according to Lim, et al (2012). Assuming we standardize milk to 2% reduced fat milk with 236 g/cup, we
estimate that currently American adults are consuming 205 g milk/day (the product of 0.87 cup and 236 g/cup).
With a reported minimum risk threshold level of 450 g/day, we can deduce that adult Americans would need to
consume an additional 245 g milk per day on average, which is about 1.04 cups (245 g milk/236 g per cup), to
reach the minimal risk level outlined in Lim et al., (2012).
As a comparative exploration, we perform the same calculation based on nutrients instead of dairy or milk as
a whole-food. The reported minimal risk for calcium intake is 1200 mg/day. Assuming a non-dairy calcium in-
take of about 385 mg/day (Fulgoni et al. 2011) and calcium from dairy as 516 mg calcium (1.72 cup equivalents
of all dairy products from NHANES 2009-2010 with each cup equivalent having approximately 300 mg of cal-
cium) we deduce we need an additional 299 mg calcium/day (1200-385-516=299) to achieve the minimal risk
level outlined in Lim et al., (2012). Again, this corresponds to about one cup of 2% milk.
It appears Murray, et al., (2013) used ounces of weight rather than fluid ounces for their calculation for im-
pact of milk (226.8g/8 oz=28.35g). To keep units similar to relative risks we can perform similar calculations;
based on these relative risks, the change in milk in cup equivalents is 0.96 cup eq of 2% milk, which again corre-
sponds to about one cup.
These different preliminary calculations suggest that an increase of one serving of milk will maximize health
benefits for the primary dairy-related risk categories. Increases above this level would increase impacts without
additional benefits in these categories. Further research will be needed to define minimal risks for other health
categories (e.g., bone health, blood pressure).
3.2. Quantification of greenhouse gas emissions
Detailed results from the Innovation Center sponsored milk LCA studies (Thoma et al. 2013; Henderson et al.
2013) are used to estimate greenhouse gas emissions from the life cycle of fluid milk production. Additionally,
to broadly estimate GHG emissions from the general diet we generate a dataset of 250 data points aggregated
from a variety of published studies on greenhouse gas emissions from the production of specific foods in specific
places. Where multiple emission factors exist in the dataset for the same food, an average is taken. For foods
without specific data points, proxies are formed by averaging related foods. Several limitations exist in using this
dataset: many studies are not specific to US production scenarios; significant variability can exist between stud-
ies of the same food; transport and other variables are not treated in a consistent fashion across studies. Still, the
dataset is useful for a pilot level study; it captures most of the important foods in the LAFA dataset and is the
most reasonable collection of data current available.
3.3. Quantification of Particulate Matter (respiratory inorganics) emissions and related impacts
The largest contributors in typical food and agricultural systems to respiratory inorganic impacts are particu-
late matter (PM) from internal combustion engines (i.e., tractor use, transportation) and ammonia emissions (a
PM precursor), primarily from manure storage and handling. The Comprehensive LCA of Fluid Milk (Hender-
son et al. 2013) models these emissions (and impacts) related to PM for the US milk production chain, and will
thus be used in this case study. Since most published LCA studies on foods do not report these emissions or im-
Proceedings of the 9th International Conference on Life Cycle Assessment in the Agri-Food Sector
344
pacts, we propose the following approach to provide a first order estimate of the PM associated with producing
the average US diet. The majority of PM from food systems comes from direct ammonia emissions during agri-
cultural production (generating secondary PM) and from tractor usage and from transportation (primary and sec-
ondary PM). A preliminary study carried out on the 4000 Ecoinvent processes shows that PM from all sectors
can be interpolated from correlations between PM and greenhouse gas emissions (GHGE), with specific coeffi-
cients for agriculture production and for transportation. We estimate the proportion of GHGE from the produc-
tion of individual food types using studies that report the contribution of field emissions, tractors and transporta-
tion to various food group GHGE (Weber and Matthews 2008; Hoolohan et al. 2013; Meier and Christen 2013).
These studies will be combined with the Ecoinvent derived correlation to estimate direct emissions of PM2.5
(so-called primary PM) as well as emissions of precursors (NH3, NOx, SO2) of secondary PM (this important
PM precursor for the average diet.
As described by Fantke et al. (2014), a starting point to determine the human health impacts associated with
primary and secondary particulate is the effort of an earlier UNEP/SETAC working group that has designed a
framework and proposed a set of default human intake fractions (iF) associated with PM emissions for use in
LCIA (Humbert et al. 2011). This effort was consistent with other consensus building actions in the frame of
comparative chemical assessments. However, this effort is limited to the part of the impact pathway from emis-
sions to concentration and human intake, but does not cover the part from human intake to finally health effects.
This will be complemented according to the latest recommendations of the LCIA guidance task force for PM re-
lated health impacts based on dose-response from the 2010 global burden of disease (Lim et al. 2012; Murray et
al. 2013) as well as calculations based on the American Cancer Society Study of Particulate Air Pollution and
Mortality (Gronlund et al. 2013; Pope III et al. 2002). Since nutrition impacts and benefits will also be mostly
based on the 2010 burden of disease, this will ensure a good consistency between environmental impacts and nu-
trition.
3.4. Overall trade-offs
With considering only one serving additional in each dietary scenario, preliminary results show the following
tendencies. The increase in calories may dominate, generating important additional impacts. In the iso-caloric
scenario 2, the nutritional benefit of milk becomes important and will counter balance the human health impacts
of PM over the life cycle. Dietary scenario 3 provides the most substantial nutritional advantage by also reducing
the nutritional impacts of added sugar. We finally analyze the trade-offs between human health and global
warming impacts for each scenario.
4. Discussion
Considering the present US consumption, and limited epidemiological data on disease burden, our results
suggests that lower-fat milk leads to nutritional benefits up to one additional serving. Nutrition is a complex is-
sue and we do not attempt to cover all intricacies in this case study. For example we do not consider non-
nutritional health impacts such as social/cultural issues with dietary changes, or other health related issues such
as bowel motility or indigestion related to lactose intolerance. We also do not consider possible variations in
health impacts for different age groups (i.e. a health advantage of consuming dairy may be more measurable for
children and teenagers than for elderly populations) and consider the general order of magnitude of potential im-
pacts at the population scale and not the health impacts for a given individual. We also do not consider at this
stage other potential benefits of dairy products on other risk areas such as bone health and blood pressure,
whereas the Lim et al. (2012) and Murray et al (2013) studies consider only carcinogenic risks (e.g. balancing
associations of dairy consumption with decreased risk of colorectal cancer and increased risk of prostate cancer). It is important as population grows and food and environmental resources become strained that research con-
tinues on harmonizing nutritional and environmental public health impacts of foods and diets. This study assess-
es epidemiological data on disease burden in relation to one food group (dairy) and one associated nutrient (cal-
cium) in the context of governmental dietary regulations and LCA. This type of analysis may help regulators in
selection of dietary guidelines and promote holistic consideration of both the environment and the direct nutri-
tional implications. Our findings emphasize a clear need for more research on dietary choices and for under-
standing whether or not shifts in the diet are compensated for by other food groups. Generally the framework we
Proceedings of the 9th International Conference on Life Cycle Assessment in the Agri-Food Sector
345

present provides the groundwork for considering both the nutritional and environmental impacts of a specific
food, and for also considering the entire dietary context, which we find essential.
5. Conclusion
In all, this work suggests that in order to optimize public health dietary recommendations, nutritional impacts
and benefits should be considered with respect to the entire diet as well as the food’s life cycle. This work pro-
vides a stepping-stone for consistently incorporating nutritional effects into an LCA framework.
Accounting for the nutritional function of food is a perennial problem in assessing the environmental impact
of food production in the LCA framework. The review presented here outlines a functional unit approach that
also includes dietary context. We propose a novel framework for bringing environmental and nutritional aspects
of food together using the global burden of disease approach to evaluating risk factors using the DALY metric.
This approach allows expression of behavioral choices such as diet composition in terms of the associated dis-
ease risks. Under such a framework, nutritional and environmental health impacts of a dietary change may be
evaluated in equivalent units, permitting a quantitative estimate of the complements and trade-offs between nu-
trition and environment. Regarding the limited epidemiological data relating food items to possible health im-
pacts, these preliminary investigations do not offer exact calculations or the health risks for a given individual,
but instead should be considered as an indication of the importance of balancing nutritional and environmental
health impacts, as these may lead to contradicting conclusions depending on the population-scale dietary context.
6. References
Asselin-Balençon AC, Popp J, Henderson A, Heller M, Thoma G, Jolliet O (2013) Dairy farm greenhouse gas
impacts: A parsimonious model for a farmer’s decision support tool. International Dairy Journal 31, Supple-
ment 1:S65–S77. doi: 10.1016/j.idairyj.2012.09.004
Cavadini C, Siega-Riz AM, Popkin BM (2000) US adolescent food intake trends from 1965 to 1996. Arch Dis
Child 83:18–24.
Van Dooren C, Marinussen M, Blonk H, et al. (2014) Exploring dietary guidelines based on ecological and nu-
tritional values: A comparison of six dietary patterns. Food Policy 44:36–46. doi:
10.1016/j.foodpol.2013.11.002
Duffey KJ, Popkin BM (2007) Shifts in Patterns and Consumption of Beverages Between 1965 and 2002. Obesi-
ty 15:2739–2747. doi: 10.1038/oby.2007.326
Fantke P, Jolliet O, Apte JS, Cohen AJ, Evans JS, Hänninen OO, Hurley F, Jantunen MJ, Jerrett M, Levy JI,
Marshall JD, Miller BG, Preiss P, Spadaro JV, Tainio M, Tuomisto JT, McKone TE (2013) Accounting for
Health Effects of Particulate Matter in Life Cycle Impact Assessment: Findings of the Basel Guidance Work-
shop. Submitted to Int J of LCA.
Fulgoni III V, Nicholls J, Reed A, et al. (2007) Dairy Consumption and Related Nutrient Intake in African-
American Adults and Children in the United States: Continuing Survey of Food Intakes by Individuals 1994-
1996, 1998, and the National Health and Nutrition Examination Survey 1999-2000. Journal of the American
Dietetic Association 107:256–264. doi: 10.1016/j.jada.2006.11.007
Garnett T (2013) Food sustainability: problems, perspectives and solutions. Proceedings of the Nutrition Society
72(01): 29-39
Heller MC, Keoleian GA, Willett WC (2013) Toward a Life Cycle-Based, Diet-level Framework for Food Envi-
ronmental Impact and Nutritional Quality Assessment: A Critical Review. Environ Sci Technol 47:12632–
12647. doi: 10.1021/es4025113
Henderson A, Asselin A, Heller M, Vionnet S, Lessard L, Humbert S, Jolliet O (2013) Comprehensive Life Cy-
cle Assessment of Fluid Milk in the United States: Final Report
Hoolohan C, Berners-Lee M, McKinstry-West J, Hewitt C (2013) Mitigating the greenhouse gas emissions em-
bodied in food through realistic consumer choices. Energy Policy 63: 1065-1074
ILCD handbook - EPLCA. http://eplca.jrc.ec.europa.eu/?page_id=86. Accessed 28 Apr 2014
Lim SS, Vos T, Flaxman AD, et al. (2012) A comparative risk assessment of burden of disease and injury at-
tributable to 67 risk factors and risk factor clusters in 21 regions, 1990–2010: a systematic analysis for the
Global Burden of Disease Study 2010. The Lancet 380:2224–2260. doi: 10.1016/S0140-6736(12)61766-8
Proceedings of the 9th International Conference on Life Cycle Assessment in the Agri-Food Sector
346

Meier T, Christen O (2013) Environmental Impacts of Dietary Recommendations and Dietary Styles: Germany
As an Example. Environmental Science & Technology 47(2): 877-888
Murray CJ, Lopez AD (1996) Evidence-Based Health Policy—Lessons from the Global Burden of Disease
Study. Science 274:740–743
Pelucchi C, Negri E, Gallus S, et al. (2009) Long-term particulate matter exposure and mortality: a review of Eu-
ropean epidemiological studies. BMC Public Health 9:453. doi: 10.1186/1471-2458-9-453
Thoma G, Popp J, Nutter D, et al. (2013) Greenhouse gas emissions from milk production and consumption in
the United States: A cradle-to-grave life cycle assessment circa 2008. International Dairy Journal 31, Sup-
plement 1:S3–S14. doi: 10.1016/j.idairyj.2012.08.013
USDA ERS. 2012. Food Availability (Per Capita) Data System. http://www.ers.usda.gov/data-products/food-
availability-(per-capita)-data-system.aspx. Accessed.
Vieux F, Soler LG, Touazi D, Darmon N (2013) High nutritional quality is not associated with low greenhouse
gas emissions in self-selected diets of French adults. American Journal of Clinical Nutrition 97(3): 569-583
Weber C L, Matthews HS (2008) Food-miles and the relative climate impacts of food choices in the united
states. Environmental Science & Technology 42(10): 3508-3513
Proceedings of the 9th International Conference on Life Cycle Assessment in the Agri-Food Sector
347

This paper is from:
Proceedings of the 9th International Conference on
Life Cycle Assessment in the Agri-Food Sector
8-10 October 2014 - San Francisco
Rita Schenck and Douglas Huizenga, Editors
American Center for Life Cycle Assessment
The full proceedings document can be found here:
http://lcacenter.org/lcafood2014/proceedings/LCA_Food_2014_Proceedings.pdf
It should be cited as:
Schenck, R., Huizenga, D. (Eds.), 2014. Proceedings of the 9th International Conference on Life
Cycle Assessment in the Agri-Food Sector (LCA Food 2014), 8-10 October 2014, San Francisco,
USA. ACLCA, Vashon, WA, USA.
Questions and comments can be addressed to: [email protected]
ISBN: 978-0-9882145-7-6