Embed Size (px)
Citation preview
Integrating Acute and Post-Acute Care: The Emerging Merging of the Sectors
April 18, 2014
2
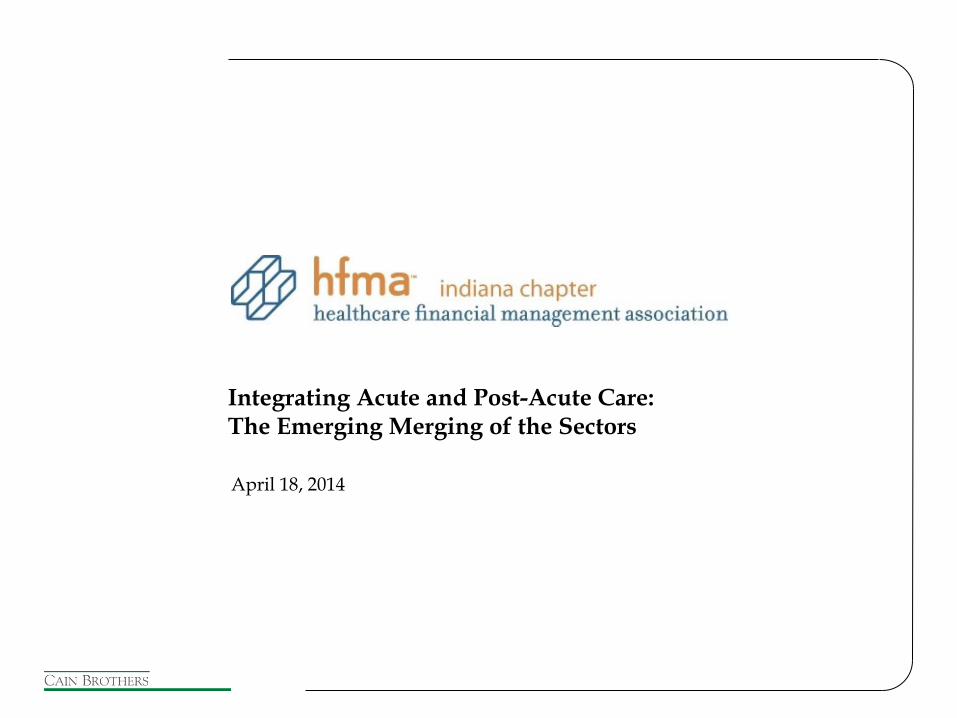
Post-Acute Care (PAC) - A Driver of Medicare Costs
PAC Medicare FFS spending is growing at unsustainable levels given the projected rise in enrollment
While MA PAC utilization statistics are not available, MA tends to mimic FFS PAC usage patterns – 10% annual MA growth means that between 40-50% of all Medicare will be MA capitated by 2025
PAC revenue growth is due to several factors. To control utilization, CMS’s policy is evolving from FFS, to payment methodologies that reward care coordination, stability and are venue neutral; possibly combining the acute care and PAC payments into one bundled payment
MA utilization patterns are likely to follow Medicare Bundled payment initiatives
Acute and SNF readmission penalties were CMS’s first PAC reform effort, causing hospitals to move from “laissez faire” patient discharging, to establishing more meaningful SNF and HHA networks
Hospitals are quickly moving to establish fewer/but tighter SNF networks
Advocate in Chicago reduced SNF referrals from 42 SNFs to 12 over a 2 year period with their hospitalists being the SNFists at the 12 SNFS
Advocate’s ACO-like model provides a 90% of Medicare FFS rate with bonuses for quality, reduced readmissions and shortened SNF ALOS
CB recommends that hospitals form networks with area SNFs in advance of these pending changes to help better organize the PAC continuum for more cost-effective PAC utilization and patient recovery
3
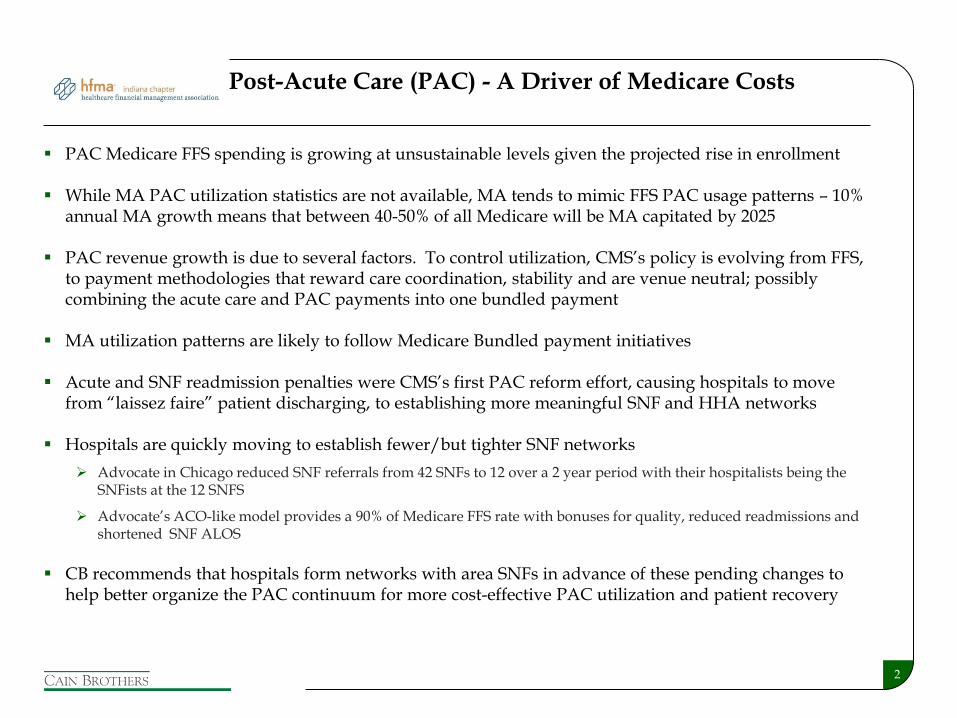
CMS Is Advancing New Value-Driven Payment Paradigms Links PAC-Acute Primary Care Service Levels

4
$98.4 $106.8
$116.7
$34.1
$48.2
$60.3
2003 2007 2011
Post-Acute
Acute
$ 132.5
$ 155.0
$ 177.0
74%
11%
8%
5% 2%
2003
66%
17%
10%
4% 3%
2011
Hospital
SNF
HHA
IRF
LTACH
CMS is highly concerned with slowing PAC revenue growth as it is out-pacing all other Medicare services
Acute and Post-Acute Care Trends
Medicare Expenditures (fee-for-service only)
Distribution of Medicare Expenditures by Venue of Care
____________________ Source: CMS
26% 31%
34%
5
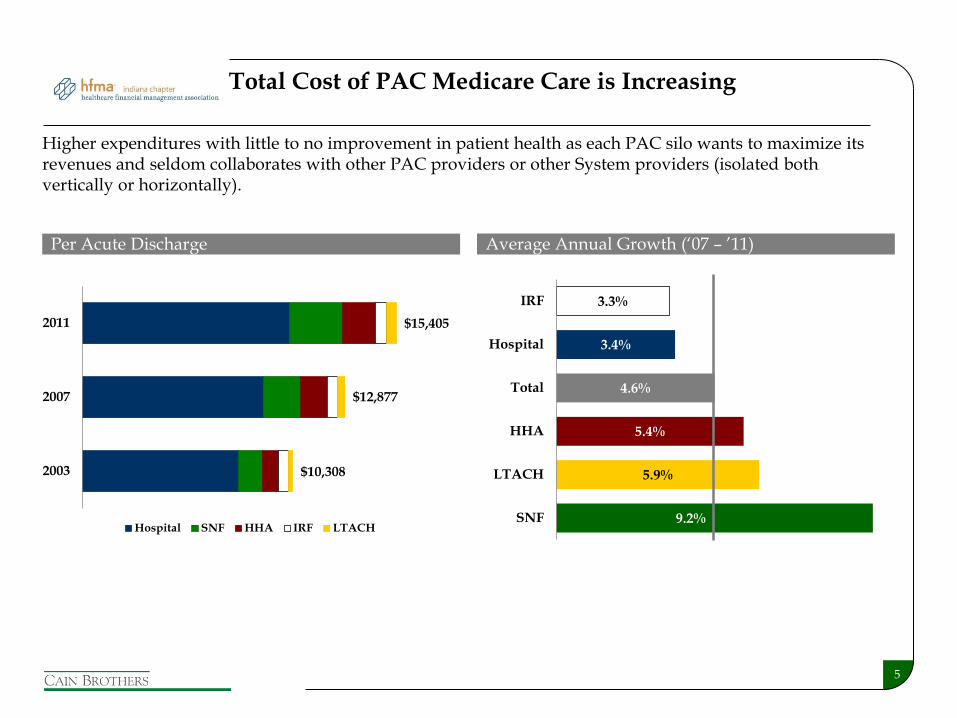
9.2%
5.9%
5.4%
4.6%
3.4%
3.3%
SNF
LTACH
HHA
Total
Hospital
IRF
Total Cost of PAC Medicare Care is Increasing
Per Acute Discharge
Higher expenditures with little to no improvement in patient health as each PAC silo wants to maximize its revenues and seldom collaborates with other PAC providers or other System providers (isolated both vertically or horizontally).
Average Annual Growth (‘07 – ’11)
2003
2007
2011
Hospital SNF HHA IRF LTACH
$10,308
$12,877
$15,405
6
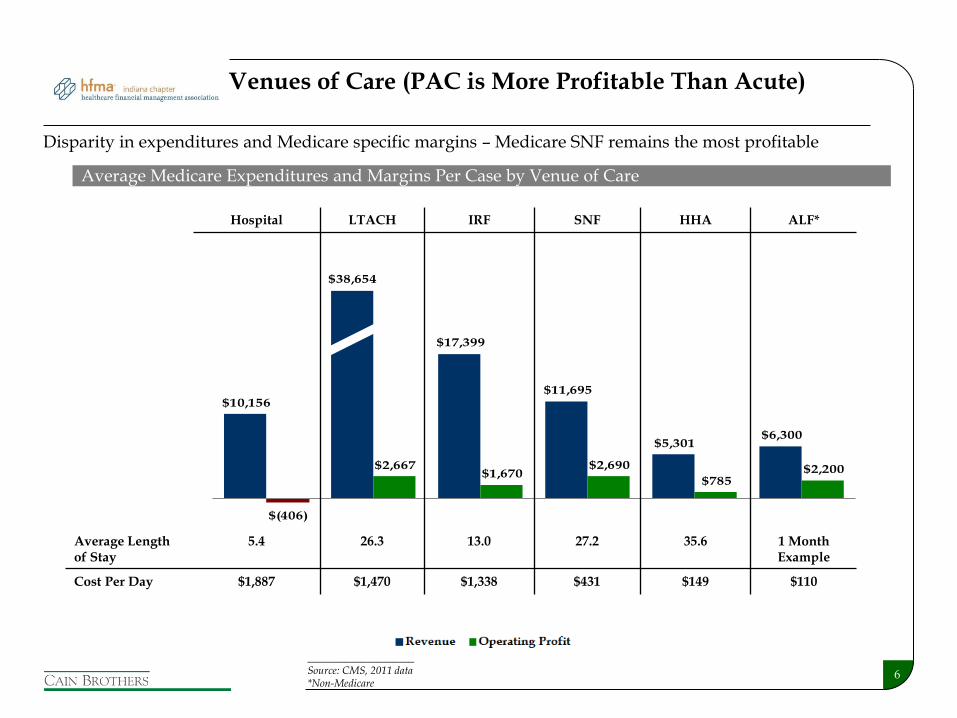
$10,156
$38,654
$17,399
$11,695
$5,301 $6,300
$(406)
$2,667 $1,670
$2,690
$785 $2,200
Hospital LTACH IRF SNF HHA ALF
Revenue Operating Profit
Hospital LTACH IRF SNF HHA ALF*
Average Length of Stay
5.4 26.3 13.0 27.2 35.6 1 Month Example
Cost Per Day $1,887 $1,470 $1,338 $431 $149 $110
Venues of Care (PAC is More Profitable Than Acute)
Disparity in expenditures and Medicare specific margins – Medicare SNF remains the most profitable
Average Medicare Expenditures and Margins Per Case by Venue of Care
____________________ Source: CMS, 2011 data *Non-Medicare
7
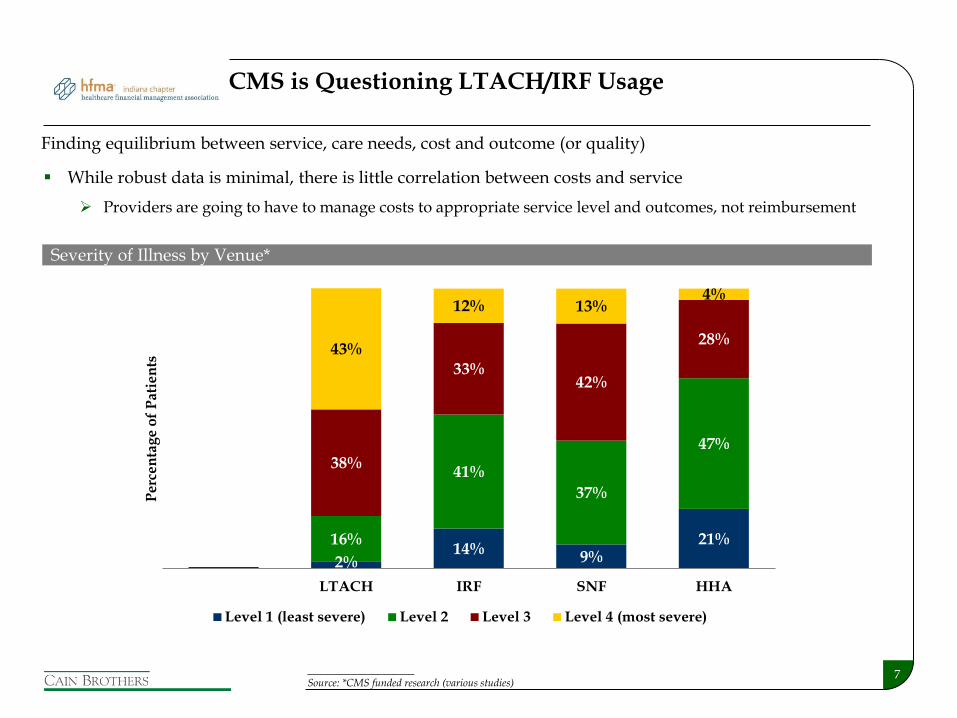
While robust data is minimal, there is little correlation between costs and service
Providers are going to have to manage costs to appropriate service level and outcomes, not reimbursement
CMS is Questioning LTACH/IRF Usage
Finding equilibrium between service, care needs, cost and outcome (or quality)
Severity of Illness by Venue*
17%2%
14%9%
21%
42%
16%
41%
37%
47%
32%
38%
33%42%
28%
9%
43%
12% 13%4%
Hospital LTACH IRF SNF HHA
Per
cen
tag
e o
f P
atie
nts
Level 1 (least severe) Level 2 Level 3 Level 4 (most severe)
____________________ Source: *CMS funded research (various studies)
8
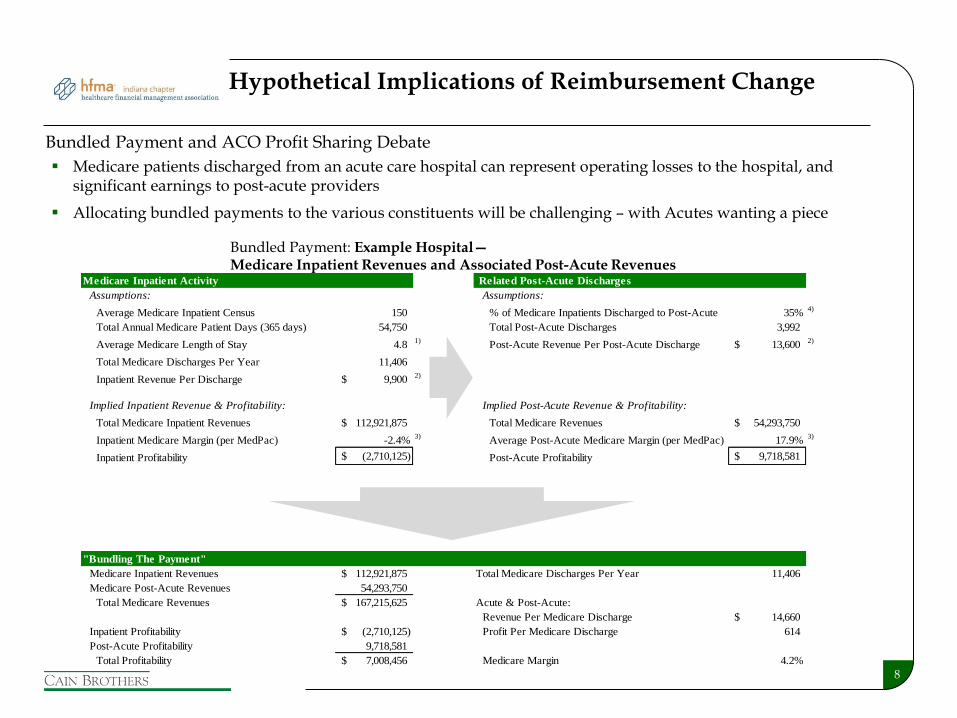
Hypothetical Implications of Reimbursement Change
Bundled Payment: Example Hospital— Medicare Inpatient Revenues and Associated Post-Acute Revenues
Medicare Inpatient Activity Related Post-Acute Discharges
Assumptions: Assumptions:
Average Medicare Inpatient Census 150 % of Medicare Inpatients Discharged to Post-Acute 35%4)
Total Annual Medicare Patient Days (365 days) 54,750 Total Post-Acute Discharges 3,992
Average Medicare Length of Stay 4.8 1)
Post-Acute Revenue Per Post-Acute Discharge 13,600$ 2)
Total Medicare Discharges Per Year 11,406
Inpatient Revenue Per Discharge 9,900$ 2)
Implied Inpatient Revenue & Profitability: Implied Post-Acute Revenue & Profitability:
Total Medicare Inpatient Revenues 112,921,875$ Total Medicare Revenues 54,293,750$
Inpatient Medicare Margin (per MedPac) -2.4%3)
Average Post-Acute Medicare Margin (per MedPac) 17.9%3)
Inpatient Profitability (2,710,125)$ Post-Acute Profitability 9,718,581$
"Bundling The Payment"
Medicare Inpatient Revenues 112,921,875$ Total Medicare Discharges Per Year 11,406
Medicare Post-Acute Revenues 54,293,750
Total Medicare Revenues 167,215,625$ Acute & Post-Acute:
Revenue Per Medicare Discharge 14,660$
Inpatient Profitability (2,710,125)$ Profit Per Medicare Discharge 614
Post-Acute Profitability 9,718,581
Total Profitability 7,008,456$ Medicare Margin 4.2%
Medicare patients discharged from an acute care hospital can represent operating losses to the hospital, and significant earnings to post-acute providers
Allocating bundled payments to the various constituents will be challenging – with Acutes wanting a piece
Bundled Payment and ACO Profit Sharing Debate
9
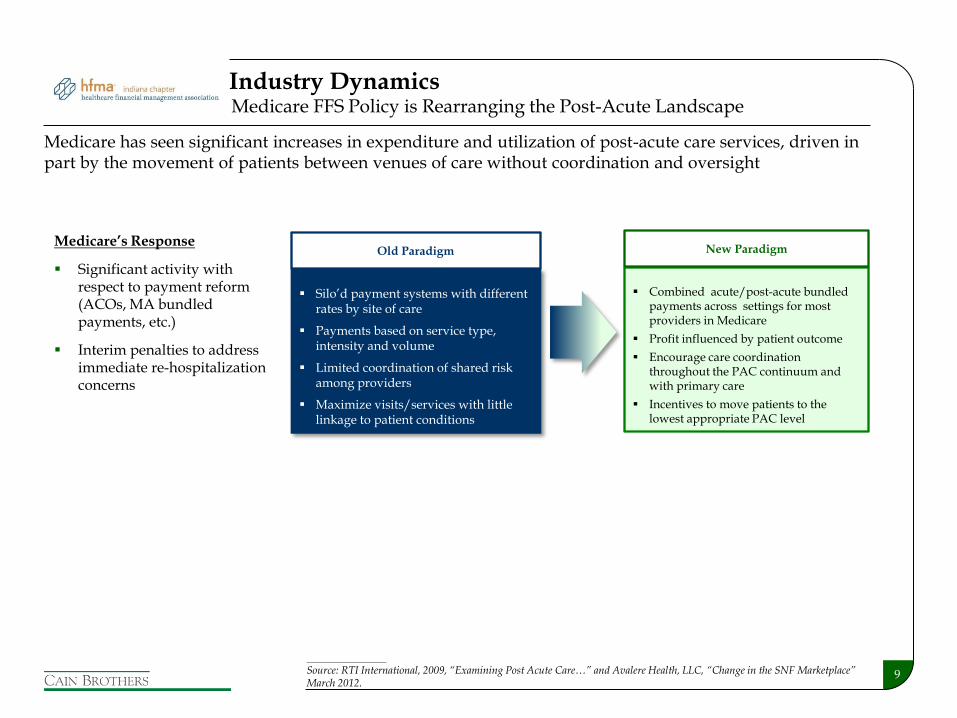
Medicare has seen significant increases in expenditure and utilization of post-acute care services, driven in part by the movement of patients between venues of care without coordination and oversight
Silo’d payment systems with different rates by site of care
Payments based on service type, intensity and volume
Limited coordination of shared risk among providers
Maximize visits/services with little linkage to patient conditions
Combined acute/post-acute bundled payments across settings for most providers in Medicare
Profit influenced by patient outcome
Encourage care coordination throughout the PAC continuum and with primary care
Incentives to move patients to the lowest appropriate PAC level
Old Paradigm New Paradigm Medicare’s Response
Significant activity with respect to payment reform (ACOs, MA bundled payments, etc.)
Interim penalties to address immediate re-hospitalization concerns
Medicare FFS Policy is Rearranging the Post-Acute Landscape Industry Dynamics
____________________
Source: RTI International, 2009, “Examining Post Acute Care…” and Avalere Health, LLC, “Change in the SNF Marketplace” March 2012.
10
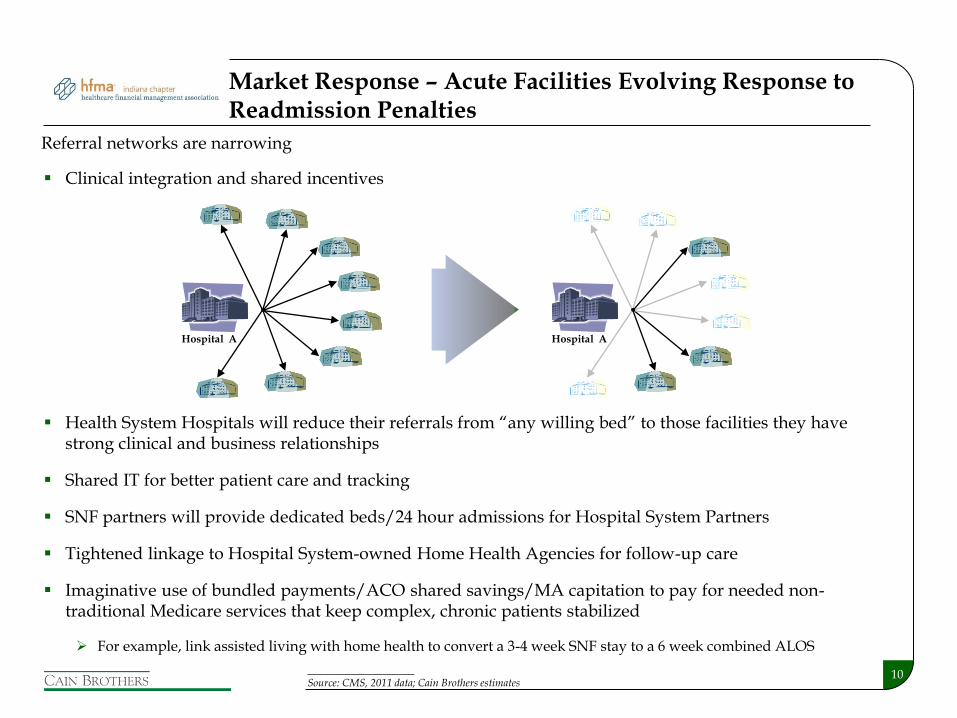
Market Response – Acute Facilities Evolving Response to Readmission Penalties
Clinical integration and shared incentives
Health System Hospitals will reduce their referrals from “any willing bed” to those facilities they have strong clinical and business relationships
Shared IT for better patient care and tracking
SNF partners will provide dedicated beds/24 hour admissions for Hospital System Partners
Tightened linkage to Hospital System-owned Home Health Agencies for follow-up care
Imaginative use of bundled payments/ACO shared savings/MA capitation to pay for needed non-traditional Medicare services that keep complex, chronic patients stabilized
For example, link assisted living with home health to convert a 3-4 week SNF stay to a 6 week combined ALOS
Referral networks are narrowing
Hospital A Hospital A
____________________ Source: CMS, 2011 data; Cain Brothers estimates

11
The Evolving Health System PAC Continuum Prototype
12
Potential Next Steps
Review hospital’s internal SNF capacity and referrals out of the organization
Prepare Criteria Inclusion List for SNF partner(s) – criteria may include:
Nurse Staffing ratios – total hours and licensed levels for dedicated short-stay units
Admission criteria – health conditions, payment type, 16 to 24 hour a day admissions, etc.
Highlight facility appearance and/or willingness to expedite facility modifications
Willingness to integrate system’s skilled therapy and medical direction, possibly adding an out-patient skilled therapy and chronic care clinic on-site
Willingness to enter into innovative payment mechanisms - possibly including capitated risk-sharing, quality of care bonuses, etc. - in addition to per diem reimbursement
Willingness to invest in real-time EMR/IT and cost-center accounting transparency
Willingness to work with competitive SNFs to provide additional capacity, possible with ALF and residential hospice, to strengthen the PAC continuum and to test research findings
13
PAC Out-Reach Goals
Negotiate network affiliation and bed-hold agreements, and possibly shared-risk or bonus linked per diem contracts
Strike agreement, create joint quality committees, enhance admission policies and make IT upgrades
Hold monthly and/or quarterly quality-care meetings to track progress on all key quality indicators and implement agreement upgrades
Create joint-medical directorships and make care delivery adjustments as needed
Make joint-quality committees open to two-way communication where hospital/docs learn how to better prepare acute patients for SNF transfer
Create compensation methodologies, legitimate under Medicare, for serving the most-difficult to serve patients that are “losers” under the current reimbursement systems
Annual Grants
In-kind Supplies/Services
IT support, etc.
14
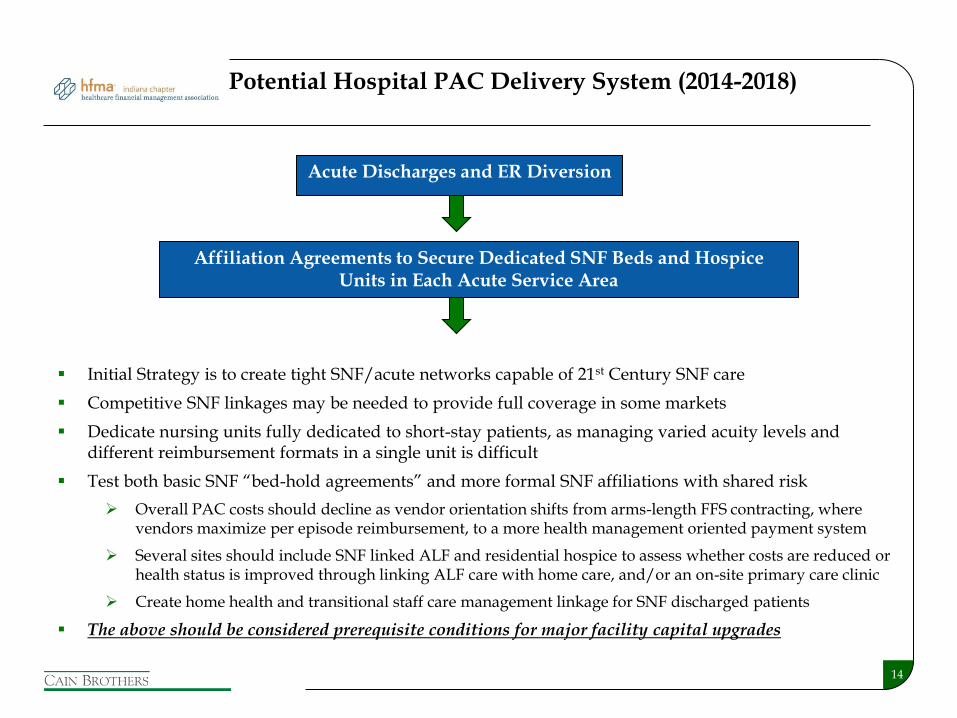
Acute Discharges and ER Diversion
Affiliation Agreements to Secure Dedicated SNF Beds and Hospice Units in Each Acute Service Area
Initial Strategy is to create tight SNF/acute networks capable of 21st Century SNF care
Competitive SNF linkages may be needed to provide full coverage in some markets
Dedicate nursing units fully dedicated to short-stay patients, as managing varied acuity levels and different reimbursement formats in a single unit is difficult
Test both basic SNF “bed-hold agreements” and more formal SNF affiliations with shared risk
Overall PAC costs should decline as vendor orientation shifts from arms-length FFS contracting, where vendors maximize per episode reimbursement, to a more health management oriented payment system
Several sites should include SNF linked ALF and residential hospice to assess whether costs are reduced or health status is improved through linking ALF care with home care, and/or an on-site primary care clinic
Create home health and transitional staff care management linkage for SNF discharged patients
The above should be considered prerequisite conditions for major facility capital upgrades
Potential Hospital PAC Delivery System (2014-2018)
15
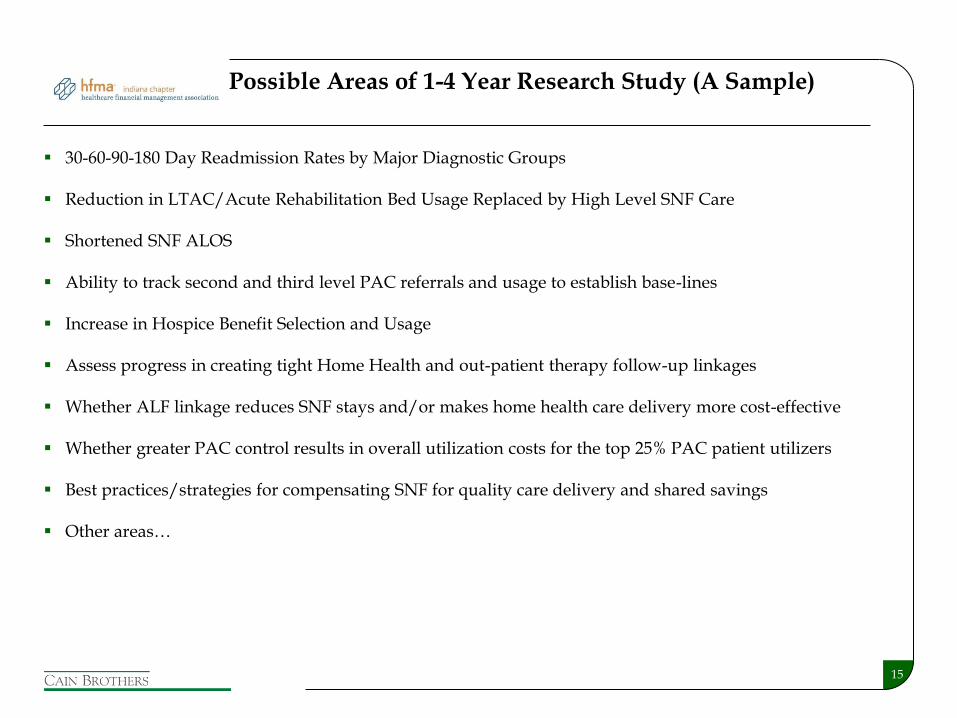
Possible Areas of 1-4 Year Research Study (A Sample)
30-60-90-180 Day Readmission Rates by Major Diagnostic Groups
Reduction in LTAC/Acute Rehabilitation Bed Usage Replaced by High Level SNF Care
Shortened SNF ALOS
Ability to track second and third level PAC referrals and usage to establish base-lines
Increase in Hospice Benefit Selection and Usage
Assess progress in creating tight Home Health and out-patient therapy follow-up linkages
Whether ALF linkage reduces SNF stays and/or makes home health care delivery more cost-effective
Whether greater PAC control results in overall utilization costs for the top 25% PAC patient utilizers
Best practices/strategies for compensating SNF for quality care delivery and shared savings
Other areas…
16
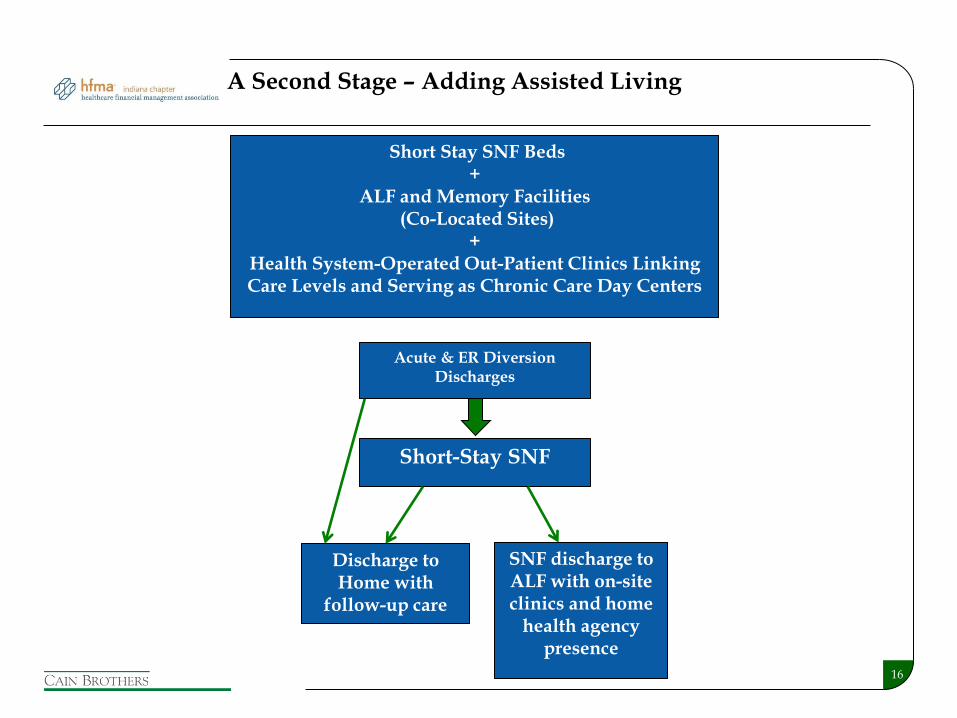
Short Stay SNF Beds +
ALF and Memory Facilities (Co-Located Sites)
+ Health System-Operated Out-Patient Clinics Linking Care Levels and Serving as Chronic Care Day Centers
Acute & ER Diversion Discharges
Short-Stay SNF
Discharge to Home with
follow-up care
SNF discharge to ALF with on-site clinics and home
health agency presence
A Second Stage – Adding Assisted Living

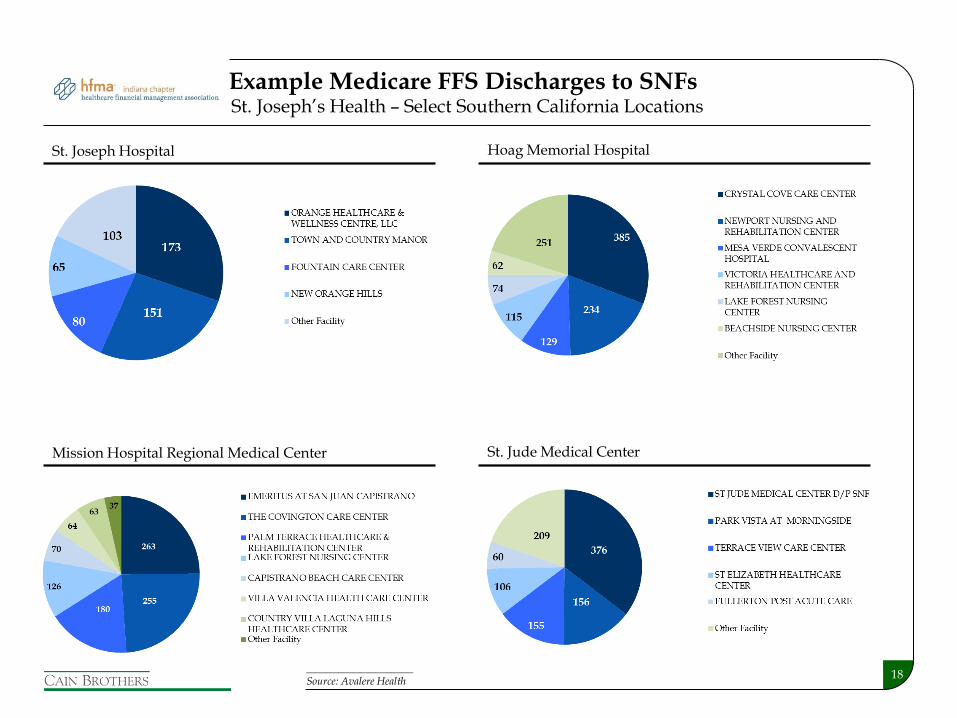
Exhibit A: Example Medicare FFS Discharges to SNFs
18
Hoag Memorial Hospital
Example Medicare FFS Discharges to SNFs
____________________ Source: Avalere Health
St. Joseph Hospital
St. Jude Medical Center Mission Hospital Regional Medical Center
St. Joseph’s Health – Select Southern California Locations