Embed Size (px)
Citation preview
INTEGRATED VALUE CREATION – PART 2 A PRACTICAL APPROACH TO CLOSING THE INTANGIBLE INFORMATION GAP
By Mary Adams, Smarter-Companies
Contents THE INTANGIBLE INFORMATION GAP .......................................................................... 2
FILLING IN THE GAP – AN INTEGRATED APPROACH ..................................................... 3
Matter ....................................................................................................................... 3
Measure .................................................................................................................... 5
Financial ................................................................................................................ 5
Quantitative .......................................................................................................... 6
Qualitative ............................................................................................................ 7
Model ....................................................................................................................... 8
Integration in practice .............................................................................................. 9
SOME BENEFITS OF INTEGRATION ............................................................................. 10
Attract ..................................................................................................................... 10
Align ........................................................................................................................ 10
Accelerate ............................................................................................................... 11
Account ................................................................................................................... 11
Avoid ....................................................................................................................... 11
Act ........................................................................................................................... 12
CONCLUSION .............................................................................................................. 12

A PRACTICAL APPROACH TO CLOSING THE INTANGIBLE INFORMATION GAP, page 2
This paper is the Part 2 of an examination of integrated value creation and the intangible information gap. Part 1
provides theoretical background that connects the integrated model with financial, sustainability and intangible capital
reporting. Part 2 is oriented to practice and includes many examples and case studies. The two papers can be read
independently.
THE INTANGIBLE INFORMATION GAP
In Part 1 of this series, I made the case that the integrated reporting movement has
roots in three fields of study: Accounting, Sustainability and Intangibles. Accounting
is a long-established field of study that is practiced by every company. Sustainability
is much newer but has made dramatic advances in recent years. It focuses primarily
on externalities, that is, the external creation and/or destruction of value related to
a company’s operations. By many estimates, more than 80% of U.S. public
companies make some kind of disclosure each year of Environmental, Social and
Governance (ESG) performance.
The third field of study contributing to the integrated reporting movement is called
intellectual or intangible capital (IC). This field has primarily focused on internalities,
the internal creation and/or destruction of value in a company’s operations. To
date, there are no broadly accepted standards for reporting or measurement of IC.
But economic data suggests that these intangibles dominate corporate valuation.
Since the 1970’s the tangible net worth of the average company on the S&P 500 has
shifted from explaining 83% of total corporate value to just 16% today. The
remainder is what I call the intangible information gap.
The integrated multi-capital model advocated by the International Integrated
Reporting Council (IIRC) is a solution to the intangible information gap. This paper
outlines a methodology for using the multi-capital model to identify, measure and
map value creation. It also includes a case study of the application of this process in
a small association as well as numerous examples from public company integrated
reports.
A PRACTICAL APPROACH TO CLOSING THE INTANGIBLE INFORMATION GAP, page 3
FILLING IN THE GAP – AN INTEGRATED APPROACH
In this section, I’ll suggest steps that an individual company can take to use the
integrated model to fill in the intangibles information gap. It starts with creating an
inventory of the key value creation capitals (Matter), strategies for measuring the
capitals (Measure) and emerging practices for mapping connections among the
capitals (Model).
The discussion of these steps includes examples from public company reports and
from the Exit Planning Exchange (XPX) a network of associations for privately-held
companies and their advisors. I’m one of the leaders of the group and we’ve used
this kind of integrated value management approach over the past several years.
These examples are from our 2016 Integrated Report.
Matter
The first step in developing an integrated view is to identify or put names to the key
components of each of the capitals, that is, create an inventory of what matters. As
explained in Part 1 of this series, the corporate value creation ecosystem and
process was easier to see in prior eras. Land was purchased. Buildings were
constructed. Equipment was installed. Raw materials were purchased and converted
to finished goods. It was all owned and tangible. We accept as obvious that
companies would inventory all these assets. Not so with intangibles.
Intangibles information has to be created from the ground up. The first step is to
create an inventory of the capital elements that fuel revenues, performance,
collaboration and innovation: People who bring, create and apply knowledge every
day. The partnerships with customers, suppliers who share and help you create and
monetize value. The processes, data and knowledge that institutionalize best
practices and make a company scalable. The use of natural resources. The social
environment that is inevitably affected for better or worse.
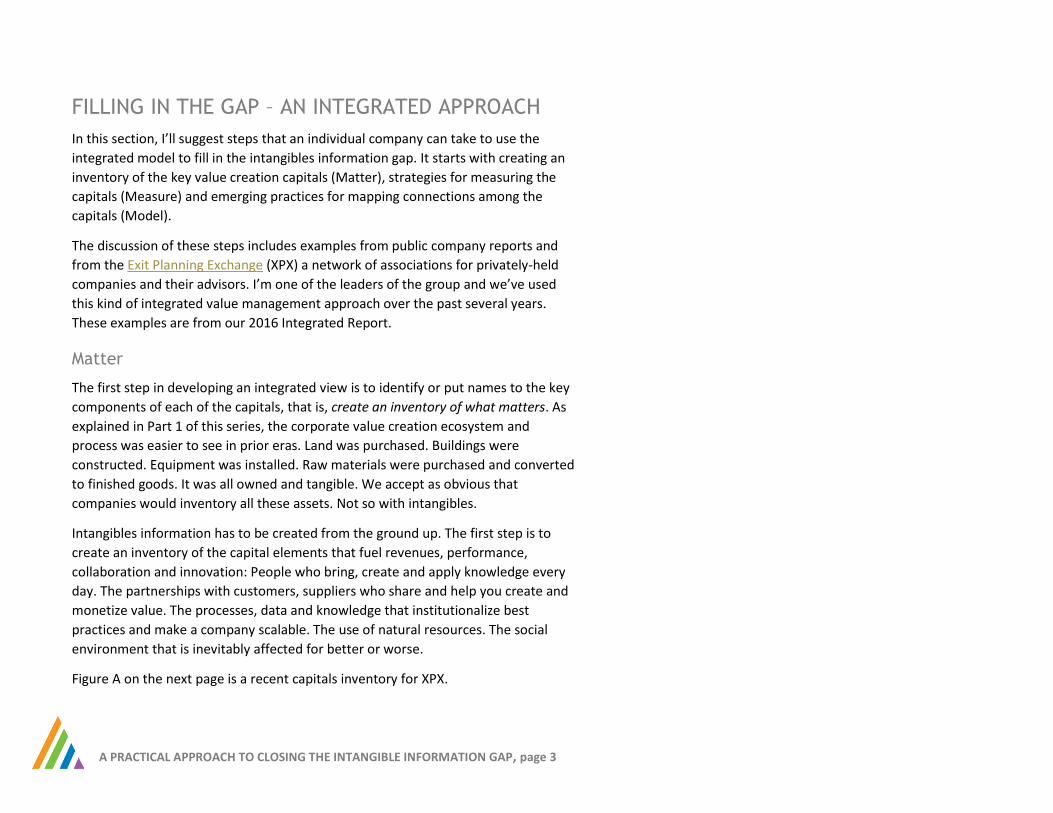
Figure A on the next page is a recent capitals inventory for XPX.
A PRACTICAL APPROACH TO CLOSING THE INTANGIBLE INFORMATION GAP, page 4
Figure A – XPX Value Creation Inventory
XPX Global At Jan, 2017
PARTNERS Relationship Capital
PURPOSE Strategic Capital
PROPERTY Structural Capital
PEOPLE Human Capital
PLANET Natural Capital
Resource Inventory
CUSTOMERS XPX Chapters
VALUE PROPOSITION
Give Chapters the benefit of a shared brand, network and
services while maximizing local
control
PROCESSES
Chapter start-up
Event mgmt
Membership mgmt
Web site service and development
COMPETENCIES
Association mgmt
Community development
Social media
RESOURCES XPX Global is virtual so not significant user of natural resources.
SUPPLIERS
Wild Apricot (platform)
Supporting Strategies (fin)
WebBright (web development)
Stripe (paymts)
DigiCert (security)
BUSINESS MODEL
Service License fee based on gross revenues
No fees are payable until a new Chapter has sufficient cash
DATA/IP
Member profiles
Email list
Website
Manuals
URL’s
Brands
ADMINISTRATORS
Donna Powell
Angie Ellis
Kathy Goodrich
MANAGEMENT
Mary Adams
Dan Guglielmo
Shannon Zollo
LAND
N/A
STAKEHOLDERS
XPX Members
XPX Sponsors
Business Owners
Private Company Community
CULTURE
Professional
Collaborative
Learning
Adaptive
BUILDINGS/EQPMT
N/A
ADVISORS/BOARD XPX Leadership
Collaborative (incl representatives from all Chapters)
WASTE Chapters hold in-person meetings
which implies travel and some paper use.
Metrics 7 Chapters
524 6559 contacts
Service license fee 35% payable when
Chapter has >$7,500
15 member levels 36 major sponsors
68 events
3 virtual Admins 1 part-time Exec Dir
3 Founders

A PRACTICAL APPROACH TO CLOSING THE INTANGIBLE INFORMATION GAP, page 5
Figure A summarizes the core capitals in XPX’s value creation ecosystem. The
company provides branding, technology and association management to a network
of independent Chapters. The inventory seen here focuses on Global, not the
Chapters themselves. Its customers are the Chapters and its staffing and systems
are focused on supporting the Chapters. It does own the shared brands, two
trademarks and a number of URL’s. Since it’s a virtual company, there isn’t much of
a tangible or natural capital footprint.
The format used for creating this table is available under a Creative Commons
Attribution Share-Alike License. You can download a blank version at the Smarter-
Companies website.
Although this kind of expanded, integrated inventory isn’t a common practice today
for public companies, it is possible to infer an inventory from public disclosure. Last
year, I published a comparison of the capitals of Apple and Samsung as a way of
illustrating different value creation models. This analysis highlighted the contrasts
between Apple’s design-focused model that outsources most manufacturing with
Samsung’s heavy investment in in-house production.
Measure
Once you create an inventory, the next step is to measure the listed elements. The
three basic types of metrics are financial, quantitative and qualitative.
Financial
Accounting records all monetary flows into and out of a company. This has always
been a critical activity because positive cash flows are the only way to ensure a
company survives to continue its mission and achieve both external and internal
sustainability. There are all kinds of information that can help measure the capitals
starting with the revenues and operating expenses on the income statement.
The balance sheet is a little more problematic. As explained above, there’s
considerable financial investment in intangibles that doesn’t make its way to the
balance sheet. In our book, we called this intangible capital expenditure (i-capex).
There are applicable
financial measures for all
the capitals on the income
statement.
A PRACTICAL APPROACH TO CLOSING THE INTANGIBLE INFORMATION GAP, page 6
There, we suggest that companies use accounting information on expenses to
create a report of accumulated i-capex. I recently re-released the book chapter
where we laid out the argument for i-capex. The World Bank used this kind of
approach a few years ago to study the wine industry in Chile, confirming the
importance of investment in intangibles to the industry’s growth from a regional to
an international player in the wine industry.
Financial data on i-capex can serve as a great starting point for intangibles
measurement. It helps signal priorities and strategies of the company. And specific
investments can be measured against different types of outcomes. This is an under-
utilized alternative.
Quantitative
The most common tool for measurement of the non-financial capitals is counting
things that can be counted. These quantitative metrics range from a simple set of
key performance indicators (KPI’s) to elaborate dashboards and performance
management systems.
What are the right indicators? For human capital, a starting set of metrics might
include the number of full-time, part-time and contract employees. Also relevant
may be their tenure, education level and certifications. For relationship capital, the
size and tenure of relationships with customers, vendors, partners. For intellectual
capital, process performance (speed, volume, service levels), IP portfolio (number of
patents, grouping by areas of expertise or knowledge families, number of licenses)
and knowledge management statistics. For natural capital, carbon dioxide
emissions, resource use, waste management are all common metrics.
Most companies already track countless key indicators. The goal of an integrated
model is to bring them into a single view that connects with the capitals and
develop a more holistic understanding of the system.
The most common tool for
measurement of the non-
financial capitals is
counting things that can be
counted.

A PRACTICAL APPROACH TO CLOSING THE INTANGIBLE INFORMATION GAP, page 7
Qualitative
Qualitative measures have been traditionally met with skepticism although their use
has been accelerating in recent decades. The simplest one is the Net Promoter Score
which has become an industry unto itself. Many ESG metrics are actually qualitative
ratings and rankings performed by third parties based on
questionnaire responses from companies. A large directory of
these kinds of ratings is available at CSRHub. Other examples are
the ratings of products on Amazon, hotels on Expedia and
employers on Glass Door.
Due to our size, XPX doesn’t have any external sources of
qualitative metrics and we have yet to undertake any surveys to
create our own. However, we do provide the simple scorecard for
our key capitals seen in this figure. For now, the metrics we use are
mostly quantitative and financial.
In a study I did last year of integrated reports, 7 of 10 included a
summary data table similar to this one (although many just
included a single year of data). My favorite example is Southwest
Airlines, which provides five years of data (financial, quantitative
and qualitative) about its capitals.
2014 2015 2016
Relationship Capital
Chapters 4 5 5
Markets Served 4 6 8
Chapters in Development 1 2 3
Members 301 370 524
Major Chapter Sponsors n/a 36 43
Contacts 3,647 4,050 5,296
Strategic Capital
Total Chapter Revenues 252,031 260,910 236,285
Consolidated Chapter Cash 100,535 117,600 105,841
Total Global Revenue 88,283 101,019 75,895
Consolidated Global Cash 39,162 24,570 29,243
Structural Capital
Events 58 68 82
Articles on site n/a 156 290
Videos on site n/a 29 53
Full-length programs on site - - 7
Video views 97
Web visitors 10,725 10,203 15,216
Average page views 4.72 4.49 3.84
Average time on site 3.40 4.08 3.38
Human Capital
Virtual Admins 2 3 2
Part-time Exec Director - 1 1
Leadership Collaborative Meetings 6 6 6
A PRACTICAL APPROACH TO CLOSING THE INTANGIBLE INFORMATION GAP, page 8
Model
When you see all the capitals together, it is clear that financials, internalities and
externalities are all interconnected.
The basic flows go something like this: Your company invests time and money to
create infrastructure (the capitals) that it can use to create value for a customer.
The customer pays for the value they receive with money (and other kinds of value
flows) which enables the company to pay its bills and generate a return for its
owners. Along the way, it creates and hopefully doesn’t destroy long term value in
the company’s capitals and its environment.
But these value flows get complicated fast. To increase revenues, the company has
to attract customers and good people. In exchange, they need to have a compelling
purpose and value proposition. To solve social and environmental problems, they
need to drive innovation. This requires them to hire good people, support them
with a good culture, systems and, sometimes, external resources. To lower carbon
dioxide emissions, they need to make changes in their physical plant but also
processes, culture and people. Value is exchanged continuously.
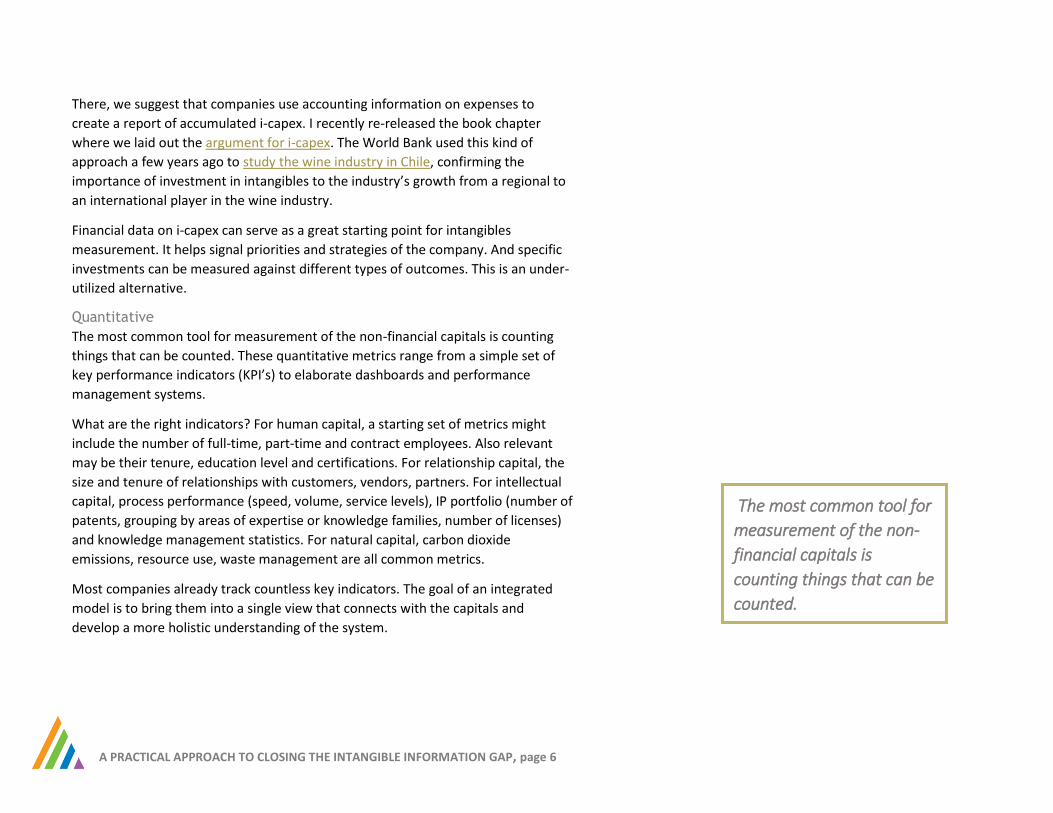
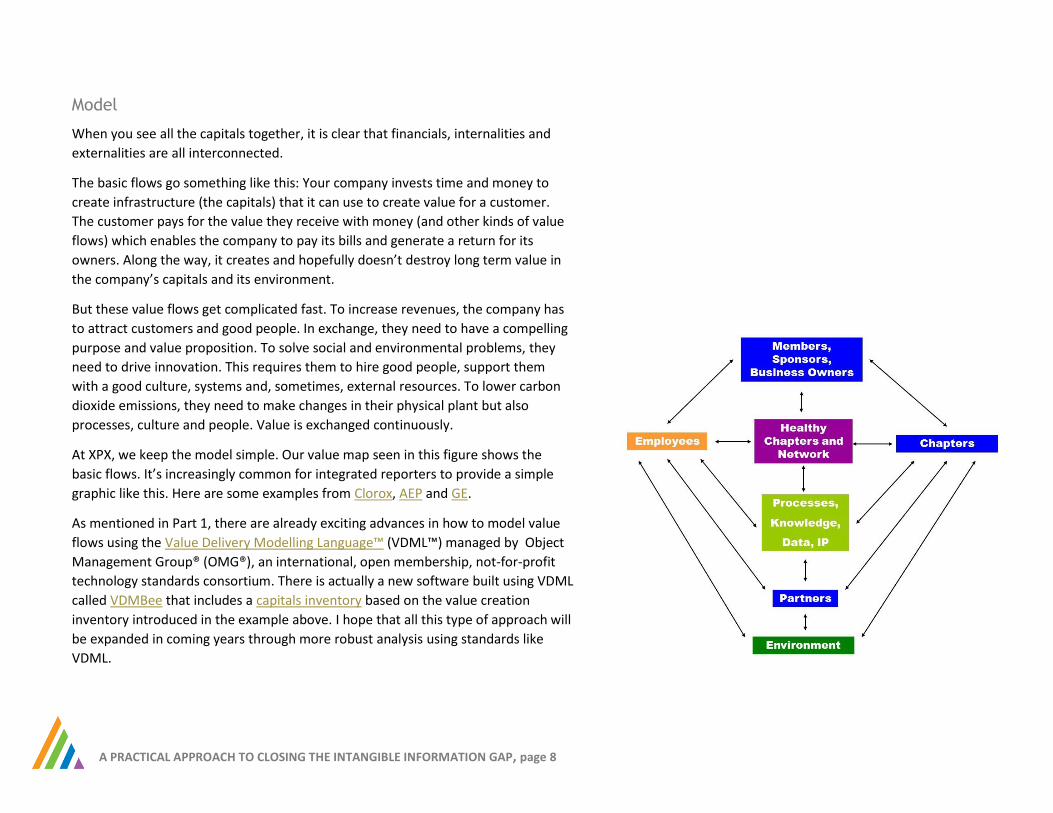
At XPX, we keep the model simple. Our value map seen in this figure shows the
basic flows. It’s increasingly common for integrated reporters to provide a simple
graphic like this. Here are some examples from Clorox, AEP and GE.
As mentioned in Part 1, there are already exciting advances in how to model value
flows using the Value Delivery Modelling Language™ (VDML™) managed by Object
Management Group® (OMG®), an international, open membership, not-for-profit
technology standards consortium. There is actually a new software built using VDML
called VDMBee that includes a capitals inventory based on the value creation
inventory introduced in the example above. I hope that all this type of approach will
be expanded in coming years through more robust analysis using standards like
VDML.
A PRACTICAL APPROACH TO CLOSING THE INTANGIBLE INFORMATION GAP, page 9
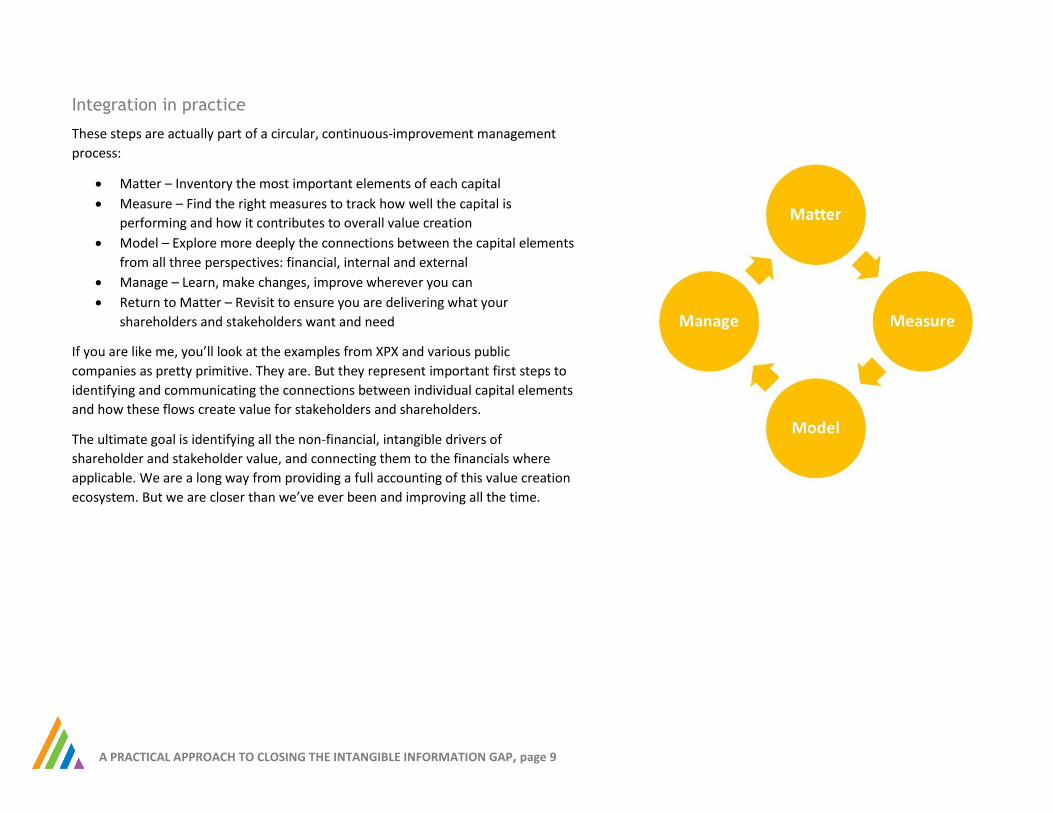
Integration in practice
These steps are actually part of a circular, continuous-improvement management
process:
Matter – Inventory the most important elements of each capital
Measure – Find the right measures to track how well the capital is
performing and how it contributes to overall value creation
Model – Explore more deeply the connections between the capital elements
from all three perspectives: financial, internal and external
Manage – Learn, make changes, improve wherever you can
Return to Matter – Revisit to ensure you are delivering what your
shareholders and stakeholders want and need
If you are like me, you’ll look at the examples from XPX and various public
companies as pretty primitive. They are. But they represent important first steps to
identifying and communicating the connections between individual capital elements
and how these flows create value for stakeholders and shareholders.
The ultimate goal is identifying all the non-financial, intangible drivers of
shareholder and stakeholder value, and connecting them to the financials where
applicable. We are a long way from providing a full accounting of this value creation
ecosystem. But we are closer than we’ve ever been and improving all the time.

A PRACTICAL APPROACH TO CLOSING THE INTANGIBLE INFORMATION GAP, page 10
SOME BENEFITS OF INTEGRATION
The dominant focus of the integration movement today is on reporting, specifically
public company reporting. But the IIRC asserts that its goal is to use integrated
reporting as a means of driving more integrated thinking. As someone who has used
a multi-capital model for over 15 years, I can attest that it indeed has applications
beyond annual reports.
The inventory, measurement and modelling exercises outlined above have a
number of applications. Here are some of the areas where I often see benefits
together with data (in italics) from a study of integrated reporters by Black Sun in
partnership with the IIRC called Realizing the Benefits (9/2014). The data in this
report confirm that the integrated movement is about a lot more than just
reporting.
Attract
Traditional branding was about “let me tell you what I think.” Today, brands need to
be a two-way street where a company actively listens to its stakeholders. And the
story it tells has to be honest about why, how and how well it does what it does. An
integrated model helps companies to tell a more complete story to attract good
customers and smart employees.
91% see an impact on external engagement, 96% on internal engagement
Align
Every organization has a necessary distribution of labor to manage different kinds of
capital. But it’s dangerous if different roles and departments get stuck in silos. An
integrated model puts all the different functions and capitals in a unified
presentation. This helps teams connect the dots among the capitals in the value
creation ecosystem to cut across organizational silos and increase teamwork.
78% see more collaborative thinking.

A PRACTICAL APPROACH TO CLOSING THE INTANGIBLE INFORMATION GAP, page 11
Accelerate
With the majority of corporate assets being intangible and outside traditional
metrics, a lot is left to judgment about what needs to be done. Each person around
a meeting table brings personal ideas from their own perspective. An integrated
model helps teams develop a 360° consensus on how all the capitals are linked using
financial, internal and external perspectives. This helps teams stop talking about
what needs to be done so they can get to work doing it.
92% see increased understanding of value creation
Account
The intangibles data above highlighted the large intangible information gap.
Financial partners fill in this gap with their own subjective analysis of the strength of
a company, its outlook and risk profile. An integrated model helps control the
conversation about the assumptions that drive the numbers. This helps companies
communicate with bankers, investors and valuators to fill in the information gap and
control conversations about corporate value and outlook.
87% believe financial capital providers better understand their strategy.
Avoid
As corporate value creation ecosystems have become more and more intangible,
the risks to those systems are all more intangible and harder to see. An integrated
model helps develop more holistic analyses to reduce systemic, reputational and
organizational risks.
68% see better understanding of business risks and opportunities.
A PRACTICAL APPROACH TO CLOSING THE INTANGIBLE INFORMATION GAP, page 12
Act
Probably most important of all, the integrated approach enables conscious action,
linking the values and purpose at the core of a company’s mission to the outcomes
it achieves and the health of its value creation ecosystem.
79% see improvements in decision making
CONCLUSION
Today, the tangible net worth of a company on the S&P 500 explains just 16% of its
total corporate value with the remainder considered “intangible” and rarely
measured in a systematic way. The multi-capital model used by the integrated
reporting movement is a solution to this intangible information gap. This paper built
on the deep dive into this information gap in Part 1.
In this Part 2 of the story, I introduced an integrated approach to filling in the
intangible information gap. This includes: Matter – identifying key capital elements
that drive value creation, Measure – approaches to measuring each element, Model
– mapping the connections between the capitals and Manage – connecting back to
the organization’s core purpose, profitability and valuation.
This kind of approach is still in its infancy. The exciting addition of VDML should help
increase the sophistication of the connectivity of financial and non-financial data. As
time goes by, we’ll get better and better at filling the intangible information gap.
Ready to try this in your own organization? Here’s a downloadable worksheet to
get you started.
Please note that additional briefing papers are available on the Smarter-Companies website.
Let me know if you want to explore how to apply these ideas in your own situation, Mary Adams, [email protected], 781-729-9650