Embed Size (px)
Citation preview

ISSN 0734-9556
Integrated Systems for Managing Potatoes in the Northeast
G.B. White and S.S. Lazarus Editors
Maine Agricultural Experiment Station University of Maine at Orono
Technical Bulletin 116 April 1986

A C K N O W L E D G M E N T S Funds to conduct this research were provided by the Agricultural Re
search Service, United States Department of Agriculture, project number NER-IPM-80-1, entitled "Integrated Systems for Managing Potatoes in the Northeast.''
Appreciation is expressed to Dr. Elson Shields, Integrated Pest Management Program, Department of Horticulture, University of Wisconsin; Dr. W.M. Dowler, Research Leader, ARS/USDA, Plant Disease Research Laboratory, Frederick, Maryland; and Dr. J.B. Wilson, ARS/USDA, U.S. Regional Pasture Research Laboratory, University Park, Pennsylvania for their helpful reviews of this manuscript.

INTEGRATED SYSTEMS FOR MANAGING POTATOES
IN THE NORTHEAST
S.S. Leach, W.E. Fry, R.T. Jones, R. Loria, R.H. Storch,
R.D. Sweet, J.P Tette, G.B. White, and R.J. Wright
Maine Agricultural Experiment Station University of Maine at Orono
Technical Bulletin 116 April 1986


iii
DIGEST
Potatoes are an extremely important crop in the Northeastern United States, accounting for nearly one-sixth of the nation's production. Many pest problems, including insects, pathogens, nematodes, and weeds affect the crop in the Northeast. Crop losses of 50 percent or more could result without protection. Growers in the region spend an estimated S20 to S30 million annually for pesticides to prevent unacceptable losses in potato production and storage.
A research project was developed to determine the feasibility of using an integrated pest management (IPM) system to improve economic and environmental benefits for the Northeast region. Research was conducted to develop and evaluate IPM techniques. These techniques were then tested, improved, and implemented in pilot programs on commercial potato farms in Suffolk County and Steuben County, New York and Aroostook County, Maine.
Major findings in the research on foliar diseases were that the use of resistant cultivars provided major benefits, but the use of late blight forecasts did not result in clear economic benefits. For soil-borne diseases, seed treatments and crop rotations were effective contol strategies for the Rhizoc-tonia disease complex. Economic studies of rotations, how ever, showed that close attention must be paid to selecting profitable crops to rotate with potatoes or adverse effects will result on growers' incomes. Insect research concentrated on yield losses and control of the Colorado potato beetle. All commercially grown potato cultivars showed significant vield losses when exposed to uncontrolled populations of Colorado potato beetles. Seasonal history data were used to show the optimal timing for control measures. Weed studies showed that suppression was provided by large dense canopies of certain potato cultivars and, furthermore, canopy density had no significant effect on relative humidity. In field experiments, late blight was sometimes, but not always, more severe in dense canopies.
Forty-three growers and over 700 hectares of potatoes were included in the pilot programs. The IPM technique used in each of the three locations varied due to pest pressure and environmental conditions, but in each location, cooperating growers were provided w ith the best available pest management information. Pilot programs generally consisted of information collection and delivers', field scouting, and environmental monitoring.
IPM techniques utilized in all pilot programs included weekly scouting, sampling and action thresholds for Colorado potato beetles and aphids, weather monitoring and late blight forecasting techniques. Populations of root lesion nematodes, Pratylenchus spp., were assessed in fields and species of this nematode were identified in the Suffolk County program. Weed rating schemes were developed for the Steuben County and Aroostook County programs In addition seed treatment guidelines were developed.


EXECUTIVE SUMMARY
The Northeast accounts for approximately 15 percent of the potato production in the United States. Potatoes in the Northeast are affected variously by at least 16 weeds, 23 plant pathogens, 18 arthropods, and 3 nematodes. Several of these pests individually are capable of causing crop losses of 50-100 percent if allowed to develop unchecked in situations favorable for the pest. More pesticides are used on potatoes in the Northeast than in any other region of the United States. The only crop which requires larger amounts of pesticides in the Northeast region is apples. Total costs for pesticides used on potatoes in the Northeast are estimated at S20 million to 330 million annually. This extensive reliance on pesticides has led to undesirable externalities. Some Colorado potato beetle populations have developed resistance to most registered insecticides. Widespread use of insecticides may have eliminated natural predators and parasites from parts of the Northeast. In addition, detection of the insecticide/nematacide aldicarb in groundwater on Long Island in 1979 demonstrated a potential hazard associated with the extensive use of some pesticides.
The externalities associated with current potato production practices suggested that the implementation of well-designed integrated pest management (IPM) svstems for potatoes has the potential to result in net economic and environmental benefits for the Northeast region. Therefore, a research project was initiated to develop IPM systems for the Northeast potato industrv. The overall objective of the research was to design efficient IPM strategies for pest species that caused the largest losses to growers in the Northeast. IPM strategies were designed to manage plant canopies to minimize weed problems; to integrate host resistance into the potato management system; to manage pesticides for beneficial effects on target and nontarget organisms with minimal use of pesticides; and to improve the economic returns in growing potatoes by the use of more efficient pest management practices. Studies were undertaken in Maine and New York that focused on the development of integrated practices for managing major foliar and soilborne disease, insect, and weed pests. Economic evaluations of selected practices and implementation strategies were conducted. IPM pilot programs were implemented on Long Island and in upstate New York; and in Aroostook County, Maine.
In studies of foliar diseases, the roles of plant resistance and canopy density on potato late blight control were investigated. Analyses of computer simulation models were made and field experiments were conducted to estimate appropriate combinations of fungicide and host resistance to suppress potato late blight. If fungicides are to be applied at regular intervals, these should be 6-7 days, 8-9 days, or 10-12 days, for susceptible, moderately susceptible, and moderately resistant cultivars, respectively. If a weather sensitive forecast is

V!
desired, a set of guidelines incorporating host resistance was developed. However, simulation analyses and field experiments did not identify a clear benefit for using a weather sensitive forecast. In addition to genetic differences, potato plants become slightly more susceptible as they mature. The influences of canopy density on late blight development were investigated in field experiments and simulation analyses. In field experiments late blight was sometimes, but not always, more severe in dense canopies than in less dense ones. Consequently, variation in canopy density is predicted to have small influence on late blight development.
For soilborne diseases, research was conducted related to reducing the incidence and severity of the Rhizoctonia disease complex (Rhizoctonia solani) and Fusarium tuber and seedpiece rot (Fusarium spp.). A combination chemical seed treatment of pentachloronitrobenzene and thiabendazol was found to disinfest seed tubers of R. solani and Fusarium spp. Biological control of R. so/ani with Laetisaria arvalis was not demonstrated. Two year crop rotations were studied as to their effects in reducing disease severity caused by R. solani. No crop significantly reduced the incidence or severity of disease caused by R. solani, but annual ryegrass consistently produced the highest percentage of marketable tubers and lowest percentage of cracked and malformed tubers. The use of seed treatments and crop rotations will, over a period of time, reduce losses associated with R. solani and Fusarium spp. on potatoes.
For insect research, studies on yield losses due to and control of the Colorado potato beetle were paramount. All commercially grown potato cultivars showed significant loss of yield when exposed to uncontrolled populations of Colorado potato beetle. The vield of tubers in two newly named cultivars, Sunrise and Yankee Supreme, was consistently higher than most other cultivars when tested under Colorado potato beetle pressure. Seasonal history data show that the periods to applv insecticides for the best control are 1) when most overwintered adults have emerged, but before oviposition is maximal, and 2) when the immature population consists of 75 percent stages 1 and 2 and 25 percent stages 3 and 4 larvae.
The principal objective of the weed research was to determine if the large, dense canopies of certain potato cultivars which give good weed suppression would also result in higher relative humidity and, thus, increase the risk of potato late blight. Before detailed research could be conducted it was first necessarv to develop special sensors that could be operated continuously within canopies with no distortion of normal conditions. An inexpensive sensor was developed which could be attached to an automatic recorder and left in place throughout the growing season. The principal factor influencing canopy relative humidity was general environmental conditions. Canopy densitv had only minor influence and often the larger, denser canopies had slightly lower relative humidity. This was associated with lower soil moisture
VII
in cultivars with large canopies. The techniques employed did not indicate whether canopy relative humidity was influenced mostly by leaf transpiration or by soil evaporation. Data were inconclusive as to whether any factors other than shade contribute to weed suppression by large dense canopies. Canopies of 15 cultivars were studied for three years. Hudson and Kennebec always were relatively large, Monona was always relatively small. The others varied in their relative size from season to season. It was not determined why this variation occurred.
The framework for economic evaluations was the costs and value of pest management information. Surveys of growers were conducted to determine pest control practices and costs prior to IPM implementation on Long Island and in upstate New York. These studies aided in estimating net benefits of selected practices and implementation strategies. An analysis simulating the use of economic thresholds as a decision rule indicated that there are many situations in which the use of economic thresholds does not lead to improved pest management practices by risk averse growers. This result was due primarily to the variability in the effects of pest density on crop loss and the lack of accuracy in the pest density — crop loss information now available to growers. Economic studies were also conducted to evaluate the feasibility of crop rotations as an IPM strategy on Long Island. We found that, as expected, as potato acreage was reduced, total pesticide use decreased by significant amounts. However, there remained a strong economic incentive for growers to continue grow ing potatoes intensively rather than changing to field crop rotations. Rotations with other vegetable crops, especially cauliflower, showed improved profit potential. An evaluation of the Steuben County IPM program was conducted, focusing on the use of Blitecast to schedule the first fungicide application of the season. It was determined that the cost of providing information about when to initiate spraying exceeded the value.
The pilot potato IPM program for Suffolk County, New York was developed and implemented during 1982-1984. In 1984, 30 growers participated in the program and a total of 370 hectares of potatoes was scouted weekly for pests. The program concentrated primarily on the Colorado potato beetle (CPB), root lesion nematodes, and aphids. CPB sampling procedures and action thresholds were developed and tested during the program. The impact of rotation with rye on CPB and root lesion nematodes was studied in commercial potato fields. Rotation with rye greatly reduced CPB densities early in the season but led to increases in nematode densities. Also, root lesion nematodes were found to be more abundant on the South Fork of Long Island than on the North Fork. Sampling procedures and action thresholds for aphids were adopted from the upstate New York potato IPM program and used successfully in the program. In 1984, it was shown that growers who followed recommendations based on action thresholds for CPB and aphids

viii
used fewer insecticide applications than growers not following recommendations. In all cases, adequate insect control was achieved. Participating growers have been positive about the program and indicate an interest in continued involvement.
A pilot integrated pest management program for upstate New York was conducted in Steuben County. Crop protection knowledge from several disciplines was evaluated in commercial fields. Observations of insects, diseases, and weeds were made weekly throughout the growing season and weather data were collected to aid in the forecasting of pest problems. Reports were issued weekly to each grower on the condition of his fields. The program provided benefits to research scientists, extension specialists, and growers. Grower interest and acceptance were documented by their willingness to contribute funds to support field scouts.
Four growers in 1982 and three in 1983 participated in the Maine pilot program in northern Maine. At each location a field was selected and divided into paired plots. On one plot normal spray practices were carried out and on the other, recommendations of the IPM program. A comprehensive scouting program was initiated with each grower and included scouting for insects and disease, recordkeeping, running Blitecast, and reporting findings to growers. There were no differences in amounts of pesticides used but timing of pesticide applications was improved.

ix
TABLE OF C O N T E N T S
DIGEST iii EXECUTIVE SUMMARY v EISTOETABEES . xiii LIST OF FIGURES . xiv INTRODUCTION 1
Potato Production Systems in the Northeast . . ] Long Island . . . . 3 Upstate New York. . . 3 Northern Maine . . 3
Description of Pest Management Problems 4 Insects 4 Diseases S Nematodes 10 Weeds 10 Pesticide Use . . . 11
Purpose and Objectives of Research 11 Integrated Pest Management Defined 12
RESEARCH 13 Foliar Disease 13
Use of Resistant Cultivars . . . 13 Canopy Density 15 Roles of Disease Forecasts in Potato Late Blight Management 16
Soilborne Pathogens 22 Rhizoctonia Disease Complex 22 Eusarium Seedpiece Decay and Tuber Rot . . 24 Control Strategies for Soilborne Pathogens 25
Insects . . . . . . . . 26 Initial Testing of Action Thresholds 26
Potato-infesting Aphids 26 Colorado Potato Beetle . . 26
Colorado Potato Beetle Studies 26 Weeds . . 30
Objectives . . . . 31 Relative H u m i d i t y and Light In te rcept ion by Canopies 31 Sources of Moi s tu re in Canopy R H 33 Light In te rcep t ion and Related Factors Influencing
Weed Suppression 36 Characterization of Cultivar Canopies 36
Economics . . 39 Costs and Value of Information . . 40
The Value of Economic Thresholds 41

Baseline Data: Pest Control Practices and Costs Economics of Rotations . . Evaluation of the Steuben County (upstate New York)
IPM Program IMPLEMENTATION
Long Island Pilot IPM Program The IPM Program Procedures . .
Field selection and scouting Environmental monitoring Grower practices Information delivery
Results . . Evaluation of Crop Rotation CPB Sampling Requirements Foliar Diseases Evaluation of the Program . .
Upstate New York Pilot IPM Program The IPM Program . . . Procedures
Field Scouting Environmental Monitoring Information Collection and Delivery Grower Practices
Results Disease Studies . . . . Insect Studies Weed Studies Comparison of IPM vs. Non-IPM Growers Analysis of IPM Growers' Pesticide Use Evaluation of the Programs
Northern Maine Pilot IPM Program The IPM Program Procedures
Environmental Monitoring Information Delivery
Results Seed Quality Blitecast Insects Evaluation of the Program . .
FUTURE DIRECTIONS LITERATURE CITED
44 46
53 55 55 55 55 55 57 57 57 58 5S 59 63 63 64 64 64 64 64 65 65 65 65 66 66 66 67 69 69 69 70 70 7(1 70 70 70 71
. 73
. 73
. 75

\i
APPENDIX A - L o n g Island Pilot IPM Program Report Form, 19SM9N4 . . . . 83
APPENDIX B-Upsta te New York Pilot IPM Program S4 — 19S5 Scouting Procedures . . . . . S4 — Grower Report Form . . 89
APPENDIX C - P o t a t o IPM Field Guide to Action Thresholds for Disease and Insects 91


xiii
LIST OF TABLES
Number Title Page 1. Average annual hectares of potatoes (harvested), yield, total 2
production, and sales, 1979-83, 10 Northeastern States and the United States.
2. Major insects, diseases, nematodes, and weeds that affect 5 potatoes in the Northeastern United States.
3. Resistance of potato cultivars to late blight. 14 4. Decision rules for the simulation forecast. 17 5. Blight units for the simulation forecast. 18 6. Fungicide units for the simulation forecast. 19 7. Average percent defoliation from late blight and average 21
number of fungicide applications for 10 simulated seasons for blightcast and 7-dav interval.
S. Evaluation of pentachloronitrobenzene, thiabendazole, and 24 combinations of both chemicals as liquid seed treatments on field stand and the Rhizoctonia disease complex.
9. Insecticide treatments and numbers of Colorado potato 27 beetle larvae and adults in test plots during the 1981 and 1982 growing seasons.
10. Average numbers of Colorado potato beetle egg masses, 29 larvae, and adults in test plots during the 1983 and 1984 growing seasons.
11. Yield of tubers and visual defoliation rating of plants fed 29 upon by Colorado potato beetles during the 1983 and 1984 growing seasons.
12. Hours canopies were above 90 percent relative humidity 33 during three consecutive 24-hour days, August 22, 23, 24, 1982
13. Level of relative humidity 2, 24, and 48 hours after irrigation. 15 14. Soil moisture 12.7 centimeters deep (500 ohms resistance) 35
before and after irrigation, 1984. 15. Light intensity and weed presence at vine close-in and at 37
fall-over. 16. Early canopv width and days to close-in, 1982 and 1983. 38 17. Canopy size as measured by top dry weight in 1982, 1983, 38
and 1984. 18. Percent light interception between plants, 1982. 39 19. Use of systemic insecticides on chipping and tablestock 45
potatoes, upstate New York, 1980.
20. Total and per hectare costs for pesticides, three study areas 47 in New York, 1981.

xiv
Number Title Page 21. Budgets for a hectare of the potato-cauliflower rotation, 49
North Fork, Suffolk County, New York, 1982. 22. Optimal rotations with limitations on maximum potato 51
production, field crop rotations, North Fork, Suffolk County, New York.
23. Optimal rotations with limitations on maximum potato pro- 52 duction, field crop and cole crop rotations, North Fork, Suffolk County, New York.
24. Average first spray dates: participating vs. nonparticipating 54 growers, upstate New York, 1984.
25. Colorado potato beetle action thresholds for fresh market 57 potato production, Long Island.
26. Effect of field location and rotational history on Pratylenchus 60 spp. populations in commercial potato fields on Long Island.
27. Pesticide usage by potato IPM growers, 1982 (Steuben 67 County).
28. Pest control information for potato IPM growers, Steuben 68 County (1980, 1981, 1982, 1983, 1984).
29. Potato IPM pilot project, Florida virus test results, 1982- 72 1983, northern Maine.
LIST OF FIGURES Number Caption Page
1. Percentage of the Colorado potato beetle population in egg 28 mass, larval, or adult stadia during the 1983 and 1984 growing seasons.
2. Relation of value of production, control costs, and pest pop- 40 ulation.
3. Comparison of Colorado potato beetle (CPB) population 59 dynamics, insecticide usage, and defoliation levels on rotated and nonrotated fields.
\. Relationship of sample size (n), precision level (S.E./mean), 62 and mean density for Colorado potato beetle (CPB) adults, small (first and second instar) and large (third and fourth instar) larvae.

Maine Agricultural Experiment Station Technical Bulletin 116 1
Integrated Systems for Managing Potatoes in the Northeast
By S.S. Leach, W.E. Fry, R.T. Jones, R. Loria, R.H. Storch,
R.D. Sweet, J.P. Tette, G.B. White, and R.J. Wright*
I N T R O D U C T I O N
Potatoes are produced commercially in the Northeast in 10 states: Maine, Vermont, Connecticut, Massachusetts, Rhode Island, New York, Pennsylvania, New Jersey, Maryland, and Delaware. Potato production in the region averaged an annual 2,168 thousand metric tons with average annual sales of S237 million for the period 1979-83 (Table 1). Hectares harvested have averaged 78,713 for these states with an average yield of 27.54 metric tons per hectare. As a percentage of the U.S., the 10 northeastern states accounted for 15.8 percent of the area, 14.4 percent of the production, and 15.4 percent of the sales. An average of 76 percent of the land in potato production in the Northeast has been concentrated in Maine and New York.
Potato Production Systems in the Northeast
Potato production systems in the Northeast can be divided into three general types (Fry et al., 1979). The first system is practiced in Delaware, Maryland, and New Jersey where growers plant in early spring and harvest in midsummer for immediate sale. The second system applies to Pennsylvania, New York, and New England. Potatoes in these states are planted in late spring and harvested in the fall for processing or fresh market. In the third system, growers in northern New York and northern Maine produce seed potatoes. Producing for seed requires extremely low incidence of disease and
*S.S. Leach and R.H. Storch are Research Plant Pathologist. ARS/USDA Northeast Plant, Soil, and Water Laboratory, and Professor, Department of Entomology, University of Maine at Orono; W.E. Fry, R.D. Sweet, and G.B. White are Professor, Department of Plant Pathology, Professor, Department of Vegetable Crops, and Associate Professor, Department of Agricultural Economics, Cornell University; R.T. Jones is Extension Specialist, Kentucky Cooperative Extension Service; and R. Loria and R.J. Wright are Assistant Professor, Department of Plant Pathology, and Research Associate, Department of Entomology, Cornel] University. Long Island Horticultural Research Laboratory. J.P. Tette is Leader. Integrated Pest Management Support Group, New York State Agricultural Experiment Station at Geneva, New York.

Maine Agricultural Experiment Station Technical Bulletin 116
Table 1. Average annual hectares of potatoes (harvested), yield, total production, and sales, 1979-83, 10 northeastern States and the United States.
Hectares Yield Total State Harvested Per Hectare Production Sales
(M.T.) (100 M.T.) (51,000) Connecticut 720 25.69 185 2,140 Delaware 2,145 25.22 541 8,873 Maine 42,169 27.59 11,636 108,122 Maryland 688 20.64 142 2,462 Massachusetts 1,376 23.84 328 3,865 New Jersey 3,335 26.75 892 12,366 New York-Long Island 7,600 30.62 2,327 29,867
Upstate 10,117 28.91 2,925 35,905 Pennsylvania 9,065 25.50 2,312 29,539 Rhode Island 1,255 26.69 335 3,450 Vermont 243 23.87 58 590 All Northeastern States 78,713 27.54 21,681 237,179 Total United States 499,911 30.22 151,078 1,538,971 Percent Northeast of
the United States 15.8% 91.17c 14.4% 15.4%
SOURCE: Crop Reporting Board, Statistical Reporting Service, 1°S4.
insects. Since the pest management needs of seed producers are so rigorous, and because seed production accounts for less than 25 percent of the potato acreage in the Northeast, the thrust of this project was directed primarily toward potatoes for fresh market and processing.
Much of the potato acreage in the Northeast, especially in Maine and Long Island, New York, is grown in monoculture rather than in rotation. Monoculture increases Colorado potato beetle {Leptinotarsa decemlineata [Say]) populations and aggravates the chronic problems of soil erosion and nutrient leaching. Furthermore, monoculture greatly increases the difficulty of controlling potato pests which are soil-perpetuated, including such diverse organisms as golden nematodes and perennial weeds. Two serious constraints discourage rotational systems. These are (a) the lack of alternative crops that will provide net returns equivalent to potatoes, and (b) the necessity of maintaining highly acidic soils to reduce damage from common scab caused bv Streptomyces scabies.
The research reported in this bulletin focused upon the production areas of Long Island, New York; upstate New York; and northern Maine. A brief description of the production and marketing systems in each of these areas follows.

Maine Agricultural Experiment Station Technical Bulletin 110 3
Long Island
An average of 7,600 hectares of potatoes was grown on eastern Long Island during 1979-83 (Table 1); however, by 1984, the production area had decreased to 5,700 hectares. The crop consists almost entirely of cultivars with round white tubers, primarily 'Superior and 'Katahdin,' which are marketed as tablestock. The climate and soils of Long Island are favorable for potato growth; some farms have the potential for producing yields of over 35 metric tons per hectare. However, severe pest problems and the lack of effective controls have suppressed yields and increased production costs. The area planted to potatoes has decreased dramatically over the past 12 years due to the pest problems mentioned above, as well as the competing demand for land for other agricultural and nonagricultural uses.
Long Island is one of the few locations in the United States where the golden nematode, Globodera rostochiensis (Wollenweber) Mulvey and Stone, is found. Groundwater pollution by pesticides such as aldicarb, carbofuran, and oxamyl, has resulted in the loss of their use on Long Island. This limits the grower's ability to effectively manage certain pests such as the Colorado potato beetle, Leptinotarsa decemlineata, and the lesion nematode, Pratylenchus spp.
Upstate Xeir York
The area planted to potatoes in upstate New York has averaged 10,117 hectares in recent vears (Table 1). Potatoes grown for potato chip processing account for a large portion of the acreage. Potatoes are commonly grown in rotation with other crops such as small grains and clover. Yields have averaged about 29 M T per hectare. The production in Upstate is concentrated in and around Steuben County, with other production occurring in Wayne and Ontario Counties. Present pest control practices consist of rotation, treating the soil and seed pieces with pesticides, and spraying pesticides on foliage during the growing season. Cultivation and hilling practices are used to combat weed pests and some acreage is planted to nematode-resistant varieties.
Northern Maine
Maine has long been known as the leading potato producing state. In the early 1950's, Maine produced more potatoes than any other state, accounting for 22 percent of the total United States production. By 1979, Maine had slipped from first to third place. In recent years, Maine has accounted for just eight percent of total production. Since 1977, Maine's producing area decreased from 50,200 hectares to 38,000. Yields have remained at about 28 MT per hectare since the early 1950's.
Approximately 90 percent of Maine's potato acreage is in the northern area, Aroostook County, with 60 percent of this acreage concentrated within

4 Maine Agricultural Experiment Station Technical Bulletin 116
14 miles of Presque Isle. The four major potato varieties grown in this area are Superiors (25 percent), Russet Burbanks (23 percent), Ontarios (19 percent), and Katahdins (14 percent). They are marketed primarily for tablestock, but also for processing and seed.
The concentration of potatoes in a largely monoculture environment has led to an economy that is very dependent upon the potato market with few economical crop alternatives for northern Maine. Pesticides have been the primary means of controlling pests since monocultures make integrated management of potato pests extremely difficult.
Major pest problems include several soil and seedborne fungal diseases and late blight. Northern Maine is one of the few places in the east where the Colorado potato beetle (Leptinotarsa decernlineata) has not become a limiting factor in potato production; however, during the past seven years, this pest has become more prevalent. Because of the importance of seed production in northern Maine, aphid control to reduce virus spread is a major concern and accounts for a majority of insecticides applied to potatoes. Weed control is accomplished with herbicides and cultivation. Compared to other major potato production areas, weed control is not a major problem due to the short growing season and the limited number of weed species.
Description of Pest Management Problems in the Northeast
Potatoes are afflicted by a range of insects, diseases, weeds, and nematodes which reduce yield, interfere with harvest, and lower crop quality. These pests include 16 weeds, 23 plant pathogens, 18 arthropods, and 3 nematodes. Several of these pests are individually capable of causing crop losses from 50-100 percent if allowed to develop unchecked in situations favorable for the pest. In addition, potatoes are vegetatively propagated and pests which are systemic (primarily pathogens) can be brought into the field by infested seed tubers. To reduce losses from this source, a special seed production segment of the potato industry has developed. State regulatory agencies and Land Grant Universities have played important roles in developing and maintaining a source of high quality, disease-free seed for commercial potato growers.
Major potato pests in the Northeast and estimated potential associated losses are shown in Table 2.
Insects
One hundred and one potato insect pests are recorded for North America (Simpson, 1977). Potato infesting aphids Macrosiphum euphorbiae (Thomas), (the potato aphid); Myzuspersicae (Sulzer), (the green peach aphid); and the Colorado potato beetle (Leptinotarsa decern lineata) (Say), are annual, primary pests in most of New England. In addition to the potato and green peach aphids, the buckthorn aphid (Aphis nasturtii) (Kaltenbach) is an annual pest

Maine Agricultural Experiment Station Technical Bulletin 116 5
Table 2. Major insects, diseases, nematodes, and weeds that affect potatoes
in the Northeas tern United States.
Percentage Common Name Scientific Name Crop Loss Comments
Insects
Colorado potato Leptinotarsa 0-100",. major potato insect in beetle decemlineata in southern section of
region; rapidly develops resistance to insecticides.
Green peach aphid Myzus persicae 5-10% (occasionally up to 50%)
transmits virus
Potato leaf hopper Empoasca fabae 5-10% Feeding losses
Diseases
Early blight Alternaria 0-100% Late blight treatsolani ments with protectant
fungicides provide adequate control. Infection of tubers lowers crop quality.
Fusarium seed Fusarium spp. 5-60% Chemical controls decav and tuber rot available. Late blight Phytophthora 0-100% Although fungicides
infestans usually prevent crop losses, they do not always do so. Tuber infections lower crop quality and may lead to problems in stored potatoes.
Rhizoctonia Rhizoctonia 2-50% Chemical controls disease svndrome solani available. Lowers
tuber quality. Verticillium wilt I 'erticillium 0-50% Causes early-dying
spp. syndrome.
Common scab Streptomyces Affects tuber appearscabies ance. No reliable
chemical controls.

Maine Agricultural Experiment Station Technical Bulletin lift
Table 2 —continued.
Percentage Common Name Scientific Name Crop Loss Comments
Nema todes
Golden nematode Globodera 1-100% Economic losses exrostochiensis treme because of
quarantine. Root lesion Pratylenchus 0-50% Aggravates problems nematodes penetrans with verticillium wilt.
Weeds
Barnyardgrass Echinochloa 0-75%a Chemical controls crus-ga/li available.h
Lambsquarters Chenopodium 0-75%' Chemical controls album available.h
Quackgrass Agropyron repens 0-100%a Chemicals control available.11 Rhizomes may penetrate tubers.
Redroot pigweed Amaranthus 10-75%" Chemical controls retroflexus available.h
Yellow nutsedge Cyperus 0-100%" Chemical controls esculentus available.11 Rhizomes
may penetrate tubers.
"Losses from weeds usually are from reduced yields and increased harvesting costs. However, when severe tuber damage occurs from rhizome penetration, entire fields may be classed as culls. All potato growers use mechanical cultivation for weeds. Many also use chemicals. None rely
solely on chemicals.
in northern New England. The potato leafhopper (Empoascafabae) (Harris) commonly occurs in southern New England. Other insect pests are sporadic in occurrence and are considered to be secondary pests.
Potato and buckthorn aphids colonize potato plants early in the growing season (Shands, Simpson, and Wave, 1972; Shands and Simpson, 1971; respectively). Green peach aphids appear late in the growing season and continue to increase in number until harvest (Shands, Simpson, and Wave, 1969). The green peach aphid is the most efficient vector of potato leafroll virus(PLRV), potato virus A (PVA), and potato virus Y (PVY). The potato aphid readily transmits PVAand the buckthorn aphid is an efficient vector of PVA and PVY. The spread of PLRV in fresh market and processing potatoes is important in cultivars (such as Russet Burbank, Green Mountain) which produce tubers showing an internal net necrosis (Peters and Jones, 1981). In fresh market and processing potato producing areas, it is also important to

Maine Agricultural Experiment Station Technical Bulletin 116
keep aphid populations below the level where winged forms are produced because the winged aphids can migrate into seed producing areas on low-level jet streams.
In areas where seed potatoes are produced in addition to fresh market and processing potatoes, more stringent aphid control is required. When aphids become crowded and the quality of the host plant changes, adults with wings are readily formed (Dixon, 197?) and dispersed, spreading diseases within and between fields (Storch, 1981). Planting disease-free seed and keeping aphid populations below the level of winged adult production reduces the possibility for spread of aphid-borne potato viruses. No insecticide available will kill aphids before they can transmit the viruses to the plant (Storch, IC)S1). It could also be important to suppress the formation of winged aphids in fresh market and processing potato producing areas distantly located from seed producing areas. Long-distance (several hundred miles) aphid migrations are known to occur (Berry and Taylor, 1968) and it is difficult to prevent aphids from migrating into the seed producing areas on low-level jet streams.
Control of potato infesting aphids is primarily achieved bv insecticides. Potato aphid populations are often reduced late in the growing season by naturally occurring entomophagous fungi, but buckthorn and green peach aphid populations are less frequently affected by the fungi (Shands, Simpson, and Hall, 1963; Shands, Simpson, Hall, and Gordon, 1972). The suppression of aphid population growth by naturally occurring internal parasitoids is relatively unimportant (Shands, Simpson, and Gordon, 1972) and aphid control by native predators is often below a commercially acceptable level (Shands, Simpson, Wave, and Gordon, 1972). The yield of tubers, however, from untreated plots where parasitoids, pathogens, and predators affect aphid populations are not always significantly lower than the yield from insecticide-treated plots, but the numbers of winged aphids are usually higher in untreated than in insecticide-treated plots.
Overwintered adult Colorado potato beetles (CPB) emerge from hibernation sites just prior to or at plant emergence. Eggs are laid after the adults have fed for a short time. The larval development is completed in several weeks. In northern New England one and sometimes part of a second generation develops annually, while in the southern areas of the region two or sometimes three generations occur each year. Defoliation of potato plants by CPB feeding at certain stages of the plant's growth greatly affects yield (Hare, 1980). An algorithm relating the development of CPB populations to tuber yield in the cv. Superior has been developed (Logan and Casagrande, 1980). Rotation with non-solanaceous crops can greatly reduce early season CPB densities in the following potato crop (Wright, 1984; Lashomb and Ng, 1984). Some fungicides and herbicides used in potato production have insecticidal activity which may be useful in CPB management (e.g., triphenyltin hydroxide fungicides [Hare et al, 1983] and dinoseb vinekillers/herbicides.)

8 Maine Agricultural K\periment Station Technical Bulletin 11ft
Colorado potato beetle control is accomplished primarily by insecticides. The native biological control agents Doryphorophagadoryphorae (Riley) and a pentatomid (species being identified) have been found in Maine but do not provide adequate CPB control. Studies on CPB control with the egg parasite Edovum puttleri Grissell, the mite Chrysomelobia labidomerae Eickwort, the pathogen Reauveria bassiana (Balsamo), and other natural control agents are in progress, but these agents are not readilv available to commercial potato growers.
Diseases
There are more than a dozen different pathogens (viruses, viroid, bacteria, and fungi) which affect the foliage of potato plants in northeastern United States (Hooker, 1981). In the absence of any measures to suppress their occurrence, these pathogens could individually suppress potato yields to 50 percent or, in a few cases, to less than 10 percent of the potential.
The presently effective seed tuber certification programs, and the use of certain seed potato production practices, limit the impact of potato viruses A, X, Y, leafroll, and potato spindle tuber viroid. These agents are transmitted via seed tubers, as well as by other means. The impact of bacteria which cause ring rot, soft rot, and black leg is also limited by seed certification programs. Seed certification programs are generally less effective in suppressing diseases induced by fungi.
Among the foliar pathogens, the most important are Phytophthora infestam (Mont.) D By, which causes late blight, and Alternaria solam (Ell and G. Martin) Sor, which causes early blight. Late blight and early blight are the major reasons that fungicides are applied to potatoes in northeastern United States. Late blight is a major concern to growers because the disease can increase so rapidly, and because disease in the foliage can lead to tuber infections. When infected tubers are stored, soft rotting bacteria often colonize late blight lesions and create a significant soft rot problem. Consequently, growers tolerate an extremely low level of late blight in the harvested crop. Late blight can be severe during any part of the season when inoculum is available and weather conditions are favorable (15.5-26.6° Centigrade, with abundant moisture).
Late blight is the primary reason for protectant fungicide application in northeastern United States, and regular applications which suppress late blight also suppress early blight. In many locations, these applications occur weekly. Fungicides used to suppress these diseases accounted for about 30 percent of all the fungicide used bv farmers (Andrilenas, 1974).
An integrated management program for potato late blight has been developing over the past several years. Some components of the program limit the initial inoculum of the pathogen at the beginning of each season. These components include: destruction of the infected volunteer potatoes, destruc-

Maine Agricultural K\periment Station Technical Bulletin 116 9
tion of infected cull potatoes, and use of pathogen-free seed tubers. Other components limit pathogen and/or disease development during the season. Cultural practices, such as hilling the plants, decrease the probability of tuber infection. Plant resistance has a potentially significant role, and guidelines to use such resistance are developing. Resistance which appears to have the most stable effect is that which is apparently nondifferential (it is effective against all pathogen isolates). This resistance is not caused by R-genes and is termed horizontal, polygenic, rate-reducing, field, or general (Thurston, 1971; Van der Plank, 196S).
Recently, early blight has become a more noticeable problem in the Northeast — perhaps due to the greater use of susceptible varieties. Early blight is tvpicallv most important during the latter part of the growing season. Senescent plants are much more susceptible than are juvenile ones, while stressed plants (due to lack of water, insufficient nutrients, or extreme temperatures) are more susceptible than are nonstressed ones (Mackenzie, 1981).
Although Altemaria solaru has not developed resistance to the commonly used protectant fungicides, the hazard of single tactic disease suppression is recognized and other control strategies are being used or investigated. The strategies include rotation, resistant varieties, and pathogen-free seed tubers. Other components, such as disease forecasting, are being investigated (Stevenson, 19S3).
The research in this project focused on potato late blight because of the destructive potential of this disease, the large amount of fungicide used in its suppression, and the availability of components to develop an effective, integrated management program. Future research will extend these studies to potato earlv blight and several potato viruses.
Soilborne diseases of potatoes generally occur in endemic proportions but can become epidemic under optimum conditions in the Northeast. Common scab {Streptomvcesscafa'es[Thaxter]\\'aksman et Henrici) and Verticillium wilt (Verticillium spp.) are two which most often occur in epidemic proportions. The Rhizoctonia disease complex (Rhizoctonia solani Kuhn), and Fusarium seed piece decay and dry rot (Fasarium spp.) usually occur only in endemic proportions. However, losses caused by these pathogens each year range between 5 and 15 percent. These losses are due to reduced stands, lower yields, poor tuber quality, postharvest rots, and poor appearance. Since these pathogens are omnipresent and produce "minor losses", less attention has been given to them than to scab and Verticillium wilt. In recent years, growers and researchers have become more aware of the effects these pathogens have on yield and quality and are attempting to reduce their effects on potato production.
Most integrated pest management systems in the past have concentrated on foliar diseases and insects. Soilborne diseases were included in this study

10 Maine Agricultural Ksperiment Station Technical Bulletin 116
because they dramatically increase production costs of potatoes in the Northeast. Since many researchers in the country are concentrating on control measures for common scab and Verticillium wilt, this research effort focused on the management of Rliizoctoniaso/aniand Fusarium spp. The specific areas chosen for study were seed contamination, chemical and biological agents as seed treatments, availability of resistance, and effects of modifying soil inoculum through rotation.
Nematodes
The major nematode pest occurring in the region is the golden nematode, Globodera rostochiensis. Long Island is one of the few locations in the U.S. where the golden nematode is found. This nematode is a quarantined pest. Regulations affect cultivar selections, seed availability, pesticide use, and marketing options on infested land. This, in turn, affects growers' competitive position in the market. Discovery of a pest on a single farm in a producing region severely restricts the marketing options for all growers in that region, and can result in losses of up to 100 percent because of quarantine. Pratylenchuspenetrans (Cobb, 1917) Filipjer and Schuurmans Stekhoven, 1941, is also an important pest in sandy soils and acts synergisticallv with Verticillium species in the "early aging' complex (Riedel et al., 1985).
Weeds
Weeds can be categorized into three general groupings: annual grasses, broadleaf annuals, and perennial weeds.
Annual broadleaf weeds and grasses reproduce bv seeds. The broadleaf weeds that are problems in potato fields in the Northeast are considered cool season weeds. These weeds germinate and produce rapid seedling growth even when soil temperatures are relatively cool. Lambsquarter [Chenopodium album [L].) and Redroot Pigweed (Amaranthus retroflexus [L.]) are major annual weed pests in the Northeast.
Annual grasses, on the other hand, germinate and grow best later in the season when temperature increases. Barnyard grass {Echinochloa crus-galh [L.] Beauv.) is one such grass which is significant in the Northeast.
Yellow nutsedge (Cyperus esculentus [L.]) is somewhat like the annual grasses with regard to temperature response. However, this weed reproduces primarily by underground tubers which are produced in abundance during the latter part of the growing season and are distributed within and among fields by farm equipment and other mechanical means.
Quackgrass (Agropyron repens [L.] Beauv.) is a perennial which is most prevalent in areas where land is in sod for several years prior to potato planting. It reproduces mainly by underground rhizomes, but seed in hay, bedding, and manure is a major means of spreading. Quackgrass makes rapid

Maine Agricultural Experiment Station Technical Bulletin I 16 II
growth during the cool, moist seasons of spring and fall. Once established, it is difficult to control.
Pesticide Use
Primarily due to weather which is favorable to several pests, more pesticides are used on potatoes in the Northeast then in any other region of the U.S. Over half of all fungicides and herbicides used on potatoes in the U.S. are applied in the Northeast. A large proportion of total agricultural pesticides applied in the Northeast is used on potatoes — 34 percent of fungicides, 18 percent of herbicides, and 11 percent of insecticides (Andrilenas, 1974). The only crop in the Northeast which requires more fungicides and insecticides is apples. The cost of pesticides on a limited number of farms in 1981 in New York was 5240 per hectare for Steuben County (15 farms), 3356 per hectare for Wayne County (10 farms) (Fohner and White, 1982), and 5850 per hectare for Long Island (S farms) (Fohner and White, 1981). Pesticide costs for Maine growers in 1980 were estimated at 5264 per hectare (Zepp, 1982). Total costs for pesticide materials used in these 10 states in the Northeast probably range from 520 million to 530 million annually.
This extensive reliance on pesticides has led to undesirable externalities. For example, Colorado potato beetle populations in the lower New England states, Long Island, and New Jersey have developed resistance to most registered insecticides. Widespread use of insecticides may have eliminated natural predators and parasites of the beetle from parts of the Northeast. Since it is increasingly expensive to register new compounds, especially for minor crops, it is important to rationally use compounds which are currently effective and avoid similar problems with other pests. Detection of the insecticide aldicarb in groundwater on Long Island in 1979, and subsequent discoveries elsewhere, demonstrated that the extensive use of this insecticide is a potential health hazard, especially when potato production is located in close proximitv to population centers. The externalities associated with current practices suggest that the implementation of well-designed integrated pest management (IPM) systems for potatoes has the potential to result in net economic and environmental benefits for the Northeast region.
Purpose and Objectives of Research
The high usage of pesticides in potato production in the Northeast indicates that management methods need be devised to maximize their effectiveness and reduce their usage, thus reducing costs to the grower and contamination of the environment. To achieve these goals, a research project was conducted to develop IPM strategies for the Northeast potato industry. In this project, strategies were devised and tested to better manage pesticide use on potatoes.

12 Maine Agricultural I'.xperiment Station Technical Bulletin 1 Id
This included determination of pesticide actions on target and nontarget organisms.
Research objectives were to design efficient IPM strategies for pest species that cause major losses in the Northeast. IPM strategies were designed to accomplish the following:
1. Manage plant canopies to minimize pest problems; 2. Integrate host resistance into the potato management system; 3. Manage pesticides for beneficial effects on target and nontarget organ
isms with minimal use of insecticides, fungicides, and herbicides; and 4. Use efficient pest management practices to improve the economic
returns of growing potatoes.
Integrated Pest Management Defined
The operational definition which guided our research was adapted from Apple et al. (1979). IPM refers to the use of multiple tactics in a compatible manner to maintain pest populations at levels below those causing economic injury while providing protection against hazards to humans, domestic animals, plants, and the environment.
Integrated meant that a broad interdisciplinary approach was taken using scientific principles of plant protection to fuse into a single system a variety of management strategies and tactics. This integration of techniques had to be compatible with the total potato production and marketing systems.
Pests included all biotic agents (i.e., insects, nematodes, weeds, bacteria, fungi, viruses, and parasitic seed plants) which adversely affect potato production.
Management was the decision making process to control pest populations in a planned, systematic way by keeping their numbers or damage below economically acceptable levels.
Tactics included chemical, biological, cultural, physical, genetic, and regulatory procedures.
The goal oi integrated pest management was to optimize pest control in relation to the total plant production system in the light of overall economic, social, and environmental conditions.
Thus, integrated pest management, in its ideal form, strives for maximum use of naturally occurring control forces of the pest's environment, including weather, pest diseases, competition (antagonism), predators, and parasites. In order to enhance these natural forces, we attempted to investigate a wide variety of manipulative techniques such as soil tillage, crop rotations, resistant varieties, forecasts, and other information. Chemicals were included judiciously to minimize destruction of beneficial organisms. Pesticides were recommended only when thresholds were exceeded as estimated by assessment through pest-monitoring techniques.

Maine Agricultural Experiment Station Technical Bulletin 116 13
RESEARCH
Foliar Diseases
The eventuality of a late blight epidemic is determined by several factors. An integrated approach can influence several of these factors and thereby suppress the disease effectively. Late blight is not a problem when inoculum at the beginning of the season is very low, when host resistance is very effective, when effective fungicides protect plants, or when the weather is unfavorable for the late blight organism, Phytophthora infestans. Except for the weather, these factors are manipulable. The pathogen population at the beginning of the season can be kept low by planting healthy seed tubers and by removing infected cull potatoes, infected volunteers, or infected plants in neighboring fields. Unfortunately, complete achievement of this goal is difficult in practice. Use of resistant plants aids considerably in suppressing late blight, but most commercially desirable cultivars are susceptible. The historic dependence on fungicides to suppress late blight is interpreted by some observers to mean sole reliance on this tactic, and it causes some people to suggest that fungicides are used inefficiently. Although the weather cannot be manipulated, several weather-related activities contribute to the efficiency of late blight suppression. These include using a weather sensitive forecast for fungicide application and adjusting disease management techniques to complement the influence of the potato canopy. Research in this project was done to develop reliable guidelines for using resistant cultivars, to determine the influence of canopv density, and to develop more effective disease forecasts.
Use of Resistant Cultivars
The type of resistance most useful in suppressing potato late blight is "field" or "general" resistance: the fungus develops more slowly and reproduces less rapidlv on these plants than on susceptible ones. "Specific" or "single-gene" resistance has not been reliable because the fungus has been able to overcome it, leading to a breakdown in control. The overall effect of field resistance is to slow the rate of epidemic development. Hence, the resistance is sometimes termed rate-reducing. The effect of field resistance is similar to the effect of regular protectant fungicide applications. Differences among cultivars have been quantified in terms of "fungicide equivalents" (i.e., the amount of fungicide applied to a susceptible cultivar which suppresses disease to the same level as that in the resistant cultivar in the absence of fungicide). For example, the resistance in moderately resistant cultivars has an effect equivalent to 0.5 kg fungicide (mancozeb) applied weekly to a susceptible cultivar. If weekly applications of 1.8 kg mancozeb per ha suppress late blight on a susceptible cultivar, then only 1.3 kg mancozeb per ha are required for moderately resistant cultivars (Fry, 1978).

14 Maine Agricultural Experiment Station Technical Bulletin 1 \<>
In addition to adjustment of fungicide dosage, fungicide application frequency could be adjusted to complement host resistance. Research in this project identified guidelines for adjusting application frequencies. Based on computer simulation models of disease development and fungicide deposition and redistribution (Bruhn and Fry, 1981; 1982a; 1982b), we predicted that susceptible cultivars should be sprayed every 6-7 days, moderately susceptible cultivars should be sprayed every 8-9 days, and moderately resistant cultivars should be sprayed every 10-12 days. The predictions were derived utilizing analyses of 10 years' weather data from upstate New York. Initial field tests of these predictions have supported their accuracy (Spadafora et al., 1984). Nearly half of the 20 northeastern cultivars tested are moderately susceptible or moderately resistant. Unfortunately, the remainder are susceptible (Table 3).
Table 3. Resistance of potato cultivars to late blight.
Susceptible Moderately Susceptible Moderately Resistant
Abnaki Atlantic Kennebec Belchip Chipbell Rosa BelRus Bake-King Sebago Chieftain Frito Lay 657 Chippewa Green Mountain Hudson Katahdin Monona Russet Burbank Norchip Russet Rural Superior Wauseon
In addition to genetic differences among cultivars, potato plants change in their susceptibility during the growing season and become more susceptible after flowering (Populer, 1978). Consequently, age-related changes in susceptibility were measured, and we observed that older plants were more susceptible than younger ones. All measurements were initiated after flowering. The greater resistance of younger plants was equivalent in effect to about 20 percent of the recommended dosage of protectant fungicide applied weekly to the older plants in each of two years with each of two cultivars. The theory of increased susceptibility as plants age is currently being investigated by experimenting with a large number of cultivars. If the theory is true, then adjustments of fungicide dosage during the season are logical. Dosage levels of fungicides could be increased as the growing season progresses.

Maine Agricultural Experiment Station Technical Bulletin 116 15
Some researchers have suggested that host plant resistance of potato culti-vars to late blight may be short-lived due to genetic adaptation. Resistance would be short-lived if pathogen populations changed in their ability to cause disease on a particular cultivar with rate-reducing resistance. A change in ability to cause disease on a specific cultivar is termed adaptation (Caten, 1974). Adaptation of P. infestans to potato cultivars was suggested by several researchers (Caten, 1974; Jeffrey et al., 1962; Latin et al., 1981), while other reports indicated no adaptation (Paxman, 1963; Van der Plank, 1971). This research project sought to quantify the rate and extent of adaptation in P. infestans to selected potato cultivars (James and Fry, 1983) utilizing four populations of P. infestans. Infection efficiency, sporulation, and rate of epidemic development in field plots were used as criteria to measure adaptation. Two subpopulations were derived from each initial population as a result of repeated asexual generations on either of the two host cultivars. Each subpopulation was tested for infection efficiency and sporulation on its "own" cultivar (the one on which it had been cultured repeatedly), and on the "other" cultivar (on which it had not grown previously). Subpopulations differed in infection efficiency, but adaptation was not indicated since the changes were not differential for "own" versus the "other' cultivar. In the field, disease progressed as rapidly in plots composed of two cultivars planted alternately, as it did in plants with either cultivar alone. We interpret the results of these studies and previous ones, as well as the constancy of the relative resistance of cultivars over time, (disregarding R-genes) to indicate that rapid adaptation of P. infestans populations to cultivars with rate-reducing resistance is unlikely (James and Fry, 1983).
Canopy Density
The influences of potato canopy density on late blight, induced by Phytophthora infestans, were investigated in field experiments and simulation analyses. In field experiments, canopy density was altered by varying in-row spacing of potato plants. Experiments were performed at two locations, one irrigated, the other unirrigated. High humidity periods within dense canopies sometimes differed from those in less dense canopies. In some measurements, high humidity periods were up to 75 minutes longer in dense than in less dense canopies. In other cases, high humidity periods within dense canopies were shorter than in less dense canopies. Disease was more severe in dense than in less dense canopies only when macroclimate was marginal for disease development. Simulation analyses were used to predict the influence of extended periods of high relative humidity on late blight development over a range of microclimatic conditions typical of the northeastern United States. As daily periods of high relative humidity were increased, 0-75 minutes per day, simulated disease severity increased slightly. Variations in

16 Maine Agricultural Experiment Station Technical Bulletin 116
canopy density are predicted to have small influences on late blight development during some seasons, but no effect in other seasons.
Roles of Disease Forecasts in Potato Late Blight Management
Disease forecasts are attempts to predict the occurrence of disease and/or the need for management technology. Many forecasts for potato late blight have been developed during the last 50 years (Beaumont, 1947; Grainger, 19S3; Krause et al., 197S; Nugent, 1950; Schrodter and Ullrich, 1966; Van Everdingen, 1926; Wallin, 1962). Most of the early forecasts identified that point in the growing season when regular applications of protectant fungicides should commence. Some also predicted the desired application frequency during the season (Wallin, 1962). However, none of the forecasts incorporated the effects of cultivar resistance or different fungicides.
One goal of the research sponsored by this project was to incorporate cultivar resistance into a potato late blight forecast. Two approaches were used. In the first approach an existing potato late blight forecasting technique, Blitecast (Krause et al., 1975), was modified to include the effects of host resistance. In the second approach a new potato late blight forecasting technique developed from simulation analyses was evaluated. The simulation forecast was derived from analyses of two computer simulation models. The first model described disease development in response to weather and cultivar resistance (Bruhn and Fry, 1981). The second model described the deposition and redistribution of the fungicide cholorothalonil (Bruhn and Fry, 1982a; 1982b). In both approaches, the frequency of applications during the season was predicted. There was no attempt to determine that point in the season when the first application was needed.
Host resistance was incorporated into Blitecast by extending the recommended interval between fungicide applications on resistant cultivars relative to susceptible ones. The recommendations were developed from analyses of epidemics in moderately resistant cultivars relative to epidemics in susceptible ones, and analyses of fungicide application frequency on disease development (Fry et al., 1983). In Blitecast, applications are recommended every five or seven days in weather that is favorable or moderately favorable for disease development, respectively. The modification of Blitecast recommended fungicide application every seven or nine days to moderately resistant cultivars in weather that was favorable or moderately favorable, respectively, for disease development. Unfortunately, these modifications were insufficient and underestimated host resistance effects. More than the necessary number of sprays was applied to moderately resistant cultivars as judged by field experiments. The detail of these experiments has been reported (Fry et al., 1983).
The simulation forecast was constructed specifically to incorporate the effects of host resistance and fungicide weathering. It schedules an applica-

Maine Agricultural Experiment Station Technical Bulletin 116 17
tion of a protectant fungicide after the weather has been favorable for potato late blight or after the fungicide residue in the canopy has weathered to a low level. Host resistance is incorporated into the forecast via different thresholds for cultivars in different resistance classes (Table 3). Blight units (Table 5) quantify the degree to which weather has been favorable for potato late blight. Simulations done at various combinations of temperature and daily periods of high relative humidity for susceptible, moderately susceptible, or moderately resistant cultivars were done to define blight units. Blight units accumulate more rapidly for susceptible cultivars than for moderately resistant ones (Table 3).
Depletion of fungicide from the potato canopv was quantified in terms of fungicide units. Different fungicides are removed at different rates from the potato canopy. Consequently, tables for calculating fungicide units (Table 6) are fungicide-specific. The thresholds for indicating an additional spray are based on fungicide tenacitv and fungal toxicitv. Tenacity and fungal toxicity characteristics were determined from laboratory experiments.
A fungicide application is indicated when a minimum number of blight units or a minimum number of fungicide units is accumulated. The minima were determined after analysing simulations done using five seasons of diverse weather. Different thresholds were tested and those which minimized costs (due to loss from disease and cost of applications) were used as the simulation forecast (Table 4).
The simulation forecast has been evaluated in six experiments over four different vears (1980-1983). Detailed results of most of these experiments have been reported (Fry et al., 1983; Spadafora et al., 1984). The simulation forecast enabled efficient late blight suppression when compared with that achieved bv fungicide applications scheduled according to Blitecast, or that
Table 4. Decision rules for the simulation forecast.
JAfter preliminary experiments, the decision rules for triphenyltin hydroxide appear appropri
ate for mancozeb.
Decision Rule: Fungicide should be app lied Cultivar Resistance if it has not been applied within 5 days
lied Moderately
Suscepti ble Resistant
AND cumulative blight units since last spray exceed: 30 40
OR cumulative fungicide units since last spray of the indicated fungicide exceed:
Chlorothalonil 15 25 Triphenyltin hydroxide1 15 20
Captafol 15 20

18 Maine Agricultural Experiment Station Technical Bulletin 116
Table 5. Blight units for the simulation forecast."
JHigh relative humidity >9()"o. Blight unit estimation period is 24 hours (1200 hours to 1200 hours). SS = susceptible cultivars; MS — moderately susceptible cultivars; MR = moderately resistant
cultivars.
achieved by weekly fungicide applications (a typical grower practice). When fungicide applications were scheduled by the simulation forecast, late blight was suppressed similarly on susceptible and moderately resistant cultivars, but the moderately resistant cultivars received less fungicide than did susceptible ones. Moderately resistant cultivars sprayed according to a weekly schedule or according to Blitecast had less disease than did susceptible ones sprayed according to these timing techniques. Thus, the simulation forecast provided an effective means to enhance the efficiency of fungicides. Differences in cultivar resistance enabled greater savings in fungicide applications than did variations in the weather. During the course of these experiments, about half of the application recommendations were triggered by blight unit thresholds and about half were indicated by fungicide unit thresholds.
A final investigation on potato late blight forecasting was conducted cooperatively by agricultural economists and by plant pathologists. The economic benefits of scheduling fungicide applications with Blitecast rela-
Average Consecutive Hours of Rel ative Humidity > 90% that Temp. Cultivar
Resistanceb Should Result in Blight Units of:
(C) Cultivar
Resistanceb 0 1 2 3 4 5 6 7
>27 S 24 MS 24 MR 24 -
23-27 S 6 7-9 10-12 13-15 16-18 19-24 MS 9 10-18 19-24 MR 15 16-24
13-22 S 6 7-9 10-12 13-24 MS 6 7 8 9 10 11-12 13-24 — -MR 6 7 H 9 10-12 13-24 —
8-12 S 6 7 8-9 10 11-12 13-15 16-24 MS 6 7-9 10-12 13-15 16,18 19-24 MR 9 10-12 13-15 16-24 -
3-7 S 9 10-12 13-15 16-18 19-24 MS 12 13-24 MR 18 19-24
>3 S 24 MS 24 MR 24

Maine Agricultural Experiment Station Technical Bulletin 116 19
tive to weekly fungicide applications as part of the rationale for using a forecast in an integrated approach were evaluated. Ideally, the net revenues from potatoes grown with the use of Blitecast should be compared with those from potatoes grown with regular applications and the evaluation should be done over a range of conditions in growers'fields. Because of the expense and time required for these evaluations, the comparisons were done via analysis of simulation models. Comparisons related defoliation resulting from Blitecast-scheduled fungicide applications to defoliation following weekly applications. The amount of fungicide used was also recorded. Comparisons were made using a moderately susceptible potato cultivar over 10 years ago. The rainfall and temperature data were recorded at Geneva, New York; and high relative humidity was estimated with a stochastic function derived from analysis of three seasons of continuous relative humidity and temperature measurements in the potato canopy. In addition to this typical weather
Table 6. Fungicide units for the simulation forecast.
Daily R ain fall' That Should Result in Davs Since
Fungicide Fungicide Units of:
Application Fungicide 1 •> 3 4 5 6 7 8 9
mm-1 Chlorothalonil < 1 - 1 i 4 >6
1
T P T H (Mancozeb)1
Captafol Chlorothalonil T P T H Captafol Chlorothalonil T P T H Captafol Chlorothalonil T P T H Captafol Chlorothalonil T P T H Captafol Chlorothalonil T P T H Captafol Chlorothalonil T P T H Captafol
1 < 1 -
< 1 -< 1 -<2-< 1 -< 1 -<2-< 1 -< 1 -<->.
< 1 -< 1 -<2 < 1 -< 1 -<2 < 1 -< 1 -<2
7
?
1
1
•>
1
i
1
1
1
1
1 1
1 T
~>
1
~s
1
3 1
-\ .1
1 3
>4 1 I
>4
3
5 1
3 >5
i
'y i >H
-i
3 >8
->
5
i
3 5
5 >7 >7
3
4
5
6
7-8
T P T H (Mancozeb)1
Captafol Chlorothalonil T P T H Captafol Chlorothalonil T P T H Captafol Chlorothalonil T P T H Captafol Chlorothalonil T P T H Captafol Chlorothalonil T P T H Captafol Chlorothalonil T P T H Captafol
1 < 1 -
< 1 -< 1 -<2-< 1 -< 1 -<2-< 1 -< 1 -<->.
< 1 -< 1 -<2 < 1 -< 1 -<2 < 1 -< 1 -<2
7
?
1
1
•>
1
i
1
1
1
1
1 1
1 T
~>
1
~s
1
3 1
-\ .1
1 3
>4 1 I
>4
3
5 1
3 >5
i
'y i >H
-i
3 >8
->
5
i
3 5
5 >7 7 >9
3
4
5
6
7-8
T P T H (Mancozeb)1
Captafol Chlorothalonil T P T H Captafol Chlorothalonil T P T H Captafol Chlorothalonil T P T H Captafol Chlorothalonil T P T H Captafol Chlorothalonil T P T H Captafol Chlorothalonil T P T H Captafol
1 < 1 -
< 1 -< 1 -<2-< 1 -< 1 -<2-< 1 -< 1 -<->.
< 1 -< 1 -<2 < 1 -< 1 -<2 < 1 -< 1 -<2
7
?
1
1
•>
1
i
1
1
1
1
1 1
1 T
~>
1
~s
1
3 1
-\ .1
1 3
>4 1 I
>4
3
5 1
3 >5
i
'y i >H
-i
3 >8
->
5
3 S >7 7 >9
3
4
5
6
7-8
T P T H (Mancozeb)1
Captafol Chlorothalonil T P T H Captafol Chlorothalonil T P T H Captafol Chlorothalonil T P T H Captafol Chlorothalonil T P T H Captafol Chlorothalonil T P T H Captafol Chlorothalonil T P T H Captafol
1 < 1 -
< 1 -< 1 -<2-< 1 -< 1 -<2-< 1 -< 1 -<->.
< 1 -< 1 -<2 < 1 -< 1 -<2 < 1 -< 1 -<2
7
?
1
1
•>
1
i
1
1
1
1
1 1
1 T
~>
1
~s
1
3 1
-\ .1
1 3
>4 1 I
>4
3
5 1
3 >5
i
'y i >H
-i
3 >8
->
5 3
7 5 >7
>9
3
4
5
6
7-8
T P T H (Mancozeb)1
Captafol Chlorothalonil T P T H Captafol Chlorothalonil T P T H Captafol Chlorothalonil T P T H Captafol Chlorothalonil T P T H Captafol Chlorothalonil T P T H Captafol Chlorothalonil T P T H Captafol
1 < 1 -
< 1 -< 1 -<2-< 1 -< 1 -<2-< 1 -< 1 -<->.
< 1 -< 1 -<2 < 1 -< 1 -<2 < 1 -< 1 -<2
7
?
1
1
•>
1
i
1
1
1
1
1 1
1 T
~>
1
~s
1
3 1
-\ .1
1 3
>4 1 I
>4
3
-i
5 „1
7 5 >7
>9
3
4
5
6
7-8
T P T H (Mancozeb)1
Captafol Chlorothalonil T P T H Captafol Chlorothalonil T P T H Captafol Chlorothalonil T P T H Captafol Chlorothalonil T P T H Captafol Chlorothalonil T P T H Captafol Chlorothalonil T P T H Captafol
1 < 1 -
< 1 -< 1 -<2-< 1 -< 1 -<2-< 1 -< 1 -<->.
< 1 -< 1 -<2 < 1 -< 1 -<2 < 1 -< 1 -<2
7
?
1
1
•>
1
i
1
1
1
1
1 1
1 T
~>
1
~s
1
3 1
-\ .1
1 3
>4 1 I
>4
3 5
1 5 7
7 >9 >9

2(1 Maine Agricultural Experiment Station Technical Bulletin 116
Table 6. —continued
SOURCES: Fry et al., 1983; Spadafora et al., 1984, and unpublished results. Each daily rainfall value represents the lower threshold needed to accumulate the corresponding
number of fungicide units. hThe method for calculating fungicide units for triphenyltin hydroxide has also proven effective for mancozeb.
record, two sets of less favorable weather records were generated by subtracting one and two hours, respectively, from each daily period of high relative humidity in the "typical" environment. The simulation experiment was a "stress-test" in part because inoculum was added throughout the season. Greater amounts of inoculum were added during weather favorable to the disease and less amounts of inoculum were added during weather less favorable to the disease.
Unexpectedly, Blitecast-scheduled fungicide applications on average did not suppress late blight more effectively with less fungicide than did weekly applications (Table 7). In the favorable environment, Blitecast scheduled applications were more frequent with no decrease in disease relative to control achieved by weekly applications. In the unfavorable environment, Blitecast recommended an average of 6.6 applications per season, whereas, there were 10 applications when the fungicide was applied weekly. However, the reduced numbers of applications resulted in a larger amount of disease. Consequently, the benefits of reduced fungicide must be weighed against the costs associated with a greater amount of disease.
Da ilv Rainl :alla That Should Result in Days Since
Fungicide Fungicide 1 Units ;of:
Application Fungicide 1 2 3 4 5 6 7 8 9
mm 9 Chlorothalonil
T P T H < 1 -< 1 -
l >4 Chlorothalonil T P T H
< 1 -< 1 - 1
>4 2 3 5 7 >9
Captafol Chlorothalonil T P T H
<2 <1 < 1 -
2 1
7, 5 7 >9 10
Captafol Chlorothalonil T P T H
<2 <1 < 1 -
2 1 2
1 >8 10
Captafol Chlorothalonil T P T H
<2 <1 < 1 -
2 1
>8 2 3 5 7 >9
Captafol Chlorothalonil T P T H
< T T 3 >8
2
5 7 >9 11-14
Captafol Chlorothalonil T P T H
< ] 1 -> 3
>8 2
5 7 >9 11-14
Captafol Chlorothalonil T P T H < 1 - • 1
3 >8
2 3 5 >7 Captafol Chlorothalonil T P T H
< 3 -<1 < 1 -
• 3 >8
• 1
5 7 >9 >14
Captafol Chlorothalonil T P T H
< 3 -<1 < 1 -
| • 3
>8 • 1
5 7 >9 >14
Captafol Chlorothalonil T P T H
< 3 -<1 < 1 -
• 3 >8
• 1 2 3 5 >7 Captafol < 3 - • 3 5 7 >9 Captafol < 3 - • 3 5 7 >9

Maine Agricultural IXperiment Station Technical Bulletin 116 21
Table 7. Average percent defoliation from late blight and average number of fungicide applications for 10 simulated seasons for Blitecast
and 7-day internals.
Microclimate
Moderately Treatment Favorable' Favorableah Unfavorable'11
---percentage— High Inoculum-Blitecast 40.1(7.9) 34.1 (8.6) 23.2(8.9) High Inoculum-7-day 55.2 (S.2) 21.2 (S.5) 10.9(5.2) Moderate Inoculum-Blitecast 16.3 (6.0) 16.5(9.1) 9.5 (4.6) Moderate Inoculum-7-dav 15.2 (6.7) 10.0(6.1) 3.9(3.4) Low Inoculum-Blitecast 0.2 (0.1) 1.0(0.7) 0.1(0.0) Low Inoculum-7-dav 0.4(0.3) 0.2 (0.2) 0.0 (0.0)
average number of appl ications— Blitecast 10.6 8.7 6.6 7-dav 10.0 10.0 10.0
SOURCE: Fohner et al., 1US4. \ alues in parentheses are standard deviations of average defoliation. "Weather data for the moderately favorable and unfavorable microclimates were generated by subtracting one and two hours, respectively, from each daily period of high relative humidity in the data set for the favorable microclimate.
The simulation experiment results were different than expected, so some previous field experiments with Blitecast were re-evaluated. The re-evaluation focused on the ability of Blitecast to schedule fungicide applications after the initial application had been indicated. This new analysis of field experiments corroborated the simulation experiment. There was little difference in disease suppression and numbers of applications whether fungicide applications were scheduled according to Blitecast or were made weekly (Fohner et al., 1984).
The next step in the analysis of potato late blight forecasts is to compare the simulation forecast with weekly applications in an experiment similar to that performed with Blitecast and weekly applications. It may be that the simulation forecast is no more effective at scheduling fungicide applications successfully than is Blitecast.
A probable explanation for the inability of Blitecast to schedule fungicide applications more efficiently than weekly applications is that Blitecast schedules applications after the weather has been favorable (after infections have been initiated), but the protectant fungicides simulated and used in practice act mainly to prevent new infections and do not suppress established ones. The recent availability of a systemic fungicide (metalaxyl), which is effective

22 Maine Agricultural Experiment Station Technical Bulletin 116
on the fungus in established infestions, may enable the more successful use of Blitecast.
One conclusion from these simulation field experiments is to suggest caution when using a weather-dependent potato late blight forecast. In contrast, the effect of plant resistance has been consistent. Consequently, it appears safest to adjust fungicide concentration to complement cultivar resistance or to adjust the frequency of regular fungicide application to complement host resistance.
The final experiments concerning late blight forecasting have concerned the time during the season when the first fungicide application should be made. The commonly used forecasts have not incorporated host resistance so we have initiated research to do so. In a preliminary experiment in 1983, infected tubers of a resistant and a susceptible cultivar were planted and weather was monitored until the first appearance of late blight lesions in the foliage. In the susceptible cultivar, lesions were first seen 4-10 days after Blitecast had predicted that their occurrence was imminent. Thus, Blitecast seemed to have been quite accurate in predicting the intitial appearance of late blight in the susceptible cultivars. However, late blight was not detectable in the moderately resistant cultivar until contamination from surrounding experiments produced general infection throughout these plots and ended the experiment. It seems likely that the timing of the first fungicide application should be a function of cultivar resistance.
Soilborne Pathogens
Rhizoctonia Disease Complex
The Rhizoctonia disease complex, often referred to as Rhizoctonia canker or black scurf, is present in all potato producing areas of the world (Frank, 1978; Frank, 1981; Morse and Shapovalov, 1914). The causal agent, Rhizoctonia so/ant, has a wide host range (Baker, 1970). Isolates of the fungus have been divided into anastomosis groups on the basis of pathogenicity. Those strains in anastomosis group 3 (AG 3) are considered most pathogenic on potatoes (Anderson, 1982). Inoculum can be both soil and tuberborne. Tuberborne./?. so/anisc\erotia and mycelium can serve as a source of primary inoculum for infection of emerging stems and stolons (Frank and Leach, 1980; Humphreys-Jones, 1977; Morse and Shapovalov, 1914; Small, 1943; Van Emden, 1958; Weinhold and Bowman, 1982). Elimination of tuberborne inoculum has been shown to be the most effective control measure for R. solani(Frank and Leach, 1980; Small, 1943; Van Emden, 1958; Weinhold and Bowman, 1982). Control can be achieved by using clean (sclerotia-free) seed or through the use of chemical seed treatments (Dana, 1925; Morse and

Maine Agricultural Kxperiment Station Technical Bulletin 116 23
Shapovalov, 1914; Van Emden, 1958; Weinhold and Bowman, 1982). Morse and Shapovalov (1914) first reported effective potato seed treatment with mercury to control R. solani through inhibition of sclerotial germination.
Numerous studies on the biological control of R. so/anihave been reported recently (Baker and Cook, 1974; Castanho and Butler, 1978; Davey and Papavizas, 1959; Davey and Papavizas, 1963; Frank and Murphy, 1977; Schroth and Hancock, 1981). Most research in this area has involved the use of several species of Trichodenrni, the most promising being T. harzimim and T. hamatum (Boosalis, 1950; Schroth and Hancock, 1981). However, their effectiveness under field conditions has yet to be validated (Baker and Cook, 1974; Boosalis, 1956; Castanho and Butler, 1978; Hadar et al., 1979). A basidiomycetous fungus which hyperparasitizes R. solani, Laetisaria arvalis, has been shown to be effective in controlling/?. jwW(Odovody et al., 1980).
Crop rotation has been shown to be useful in reducing the severitv of the black scurf disease. The nature of a crop residue can influence the activity of R. solani(Davey and Papavizas, 1959; Davev and Papavizas, 1963; Papavizas and Davey, 1960). Blair (1943) found that higher content of readily decomposable organic matter in amendments gave greater levels of suppression. In addition, Papavizas and Davey (1960) showed that incorporation of green plant residues increases populations of bacteria, actinomycetes, and fungi antagonistic to R. solani. Crop rotation can influence the activitv of R. solani in several wavs. Direct effects include the suitabiliy of the crop and its residues for parasitic and saprobic colonization by R. solani (Papavizas and Davey, 1960). An important indirect effect is antagonism towards R. solani from the size or composition of the soil microbiota (Davey and Papavizas, 1959; Davev and Papavizas, 1963; Papavizas and Davey, 1960; Specht, 1983).
Various crops used in rotation with potatoes were evaluated for their effectiveness in controlling disease on potato caused by R. solani. Incorporation of rotation crop residues (sweet corn, Japanese millet, buckwheat, spring oats, and annual ryegrass) as green, immature amendments versus mature, partiallv decomposed amendments were examined. Neither the crop, nor the state of the crop at the time of soil incorporation, had any significant effect on R. solani disease severity.
Control strategies for the Rhizoctonia disease complex of potato consist of a combined use of chemical seed treatments, biological agents, and rotation crops. Reduction of tuberborne R. solani inoculum with chemical seed treatments was studied (Leach and Murdock, 1985). Following the removal of mercury compounds there were no effective R. solani seed treatments available. Pentachloronitrobenzene (PCNB) has been shown to be an effective material for control of tuberborne R. solani inoculum (Leach and Murdoch, 1985). PCNB has also been recommended and used as a soil treatment against R. solani (Van Emden, 1958). In a recent study, R. solani contaminated seed was treated with PCNB alone and in combination with

24 Maine Agricultural Experiment Station Technical Bulletin 116
thiabendazole to determine effectiveness in reducing damage caused by the Rhizoctonia disease complex. Results of these tests showed that PCNB applied in combination with thiabendazole significantly reduced the amount of damage caused by R. so/an/ (Table 8) (Leach and Murdoch, 1985). Growers have reported that the continued use of this seed treatment has reduced the number of missing hills and tuber damage caused by R. solanizs expressed by an increase in tuber qualitv.
Table 8. Evaluation of pentachloronitrobenzene, thiabendazole, and combinations of both chemicals as liquid seed treatments on field stand
and the Rhizoctonia Disease Complex.
Duncan's Stand Rhizoctonia Multiple
Treatment Rate Percentage Disease Rating1 Range Test2
Check 92.0 5.3 a PCNB !
50,000 93.2 3.3 cd 25,000 98.0 3.3 cd 12,500 97.2 4.1 be 6,250 94.0 4.7 ab
PCNB + TBZ 4
50,000 + 1,500 98.0 3.1 cd 25,000 + 1,500 97.2 2.8 d 12,500 + 1,500 99.2 2.9 cd 6,250 + 1,500 96.0 3.3 cd
TBZ 6,0005 96.0 3.6 bed 4,500 99.2 2.9 cd 3,000 100.0 3.3 cd 1,500 98.0 3.8 bed
SOURCE: Leach, S.S. et al., 1985. Based on rating of 1-10; 10 signifying the most severe disease.
"All numerals followed by the same letter are not significantly different D M R T (P=0.05). PCNB = Penthachloronitrobenzene.
'TBZ = Thiabendazole. TBZ at 6,000 ppm delayed emergence.
Fusarium Seedpiece Decay and Tuber Rot
Each year P'usarium tuber rots and seedpiece decays cause major losses to potato producers. These wound pathogens rot tubers in storage before and after transport and also seed pieces cut from contaminated tubers. Fusarium-

Maine Agricultural Kxperiment Station Technical Bulletin 116 25
caused seedpiece decay reduces stands, plant vigor, and yields. Tuber rot caused by Fusarium spp. is second in importance to late blight tuber rot as a cause of fungal wastage in stored potatoes (Leach and Nielsen, 1975; Nielsen and Johnson, 1972). Potato contamination with Fusarium roseum'&ambucmum or F jwWCoeru leum' varies greatly among and within production areas. These fungi are found in field soils and their propagules are often present in soil adhering to tubers (Small, 1944). Washing and/or chemical treatment with thiabendazole of freshly harvested potatoes removes or destroys infectious propagules from the tubers (Leach and Nielsen, 1975; Nielsen and Johnson, 1972). Seed treatment has also been shown to significantly reduce potato crop losses due to Fusarium tuber decay (Leach and Nielsen, 1975).
Potato resistance to Fusarium spp. has been studied with varying degrees of success. Most cultivars reported to have Fusarium resistance are resistant to only one species of the fungus and have not generally become widely used due to other undesirable characteristics. Leach and Webb (1981) reported that one clone from the USDA Potato Breeding Program appeared immune toF raiw/OT'Sambucinum'and highly resistant to F. jwW'Coeruleum'. This clone does not have all the qualities to allow its release as a variety but it is being used as a source of resistance in the breeding program.
Fusarium spp. control studies were restricted to chemical seed treatments and resistance studies. Results showed that thiabendazole is the most effective control of Fusarium-caused disease. It was also shown that thiabendazole is active against R. solani, Helminthosporium solani, and Verticillium albo-atrum at low rates (2-7 ppm).
Control Strategies for Soilborne Pathogens
Control of seedborne inoculum is the best method to reduce losses caused by soilborne diseases. However, control strategies should include both soilborne and seedborne inoculum. The addition of soil amendments as green manure or sawdust reduces disease incidence and severity over both long and short terms (Davev and Papavizas, 1959; Davey and Papavizas, 1963; Frank and Murphy, 1977; Papavizas and Davey, 1960; Specht, 1983) and should be a part of any control program. The basis for soilborne pathogen control strategies is the use of rotation crops that are not susceptible to, or do not act as hosts for pathogenic organisms; and seed treatments to minimize the addition of further inoculum into the soil. Other factors which may affect the incidence or severity of a disease, e.g., where aldicarb increased the severity of Rhizoctonia disease complex, should also be considered (Leach and Frank, 1982).
Seedborne inoculum of R. solani and Fusarium spp. was reduced by chemically treating tubers with a combination of PCNB and thiabendazole applied at 50,000 and 1,500 ppm respectively (Leach et al., 1985). PCNB controls R. so/ani and has some effect on acid scab (Leach, unpublished data)

26 Maine Agricultural Experiment Station Technical Bulletin 116
while thiabendazole disinfests tubers of Fusarium spp. Through the use of this seed treatment and suitable rotation crops a gradual decline in losses caused by these pathogens should be observed.
It is also important to obtain disease-free seed. Seed samples should be washed and the amount and type of disease symptoms and signs should be determined. Acceptability criteria will vary, but some guidelines are presented in Appendix C. Even if seed falls within the recommended guidelines, seed treatments should be applied to insure against adding inoculum to the soil and possible contamination of daughter tubers. Cultivars reported to have resistance to potential pathogens should be used whenever possible.
Areas where additional research is needed are as follows: the effect of rotation crops on soilborne pathogen populations; methods to determine the effect of pathogen infestation of seed and its effect on economic losses; identification of sources of resistance and incorporation into acceptable varieties; development of new biological control methods; and the introduction and evaluation of using resistant cultivars over those presently grown.
Insects
Initial Testing of Action Thresholds
Potato-infesting aphids. Populations of potato-infesting aphids did not approach the action threshold (see Appendix C for Maine potato pest action thresholds). A possible explanation for this is that materials applied for Colorado potato beetle control provided some aphid control. The materials applied for beetle control are not, however, especially effective aphicides.
Colorado potato beetle. Colorado potato beetle populations reached the action threshold (see Appendix C for Maine potato pest action thresholds) several times (Table 9). Azinphos-methyl reduced CPB numbers below the threshold in 1981, but neither azinphos-methyl nor phosmet were effective in 1982. Yields in both years were commercially acceptable.
Colorado Potato Beetle Studies
Studies of the response of some commercially grown cultivars and seedlings to high Colorado potato beetle (CPB) populations were initiated. Fourteen cultivars were evaluated in central Maine utilizing a randomized complete block design with 10 replicates. Each plot consisted of 12 seed pieces spaced ca. 23 cm apart. Fertilization and cultivation practices were normal for the area. The various CPB stadia were counted and recorded weekly. Near the end of the growing season a visual defoliation determination was made using the IR-1 system. When feeding damage on plants in a replicate was nearly equally divided between two integers in the rating system, a rank midway between the integers was given. The plots were harvested in late September and the weight of tubers was recorded.

Maine Agricultural Experiment Station Technical Bulletin 116 27
Table 9. Insecticide treatments and numbers of Colorado potato beetle larvae and adults in test plots during the 19S1 and 19S2 growing seasons.
19S1 1982
Julian CFB per Plant Julian Date
CPB per Plant Date Plot A Plot B
Julian Date Plot A Plot B
195 2.49 3.59 162 1.12 0.49 19S azinphos-methvl applied 166 0.95 (1.31 20S 0.96 1.2S 173 0.41 0.43 215 1.72 2.74 178 9.64 3.35 • ) • > ; 2.54 2.25 azinphos-methol applied 251 azinphos-methvl applied 1S7 7.20 5.90
azinphos-methyl applied 194 6.11 5.43
phosmet applied 200 3.71 2.94
fenvalerate applied 207 0.59 0.04 215 1.62 0.17 220 4.32 0.58
fenvalerate applied 22S 0.09 0.01 235 0.07 0.06
Overwintered CPB adults were active at plant emergence. After oviposition, few adult beetles were found in the plots. The composition of the population by stadia through the season was similar both years (Figure 1). Egg masses and larvae were, however, higher in 1983 than in 1984 (Table 10). Even though population numbers were different each year, the seasonal history data indicate when insecticides can be most effectively applied (Figure 1). Most materials have little affect on CPB eggs. These seasonal history data were used to determine the times to apply insecticides to obtain maximum control. The first time insecticides can be effectively applied is when most of the overwintering adult beetles have emerged and before oviposition is maximal. The second application, if needed, is most effective when most of the eggs have hatched and before most of the larvae enter the third and fourth larval instars.
Several trends are apparent in the yield and defoliation rating data (Table 11). BelRus and Yankee Chipper consistently produced low yields and CF7358-14 and Yankee Supreme produced high yields both years. In general, the earlier the maturity the higher the yield, except for Sunrise and Yankee Supreme. A higher defoliation rating is consistent with lower yield

Maine Agricultural Experiment Station Technical Bulletin 116
Figure 1. Percentage of the Colorado potato beetle population in egg mass, larval, or adult stadia during the 1983 and 1984 growing seasons. Shaded areas indicate period when insecticide applications would be most efficacious for control of adults or larvae.

Maine Agricultural Fxperinient Station Technical Bulletin 116 29
Table 10. Average numbers of Colorado potato beetle egg masses, larvae, and adults in test plots dur ing the 1983 and 1984 growing seasons.
1983 1984
Julian Date
Stadia per 30cm of Stema
KM L A Julian Date
Stadia per 30cm of Stem8
EM L A
168 0.32 1.63 0.00 156 0.19 0.33 0.00 172 1.62 1.77 <0.01 172 0.68 0.31 0.04 17S 4.15 1.13 2.28 180 0.40 0.11 0.23 ISO 0.01 0.01 15.57 185 0.24 0.09 2.74 193 0.01 0.01 15.00 192 0.07 0.03 7.51 200 <0.01 0.01 2.03 199 0.03 0.01 6.40 207 <0.01 11.58 0.04 206 0.02 0.14 2.71 215 0.00 0.15 2.86 215 0.01 1.64 1.21 -f)T 0.00 0.65 1.74 220 0.02 2.38 0.46 22S <0.01 0.08 (1.28 227 0.01 0.86 0.10 233 0.00 0.17 0.11 234 0.04 0.16 <0.01
JEM = egg masses, L = larvae, and A — adults.
Table 11. Yield' of tubers and visual defoliation rating of plants fed upon by
Colorado potato beetles dur ing the 1983 and 1984 growing seasons.
Yield Defoliation (metric tons/hectare) Rating
Cultivar 1983 1984 1983 1984
(medium- early maturing ; cultivars) Monona 11.77 7.29 3.67 3.00 Norchip 7.29 3.81 3.92 3.30 Superior 8.52 10.20 4.42 3.35
CF 7523-1 5.27 3.14 3.92 3.05 (medium maturing cu Itivars)
Atlantic 7.06 8.41 3.92 2.85
Islander 4.37 2.69 4.33 3.30
Kennebec 4.15 8.41 4.00 3.10
Sunrise 13.45 8.85 4.50 3.67
Yankee Chipper 3.03 3.03 4.67 3.80
Yankee Supreme 12.78 12.11 3.33 2.75
\VF 564-5 7.06 2.91 3.83 3.55 (medium--late maturing cultivars)
BelRus 2.47 0.56 4.58 3.85
Campbell 14 2.69 4.26 4.25 3.20
Katahdin 3.70 5.16 3.83 3.40
'Plants were not t reated with insecticides.

30 Maine Agricultural Experiment Station Technical Bulletin 116
with the exception of Superior and Sunrise which both had high yield and a high defoliation rating. These cultivars may be able to compensate for defoliation or possibly defoliation did not occur at a critical time in the plant's development. Comparisons of beetle populations to yield for these years need to be made, but to make the comparisons meaningful it will be necessary to translate the data to a common base (plant growing degree days, precipitation, and CPB developmental degree days).
Weeds
In the weed research, efforts were directed toward investigating the relationships between potato canopy light interception, relative humidity within the canopy, weed suppression, and the risk of potato late blight.
Broadleaf row crops such as potatoes shade the soil much more than do corn and cereals. Until 10-12 years ago, the significant benefits of this shading in terms of weed suppression had not been generally recognized. The Cornell vegetable weed science program has been a leader in investigating shade as a suppressant for weeds in potatoes. Sweet and Sieczka (1973), Yip (1975), and Hossain (1980) found that cultivars which reduce sunlight by more than 50 percent over most of the growing season have dramatically less interference from both annual and perennial weeds. Reductions greater than 50 percent are typically observed in Kennebec and Hudson, but Katahdin does not often give this degree of shading. Smaller vined cultivars such as Monona do not give heavy shade unless planted more closely together than in commercial practice. Closer spacing of soybeans has been widely utilized as a means of obtaining dense shade earlier and throughout the season. This has been accomplished by moving the rows closer together and widening the space between plants in the row. As a consequence, seed costs per acre are not materially increased. Unfortunately potato planting and harvesting machinery is not only expensive, but also rather inflexible as far as row width is concerned. Narrow rows would also increase seed costs significantly. Hossain (1980) found that changing from 25-30 to 12.5-15 centimeters between plants in the row doubled "seed" needs and added S200-250 per hectare to costs. Higher densities usually reduced weeds, but yield differences were variable. Sometimes yields increased, sometimes they remained the same. Benefits in weed control could be increased as much by using S20-25 per hectare additional herbicide as by doubling the number of plants.
Late blight is a weather-dependent disease of potatoes with potential for causing devastating losses. Inherent tissue susceptibility varies among cultivars, but many popular ones are fairly susceptible. Even those with lower susceptibility are given fungicidal sprays when the weather is favorable for the organism. High relative humidity, above 90 percent, is essential for the organism to flourish. Plant pathologists, breeders, and others often postulate

Maine Agricultural Experiment Station Technical Bulletin III) 31
that open or sparse potato canopies are highly desirable because they are likely to have lower humidity than those with larger or more dense canopies under similar environmental conditions. Thus, cultivars or spacings which give enough shade to suppress weeds are likely to increase the risk of late blight. Unfortunately no data are available as to the relationship between canopy size or density and the level of relative humidity.
Objectives
The objectives of this research were: 1 To determine the relationships between the degree of light interception
by potato canopies and the relative humidity within canopies. 2. To evaluate transpiration, soil evaporation, and the general atmosphere
as sources of relative humidity within canopies. 3. To ascertain if factors in addition to light interception are contributing
to the high correlation between shading and weed suppression. 4. To increase the number of cultivars for which canopy characteristics in
relation to light interception have been catalogued. The research was conducted over a period of four growing seasons, but
only the first objective was investigated each of the four years. Studies were done in the field on Cornell University lands located in Freeville, New York about 17 kilometers from the Ithaca campus. As nearly as possible, potatoes were grown according to recommended commercial practices. Natural weed populations were utilized. Since treatments had little effect on nearby plots, individual plots could befairlv small, four rows wide and 4.5-6.0 meters long. The center two rows were used for data. Experimental designs varied somewhat, but treatments were always randomized and usually were replicated four times.
Relative Humidity and Light Interception by Canopies
In each of the four seasons, this objective was investigated in detail. The first and second season emphasis was on developing sensors for relative humiditv (RH) which would be inexpensive and would operate accurately within a canopy without disturbing it. The hygrothermograph is the traditional instrument for continuous measurements and the sling psychrometer is utilized for periodic determination. Neither can be operated within the canopy without undue disturbance, and the former is also prohibitive from a cost standpoint when several locations, treatments, and replications need to be measured. All potential instrument designs were investigated. VanVranken (1983) developed a modification of a sensor design originated by Seem (1981) which proved to be reliable, inexpensive, and gave continuous readings without disturbing the canopy. It consisted of thermocouples operated as dry and wet bulb sensors attached to the lower end of a piece of 3.8 centimeter black plastic tubing standing upright at the desired location in the canopy.

32 Maine Agricultural Experiment Station Technical Bulletin 1 Ui
The tubing could be of any length that permitted the upper end to be above the canopy. The wet-bulb thermocouple was covered with an absorbant wick fed from a (1.48 liter plastic water bottle. The wires were attached to a central recorder which was set to make readings every 30 minutes. The tapes gave temperature readings which could be transcribed into RH by appropriate computerized calculations, or where only a few readings were involved, RH could be determined by inspection from standard published conversion charts.
VanYranken (1983) compared two versions of the thermocouple design with the hygrothermograph under laboratory conditions. Both "new' designs were consistent and required minimal attention for accurate readings. However, when tests were conducted in a closed dark room, the hygrothermograph always gave RH readings that were significantly below those of the "new" design. Sling psychrometer readings were similar to those of the hygrothermograph. He attributed the higher readings to a lack of air movement. From a practical standpoint, it is important to note that under no circumstances in the laboratory or the field did the new designs underestimate relative humiditv.
The cultivars used in most instances were either Hudson or Kennebec for "large," Katahdin for "intermediate," and Monona for "small" canopies. In most experiments, cultivars were spaced 25-30 and 12.5-15 centimeters apart in the row. Soil moisture readings were taken bv means of gypsum blocks located within several centimeters of the RH sensors at a depth of 15 centimeters. The recorder to which the sensors were connected was set to take readings even' 30 minutes. There was a minimum of two replications. The number of continuous hours that a particular canopy has RH above 90 percent was an important measure for evaluating differences in the critical level for late blight development. When several weeks of information were statistically analvzed on this basis, no differences were found. The variation among and within days as well as the variation in replications was too great to show small treatment differences. Also, readings obtained before canopies closed in showed no differences among cultivars or between bare-ground and potatoes. However, with solid canopies, when specific days or short-term comparisons were selected, sometimes significant differences could be detected.
In all years, the overwhelming factor controlling RH was general atmospheric conditions. Rain of perhaps an inch or more coupled with drizzle, plus little wind, produced RH above 90 percent regardless of cultivar or spacing. In fact, there was no difference between bare-ground and potatoes. When conditions moderated slightly, small but significant differences sometimes occurred among cultivars and between spacings. Unexpectedly, these differences frequently showed higher humidity in small canopies and small spacings. For example, in 1982 a particular three day period in August was selected as representative of a "worse-case'' situation in large canopies and

Maine Agricultural K\periment Station Technical Bulletin 116 33
close spacing for prolonged periods of RH above 90 percent. Day 1 concluded a short, dry period; Day 2 had 2.3 centimeters of rain; and Day 3 had mist and drizzle and accumulated 0.3 centimeters of rain. In 9 of 12 comparisons, wide spacing had longer periods of RH above 90 percent than did close spacing. On Day 3, surprisingly, the larger canopy had lower RH than the smaller canopy. Even on Day 2 with 2.3 centimeters of rain, Hudson at wide spacing had 0.5 hour longer high RH than at close spacing. As can be seen in Table 12, differences between treatments are small on any given day, but differences from day to day can be two- or threefold. Furthermore, spacing and size of canopy have minimal influence whether the general atmosphere has either high or low RH.
Table 12. Hours canopies were above 90 percent relative humidity during three consecutive 24-hour days, August 22, 23, 24, 1982.
August 22J August 23" August 24°
Potato Variety 11-12°C 15-16°C 16-17°C and Spacing no rainb 2.3 cen. rainb 0.3 cen. rainb
Replication Icd IIcd P d II"1 Vd lVd
Monona 15.2 cm 5.5 2.5 16.0 16.0 14.5 14.0 Monona 30.5 cm 5.0 3.5 16.0 16.5 15.0 15.0 Hudson 15.2 cm 4.5 1.5 16.0 16.0 14.0 12.7 Hudson 30.5 cm 5.5 5.5 16.5 16.5 13.0 14.0 'Day. K Average night temperature and amount of rain. 'Replication number. dEach treatment has two sensors per replication which give an average reading every 30 minutes.
Sources of Moisture in Canopy RH
In the studies reported in the previous section, canopy RH was influenced mostly by general atmospheric conditions. It tended to be slightly modified by size of canopy and in-row spacing. When differences occurred there often was a trend toward lower RH in larger canopies and closer spacing. VanVranken (1983) found that in these situations soil moisture had been depleted more due to greater transpiration. In commercial field situations, it has been observed that late blight may be worse in lower parts of the field and behind hedgerows. In both situations, it has been speculated that air movement is less and longer periods of RH above 90 percent occur. According to the suggestions of X'anVranken, soil moisture and, hence, transpiration could be more important than wind.
In 1983, an experiment was conducted to try to evaluate the influence of wind. Slatted fencing 1.2 meters high was placed around certain plots of large

34 Maine Agricultural Experiment Station Technical Bulletin 116
and small canopies and measurements taken of air movement under various wind velocities within and above potato canopies at various stages of crop growth. After canopies had closed in, wind direction or velocity up to 17-20 kilometers had little influence within canopies. However, the instrumentation available was not sensitive to movement of less than 1-5 kilometers and few conclusions can be drawn from this test except that established canopies, regardless of densities, reduce air flow drastically as compared to that which occurs 25-38 centimeters above the canopy.
In 1984, a field test was designed to determine the relative importance of soil evaporation and leaf transpiration as modifiers of the general atmosphere in contributing to canopy RH. Hudson and Monona cultivars were used. Irrigation was applied to certain plots, black plastic was placed between some rows for one day prior to and during RH measurements, and then removed so that general plant growth would not be affected. Treatments were arranged in a split plot design with the smallest units split between plus and minus plastic. Due to the difficulty of placing and removing plastic, strips only 45.7 centimeters wide were used. Thus, at most, only one-half the soil area was covered. Furthermore, the plastic was not buried along the edges and some soil evaporation probably occurred from the area covered. The 1984 growing season was relatively wet and only a few times was it possible to have meaningful irrigation treatments.
In July, before the canopies were closed in, 24 hours after irrigation, readings were taken midday and the following midnight (Table 13). TheRH was lowest in the bare-ground area, intermediate in Kennebec, and highest in Monona. Irrigated plots had slightly higher RH than nonirrigated. Plastic seemed to reduce RH in the bare-ground plots, but variations were too great to draw conclusions in the cropped plots. At midnight, all plots had 90 to 100 percent RH. On July 31, canopies had closed in, and irrigation and plastic were applied. Readings were made at 9:00 a.m. and 3:00 p.m. the following day. Bare-ground plots had the lowest RH. There was too much variation to permit generalizations about RH within canopies except that there were no consistent differences between cultivars, between irrigated and none, or plastic strips and none. Obviously, the plastic strips failed to separate soil evaporation and leaf transpiration as sources of RH.
Throughout four years of tests, RH differences due to treatments and cultivars were minimal and quite variable. However, in those few instances where there were consistent differences, larger canopies and closer spacings tended to have the lower RH. Often these findings were associated with lower soil moisture within the crop row as measured in ohms resistance.
As can be seen from Table 14, soil moisture was fairly uniform in uncropped plots. Also, it was generally higher throughout the season than in any other plots. Despite the fact that 1984 was fairly wet and irrigation was added, moisture was lower in cropped than in uncropped areas. Within 24 hours of irrigation, ohms resistance t - " ' "~"

Maine Agricultural Experiment Station Technical Bulletin 116 35
Table 13. Level of relative humidity 2, 24, and 48 hours after irrigation.
7/16(2)' 7/17(24)" 8/1 (48)"''
Cultivar Irrigation' Plastic'1 I' II' I' II1 I' II'
None 0 0 70 74 70 76 73 79 None 0 + (.7 74 69 69 71 82 None + 0 84 91 86 83 79 7?-. None + + 78 91 78 91 98 85 Kennebec (I 0 78 83 78 81 83 86 Kennebec 0 + 77 74 77 74 80 76 Kennebec + 0 97 83 97 83 91 79 Kennebec + + 85 S4 86 85 78 90 Monona 0 (1 81 88 96 87 87 73 Monona 0 + 82 73 82 72 83 69 Monona + 0 85 02 82 70 86 70 Monona + + 85 74 85 72 82 79 •"Day with number of hours after irrigation in parentheses. K3:00 p.m. c0 = no irrigation; + = irrigation, d0 = no plastic; + = plastic. 'Replication number.
Table 14. Soil moisture 12.7 centimeters deep (500 ohms resistance) before and after irrigation, 19S4.
7/16 7/IS 7/31 8/1 (before)" ( 24)- (24) (48)a
Cultivar Irrigation11 Plastic' Id IId Id IId V IId Id IId
None 0 0 0.7 0.7 0.7 0.7 0.7 0.6 0.8 0.6 None 0 + 0.7 0.7 0.7 1.0 0.7 0.8 0.6 0.9 None + 0 0.8 0.7 0.7 0.7 0.7 0.7 0.8 0.5 None + + 0.7 0.7 0.7 0.7 0.6 0.7 0.6 0.7 Kennebec I) 0 2.3 6.0 4.0 6.8 1.(1 2.7 1.6 5.9 Kennebec 0 + 5.0 2.6 7.1 3.6 4.1 0.8 7.4 1.8
Kennebec + 0 10.0 11.0 1.2 0.7 1.1 1.3 2.4 3.6
Kennebec + + 8.0 7.0 0.7 0.7 1.0 1.0 2.0 1.6
Monona 0 0 8.0 4.4 10.0 7.2 0.7 1.1 0.9 2.3
Monona 0 + 3.0 6.0 3.2 >10.0 1.0 1.5 1.7 2.8
Monona + 0 3.7 1.8 1.7 <0.1 1.4 0.9 3.0
Monona + + 3.2 8.0 0.7 0.9 0.8 0.7 0.8 0.8
'Day with number of hours after irrigation in parentheses. h0 = no irrigation; + = irrigation. c0 = no plastic; + = plastic.
''Rep'' ••

36 Maine Agricultural Experiment Station Technical Bulletin 116
Light Interception and Related Factors Influencing Weed Suppression
There is a very high correlation between light interception by potato cultivars and degree of weed suppression (Sweet and Sieczka, 1973; Yip, 1975; Hossain, 1980; VanVranken, 1983). There has been limited investigation of factors that could accompany shade and could contribute to increased weed suppression. Yip (1975) did limited greenhouse studies on above versus below ground interactions between redroot pigweed (Amaranthus retroflexus) and two potato cultivars, Katahdin and Norchip. By utilizing plywood containers of different depths to permit different soil volumes, and aluminum sheets to keep out lateral illumination, he grew potatoes and pigweed alone or together. He concluded that below ground interference was insignificant, and that light interception was by far the most important factor. It was apparent in these studies, in 1981, 1982, and 1983, that large canopies could have less moisture at 15.2 centimeters. However, by inspection the surface of shaded soil appears to be quite moist as compared to open soil. Since annual weeds tend to germinate in the top 2.5 centimeters or so, it is questionable if moisture at 15.2 centimeters would have much influence on weed sprouting and emergence.
In 1984, a field experiment was conducted in which light and heavy artificial shade were compared with Kennebec and Monona as to their influence on numbers, sizes, and species of weeds which developed. Commercial shade cloth was fastened to light-weight 2.4m x 2.4m wood frames and placed over bare-ground plots. The cloth was about 30.5 centimeters above the soil and was open at all edges so that air movement would not be restricted. Unfortunately, the shade cloth provided much less light interception than the 30 percent and 75 percent listed by the supplier. This difference probably was due to the fact that the light measuring device we used recorded only those wave lengths important to plants and the fabric listing probably referred to total light. The 1984 season was cool and moist early and favored vigorous vine development and a heavy weed flush early.
A few key findings are presented in Table 15. The level of shade provided by both cultivars in the crop row was very much greater than that provided by either shade cloth treatment. Thus, no direct conclusions regarding factors other than cultivar shade are possible. Three weed species were present at heavy populations: redroot pigweed, galinsoga, and common lambsquarters. Cultivar shading was a major effect and it seemed to influence both "early numbers as well as "survivors'' Both Monona and Kennebec were particularly detrimental to redroot pigweed but the trends with galinsoga and lambsquarters were obscured by variability.
Characterization of Cultivar Canopies
Tests were conducted at the Freeville research farm in plots adjacent to those for RH. Plots were four rows wide, 3-3.6 meters in length, with the two

Maine Agricultural Experiment Station Technical Bulletin 116 37
Table 15. Light intensity and weed presence at vine close-in and at fall-over.
Weed Species
Cloth AMAREJ GASCL CHEAL'
Cultivar shade ME/Sech A' Bc Ac Bc Ac Bc
numbers/m :
1 24 0 9 0 4 9 1 5 5
37 31 20 6 21 46 1 1 9 12 32 2 6 6 17
WMARK = Redroot pigweed; GASCI = Galinsoga G ciliata and G. parviflora\ CHEAL = Lambsquarters. hMicro Einstein's/rnVsec, bright day at close-in. A = at 'close-in', B — at 'fall-over'.
center rows used for data taking. There were three replications. In 1982, 15 cultivars were studied and the same ones repeated in 1983. In 1984, only Kennebec, Monona, Rosa, and Katahdin were continued.
In 1982, emergence counts were made at three-day intervals and plant row-width measured at four and six weeks. Dates of close-in were recorded at two-day intervals. Light readings were taken with a Lambda Portable Ll-185 Quantum/Radiometer/Photometer at six weeks and following complete close-in as well as just prior to harvest. Fall-over was recorded beginning in early August and continuing at two-day intervals. One of the replications was utilized for destructive harvests. Leaves and stems were counted and dry weights determined. Similar data were obtained in 1983 but the actual dates of taking the measurements were somewhat different, although the growth stages were similar.
In 1982, 50 percent emergence for the earliest and the latest emerging cultivars differed by six days, and the mean 50 percent point was 17.8 days after planting. However, in 1983 this difference was reduced to only three days, perhaps because in 1983 all seed was kept at a warm temperature for an extended period prior to planting. Because of the cooler season in 1983, average 50 percent emergence was about 22 days (Table 16).
The resu Its over the three-year period pointed out that although seasonal effects caused overall differences in plant growth as measured by dry weight, some cultivars such as Kennebec always gave relatively large canopies (Table 17). On the other hand, NY59 and Rosa varied from large to intermediate to small, depending on the season. The remaining 12 cultivars were intermediate in variability among seasons.
Regardless of cultivar, light interception within the plant row up until fall-over may be much greater than necessary to suppress weeds (Table 18).
1. Kennebec none 25 38 2. Monona none 85 41 3. None none 1,371 56 4. None light 1,010 81 5. None heavy 444 51

38 Maine Agricultural Experiment Station Technical Bulletin 11ft
Table 16. Early canopy width and days to close-in, 1982 and 1983.
Early width (cm) Rar ikingQ Days to Close-in
Cultivar 1982 1983 1982 1983 1982 1983
Atlantic 28.6 27.4 10 9 52 53 Belchip 40.3 33.0 2 5 50 48 BelRus 25.2 26.9 14 11 56 53 Chipbelle 23.7 27.2 15 10 52 50 Hudson 26.3 29.7 12 7 48 46 Katahdin 26.9 24.1 11 14 56 50 Kennebec 38.6 34.3 4 6 52 48 Lemhi 26.3 33.5 13 3 54 46 Monona 34.0 21.3 5 15 52 55 Norchip 33.8 34.5 6 1 56 46 Norland 34.4 31.0 4 6 52 48 NY59 28.9 25.6 9 13 56 56 R. Burbank 31.7 27.9 7 8 50 54 Rosa 31.6 26.4 8 12 50 54 Superior 42.7 33.3 1 4 48 48
°1 closed-in in the fewest days; 15 took the most days to close-in.
Table 17. Canopy size as measured by top dry weight in 1982, 1983, and 1984.
Dry Weight Tops*
Largeb Intermediateb Smallb
Atlantic 82 Atlantic 83 NY59 83 Kennebec 82,83, 84 Hudson 82 BelRus 83 NY59 82 Katahdin 82,84 Norchip 82,83 Lemhi 82 R. Burbank 82,83 Superior 82,83 Hudson 83 BelRus 82 Katahdin 83 Rosa 83 Rosa 84 Belchip
Rosa Monona Chipbelle Norland
82,83 82 82,83,84 82,83 82,83
'Fifteen cultivars in 1982 and 1983, only four in 1984. bRelative weights (in grams):
1982: Large = 250-400; Intermediate = 150-200; Small = 80-150. 1983: Large = 200-275; Intermediate = 155-205; Small = 110-150.
1984: Large = 150-175; Intermediate = 125-175; Small = 100-150.

Maine Agricultural Experiment Station Technical Bulletin 116 39
Table 18. Percent light interception between plants, 1982.
July 5 (2 weeks July 30 Sept. 5 (after Cultivar after emergence) (at close-in) fall-over) Atlantic 88.6 100.0 82.3 Belchip 95.6 97.5 51.2 BelRus 89.9 99.4 0.0 Chipbelle 89.9 99.2 82.3 Hudson 85.2 98.4 35.3 Katahdin 92.9 90.0 88.9 Kennebec 94.5 97.3 62.3 Lemhi 92.5 98.0 77.8 Monona 95.0 97.5 *>-> 2
Norchip 94.2 100.0 26.7 Norland 87.5 94.3 4.5 NY59 90.9 97.8 82.3 R. Burbank 92.9 98.8 68.9 Rosa 87.6 97.3 62.3 Superior 95.6 95.4 0.0
However, after fall-over, light levels on many cultivars are sufficient to encourage weeds. Early in the season, weeds emerged before and shortly after the potatoes. Speed of cultivar emergence could be an important factor, but management of seed prior to planting as well as seasonal factors appeared to cause considerable variation in speed of emergence for most cultivars.
Economics
Economic evaluations were made for many of the practices suggested by the research of weed scientists, plant pathologists, entomologists, and IPM program coordinators. The general approach guiding the economic evaluation involved an assessment of the baseline situation (i.e., non-IPM production) and a determination of net benefits (or costs) to implement IPM practices. Because of the large number of experiments and disciplines involved and funding limitations, it was impossible to evaluate all potential practices reported elsewhere in this report.
As enumerated in the earlier definition of IPM, the integrated crop protection approach employs a wide variety of techniques, such as soil tillage, crop rotations, and resistant varieties, in addition to chemicals. IPM delivery is usually based on information; i.e., providing the grower with data about the presence and population of specific pests, the recommended amounts and timing of pesticide applications to obtain economic treatment levels, and

40 Maine Agricultural Experiment Station Technical Bulletin 116
the availability of alternative or supplemental measures such as resistant varieties and rotations. Hence, the framework for assessing the economics of IPM practices was based on the costs and value of pest management information.
Costs and Value of Information
With the emphasis on providing information in IPM delivery, the economic question is the following: will the use of information provided by IPM result in increased net revenue for growers which exceeds the additional cost of providing the information? If so, the IPM deliverv system is economical. The concept may be illustrated by considering the cost and value of information derived from using an economic threshold.
The first attempts at a mathematicallv rigorous definition of an optimum pest population were made by Headley (1972) and Stern (1973). Headley introduced the concepts of the value of production and the cost of control for varying pest population levels. Headley assumes continuous functions for the value of production (R) and the cost of control (C), both of which are functions of the pest population (P) as shown in Figure 2. The value of
U.S. Dollars
Figure 2. Relation of value of production, control costs, and pest population.
production is assumed to decrease at an increasing rate as the pest population increases while the cost of control decreases at a decreasing rate.
The economic threshold is the pest population, P, at which the incremental losses in value of production as pest population increases are equal to the

Maine Agricultural Experiment Station Technical Bulletin 116 41
incremental cost of preventing that damage. This maximizes the distance between the value of production and the cost of control; therefore P is the "optimal" population in an economic sense.
To solve for P, one can form an equation for net revenue, N. Net revenue is the difference between R and C:
(1)N = R - C. The economic threshold, P, is derived by finding the unique pest population where the slope of R equals the slope of C, or
dN = d R _ d C [ ' d P dP dP Setting ^ dR _ dC
U , ) d p - d P " and solving for P vields P.
From Figure 2, it can be seen that N = bd when P = P. What is the value of a grower knowing that P is the economic threshold? Suppose the grower normallv applies control measures when the pest population is P*. Then N = ac. In this case the value of information is bd — ac, or the difference between the net revenue when a threshold rule is used compared with the net revenue when the threshold rule is not used. The value of information depends ultimately on the relative elasticities of the functions for the value of production and costs.
N umerous illustrations of the costs and value of information can be drawn from the example above. For example, suppose that R and C are averages representing the functional relationships over many years. Suppose that, by using a certain decision rule, the grower in an averageyear applies control to attain pest population P*. How much can the grower afford to pay, to hire an IPM scout to determine the economic threshold? Obviously, the grower would not be willing to pay more than the difference between bd and ac for scouting if he wishes to maximize expected profit.
There are manv difficulties in applying the economic threshold concept, which is one form of the use of IPM information. These difficulties include the variability of pest density among fields and growing seasons, the variability in the effect of pest density on the value of production, and the accuracy of the grower's information about pest densities and crop losses. These factors, when combined with growers' aversion to risk, imply that maximizing expected profit is not necessarily the relevant decision criterion.
The Value of Economic Thresholds
The economic threshold concept formalizes the principle that pests should be tolerated when expected losses are less than the additional costs of controlling the pest. This principle is fundamental to integrated pest management (Apple et al., 1979) because tolerance of low pest densities allows use of

42 Maine Agricultural Experiment Station Technical Bulletin lift
management practices that are more diverse and less costly than those needed to eradicate pests.
In addition to its importance as a concept supporting integrated pest management, the economic threshold has been used widely in practice to decide whether pest densities warrant control. Ideally, the use of economic thresholds as decision rules increases net revenue to growers by indicating when pest control measures are justified economically. In the use of the economic threshold, it is assumed that the grower has perfect knowledge about the pest density, the damage associated with different pest densities, the effect of pest management inputs on pest densitv, and the price of the crop at the time of marketing. In reality, these factors are not known with certainty. What is the value of the use of an economic threshold criterion for making pest management decisions? The field sampling and research for acquiring the necessary information and applying the economic threshold decision rule both have costs, including direct expenditures and opportunity costs of foregoing other managerial and research activities. An important question for evaluating an economic threshold for a particular pest problem is whether the costs of developing and using the threshold decision rule exceed the benefits. This question is analogous to one posed by Havlicek and Seagraves (1962) concerning the value of information for improving the use of fertilizer. As in their analysis, the value of a threshold decision rule can be assessed by comparing net revenue when pest management decisions are made with the rule and net revenue when decisions are made without it. Since pest management tactics such as the use of pesticides mav have external costs not reflected in net revenue to individual growers, these costs mav also be considered in the comparison.
We conducted an evaluation of the value of economic thresholds in managing pests. The objectives of this study were to describe the characteristics of pest problems that most affect the value of economic thresholds, indicate the types of pest problems for which the thresholds are potentially most valuable, and determine the quality of information needed to fulfill that potential.
A mathematical model and Monte Carlo simulation were used to compare the costs of pesticide and crop loss using economic thresholds, routine application of pesticide, and no applications (Fohner, White, and Schwager, 1982). This comparison was made for a range of alternative assumptions about five factors:
1. The magnitude and variability of pest density among fields and growing seasons,
2. the function relating pest density and expected crop loss, 3. the variability in the effect of pest density on crop loss, 4. the effectiveness with which a pesticide prevents crop loss, and

Maine Agricultural Experiment Station Technical Iiulletin 116 43
5. the accuracy of the decision maker's information about pest density and the relationship between pest density and crop loss.
Our simulation experiments showed that the performance of the economic threshold depended primarily on the magnitude and variability of pest density. Economic thresholds were most valuable when pest densities both well above and well below the threshold were likelv to occur. While this variability in pest density favored the use of economic thresholds, variability in crop losses for particular pest densities was unfavorable because it reduced the predictability of crop loss based on estimated density. The value of increasing the accuracy of the estimated threshold depended on the magnitude and variability of pest density and the slope of the function relating pest density and expected crop loss. Thresholds based on estimates of crop loss within 20 percent of the true average loss generally performed nearly as well as the true economic threshold. When sample counts were assumed to be errorless, and the spatial distribution of the pest in the field was negative binomial, the value of using the economic threshold was not increased substantiallv by sampling 60 instead of 30 plants.
With respect to the application of economic thresholds to potato IPM, the following situations would be amenable to threshold rules:
1. Measurement of pest density provides timely, accurate predictions of crop loss, and management options are available for responding effectively to those predictions.
2. a. Pest densities on both sides of the threshold are common and are often well above or well below the threshold; or
b. pest densities are consistently below the threshold, but most farmers apply pesticides regularly, or high and costly densities sometimes occur.
3. a. The cost of pesticide and losses to the pest are both high relative to the cost of estimating pest density; or
b. the external and long-run costs of pesticides are high. Given the variability in the effect of pest density on crop loss and the
existing accuracy of the decision maker's information about pest densities and crop loss, there are many situations in which the fine-tuning of economic thresholds does not lead to improved pest management practices by risk averse growers.
There is another dimension of economic thresholds which is rarely addressed, i.e. those instances in which pest levels any particular year are influenced greatly by the controls used in previous seasons on that particular field. Similarly, controls required in future years may be influenced by control measures undertaken in the current year. Many annual and perennial weeds, the Colorado potato beetle, and nematodes are examples of pests of this type. Unfortunately there are no generally accepted techniques for establishing and evaluating thresholds for these pests, particularly when populations are

44 Maine Agricultural Experiment Station Technical Bulletin 116
extremely low when first observed. There would be little benefit in increased crop yields in the current vear resulting from special treatments when pest levels are low, but it should be considered that yield reductions in subsequent seasons may be largely prevented.
Baseline Data: Pest Control Practices and Costs
To determine the potential costs and benefits of IPM participation, it was first necessarv to evaluate prevailing practices prior to adoption of IPM. Three surveys of growers were initiated to assess grower practices and costs for New York State.
Potato growers in two areas in upstate New York were surveyed by mail about their pest control practices during the 1980 growing season (Fohner and White, 1981). Information about acreage, varieties, intended market, land type, herbicides, systemic and foliar insecticides, frequency of fungicide sprays, and method of pesticide application was received from 38 growers having four or more hectares of potatoes. These 38 respondents constituted 81 percent of the sample population. The "Wayne Study Area' encompassed Wayne and Ontario Counties. The "Steuben Study Area' contained Steuben County and a small part of Livingston County. The purpose of the survey was to describe the pest control practices of potato growers in the two study areas and to provide a basis for a later indepth field survey designed to estimate the cost of control practices. Except for information about acreage, approximate frequency of fungicide applications and specifications of spray equipment, the information sought with the mail questionnaire was qualitative, indicating the names but not amounts of the pesticides that were used.
Detailed results from the survey were reported in Fohner and White (1981). The results indicated that the differences between the study areas in terms of potato acreage per farm, potato varieties grown, marketing (tablestock or for chipping), degree of specialization, and land resources dictated that recommendations and methods of delivering IPM information would have to be different for the different potato-producing areas. This was especially evident for the management of insect pests.
The frequency of use of svstemic insecticides (applied into the soil at planting and subsequently taken up by the plant) is summarized in Table 19 for the two study areas. Eight growers in the Wavne Study Area did not use any systemic insecticides. Seven of these farms were relatively small (4 to 20 hectares of potatoes), and producing primarily tablestock potatoes. On the other hand, 19 growers (or 95 percent of the growers) in the Steuben Study Area applied systemic insecticides to all their acreage. Aldicarb was the most frequently used systemic material in the Wavne Study Area, while disulfoton was in most frequent use in the Steuben Study Area.
The use of systemic insecticides has implications for the potential costs and benefits from IPM deliver,' systems. The use of a systemic insecticide greatly

Maine Agricultural Experiment Station Technical Bulletin ll<> 45
Table 19. Use of systemic insecticides on chipping and tablestock potatoes, Upstate New York, 1980.
Wayne Study Area Steuben Study Area No. of Farms % of Farms N o. of Farms % of Farms
Not applied on any acreage 8 44.4ffn 0 0.0%
Applied to all acreage 6 33.3 19 95.0 Applied on more than
halfo\ acreage 4 22.2 0 0.0 Applied on less than
halfoA acreage 0 0.0 1 5.0 Totals 18 100.0% 20 100.0%
reduces the need for subsequent applications and, hence, the flexibility to adopt threshold rules to schedule insecticide applications.
From the standpoint of severity of insect problems and emphasis on foliar insecticides, the Wayne Study Area, especially for small farms, seemed to offer more potential for field scouting than was offered in the Steuben Study Area. However, the small farm class in the Wayne Study Area contained less than 142 hectares, all distributed in small parcels. The per hectare cost of IPM delivery to small growers can be expected to be higher than for large growers (Thompson and White, 1982). Only one grower in the large farm class did not use a systemic insecticide, but four reported that they did not use systemicson some of their potato acreage. The amount of land on these farms that is treated with a systemic insecticide may strongly affect the potential for field scouting, at least in the near future.
In the 1980 survey, growers were also asked about their frequency of spraving fungicides. Virtually all growers reported spraying fungicides according to an approximately regular schedule. Thirty-nine percent of all growers reported using a seven day schedule, 54 percent reported spray intervals of more than seven days, and seven percent reported spray intervals of less than seven days. The 1980 growing season was a dry one in many parts of New York State, and was generally regarded as a year which was unfavorable for the development of late blight disease on potatoes. Yet, only 11 percent of the growers indicated that they used fewer fungicide sprays in 1980. This suggested the economic potential for the use of scheduling fungicide applications with a late blight forecasting method, such as Blitecast. The results of a simulation experiment to evaluate the use of Blitecast are reported earlier in this bulletin.
In 1981, the baseline costs for growers from three study areas were surveyed (Fohner and White, 1982). In addition to the Wayne and Steuben Study Areas, spray records were kept for Long Island farms.

46 Maine Agricultural Experiment Station Technical Bulletin 116
The purpose of this survey was to collect information about the quantity and costs of pesticides used on potatoes in upstate New York. The objectives for collecting this information were to: 1) provide potato growers with an accounting of the quantity of pesticides they used on their potatoes, and a comparison with the quantities used on other potato farms in their area; and 2) help guide the potato pest management program in upstate New York and provide a baseline for evaluating the program in the future. Records of pesticide use were collected biweekly during the 1981 growing season from 25 potato growers in two areas in upstate New York and from eight growers on Long Island. Sampling was neither random nor free of bias, but auxiliary information about the target population allowed inferences about the relationship between the sample and that population.
Average cost per hectare was S356 for the Wayne Study Area, 5240 in the Steuben Study Area, and $850 in the Long Island Study Area, excluding the cost of application, seed treatment, and vine-killer (Table 20). Most of the difference in average cost among the three areas was from a difference in foliar-applied insecticides. Foliar applications of insecticide occurred throughout the growing season in the two high-cost areas, while most occurred during early July in the low-cost area. Long Island growers could not apply a systemic insecticide due to the withdrawal of aldicarb.
In-furrow, systemic insecticides and aerial application of foliar sprays were both found to be common in upstate New York, and may limit the potential for management practices promoted in the potato pest management program. Some economic potential for using thresholds on Long Island was suggested by the very high foliar insecticide costs.
Economics of Rotations
Potatoes are the major field crop produced on Long Island, New York and have been grown continuously on many fields. However, pest populations have increased in recent years. Insects have become resistant to some insecticides. Until 1980, Long Island growers had relied heavily on aldicarb (Temik), a systemic insecticide, to control the Colorado potato beetle, but the use of this chemical led to ground water contamination. In 1980 the use of aldicarb was banned on Long Island. The threat of ground water contamination associated with the use of aldicarb has created an increased awareness of some of the problems of intense pesticide use. Alternative pesticides used in large quantities also have the potential to cause ground water contamination.
Continuous potato production has, in the past, been an economical practice for the productive Long Island soils; it may not be economical in the future given the pest management options now available to growers. Integrated pest management (IPM) is a potential solution to some of the potato production problems on Long Island. An IPM tactic that reduces pesticide use and incorporates other pest management tactics is crop rotation. To date,

Table 20. Total and per hectare costs for pesticides, three study areas in New York, 1981.
Wayne Study Area-1
Avg. Cost Total Cost Per Hectare
Herbicides1' 542,940 $54 Fungicides1 85,612 108 Foliar
Insecticides 87,057 110 In-furrow
Insecticides 66,517 84
Totals 5282,126 5356
\Vj\ ne Study Area: records for 10 farms, 793 hectares Steuben Study Area: records for 15 farms, 1.343 hectares. Long Island Study Area: records for 8 farms, b:W hectares.
hCost of vinekiller and herbicides used in rotation not included. 'Cost of seed treatment not included. N.A. = Not Available.
Steuben Study Area' Fong Island Study Areaa
Avg. Cost Avg. Cost Total Cost Per Hectare Total Cost Per Hectare
557,749 542 N.A. N.A. 119,043 89 $65,417 5101
21,097 15 477,902 749
126,302 94 0 0
5324,191 5240 S543,319 585(1
Main
e A
gric
ultu
ral E
xperim
ent S
tatio
n T
ech
nica
l Bulle
tin lib
47

4S Maine Agricultural Experiment Station Technical Bulletin lid
crop rotations remain the major nonchemical control measure available and recommended to Long Island growers.
Rotating potatoes with other crops can help reduce the population of potato pests, but this practice will not be a widely used IPM technique until its effects on farm income are more fully understood. We evaluated the economics of various crop rotations. The returns over variable costs were estimated for several cropping alternatives given successively restrictive constraints on total potato acreage. Changes in returns over variable costs demonstrate the short-run economic impact, enabling the ranking of various rotational options. The level of pesticide use was also used as a measure of performance for rotation alternatives. Current knowledge of the movement of pesticides in the soil to ground water, and the ultimate effects on human health, do not permit a complete specification of environmental quality associated with various farm plans. In our model, reduced pesticide usage measured by pounds of active ingredients of insecticides, fungicides, and herbicides was considered an improvement in environmental quality. Sensitivity analyses were conducted for yield changes and potential changes in pesticide costs.
To evaluate the economics of rotations, we developed a linear programming model for representative 60.7 hectare potato farms for the North Fork and the South Fork on Long Island. Details of the model and the results for both Forks are presented in Lazarus and White (1983). Due to the similarity of results from the two Forks, only the North Fork model is discussed in this publication.
Two different cropping plans were considered. In the first, only field crops were permitted as alternatives in rotations with potatoes. These crops included rye, corn, a double crop of wheat and soybeans, oats, sunflowers, and dry beans. In a second maximization, vegetable crops, as well as field crops, were permitted as alternatives. Vegetable crops selected for rotation with potatoes were cauliflower and cabbage. Both of these crops tolerate a relatively low pH and are currently grown bv some potato growers on Long Island.
A constraint on the selection of rotations was the necessity' to maintain soil acidity for potato production. A low pH is required to minimize problems with potato scab. Rye, cauliflower, and cabbage are crops that tolerate a low pH soil. These crops are relatively common on Long Island. Many other crops, however, require higher pH's to produce economical yields. It is possible to raise the soil pH slightly to allow the production of these crops, yet not so much that potato scab would be a major problem the following year. This results in slightly reduced yields for most of the field crops considered.
The objective function in the linear programming model was to maximize returns above variable costs. Variable costs in crop budgets included seed, fertilizer, chemicals, custom harvesting charges for grain, and machinery and irrigation variable costs. Variable costs included as activities in the linear

Maine Agricultural Experiment Station Technical Bulletin 116 49
programming model were hiring labor, borrowing operating capital, and selling and buying rye. A set of sample budgets for the potato-cauliflower rotation is shown in Table 21.
The results of the analysis showed that if only field crops were considered as cropping alternatives, continuous potato production was the most profitable cropping practice on the North Fork. Returns above variable costs were S10 LOSS and all available cropland was planted to potatoes (Table 22). Only 152 hours of hired labor were required.
As the maximum potato acreage was reduced by 10.1 hectare increments, returns over variable costs were reduced by successively larger amounts; pounds of active pesticide ingredients were also reduced. Potato producers did not have an economic incentive to use additional field crop rotations according to the model results. If the government restricted pesticide use, the results show which rotations were the most economically feasible. With potato production limited to 30.4 hectares (potatoes grown one year out of two), returns above variable costs were S61,742; 61 percent of the optimal
Table 21. Budgets for a hectare of the potato-cauliflower rotation, North Fork, Suffolk County, New York, 1982.
Contribution to
Objective Item Unit Price Quantity Total Function"
Potatoes
Receipts: 90% size A. U.S. No. 1 MT 5117.00 32.13 53,759.46 10% culls & size B MT 55.13 3.48 192.22
Total Receipts 53,951.68 Expenses: Seed kg- 0.16 2,392 382.72 Fertilizer - Nitrogen kg- 0.70 197 137.90
Phosphorous kg- 0.62 337 208.94 Potassium kg- 0.31 197 61.07
Chemicals - Fungicide 95.36 Insecticide 821.61 Herbicide 59.25
Machinery Variable Cost 233.48
Selected Variable Cost S2,000.33
Returns above Selected Variables Cost 51,951.35

50 Maine Agricultural Experiment Station Technical Bulletin 116
Table 21 — continued
Rye Cover Crop Machinery Variable Cost -$6.75 -$6.75
Cauliflower Receipts: MT $426.00 16.85 57,180.11 Expenses: Plants 1,000 26.40 25 $660.00 Fertilizer - Nitrogen kg- 0.70 180 126.00
Phosphorous kg- 0.62 359 222.58 Potassium kg- 0.31 180 55.80 Lime (hydrat.) MT 134.48 1.12 150.62
Chemicals - Insecticide 254.41 Herbicide 26.19 Fungicide 47.57
Containers 1.45 1,060 1,537.00 Machinery Variable Cost 182.14
Selected Variable Costs S3,262.31 Returns above Selected Variable Costs 53,917.80
JThe objective function value for the entire rotation is 151,951.35 — 56.75 + 53,917.80) •*- the land requirement, or 55,862.40 -^ 2 = 52,931.21) per hectare per year for the rotation.
plan with all cropland planted to potatoes. Total pesticide use was 48 percent of the optimal plan with all land in potatoes.
As potato production was restricted, the first field crop to enter the solution was rye in quantities just sufficient to provide seed to plant the cover crop. The next rotation to appear was a year of potatoes followed by a double crop of winter wheat and soybeans. Finally, if only 20.2 hectares of potatoes were permitted, a three year rotation of potatoes, winter wheat/soybeans double crop, and corn came into the solution. Total pesticide use was 36 percent of the optimal plan with all land in potatoes.
If rotations with cauliflower and cabbage (cole crops) were considered, returns above variable costs with potato production not restricted were increased to $107,515 (Table 23). The optimal plan for all scenarios included 10.1 hectares of cauliflower. This cropping plan for the representative farm is consistent with some North Fork farms where just a few hectares of vegetables are grown. As the production constraint for potatoes was decreased, the farm plans included cauliflower up to the maximum of 10.1 hectares. Then field crop rotations began to appear in the same order of profitability as in the earlier analysis when only field crops were permitted as alternatives. Pesticide use was reduced by each successively restrictive potato constraint. Hired

Maine Agricultural Experiment Station Technical Bulletin lid 51
Table 22. Optimal rotations with limitations on maximum potato production, field crop rotations. North Fork, Suffolk County, New York.
Maximum Potato Constraint (hectare)
60.7 50.0 40.5 30.4 20.2
Returns above variable costs (5) 10 LOSS 88,389 75,244 61,742 44,865
Rotations (hectares)
Cont inuous potatoes 60.7 40.5 20.2 0 0
Potatoes - rye 0 4.9 4.9 4.9 1.6
Potatoes - corn 0 1) (1 0 II
Potatoes - winter wheat -
wheat/soybeans 0 15.4 35.6 55.8 0
Potatoes - winter whea t /
soybeans - corn I) 11 0 0 59.1
Potatoes - oats 0 0 0 0 1)
Potatoes - sunflowers 0 0 0 0 0
Potatoes - dry beans 0 (1 0 0 0
Unused land resource 0 1) 0 11 0
Total hectares in potatoes 60.7 50.6 40.5 30.4 20.2
Hired labor activity (hours) 152 60 0 0 0
Unused labor resource (hours) 1,161 1,394 1,647 1,959 2,121
Pesticide active ingredient
(kilograms) 3,116 2,578 2,045 1,510 1,108
Fungicide 867 722 578 433 290
Insecticide 1,840 1,506 1,173 840 648
Herbicide 409 350 294 237 170
labor decreased as field crops came into the optimal solution. Hired labor for the 10.1 hectare cauliflower crop totaled more than 2,000 hours of seasonal labor hired from August through October.
Optimal solutions were not very sensitive to yield changes or changes in pesticide costs. If growers' adjustments were made in the form of increased pesticide use while maintaining potato yields, a doubling of pesticide costs did not change the cropping pattern. Even though a 100 percent increase in pesticide costs did not cause changes in cropping patterns, net returns above variable costs were obviously greatly reduced.
If yields in the continuous potato rotation decreased due to a continuing development of resistance in the Colorado potato beetle to pesticides, a reduction of 30 percent was required to change the rotations in the optimal solution if field crops were the only cropping alternatives. A 28 percent yield decrease in continuous potato yields caused a change in the optimal solution

52 Maine Agricultural Experiment Station Technical Bulletin 110
Table 23. Optimal rotations with limitations on maximum potato production, field crop and cole crop rotations, North Pork, Suffolk County,
New York.
Maximum Potato Constraint (hectare)
60.7 50.6 40.5 30.4 20.2
Returns above variable costs (5) 107,515 107,515 95,275 82,685 64,629
Rotations (hectares) Continuous potatoes 40.5 40.5 20.2 0 0 Potatoes - rye I) 0 4.9 4.9 0 Potatoes - corn 0 0 0 0 0 Potatoes - winter wheat/
soybeans I) 0 15.4 35.6 0 Potatoes - winter wheat/
soybeans - corn (I 0 0 0 30.8 Potatoes - oats 0 0 0 (J 0 Potatoes - sunflowers 0 (1 0 0 0 Potatoes - dry beans 0 0 0 0 0 Potatoes - cauliflower 20.2 20.2 20.2 20.2 20.2 Potatoes - cabbage 0 0 0 0 0 Unused land resource 0 0 (J 0 60
Total hectares in potatoes 50.6 50.6 40.5 30.4 20.2 Hired labor activity (hours) 2,492 2,492 2,321 2,169 2,045 Unused labor resource (hours) 939 939 1,096 1,254 1,418 Pesticide active ingredients
(kilograms) 2,649 2,649 2,114 1,578 1,128 Fungicide 745 745 600 456 312 Insecticide 1,552 1,552 1,219 885 651 Herbicide 352 352 295 237 165
if cole crops were also an alternative. At yield reductions of about 32 percent, a significant change in the acreage of continuous potato production occurred. Even though returns were greatly reduced in both of these sensitivity analyses, continuous potatoes remained a profitable crop over a wide range of increased pesticide costs and vield decreases. Relaxing the 10.1 hectare constraint on vegetables would, however, significantly reduce the negative impact that increased chemical costs and decreased potato yields had on income.
In summary, our research showed that, as potato acreage was reduced, total pesticides used decreased by significant amounts, indicating a probable improvement in environmental quality. However, the results of the study

Maine Agricultural F.xperiment Station Technical Bulletin 116 53
indicated a strong economic incentive for growers on Long Island to continue growing potatoes intensively rather than changing to field crop rotations. There were relatively large sacrifices in returns above variable costs associated with more diversified farm plans. Potato and cauliflower rotations had high returns over variable costs. If Long Island potato growers can overcome the managerial problems of using seasonal labor, a potato-cauliflower rotation is a good alternative to continuous potato production. Cauliflower grows on low pH soils, like potatoes. Our results indicated that continuous potatoes and potato-cauliflower rotations are relativelv profitable alternatives even with increased pesticide costs and decreased yields for potatoes, which are likely developments with the loss of the chemical aldicarb.
Evaluation of the Steuben County (Upstate AVw York) IPM Program
During the 1984 growing season, an evaluation of the costs and benefits of the IPM program was examined (Meltzer, 1984). Previous research by Kohneret al., 1984, had indicated that Blitecast scheduled fungicide applications on average did not suppress late blight more effectively with less fungicide than did weekly applications (see p. 20). This evaluation focused on the cost-effectiveness of Blitecast for scheduling the first fungicide application of the season. If growers could delay the initiation of fungicide spraying by approximately one week, the benefits of the IPM program would exceed the cost of the program, or about S21 per hectare.
Questionnaires were mailed to all potato growers in Steuben County. The questionnaire addressed areas such as the perceived benefits of the program as seen by participants, knowledge about the program by nonparticipants, and current fungicide spraving practices. In addition, nonparticipating growers were asked the date of the first spray application during each of the last three growing seasons (1981-83).
Eight participating growers and 12 nonparticipants responded, accounting for 20 returns from an estimated population of 45 potato growers in Steuben Countv. Detailed results of the survey are reported in Meltzer (1984).
The comparison of IPM participants' first fungicide spray dates versus those of nonparticipants is shown in Table 24. The largest average difference between program participants' and nonparticipants' first spray dates occurred in 1983 with program participants showing an average delay of 10.3 days (i.e., just over one fungicide application) over nonparticipants' average first spray date. However, 1983 was a dry year, not ideal for fungus spore incubation. The three year average shows a 4.2 day delay in first spray application by participating farmers over nonparticipating farmers. It was concluded that a one spray delay (i.e., a savings of one spray) was not an average achieved by program participants. The costs of providing IPM
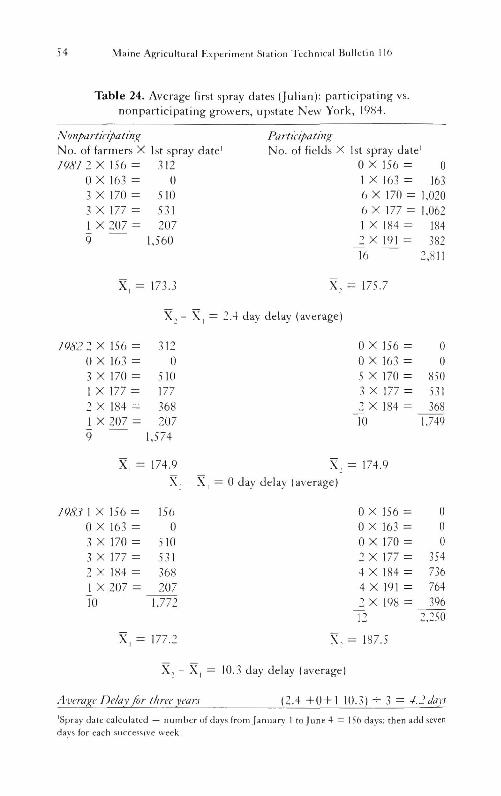
54 Maine Agricultural Fxperiment Station Technical Bulletin 116
Table 24. Average first spray dates (Julian): participating vs. nonparticipating growers, upstate New York, 1984.
Nonparticipating Participating No. of farmers X 1st spray date1 No. of fields X 1st spray date 1981 2 X 156 = 312 0 X 1 5 6 = 0
OX 163 = 0 1 X 163 = 163 3 X 170 = 510 6 X 170 = 1,020 3 X 177 = 531 6 X 177 = 1,062 1 X 207 = 207 1 X 1 8 4 = 184 9 1,560 2 X 191 = 382
16 2,811
X, = 173.3 X, = 175.7
X, - X, = 2.4 day delay (average)
1982 2 X 1 5 6 = 312 0 X 163 = 0 3 X 170 = 510 1 X 177 = 177 2 X 184 = 368 1 X 207 = 207 9 1,574
X, = 174.9
X.
1983 1 X 156 = 156 0 X 163 = 0 3 X 170 = 510 3 X 177 = 531 2 X 184 = 368 1 X 207 = 207 10 1,772
OX 156 = 0 0 X 163 = 0 5 X 170 = 850 3 X 177 = 531 2 X 184 = 368 10 1,749
X, = 174.9
X, = 0 day delay (average)
OX 156 = 0 0 X 163 = 0 0 X 170 = 0 2 X 177 = 354 4 X 184 = 736 4 X 191 = 764 2 X 198 = 396 12 2,250
C, = 187.5 X, = 177.2
X, - X( = 10.3 day delay (average)
Average Delay for three years (2.4 +04-1 10.3) -*- 3 = 4.2 days
Spray date calculated — number of days from January 1 to June 4 = 156 days; then add seven days for each successive week.

Maine Agricultural Experiment Station Technical Bulletin I In 55
growers with information about when to initiate spraying exceeded the value of the information by S5.o5 per hectare.
It should be emphasized that there may be other benefits to the program which could not be easily quantified in a cost-benefit framework. Most participating growers insisted that the program saved money, but it was not possible to determine the average number of sprays of the two groups for the duration of several seasons.
IMPLEMENTATION
Long Island Pilot IPM Program
The IPM Program
The Long Island pilot IPM program was based at the Long Island Horticultural Research Laboratory (LIHRL) of Cornell University. It was conducted with assistance from the Suffolk County Cooperative Extension Association and had both research and extension components during 1982-1984. Cooperating growers were provided with the best available pest management information while researchers refined and developed IPM management techniques. Needed research data were obtained which could not have been acquired in small experimental plots, while collecting pest population data that was immediately useful to the growers. This proved to be a successful approach. In 1982, eight growers participated in the program and 13(1 hectares were scouted. The IPM program was similar in size during 198.1 with 11 growers and a total of 125 hectares. In 1984, the size of the program increased to 30 growers and a total of 486 hectares.
Procedures
Field selection and scouting. Many of the fields in the program were part of a crop rotation studv. Pairs of potato fields on the same farm operation were selected: one which had been planted to rye the previous season was matched to a similar field planted to potatoes in the previous year. Paired fields were located at various distances from each other but were selected to minimize differences in soil type and were usually planted to the same potato cultivar. Additional fields were selected for pest monitoring based on grower interest. Information on cultural practices and field history was obtained from cooperating growers at the beginning of each season.
Regular field monitoring was initiated in early June as student workers became available. LIHRL personnel evaluated early season (mid to late May) CPB populations in the rotation studies, but technical assistance was not available to evaluate seed quality before planting. In 1982 a four hectare section of each field was monitored by two scouts working as a team. In 1983

56 Maine Agricultural I-Aperimcnt Station Technical Bulletin II')
and 1984, entire fields, up to 20 hectares, were monitored by scouts working separately. Fields were scouted most intensively for CPB but were also monitored for aphids, other insects, diseases, and weeds. Scouts did not enter fields until at least 48 hours after insecticide applications.
CPB were sampled by carefully examining 80 (1982) or 50 (1983) vines per field. This sample unit was chosen based on the work of Harcourt (1963). All above-ground CPB life stages were counted. Larvae were characterized as small (1st and 2nd instars) or large (3rd and 4th instars). Either 10 (1983) or 20 (1982) sample sites were chosen in each field. Scouts followed a zig-zag pattern through the field and sample sites and vines were chosen randomly. Defoliation was rated at each site on a scale from 0-5. When aphids became apparent (usually mid-July), weekly sampling was initiated; aphids were counted on four compound leaves at each of 10 sites. Any foliar diseases observed while scouts were taking data on insects were noted. Weekly scouting of late-maturing varieties was terminated at the end of August, whereas early maturing varieties were scouted until growers discontinued insecticide sprays.
All fields included in the program during 1982 and 1983 were sampled for plant parasitic nematodes. In 1984, since the size of the program was greatly expanded, only those fields in the rotation study or with signs of nematode damage were surveyed. Approximately five acre portions of fields were sampled for nematodes by collecting potato roots and rhizosphere soil using a diagonal sampling pattern (Barker, 1978). Fields were sampled twice during 1982 and 1983 and once during 1984. Five separate samples of roots and soil, each composed of 10 subsamples and representing one diagonal pass across the sampling area, were taken from each field. Nematodes were then extracted from a 50 cm' portion of each sample for five days at 20-24C, using the Baermann pie pan technique (Barker, 197S). In 1982, the suspension was passed through a 45 mm sieve and nematodes were rinsed off the screen using 40 ml of water. During 1983 and 1984, the procedure was changed to improve the efficiency of nematode recovery. The nematode suspension was not sieved and the volume of the nematode suspension was reduced to 50 ml before counting bv allowing the suspension to settle and aspirating off excess water. Roots were rinsed thoroughly to remove soil particles, squeezed between paper towels to remove excess water, and cut into 0.5 - 1.0 cm segments. Nematodes were extracted from a 5g subsample of root segments for three days at 20-24C using the shaker technique (Barker, 1978) followed by a 24 hour extraction of the shaker contents on a Baermann pie pan. The volume of the nematode suspension was adjusted to 40 ml in 1982 or 50 ml in 1983 and 1984 as previously described. During 1982 and 1983 plant parasitic nematodes were identified to genus. Since almost all plant parasitic nematodes recovered during 1982 and 1983 belonged to the genus Pr-atylenchus, 40 specimens of that genus were identified to species from all fields surveyed during 1984.

Maine Agricultural Experiment Station Technical Bulletin 116 57
Because of the risk of spreading golden nematode from field to field during scouting, strict sanitary procedures were followed. Scouts carried brushes and containers of water to clean nematode sampling equipment and shoes upon leaving fields. Disposable plastic boots were worn over shoes when fields were wet. The pest management vehicle was kept off farm roads when possible and was cleaned frequently. Excess soil was rinsed from root samples and all soil and root samples were placed in containers before leaving the field.
Environmental monitoring. During 1982, hygrothermographs and rain gauges were placed near two of the fields in the program to obtain data for calculation of late blight infection periods. A Blitecaster® (environmental monitoring station and microprocessor) was placed near one additional field on the South Fork and another was set up at the LIHRL (North Fork). However, the occurrence of late blight in a number of Long Island potato fields necessitated the maintenance of a five to seven day sprav schedule throughout most of the 1982 growing season. Environmental monitoring was not continued during 1983 and 1984.
Grower practices. During 1982, growers were asked to record the date and type of each pesticide application on forms kept in a location convenient for the growers. Information on tillage and irrigation practices was also requested. Scouts collected those forms as they were completed and provided new ones. During 1983 and 19S4 only data on pesticide usage was requested.
Information delivery: Standard forms (Appendix A) were completed by the scouts after each sampling visit. These forms were in triplicate; with one copy for the grower, one for the county agent, and one for our files.
Density estimates of CPB were classed as low, medium, or high. Control recommendations were based on these population estimates. CPB action thresholds were based on densities of adults, small and large larvae (Table 25). Thresholds were set up separately for different CPB life stages. These levels were based mainly on data from the 1981 and 1982 Long Island Potato IPM program. The relationship between defoliation levels and CPB num-
Table 25. Colorado potato beetle action thresholds for fresh market potato production, Long Island.
Colorado Potato Beetle #CPB/50 Vines
Life Stage
Beetle
High" Medium Low
Adult Small larvaeh
Large larvaec
>25 >200 >75
16-24 76-199 31-74
<15 <75 <30
'Insecticide applications were recommended when CPB were in "high" category
Tirst and second instars.
Th i rd

58 Maine Agricultural Experiment Station Technical Bulletin 116
bers was analyzed for CPB adults and larvae. Thresholds were chosen so that CPB populations would be controlled by insecticides before defoliation of 20 percent or greater occurred. Although sensitivity of potatoes to defoliation has been shown to vary with varieties and plant growth stage (Beresford, 1967; Takatori et al., 1952), in most cases defoliation below 20 percent causes minimal yield loss except during full bloom (Cranshaw and Radcliffe, 1980; Hare, 1980; Wellik et al., 1981; Shields and Wyman, 1984). As an initial estimate, the effect of plant growth stage was ignored, and nominal threshold levels (Poston et al., 1983) were deliberately set to be conservative due to the variable CPB control achieved with current insecticides on Long Island.
The grower reports also contained information on defoliation levels, aphid densities and suggested action thresholds, and observations on other insects, diseases or weed problems. Aphid action thresholds were adopted from the upstate New York potato IPM program. Insecticide sprays were recommended when the number of aphids per compound leaf exceeded two prior to tuberization; four from tuber initiation to two weeks before vine kill; or 10, within two weeks of vine kill.
Scouts consulted with growers, when possible, concerning interpretation of reports and observations made in the field. Scouts made no specific recommendations concerning pesticide selection; growers were referred to "Cornell Recommendations for Commercial Potato Production' or their county agent. Summarized area-wide CPB population data, other pest occurrences, and timely management suggestions were included in the Suffolk County Cooperative Extension "Weekly Report on Insects, Diseases, and Crop Development" that is distributed to commercial growers and the agribusiness community.
Results
Evaluation of crop rotation. Colorado Potato Beetle — Early season (mid to late May) CPB counts in
paired rotated and nonrotated fields showed that rotation resulted in a 96 percent reduction of adult densities in three out of four comparisons during 1982 and a 70 percent reduction in two of three comparisons during 1983 (Wright, 1984). Similar results were obtained in 1984.
The reduced adult populations resulted in reduced defoliation early in the season and in lower first generation larval populations in rotated fields in June. An average of one (range 0-2) less insecticide application was applied on the rotated fields to control overwintered adults and first generation larvae. However, despite increased insecticide usage in May and June, in several cases defoliation levels and CPB densities were higher on the nonrotated fields. By the end of June there were no observable differences in defoliation levels or CPB densities on the rotated and nonrotated fields (Wright, 1984). Data from a typical field are shown in Pigure 3.

Maine Agricultural Experiment Station Technical Bulletin 116 59
Figure 3. Comparison of Colorado potato beetle (CPB) population dynamics, insecticide usage, and defoliation levels on rotated and nonrotated fields R = field rotated on year out of potatoes, solid triangle indicates insecticide application for CPB control. Data from Wright, 1984.
Lesion Nematodes — Lesion nematode populations were found to be affected bv both field location and rotational history. Fields on the South Fork of Long Island generally had higher populations of Pratylenchus spp. than those on the North Fork. In addition, populations of lesion nematodes in fields which had been planted to rye during the previous growing season were usually higher than those which had been planted to potatoes. Data for fields monitored during 1982-1984 are summarized in Table 2o. Identification of Pratylenchus spp. from fields monitored during 1984 revealed that both P. penetrans and P. crenatus were present in commercial potato fields (Florini, et al., 1985), though only P. penetrans has been previously reported from Long Island (Schultz and Cetas, 1977). P. crenatus had been reported to occur in commercial potato fields in Ohio (Brown et al., 1980) and may be less pathogenic to potato than P. penetrans (Riedel et al., 1985). CPB sampling requirements
Analyses of data on CPB incidence from routine monitoring of fields in 1982 and 1983 have provided information on the spatial dispersion of CPB life
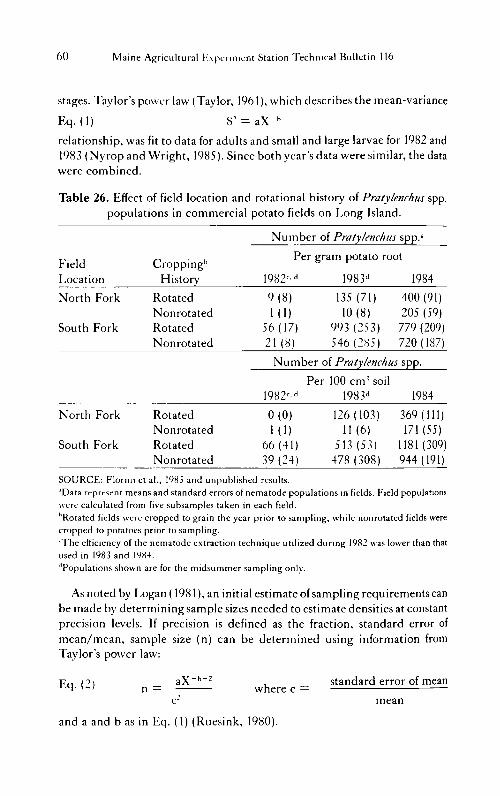
60 Maine Agricultural Experiment Station Technical Bulletin 116
stages. Taylor's power law (Taylor, 1961), which describes the mean-variance
Eq. (1) S- = aX-h
relationship, was fit to data for adults and small and large larvae for 1982 and 1983 (Nyrop and Wright, 1985). Since both year's data were similar, the data were combined.
Table 26. Effect of field location and rotational history of Pratylenchus spp. populations in commercial potato fields on Long Island.
Croppingh
History
Number of Pratylenchus spp.a
Field Location
Croppingh
History
Per gram potato root
1982-d 1983d 1984
North Fork
South Fork
Rotated Nonrotated Rotated Nonrotated
9(8)
KD 56(17) 21(8)
135 (71) 10(8)
993 (253) 546(285)
400(91) 205 (59)
779 (209) 720(187)
Numl 3er of Pratylenchus spp.
1982-d Per 100 cm' soil
1983d 1984
North Fork
South Fork
Rotated Nonrotated Rotated Nonrotated
0(0)
Ml) 66(41) 39(24)
126(103) 11(6)
513(53) 478 (308)
369(111) 171(55)
1181(309) 944(191)
SOURCE: Florin, et a!., 1985 and unpublished results. JData represent means and standard errors of nematode populations in fields. Field populations were calculated from five subsamples taken in each field. hRotated fields were cropped to grain the year prior to sampling, while nonrotated fields were cropped to potatoes prior to sampling. rThe efficiency of the nematode extraction technique utilized during 1982 was lower than that used in 1983 and I9S4. ''Populations shown are for the midsummer sampling only.
As noted by Logan (1981), an initial estimate of sampling requirements can be made by determining sample sizes needed to estimate densities at constant precision levels. If precision is defined as the fraction, standard error of mean/mean, sample size (n) can be determined using information from Taylor's power law:
Fn CM aX"b"2 , standard error of mean 4' *-' n = where c =
c : mean and a and b as in Eq. (1) (Ruesink, 1980).

Maine Agricultural Kxpir iment Station Technical Bulletin lid 61
The relationship between CPB density, sample size, and precision level is shown in Figure 4 for adults, small larvae and large larvae based on combined data from 1982-1983 CPB monitoring. Based on this information and consideration of sampling costs a constant sample size of 50 vines per field was chosen for CPB sampling. As can be seen in Figure 3 any constant sample size sampling plan results in a compromise being made between sample reliability and sample cost.
However, in pest management programs, the goal of sampling is to provide information so that a decision can be made as to whether or not a control measure is needed. In this situation, fixed sample-size sampling plans are often inefficient. An alternative to fixed sampling size plans is sequential sampling. Nyrop and Wright (1985) describe a sequential sampling plan for CPB developed using data from the 1982-1983 Long Island potato IPM programs. This plan was field tested in 1984 and resulted in a decision being reached (spray or no spray needed) after taking a 25 vine sample in 65.3 percent of fields sampled (n = 36S).
Insect Action Thresholds — CPB action thresholds (Table 25) were used in making insecticide recommendations to growers based on data from field scouting. Growers generally considered the action thresholds useful, though they did not always follow the recommendations that were made. In 1984 an analysis of grower insecticide use was made to estimate the economic benefit of the use of action thresholds. Adherence to CBP control recommendations was determined by comparing growers' records of insecticide use to our recommendations. A grower who sprayed within 72 hours after a recommendation was made to spray or one who did not spray when no spray was recommended was considered to have followed recommendations. We found that as a percent adherence to CPB control recommendations increased, the number of insecticide spravs applied decreased for both early and late maturing varieties. Growers who sprayed less had no more defoliation than growers who sprayed more often. The economic benefits of CPB action threshold use was computed as follows. Growers were divided into two groups; those who followed recommendations (>60 percent adherence) and those who did not follow recommendations (<60 percent adherence). Average insecticide use for these two groups was computed. Average costs per application for CPB control (materials only) were assumed to be 550 per hectare (actual costs for CPB control may range from 535-5100 per hectare depending on the materials used). For early maturing varieties, growers following recommendations sprayed 2.6 fewer times for CPB control and for late maturing cultivars growers following recommendations sprayed 1.4 fewer times for CPB control. Thus, average savings in insecticide costs were 5130 per hectare for early maturing varieties and 570 per hectare for late maturing varieties for those growers who followed recommendations.

Maine Agricultural Experiment Station Technical Bulletin 116
Figure 4. Relationship of sample size (n), precision level (S.E./mean), and mean density for Colorado potato beetle (CPB) adults, small (first and second instar) and large (third and fourth instar) larvae. Based on Taylor's power law (equation [1] in text) fit to data on CPB incidence in commercial potato fields on Long Island in 1982 and 1983 and computed using equation (2) in text.

Maine Agricultural Experiment Station Technical Bulletin 1 Id 63
Aphids were the only other potato insect pests observed in the fields. The potato aphid (Macros ip/ii/m euphorbiae) was the predominant species, especially in 19S2; green peach aphids (Myzuspersicae) were also observed in 1983 and 1984. In 1982, populations were below the action thresholds in all fields, but one grower applied an aphicide to two fields. In 1983, populations were above thresholds in 10 fields and aphicides were applied to 14 fields. During 1984, aphid populations exceeded thresholds 16 times but aphicides were applied 38 times, due perhaps to the number of new growers in the program. In 1984, growers who followed recommendations based on aphid action thresholds applied 0.9 sprays per field (range 0-1) for aphid control and growers not following recommendations applied 1.3 sprays per field (range 1-3). The most commonly used aphid insecticide costs S30 per hectare (material costs) per application. Thus, average savings were J12 per hectare for those growers who followed recommendations. In all cases, acceptable aphid control was achieved by growers who followed recommendations.
Foliardiseases. Foliar diseases were generally absent from monitored fields, though late blight was a problem in other commercial fields during 1982. The extremely low levels of early blight in monitored fields is notable, since this disease is a severe problem in other potato production areas of the Northeast. An average of 7.5 fungicide applications (range 6.5-9.0) was made to fields during 1982-1984, usually applied as a tank mix with insecticides. Growers adjusted the frequencv of fungicides based on weather conditions and, in many cases, the need for insecticides.
Evaluation of the program. Participating growers have been positive about the program and indicate an interest in continued involvement. Growers are most interested in obtaining assistance in managing the CPB, but appreciate information on other pests which could potentially reduce yields. Unfortunately, the chemical control options available for the most important pest, the CPB, are not consistently effective. This situation makes it more difficult for growers to accept the recommendations provided by the IPM program. If effective pesticides become available, this problem will be reduced.
The use of student workers for field monitoring severely limits the range of activities of the program. Students are not available until early June, about four to eight weeks after planting and leave in late August, long before many fields are vine killed or harvested. Though the employment of students with training and interest in agriculture is an advantage to the program and the students, this limitation is a serious one. The addition of a full-time IPM coordinator (B.S./M.S. level) could improve this situation.
Evaluation of seed quality before planting is an area where the IPM program could make a substantial contribution to potato production practices on Long Island. Unfortunately, the field scouts have not been available to carry out this operation and it is doubtful that most growers could evaluate their own seed, even with substantial training.

64 Maine Agricultural Experiment Station Technical Bulletin 116
Upstate New York Pilot IPM Program
The IPM Program
A pilot integrated pest management program was initiated in June of 1980 with nine commercial growers in Steuben County, New York. The impetus for this effort came from several crop protection research scientists who had new know ledge and information which they wished to evaluate at the farm level in a manner such that all plant and pest interactions could be studied, Thev were also seeking baseline information on grower practices to measure the impact of the changes they would propose to growers for managing pests. The project was developed and directed by a committee of scientists from the disciplines of plant pathology, entomology, vegetable crops, and agricultural economics. Dav-to-day management of the program was provided by the IPM support group.
Procedures
Field scouting. In the initial year of the program, a pest sampling plan was developed and evaluated on SI hectares. All insect and disease pests were sampled while traversing a diamond-shaped path, the legs of which bisected each quadrant of the field. An effort was made not to sample closer than IS meters to field borders. Weed sampling was conducted within a 2X1 meter rectangle at three to five sites within a field. In each of the succeeding years, the monitoring methods were evaluated and adjusted to meet the need for a practical system of pest evaluation. The present method for field scouting consists of checking 10 sites along a V-shaped pattern avoiding crop borders.
Each year portions of fields were selected to test and refine pest thresholds which had been established by researchers in the various disciplines. These test plots were designed as a proving ground for pest management technology and as a demonstration to growers of the benefits of proper selection and timing of control measures.
Strict sanitation procedures were observed by all field personnel to prevent the spread of the golden nematode. Vehicles were not allowed in fields or near the fields of a farm under quarantine. Scouts washed or brushed their equipment and their boots or shoes after scouting each field. In addition, all vehicles were thoroughly washed each week.
Environmental monitoring. Environmental monitoring was conducted utilizing hvgrothermographs and rain gauges in weather stations. Weather information was initially used only for fields adjacent to the station. However, after four years of evaluating weather parameters, a decision was made to use the stations for selected area-wide pest prediction. The forecast systems (Blitecast) developed at the Pennsylvania State University for potato late blight and for green peach aphid were evaluated during the first two years of

Maine Agricultural Experiment Station Technical Bulletin 116 65
the program. Similarly, information from Maine and New Hampshire was also examined for application to upstate New York conditions.
Information collection and delivery. Information was collected by a field scout beginning in late May or early June. A triplicate report form was filled out by the scout after each field was visited (Appendix B). The first copy was given to the grower and the remaining two copies, which often had more detailed information, were given to the county agent and to the IPM data manager for data entry and analysis. All data were transferred to computer files and maintained on-line for use by all project cooperators. In the initial year, very few recommendations were made to growers except on test plots. While data and pest numbers were provided, they often were of little value unless the grower could interpret their meaning. In the second and succeeding years, educational efforts were made to translate the pest numbers into management decisions for the growers. General information on the occurrence of insects and disease forecasts was provided by the county agent to all growers by a telephone message system operating out of the county extension office and through the agent's newsletters.
Grower practices. Growers were asked to keep a written record of each pesticide application, including the use of vine killers. Scouts collected information on practices such as cultivation, hilling, rotation, etc. This information w as entered into the potato data base for analysis.
Results
Pest pressure varied from season to season with at least two years of extensive late blight pressure occurring. Except for the first year when many growers were still using soil treatments other than Temik, most insect populations remained below thresholds. Weed presence or absence was primarilv determined bv grower cultural practices and herbicide use. Overall weed pressure did not fluctuate from one year to the next.
Pest monitoring methods were evaluated and modified after each growing season to make them more practical for eventual grower adoption. The concept of test plots was continued to provide detailed data for continuing research.
Disease studies. Blitecast was evaluated the first year by having growers follow the recommendations of Blitecast on a portion of their fields and use their normal fungicide application frequency on the other portion. Fields under the Blitecast system received one to three fewer fungicide sprays compared to normal grower practices. During the 1982 season, blight conditions were predicted two weeks earlier than normal and growers were encouraged to initiate late blight sprays. Scouting efforts reported the first sightings of late blight and news of this occurrence was transmitted to all growers. While blight occurred in most fields in 1982, very few fields recorded yield losses. Much of this loss prevention was the result of early detection of

66 Maine Agricultural Experiment Station Technical Bulletin 116
the disease by scouts, and subsequent use of metalaxyl to eradicate infections. Several growers offered testimony of the economic benefits obtained as the result of the early warning provided by the scouts. In succeeding years, modifications suggested by the work of Fry et al. (1983), were incorporated into the recommendations made to growers. The modifications included factors for varietal susceptibility and fungicide residues and provided growers with more specific information on the timing of fungicide applications. In 1984, the parameters of the forecast system were programmed into a handheld computer (Radio Shack TRS-80, Model 100) so that the scout could evaluate environmental parameters on-site, and subsequently inform growers in a more timely fashion.
Insect studies. Most of the effort in insect management centered around the development and refinement of insect sampling methods and action thresholds. Each year insect population data were analyzed and changes were made in the number of stops a scout would make in a field, the way the scout examined plant parts, and the estimated action thresholds. The species composition of certain insect populations was often clarified, as was the case with cutworms, where traditional information suggested the presence of the varigated cutworm, Peridroma sauna (Hubner) and field collections showed the majority to be the spotted cutworm Amathes c-nigrum (Linnaeus). Furthermore, it was noted that growers were making applications of insecticides at a time in the life cycle of the cutworms when control was almost impossible since the insect was in the pupal stage. In 1980 the comparison of test plot data versus normal grower practices showed 1-2 fewer foliar sprays applied in the test plots. In addition, the program was able to document the outbreak of aphid problems when insecticides were applied as routine measures. During 1982, growers applying insecticides based upon scout reports applied two fewer sprays than growers using other decision-making criteria.
Weed studies. Different evaluation methods were used to determine weed presence in growers' fields. It was finally determined that intensive weed scouting would be conducted three times during the season. The first check was made about 10 to 15 days after planting and prior to crop emergence. The second evaluation was made at mid-season (five to seven weeks after planting), and the last prior to vine kill. Densities were rated in each of four, one square meter areas at the 10 sites used for other pest evaluations. Weed identification prior to crop emergence was limited to weed types, such as annual broadleaves. Species were identified during the subsequent checks. Growers were also asked to estimate the time lost in harvesting due to the weed growth present in their fields.
Comparison oflPM versus non-IPMgrowers. Comparisons of IPM grower practices versus those of non-IPM growers were not made through this effort. However, two closely related studies, using data from some of the IPM growers, were conducted by the Department of Agricultural Economics at

Maine Agricultural Experiment Station Technical Bulletin 116 6 7
Cornell. The first report (Fohner and White, 1982), focused on comparisons of practices just as the program was initiated. The second report (Meltzer, 1984) focused primarily on documenting the cost and benefits of the disease-forecasting aspects of the program. Both reports have greatly aided in providing direction to the program.
Analysis of IPM growers pesticide use. Pesticide use patterns were determined by emphasizing to growers the need to maintain spray records in order to relate past occurrences to choice and timing of pesticides. Records were computerized and evaluated each year. Information in Tables 27 and 28 show the ways in which these data were tabulated. This information aided growers in their determination of production costs, provided a baseline of comparison for future pesticide use, and aided researchers in determining optimal control strategies. The data show that, on the average, there was little overall fluctuation in pesticide use over the five vear period. However,
Table 27. Pesticide usage by potato IPM growers, 1982, (Steuben Countv).
Pesticide Growers U sing ",. Fields N u m b e r of Category Chemical Pesticid eJ
SF iravedb Appl . /Hec ta re
% # Insecticides aldicarbc 100 (7) SH 1.0
disulfotonc 6 (1) 12 1.0 phosmet 6 (1) 6 1.0 fenvalerate 18 (3) 35 1.0 parathion 18 (3) 29
methamidophos 8 (3) 29 1.2
Fungicides mancozeb
(Manzate 200)
12 (2) 29 7.7
maneb (manex 4F) 12 (2) 35 8.3
maneb ( M a n e b SOW; 12 (2) 29 5.3
maneb
(Dithane FZ) 12 (2) 29 8.9
metiram r> (1) 18 5.0
metalaxvl 29 (5) 41 ] . ( ,
Herbicides l inuron 24 (4) 53 1.0
metr ibuzin 18 (3) 47 1.0
dalapon fi (1) I) 1.0
paraquat1 ' 6 (1) 12 1.0
Seven growers, hl7 fields. 'In-furrow treatment applied at planting. ''Spot treatment.

68 Maine Agricultural Experiment Station Technical Bulletin 116
Table 28. Pest control information for potato IPM growers, Steuben County (1980% 1981% 1982% 1983% 1984-).
Pesticide Avg. Pesticide Range of Avg Number Avg. Total Category Year Cost/Haf Cost/Ha Appl./Field D.E./Field*
Fungicide 1980 S 55 S 28- 95 7.9 7.1 1981 80 48-105 8.4 8.4 1982 128 65-205 9.3 10.2 1983 100 40-305 7.4 8.4 1984 114 32-148 10.4 9.7
Herbicide 1980 35 20- 53 1.3 1.0 1981 58 28- 80 1.4 1.4 1982 33 10- 60 1.1 0.9 1983 48 13-125 1.5 1.3 1984 48 25- 74 1.7 1.4
Insecticideh 1980 55 28- 95 2.1 1.5 1981 113 20-153 2.5 2.4 1982 145 108-165 3.1 2.7 1983 135 130-208 1.7 1.7 1984 94 89-153 1.3 1.3
Average Total 1980 135 88-295 10.1 9.1 1981 250 88-363 11.5 12.3 1982 305 175-410 11.5 13.7 1983 283 188-485 10.6 11.4 1984 256 193-390 12.1 12.4
'1980 = 79 hectares; 9 growers and 10 fields. h1981 = 186 hectares; 10 growers and 21 fields. 11982 =211 hectares; 7 growers and 17 fields. ''1983 = 241 hectares; 9 growers and 33 fields. '1984 = 200 hectares; 9 growers and 38 fields. 'Average pesticide cost per hectare is weighted by each grower's production area. KD.E. — Dose Equivalents = Actual Rate Used -=- Cornell Recommended Rate. hIn-furrow and topical insecticides included. Average cost of in-furrow insecticide: 1980 = S37;
1981 = ?89; 1982 = J121; 1983 = S128; 1984 = ?90.
many serious crop loss situations were averted. Fungicide use was mostly determined by the type of environmental conditions that occurred each year. Increasing costs are a reflection of the gradual shift to the use of more expensive materials such as aldicarb and metalaxyl.
Individual pest system studies did show a significant decrease in pesticide use when scouting information was combined with recommendations. However, growers have only been willing to follow in small plots the guidelines that have been developed. Large scale adoption will only come about through

Maine Agricultural Experiment Station Technical Bulletin 116 69
large scale demonstration. This will require the services of an experienced individual working with growers on a daily basis. Unless recommendations can be combined with field reports, the potential impact of the IPM effort may never be known.
Evaluation of the program. Evaluation of the program accomplishments through data analysis and other methods was the joint responsibility of the individual research scientists, the county extension agent, and the IPM support group. Information was evaluated each year and reports, publications, and fact sheets were prepared for journals, bulletins, and for grower audiences. Throughout the course of this study we have made many observations and received comments from growers and cooperating scientists. As a result, several trends can be stated. There has been an overall decrease in the frequency of pest loss due to timeliness of information and a better selection of control measures. There is an increasing interest and acceptance on the part of potato growers of concepts such as scouting, action thresholds, forecast svstems, and recordkeeping. There is an increasing interest on the part of research scientists to examine their individual pest management strategies in a unified setting.
Northern Maine Pilot IPM Program
The IPM Program
In 19S2, the University of Maine Cooperative Extension Service in cooperation with researchers from the USDA/ARS, University of Maine at Orono, and Cornell University, expanded the existing potato integrated pest management program (IPM) to include a pilot project involving four farms. A comprehensive scouting program was initiated with each of the cooperating growers. At each location, a field was selected and divided, based on complete sprayer tank loads, so that growers could follow their"normal spray practices' on part of the field and on the other part the recommendations of the IPM program. The sampling methods and economic thresholds used by the scouts to make recommendations are listed in Appendix C. Plots ranged from 2.4 to 16.2 hectares. Three IPM scouts spent three hours per farm per week performing their activities which included: scouting for insects and disease, recordkeeping, running of Blitecast, and communicating with the farmers (see Appendix C for copies of some of the scouting forms). Growers were also provided with a spray calendar on a clipboard and asked to keep records of the practices followed on the IPM test and control plots.
In 1983, seed from all four cooperators was examined to determine the presence or absence of various seedborne diseases. One grower planted 5.7 hectares of untreated seed as a comparison with the treated control.

70 Maine Agricultural Experiment Station Technical Bulletin 116
Weeds were not a problem with any of the sites selected; thus, no attempt to alter herbicide or cultivation practices was made.
Procedures
Environmental monitoring. During 1982 and 1983, hygrothermographs and rain gauges were placed on the four pilot project farms. An additional 30 instruments, including two Blitecasters (environmental monitoring station and microprocessors), were placed at selected sites as part of the larger program.
Information delivery. Standard forms (Appendix C) were completed by the scouts after each sampling visit. These forms were duplicated: one copy was left with the grower; the other one was retained for the files. Information on the four major insect pests (aphids, Colorado potato beetles, flea beetles, European corn borers), and two major foliar diseases (late and early blight), were recorded. The insect thresholds used in this project were those recommended in the guidelines developed for this project by cooperating researchers (see Appendix C). The two diseases were listed as present or absent and an estimate of the percent infection was included. When possible, scouts consulted with growers concerning the interpretation of their reports and observations. Growers were referred to the appropriate Extension bulletin or the area potato specialists for specific information on pesticide use. Other production questions and problems were noted on the form and referred to the appropriate potato specialist.
Scouting information was summarized for over 90 monitoring sites and a weekly newsletter, "Potato Pest Alert,' was mailed to over 850 commercial growers and related industry personnel. Daily scouting information was also available from a code-a-phone and the local NOAA weather radio station included the latest insect and disease findings on their dailv agricultural weather forecast.
Results
Seed quality. Despite a great deal of effort to inform growers that there are worse problems than viruses, many growers still believe that the words "certified" and "foundation" insure quality. Very few growers examine their seed in the manner described in the pilot project guidelines. Acceptance of proper seed treatments has, however, made significant progress during the past three years.
B/itecast. In both 1982 and 1983, growers sprayed for potato late blight on a weekly basis without regard to Blitecast. Some growers did increase the amount of spray material used or they shortened the spray interval (if possible based on weather) when several weeks of short spray interval recommendations occurred. This has been the general grower practice during the

Maine Agricultural Experiment Station Technical Bulletin 116 71
past six years. Until blight forecasts can be based on accurately predicted weather, the value of such "forecasting'' programs is limited.
The proposed Blitecast modifications based on varietal resistance and fungicide weatherability do not accurately simulate the major problems in northern Maine. The model does not take into account the varying growth rate of potatoes. More frequent applications of protective fungicide are needed when potatoes are growing rapidly because the plants quickly outgrow the spray coverage. In northern Maine, there is high density potato production, many cull piles, infected seed lots, and ideal weather for late blight most of the growing season. The weather conditions which favor rapid potato plant growth also tend to be favorable for late blight development but mav delav needed sprays.
The ideal forecasting system should be able to utilize a three to five day weather forecast to be truly predictive in nature. It must also recommend shorter spray intervals for protective fungicides when the plants are growing rapidlv. The results must be available to growers on a more frequent and timelv basis. The present system uses week old data and requires input to a computer terminal before the forecast is available to the farmer.
Insects. There are several obstacles to achieving better grower acceptance of the pilot IPM insect guidelines. Growers in northern Maine become very upset at the sight of Colorado potato beetles. They tend to want to control them at levels well below the thresholds listed. Growers feel that these guidelines will lead to higher beetle populations the following year, thus, increased problems and costs. From a practical point, the guidelines need additional information on how to time insecticide application in relationship to beetle development (eggs-larva-adults) (see Appendix C). Spot spraying of over-wintering adults before egg laying is not a common practice. Many growers spray too soon, i.e., before most eggs have hatched; thus, control is not achieved without several sprays. Alternative controls for the minor second generation in northern Maine are needed. For example, dinitro vinekillers and certain aphicides also kill beetles. The beneficial role of rotation should be stressed.
Aphid numbers never exceeded the established thresholds for tablestock growers. A spray recommendation for nonseed growers is usually issued when wing pads develop. Ten percent plant infestation or five percent wing pad formation is the arbitrarily selected threshold for seed growers. Growers usually still achieved satisfactory Florida test results (Table 2V). Thus, they were applying aphicides only when aphid colonies were developing in the field. For many this occurs when the systemic pesticide applied at planting begins to break down which is preferable to blanket applications (sterile fields). In northern Maine, at least, some guidelines for the actual seed-tablestock growers need to be developed.

72 [VI;iinu Agricultural Experiment Station Technical Bulletin
Table 29. Potato IPM pilot project, Florida virus test results, 1982-1983, northern Maine.
Grower and Year Variety
Total Plant Count Virus
Plot Sample Size1 #MOS : #I,R %
Grower #1-1982
Grower #2-1982
Grower #3-1982
Grower #1-1983
Grower #2-1983
Grower #3-1983
Grower #4-1983-"
Ontario Check 94 IPM 99
Katahdin Check 97 IPM 200
Atlantic Check 91 IPM 95
Ontario Check 68 IPM 200
Katahdin Check 107 IPM 100
BelRus Check 140 IPM 208
Chieftain IPM 219
0 (1 0.0' i 0 2.0 1 2 3.0 0 0 0.0 1 0 1.0 0 0 0.0 4 0 5.8 (1 1 0.5 0 1) 0.0 0 0 0.0 0 0 0.0 0 2 0.9 1 5 2.7
Samples were collected randomly from the entire plot, one tuber per hill was taken. While 400 tuber unit samples were sent to Florida for some reason the stand counts were small. "#MOS = mosaic virus readings.
#I.R = leafroll virus readings. 'Grower #4 harvested his plots early in 1982 and no sample was obtained; the same problem occurred with the control plot in 1983.
In 1982, there were no differences in the total amount of pesticide applied for either Grower #1 or Grower #2. Grower #3 applied 0.7 liters more methamidophos to the control plot than to the IPM plot. He did not like to see Colorado potato beetles. When aphicides were recommended early in the season, endosulfan was recommended because it provided control of both the aphid species present and the occasional marauding beetle. In 1982, as a result of the scouting program, he decided to hire a private scout to monitor all his 1983 crop (600 hectares). In 1982, Grower #4, also a seed-tablestock grower, used the scouting reports to monitor the effectiveness of his insectici-dal spray program. He stated that the recommendations caused him to alter the timing of application and the material used based on its effectiveness against the aphid species present. This has been the normal grower response to the potato IPM program for over six years.
In 1983, Grower #1 applied one additional methamidophos application to the IPM plot. Because of topography, the IPM plot was a more ideal location

Maine Agricultural Experiment Station Technical Bulletin 1 Id 73
for aphid colonies to build up. Grower #4 also applied additional demeton and methamidophos applications on his IPM plot because of topography. Grower #3 applied one extra azinphosmethvl and one extra permethrin application to the control side of the field.
Evaluation of the program. There have not been radical changes or savings on the part of growers. The growers involved had been cooperators in Extension potato programs for a number of years prior to this pilot project. Some of the practices followed on the control plots were influenced by Extension scouting, since this was already a normal practice for them. Until greater economic stability returns to farming and potato growers become diversified farmers, the chances of widespread grower acceptance and implementation of a potato IPM program are slight.
F U T U R E D I R E C T I O N S
Substantial progress was made in developing integrated practices for managing major foliar and soilborne disease, insect, and weed pests for the potato industry of the northeastern United States. Many of these practices were in turn implemented in the pilot IPM programs in the three major potato producing areas of the northeastern region. Out of this research, however, came an improved understanding and appreciation of the complexities inherent in conducting interdisciplinary research and in developing integrated approaches to crop pest management. These insights will provide direction for future research and extension IPM programs for potatoes and other crops.
In subsequent work on foliar diseases, optimal fungicide use for both of the important foliar diseases of potatoes (early blight and late blight) needs to be identified. A forecast system incorporating host resistance and systemic fungicide (metalaxyl) needs to be developed. Strategies for using metalaxyl to suppress fungicide resistance in the Phytophthora infestans population need to be developed. The stability of field resistance in potato cultivars should be rigorously assessed. For soilborne diseases, future research should be aimed at biological control and substantial emphasis should be placed on developing cultivars with disease resistance.
Implementation of a weed management component of an IPM program is greatly needed. Some initial work has been conducted with on-farm demonstration plots on the use of postemergence herbicides and scouting programs on Long Island. Observations in commercial fields at harvest time indicate that there is need for improvement of weed management practices. Before widespread utilization of an IPM approach to weed control is possible,

74 Maine Agricultural Experiment Station Technical Bulletin 116
several key points need clarification. No complete weed programs are in use. A "weed potential" theory is proposed that utilizes previous weed history in a field, the cultivar to be planted, and the number of days between planting and probable harvest, to determine the "potential" for weed problems. The level of controls recommended is modified according to the severity of the "potential." This theory needs thorough field testing and evaluation. A major component of any weed IPM program is the degree to which a particular cultivar can suppress weeds. In the present research, 15 varieties were studied in detail for three years. Several, such as Hudson, Kennebec, Monona, etc., were consistent from season to season in terms of relative size and density. However, the others varied considerably. Until this variation is understood, the dimension of weed suppression by the crop cannot be adequately utilized.
Models to describe and predict the population dynamics of major insect pests, such as potato-infesting aphids and the Colorado potato beetle, are needed for the most important commercially grown potato cultivars. Although action thresholds for CPB were developed and implemented during the prepilot program, these are only initial estimates or nominal thresholds (Poston et al., 1983). They are not based on replicated field studies on the impact of CPB on potato yields. Further work is necessary to develop dynamic thresholds which take into account the fact that different levels of defoliation can be tolerated at different potato growth stages.
Control strategies and action thresholds for both P. penetrans and P. crenatus are also needed. Research studies should evaluate the effects of cultivar tolerance, edaphic factors, and other soilborne pathogens on such nematode thresholds.
Finally, there is a tremendous need to develop a systems approach to managing the potato crop and its major pests. The systems analysis approach requires a very specific and usually quantitative statement of the problem. Mathematical models of the system are used to develop and evaluate alternatives; identification of the best alternative is accomplished by optimization techniques. The output from such an effort would be a model for potato production which incorporates the major pathogen, weed, insect, and nematode pests. From this algorithm, recommendations for optimal production practices could be made. Interdisciplinary research will be critical because interactions of various pests and control tactics are very prevalent in the crop production system.
There is a growing array of new knowledge relating to the management of pests on potatoes which needs to be examined in an IPM context. Future IPM programs aimed at changing grower practices should consider combining this new knowledge with an intensive educational effort, including interpretations and recommendations, in a demonstration program on a significant number of commercial potato farms and acreage.
Maine Agricultural F.speriment Station Technical Bulletin 116 75
LITERATURE CITED
Anderson, N. A. 1982. The genetics and pathology of Rhizoctonia so/ani; Ann. Rev. Phytopath. 20:329-347.
Andrilenas, P.A. 1974. Farmers' use of pesticides in 1971-quantities; Agric. Econ. Rpt. No. 252, Econ. Res. Serv., USDA, 56 pp.
Apple, J.L., PS. Benepal, R. Berger, G.W. Bird, F. Maxwell, W.G. Ruesink, P. Santleman, and G.B. White. 1979. Integrated pest management: a program of research for the state agricultural experiment stations and the colleges of 1890; Study conducted by the Intersociety Consortium for plant protection for the Experiment Station Committee on Organization and Policy, 190 pp.
Baker, K.F. 1970. Types of Rhizoctonia diseases and their occurrence; In Biology and Pathology of Rhizoctonia so/ani, ed. J.R. Parmeter, Jr., Berkeley and Los Angeles, CA: Univ. of California Press, 125-13?.
Baker, K.F. and R.J. Cook. 1974. Biological control of plant pathogens; San Francisco, CA: W'.H. Freeman and Co., 443 pp.
Barker, K.R. 1978. Determining nematode population responses to control agents; In Methods for evaluating plant fungicides, nematicides, and bactericides, American Phytopathological Society, St. Paul, MN, pp. 114-124.
Beaumont, A. 1947. The dependence on the weather of the dates of outbreak of potato blight epidemics; Trans. Brit. Mycol. Soc. 34:45-53.
Beresford, B. 1967. Effect of simulated hail damage on yield and quality of potatoes; Am. Potato J. 44:347-354.
Berry, R.E. and L.R. Taylor. 1968. High altitude migration of aphids in maritime and continental climates; J. Anim. Ecol. 37:713-722.
Blair, J.D. 1943. Behavior of the fungus Rhizoctonia so/ani YM\\X\ in the soil; Ann. Appl. Biol. 30:118-127.
Boosalis, M.G. 1956. Effect of soil temperature and green manure amendment of unsterilized soil on parasitism of Rhizoctonia so/am, Penicillium vermicu/atum and Trichoderma sp.; Phytopath. 46:475-478.
Brown, M.J., M.M. Riedel, and R.C. Rowe. 1980. Species of Praty/enchus associated with So/anum tuberosum cv Superior in Ohio; J. Nematol. 12:189-192.
Bruhn.J.A. and W.E. Fry. 1981. Analysis of potato late blight epidemiology via simulation modeling; Phytopath. 71:612-616.
. 19S2a. A statistical model of fungicide deposition in a potato canopy; Phytopath. 72:1301-1305.
. 1982b. A mathematical model of the spatial and temporal dynamics of chlorothalonil residues in a potato canopy; Phytopath. 72:1306-1312.
Castanho, B. and E.E. Butler. 1978. Rhizoctonia decline: Studies on hypo-virulence and potential use on biological control; Phytopath. 68:1511-1514.

76 Maine Agricultural Experiment Station Technical Bulletin 116
Caten, C.E. 1974. Intra-racial variation in Phytophthora infestans and adaptation to field resistance for potato blight; Ann. Appl. Biol. 77:259-270.
Cranshaw, W.S. and E.B. Radcliffe. 1980. Effect of defoliation on yield of potatoes; J. Econ. Entomol. 73:131-134.
Crop Reporting Board. 1984. Potatoes and sweet potatoes: final estimate 1978-82, preliminary 1983; Statistical Bulletin 709, Statistical Reporting Service, USDA, 37 pp.
Dana, B.F. 1925. The Rhizoctonia disease of potatoes; Wash. Agric. Expt. Sta. Bull. 191, Washington State University, Pullman, WA, 78 pp.
Davey,C.B. andG.C. Papavizas. 1959. Effect of organic soil amendments on the Rhizoctonia disease of snapbeans; Agronomy J. 51:493-496.
. 1963. Saprophytic activity of Rhizoctonia so/am as affected by the carbon-nitrogen balance of certain organic soil amendments; Soil Sci. Soc. Proc. 27:164-167.
Dixon, A.F.G. 1973. Biology of aphids; London: Edward Arnold Ltd; 58 pp. Elorini, D.A., J.B. Kotcon, and R. Loria. 1985. Population densities and
distribution of Pratylenchuspenetrans and P. crenatus in Long Island, New York potato fields; Phytopath. 75:1305 (Abst.).
Former, G.R., W.E. Fry, and G.B. White .1984. Computer simulation raises question about timing protectant fungicide application frequency according to a potato late blight forecast; Phytopath. 74:1145-1147.
Fohner, G.R. and G.B. White. 1981. Pesticide use on potatoes in upstate New York; A.E. Res. 81-7, Dept. of Agric. Econ., Cornell Univ., Ithaca, NY, 25 pp.
Fohner, G.R., G.B. White, and S. Schwager. 19S2. The value of economic thresholds for managing agricultural pests; A.E. Res. 82-46, Dept. of Agric. Econ., Cornell Univ., Ithaca, NY, 64 pp.
Fohner, G.R. and G.B. White. 1982. Cost of pesticides for potatoes in upstate New York, 1981; A.E. Res. 82-30, Dept. of Agric. Econ., Cornell Univ., Ithaca, NY, 22 pp.
Frank, J. A. 1978. The Rhizoctonia disease of potatoes in Maine; Am. Potato J. 55:58-69.
. 1981. Rhizoctonia canker (black scurf); In Compendium of potato diseases, ed. W.J. Hooker, Am. Phytopath Soc. pp. 52-54.
Frank, J. A. andS.S. Leach. 1980. Comparison of tuber-borne and soil-borne inoculum in the Rhizoctonia disease of potato; Phytopath. 70:51-58.
Frank, J. A. and H.J. Murphy. 1977. The effect of crop rotations on Rhizoctonia disease of potatoes; Am. Potato J. 54:315-322.
Fry, W.E. 1978. Quantification of general resistance of potato cultivars and fungicide effects for integrated control of potato late blight; Phytopath.
68:1650-1655. Fry, W.E., A . F Apple, and J. A. Bruhn. 1983. Evaluation of potato late blight
forecasts modified to incorporate host resistance and fungicide weathering;

Maine Agricultural Experiment Station Technical Bulletin 116
Phytopath. 73:1054-1059. Fry, W.E., H.D. Thurston, K. Cathey, F. Holbrook, T. Lyons, J.B. Sieczka,
D. Smith, R.D. Sweet. 1979. Potential for intensified integrated management of potato pests in Northeastern USA; //; Pest Management Strategies. Vol. II; Office of Technology Assessment, U.S. Congress.
Grainger, J. 1953. Potato blight forecasting and its mechanization; Nature 171:1012-1014.
Hadar, Y.. I. Chet, and Y. Henis. 1979. Biological control of Rhizoctonia solani damping-off with wheat bran cultures of Trichoderma harzianum; Phytopath. 69:64-o8.
Harcourt, D.G. 1963. Population dynamics of Leptinotarsadecemlineata (Say) in eastern Ontario: I. Spatial pattern and transformation of field counts; Can. Entomol. 95:S 13-820.
Hare, J.D. 19S0. Impact of defoliation by the Colorado potato beetle on potato yields; J. Econ. Entomol. 73:369-373.
Hare, J.D., P.A. Logan, and R.J. Wright. 1983. Suppression of Colorado potato beetle, Leptinotarsa decemlineata (Say) (Coleoptera: Chrysomelidae) populations with antifeedant fungicides; Environ. Entomol. 12:1470-1477.
Havlicek, J. and J. A. Seagraves. 1962. The "cost of the wrong decision' as a guide in production research; J. of Farm Econ. 44:157-168.
Headlev, J.C. 1972. Defining the economic threshold; In Pest Control Strategies for the Future, National Academy of Sciences, 100-108.
Hooker, W.J. (ed.) 1981. Compendium of potato diseases; St. Paul, MN: Am. Phvtopathol. Soc, 125 pp.
Hossain, A.K.M.A. 19S0. Effect of spacing and variety of potato on yield and weed suppression; Ph.D. thesis, Cornell Univ., Ithaca, NY.
Humphrevs-Jones, D.R. 1977. Fungicidal treatment of seed potato clone reaction of stem canker {Rhizoctonia so/ani); In British Crop Protection Conf. Proc. 2:485-490.
James, R.Y. and W.E. Fry. 1983. Potential for Phytophthora infestans populations to adapt to potato cultivars with rate-reducing resistance; Phytopath. 73:984-988.
Jeffrey, S.T.B., J.L. Jinks, and M. Grindle. 1962. Intraracial variation in Phytophthora infestans and field resistance to potato blight; Genetica 32:323-338.
Krause, R.A., L.B. Massie, and R.A. Hyre. 1975. BLITECAST: A computerized forecast of potato late blight; Plant Dis. Reptr. 59:95-98.
Lashomb,J.H. and Y.-S. Ng. 1984. Colonization by Colorado potato beetles, Leptinotarsa decemlineata (Say) (Coleoptera: Chrysomelidae), in rotated and nonrotated potato fields; Environ. Entomol. 13:1352-1356.
Latin, R.X., D.R. MacKenzie, and H. Cole, Jr. 1981. The influence of host and pathogen genotypes on the apparent infection rates of potato late blight epidemics; Phytopath. 71:82-85.

78 Maine Agricultural Kxperiment Station Technical Bulletin 116
Lazarus, S.S. and G.B. White. 1983. The economic potential of crop rotations in Long Island potato production; A.E. Res. 83-20, Dept. of Agric. Econ., Cornell Univ., Ithaca, NY, 37 pp.
1984. Economic impact of introducing rotations on Long Island potato farms; Northeastern Journal of Agric. and Resource Econ. 13:221-228.
Leach, S.S. and J. A. Frank. 1982. Influence of three systemic insecticides on Verticillium wilt and Rhizoctonia disease complex of potato; Plant Dis. 66:1180-1182.
Leach, S.S. and C.W. Murdoch. 1983. Evaluation of Laetisaria arvalis as a biological control agent of Rhizoctonia so/anion white potato; Am. Potato J. 60:813-814 (abst.).
Leach, S.S. and C.W. Murdoch. 1985. Evaluation of thiabendazole and pentachloronitrobenzene for control of the Rhizoctonia Disease Complex on white potato {Solarium tuberosum L.); Am. Potato J. 62:459-467.
Leach, S.S. and L.W. Nielsen. 1975. Elimination of fusarial contamination on seed potatoes; Am. Potato J. 52:211-218.
Leach, S.S. and R.E. Webb. 1981. Resistance of selected potato cultivars and clones to Fusarium dry rot; Phytopath. 71:623-629.
Logan, P. A. 1981. Estimating and projecting Colorado potato beetle density and potato yield loss; In Advances in Potato Pest Management, eds. J.H. Lashomb and R. Casagrande, Stroudsburg, PA: Hutchinson Ross Publishing Co., 105-118.
Logan, P. A. and R.A. Casagrande. 1980. Predicting Colorado potato beetle [Leptinotarsa decemlineata Say) density and potato vield loss; Environ. Entomol. 9:659-663.
MacKenzie, D.R. 1981. Association of potato early blight, nitrogen fertilizer rate, and potato yield; Plant Disease 65:575-577.
Meltzer, M. 1984. Costs and benefits of the Steuben County potato IPM program; A.E. Staff Paper No. 84-29, Dept. of Agric. Econ., Cornell Univ., Ithaca, NY, 22 pp.
Metcalf, R.L. 1980. Changing role of insecticides in crop protection; Ann. Rev. Entomol. 25:219-256.
Meyer, G. A. 1983. A comparison of growth characteristics between 15 potato varieties; V.C. Mimeo 288, Dept. of Vegetable Crops, Cornell Univ., Ithaca,. NY.
Morse, W.J. and M. Shapovalov. 1914. The Rhizoctonia disease of potatoes; ME Agric. Sta. Bull., Univ. of Maine, Orono, ME, 230:192-217.
Nielsen, L.W. and J.T. Johnson. 1972. Seed potato contamination with fusarial propagules and their removal by washing; Am. Potato J. 49:391-396.
Nugent, T.J. 1950. Three years experience forecasting late blight in Tidewater, Virginia; In Plant disease forecasting: a symposium, Plant Dis. Rep. Supp. 190:9-13.
Nyrop, J.P. and R.J. Wright. 1985. The use of double sample plans in insect

Maine Agricultural Experiment Station Technical Bulletin 116 79
sampling with reference to the Colorado potato beetle, Leptinotarsa Jecemlineata (Say); Environ. Entomol. 14:644-049.
Odovody, G.N., M.G. Boosalis, and E.D. Kerr. 1980. Biological control of Rhizoctonia so/aniwith a soil-inhabiting basidiomycete; Phytopath. 70:655-058.
Papavizas, G.C. 1970. Colonization and growth of Rhizoctonia solani in soil; In Biology and Pathology of Rhizoctonia solani, ed. J.R. Parmeter, Jr., Berkeley and Los Angeles, CA, Univ. of California Press, 108-122.
Papavizas, G.D. and C.B. Davey. 1960. The Rhizoctonia disease of bean as affected by decomposing green plant materials and associated microfloras; Phytopath. 50:516-522.
Paxman, G.J. 1963. Variation in Phytophthora infestans; Eur. Potato J. 6:14-23. Peters, D. and R.A.C. Jones. 1981. Potato Ieafroli virus; In Compendium of
potato diseases; ed. W.J. Hooker, St. Paul, MN, Amer. Phytopath. Soc, 68-70.
Populer, C. 1978. Changes in host susceptibilitv with time; In Plant disease: An advanced treatise. Vol. II. How Disease Develops in Populations; ed. J.G. Horsfall and E.B. Cowling, NY: Academic Press, 239-262.
Poston, F.L., L.P. Pedigo, and S.M. Welch. 1983. Economic injury levels: reality and practicality; Bull. Entomol. Soc. Am. 19:49-53.
Riedel, R.M.. R.C. Rowe, and M.J. Martin. 1985. Differential interactions of Pratylenchus crenatus, P. penetrans and P. scribneri with 1 'erticillium dahliae in potato early dying disease; Phytopath. 75:419-422.
Ruesink, W.G. 1980. Introduction to sampling theory; In Sampling Methods in Soybean Entomology, eds. M. Kogan and D.C. Herzog, New York: Springer Verlag, 61-78.
Schrodter, H. and J. Ullrich. 1966. Further research on the biometeorology and epidemiology of Phytophthora infestans (Mont.) de By: A new proposal for the solution of the problem of epidemiological prognosis; Phytopathol. Z. 56:265-278.
Schroth, M.N. and J.G. Hancock. 1981. Selected topics in biological control; Ann. Rev. Microbiol. 35:453-476.
Schultz, O.E. and R.C. Cetas. 1977. Evaluation of granular nematicides for control of "early maturity wilt" of potatoes in New York State; In Proc. British Crop Protection Conference-Pests and Diseases 2:491-498.
Seem, R.C. 1981. Personal communication. Shands, W.A. and G.W. Simpson. 1971. Seasonal history of the buckthorn
aphid and suitability of alder-leaved buckthorn as a primary host in northeastern Maine; Me. Agric. Exp. Sta. Tech. Bull. 5 1, Univ. of Maine, Orono, ME, 24 pp.
Shands, W.A., G.W. Simpson, and C.C. Gordon. 1972. Survey of internal parasites of potato-infesting aphids in northeastern Maine. 1963 through 1969; Me. Agric. Exp. Sta. Tech. Bull. 60, Univ. of Maine, Orono, ME, 15
pp.

SO Maine Agricultural Experiment Station Technical Bulletin 116
Shands, W.A., G.W. Simpson, and I.M. Hall. 1963. Importance of ento-mogenous fungi in controlling aphids on potatoes in northeastern Maine; Me. Agric. Kxp. Sta. Bull. T 6, Univ. of Maine, Orono, ME, 42 pp.
Shands, W.A., G.W. Simpson, I.M. Hall, and C.C. Gordon. 1972. Further evaluation of entomogenous fungi as a biological agent of aphid control in northeastern Maine; Me. Agric. Exp. Sta. Tech. Bull. 58, Univ. of Maine, Orono, ME., 33 pp.
Shands, W.A., G.W. Simpson, and H.K. Wave. 1969. Canada plum, Prunus nigra Aiton, as a primary host of the green peach aphid, Mvzus penicae (Sulzer), in northeastern Maine; Me. Agric. Exp. Sta. Tech. Bull. 39, Univ. of Maine, Orono, ME, 32 pp.
Shands, W.A., G.W. Simpson, and H.E. Wave. 1972. Seasonal population trends and productiveness of the potato aphid on swamp rose in northeastern Maine; Me. Agric. Exp. Sta. Tech. Bull. 52, Univ. of Maine, Orono, ME, 35 pp.
Shands, W.A., G.W. Simpson, and C.C. Gordon. 1972. Importance of arthropod predators in controlling aphids on potatoes in northeastern Maine; Me. Agric. Exp. Sta. Tech. Bull. 54, Univ. of Maine, Orono, ME, 49 pp.
Shields, E.J. and J. A. Wvman. 1984. Effect of defoliation at specific growth stages on potato yields; J Econ. Entomol. 77:1194-1199.
Simpson, G.W. 1977. Potato insects and their control; In Potatoes: production, storing, and processing, ed. O.P. Smith, Westport, Conn: AVI Publishing Co., 550-605.
Small. T. 1943. Black scurf and stem canker (Corticium solani Borund ang Galz); Ann. Appl. Biol. 30:221-226.
. 1944. Dry rot of potato Fusarium coerukum (Lib) Soc. Investigations on the sources and time of infection; Ann. Appl. Biol. 31:390-395.
Spadafora, V.J., J. A. Bruhn, and W.E. Fry. 19S4. Influence of selected protectant fungicides and host resistance on simple and complex potato late blight forecasts; Phytopath. 74:519-523.
Specht, L.P 19X3. The effect of crop rotation and tillage practices on populations of soil bacteria, actinomycetes, fungi and Rhizoctonia spp. in relation to disease incidence in potato fields; M.S. thesis, Univ. of Maine, Orono, ME.
Stern, V.M. 1973. Economic thresholds; Annual Review of Entomology, 18:259-280.
Stevenson, W.R. 1983. An integrated program for managing potato late blight; Plant Disease 67:1047-1048.
Storch, R.H. 1981. Insects and diseases in the production of seed potatoes; In Advances in potato pest management; eds. J.H. Lashomb and R. Casagrande, Stroudsburg, PA: Hutchinson Ross Publishing Co., 138-152.
Sweet, R.D. and J.B. Sieczka. 1973. Comments on ability of potato varieties to compete with weeds; Proc. Northeastern Weed Science Society 27:302-304.

Maine Agricultural Experiment Station Technical Bulletin 116 81
Takatori, F.H., W.C. Sparks, and G.W. Woodbury. 1952. A study of simulated hail injury on potatoes; Idaho Agr. Exp. Sta. Bull. 22, Univ. of Idaho, Moscow, ID.
Tavlor, L.R. 1961. Aggregation, variance and the mean; Nature (Lond.) 189:732-735.
Thompson, P. and G.B. White. 1982. An economic evaluation of the potential for tree fruit integrated pest management in the Northeast; A.E. Res. S2-14, Dept. of Agric. Econ., Cornell Univ., Ithaca, NY, 37 pp.
Thurston, H.D. 1971. Relationship of general resistance: Late blight of potato; Phytopath. 61:620-626.
Van der Plank, J.E. 1968. Disease resistance in plants; NY Academic Press, 206 pp.
. 1971. Stability of resistance to Phytophthora infestans in cultivars without R genes; Potato Res. 14:263-270.
Van Emden, J.H. 1958. Control of Rhizoctonia solani Kuhn in potatoes by disinfection of seed tubers and bv chemical treatment of the soil; Eur. Potato J. 1:52-64.
Van Everdingen, E. 1926. Het verband tusschen de weergesteldheid en de aardappelzeikte (Phytophthora infestans); Tijdschr. PI. Ziekt. XXXII. 129.
VanVranken, R.W. 1983. Microclimate studies of four potato (Tuberosum solanum L) cultivars; M.S. thesis, Cornell Univ., Ithaca, NY.
Wallin, J.R. 1962. Summary of recent progress in predicting late blight epidemics in the United States and Canada; Am. Potato J. 39:306-312.
Weinhold, A.R. and T. Bowman. 1982. Rhizoctonia disease of potato: Effect on yield and control by seed tuber treatment; Plant Dis. 66:814-818.
Wellik, W.J., J.E. Slosser, and R.D. Kirbv. 1981. Effects of simulated insect defoliation on potatoes; Am. Potato J. 58:627-632.
White, G.B. and G.R. Fohner. 1981. Economics of integrated systems for managing pests of white potatoes: a summary of baseline survey data, 1981; unpublished progress report, Dept. of Agric. Econ., Cornell Univ., Ithaca, NY, 7 pp.
Wright, R.J. 1984. Evaluation of crop rotation for control of Colorado potato beetles (Coleoptera: Chrysomelidae) in commercial potato fields on Long Island; J. Econ. Entomol. 77: 1254-1259.
Yip, C.P. 1975. Competitive ability of potato cultivars with major weed species; M.S. thesis, Cornell Univ., Ithaca, NY.
Zepp, G.A. 1982. Cost of producing potatoes, 1980 and 1981 with projections for 1982; Agric. Econ. Rpt. 491, Econ. Res. Serv., USDA, 97 pp.


Maine Agricultural Kxperinicnt Station Technical Bulletin 1 Id 83
APPENDIX A. Long Island Pilot IPM Program Grower Report Form, 1982-1984

S4 Maine Agricultural Experiment Station Technical bulletin 116
A P P E N D I X B
UPSTATE NEW YORK
1985 Potato IPM S c o u t i n g Procedures
General Scouting Information
Potato fields should be scouted in a systematic manner that places sample sites throughout most of the field. Sampling patterns will vary depending on the shape of the field, but, frequently a V-, W-, Y-, or diamond-shaped pattern adequately covers a field. Sampling sites should be chosen without bias, except in those cases where specific sites are designated. All potato pests will be scouted for at 5-10 sites per field. Remember, you are attempting to sample representative sections of the whole field.
Although the scouting procedures outlined here are rather rigidly structured, remain alert to possible pest problems that may not be detected by the systematic sampling plan and are noted as you walk from site to site. Keep your eyes on the crop at all times.
Crop Growth Rating System
FOLIAR. 1) None, 2) Green Row, 3) Prior to Filled Rows, 4) Filled Rows, 5) Touching Across Rows, 6) Closed Between Rows, 7) Vines Collapsing
TUBER: 1) None, 2) Initiation of Tuberization, 3) Post Initiation
BLOOM: 1) None, 2) Buds, 3) Open Bloom, 4) Post Bloom
Determine foliar, tuber, and bloom stages from an overall impression while walking to the first sampling site. For tuber ratings it may be necessary to dig around a few plants.
I. INSECTS A. Colorado Potato Beetle
Sampling Sample five vines across rows at each of five sites. Count the number of adults, small larvae (1st and 2nd instars), and large larvae (3rd and 4th instars) on each of the vines. Use the following table to determine if a sufficient number of plants has been sampled.

Maine Agricultural Kxperiment Station Technical Bulletin 116 85
Total #CPB Counted on 25 Vines
STOP Intermediate STOP Life Stage Compute Mean Sample 25 More Compute Mean
Adults < 7 K- 22 > 23 Small Larvae <52 52-249 >250 Large Larvae <22 23 -67 > 68
If any of the counts are in the intermediate range, sample 25 more vines and then compute the means. Do not sample more than 50 vines per field. Also, estimate the percent defoliation at each CPB sample site.
Reporting Report the mean number of small larvae per vine, large larvae per vine, adults per vine, and the mean percent defoliation. Indicate how widespread the CPB infestation is in the field in comments.
If hot spots are found: (cue in on defoliation) 1) Flag the site/mark on map. 2) Check the hot spots each week to monitor the
spread of the infestation and the impact of any insecticide applications.
Thresholds 1) Adults: 0.5/vine. 2) Small larvae: 4.0/vine. 3) Large larvae: 1.5/vine. 4) Defoliation: 10-15 percent during critical period
(Superior can withstand 25 percent defoliation).
B. Climbing Cutworms Time Early to mid-July. Sampling Count the number of cutworms on five vines at each
of 10 sites per field. Estimate the amount of defoliation at each site (rou nded to the nearest five percent). Damage will be more likely in low, wet areas and in wheel rows.
Reporting 1) Average number per vine. 2) Average percent defoliation.
Thresholds 1) Three to five cutworms per vine. 2) 10 to 15 percent defoliation during the critical period of three weeks before to three weeks after tuber initiation. (Superior can withstand 25 percent defoliation.)

K6 Maine Agricultural Experiment Station Technical Bulletin 116
C. Aphids Time
Field Sampling
Reporting Thresholds
With systemic insecticide —end of July. Without systemic insecticide — end of June. Sample at 10 sites along V pattern in field in conjunction with potato leafhopper sampling. At each site, count all aphids on one leaf per plant, five plants per site. Each plant should be in a different row. This will give a total of 50 leaves per field. Sample leaf should be from midsection or lower Vi of plant, avoiding very bottom and very top leaves. Later in the season, as lower leaves begin to senesce, sample two green leaves and two senescing leaves per site. Report the average number of aphids per leaf. 1) Pretuber initiation —two total aphids (winged and wingless) per leaf. 2) Tuber initiation to two weeks before vine kill — four aphids per leaf. 3) Within two weeks of vine kill— 10 aphids per leaf.
D. Potato Lea/hoppers Time
Field Sampling
Reporting
Thresholds
With systemic insecticide — early Julv. Without systemic insecticide—mid-June. At each of 10 sites, count nymphs on one leaf from each of five plants. Early in the season, the leaves should be the same as those inspected for aphids. Do not sample senescing leaves for leafhoppers. Sample additional leaves just for leafhoppers if senescing leaves are being inspected for aphids. Report the average number of immature nvmphs per leaf. 1) 0.1 PLH nymphs per leaf. 2) Do not sample for PLH adults.
II. DISEASES A. Late Blight
1. Scouting All fields should be watched closely for the development of late
blight. There are no specific scouting procedures for late blight, but remain alert for its presence at all times. Look for late blight at the sampling sites for other pests and when walking between sampling sites. When the forecasting system has predicted a disease outbreak, spend a little extra time walking the fields looking for late blight.
If late blight is found, contact Carl Albers or Curt Petzoldt to

Maine Agricultural Experiment Station Technical Bulletin 1 If) 87
verify your findings. Flag the site to make sure you can find it again if verified. Be sure to check the site on subsequent scouting visits to see if the disease is spreading. Alert all other growers in the program that late blight has been found in the county. Be sure to observe grower confidentiality.
B. Early Blight Time Sampling
Reporting
Thresholds
Beginning July 15. Look at 10 trifoliate leaves at each of 2(1 sites per field. Choose the leaves from the lower ' : of the plant, but do not look at dead leaves. Count the number of leaves with early blight lesions. For each site and for the entire field, report the percent of leaves infected with early blight. No economic threshold for early blight currently exists. Most fields will be treated regularly with fungicides for late blight. Unless the fungicide Ridomil is used, the treatments should also control early blight. Ridomil will not control early blight. If Ridomil is being used exclusively and early blight is increasing in severity, suggest to the grower that he apply one of the other fungicides.
C. Other Diseases Look for Rhizoctonia, Fusarium, Verticillium, and viruses when scouting for other pests, particularly earlv blight. Report presence or absence of these diseases.
Preparing a 11 'eed Map
Weeds or weed species may not be evenly distributed over a field. Where localized areas of severe infestation are found or atypical conditions exist (poorly drained area, high spots, field edges) they may be recorded on a weed map. This shows growers where problem areas exist and monitors their movement and changes over the years. Areas of severe infestation can be targeted for specific control, rather than treating the larger area needlessly or failing to control the problems at all.
The scout should first obtain copies of the crop fields from the growers or make a rough sketch, including landmarks, boundaries, crop row direction, compass, roads, a numbering or naming system consistent with the growers',
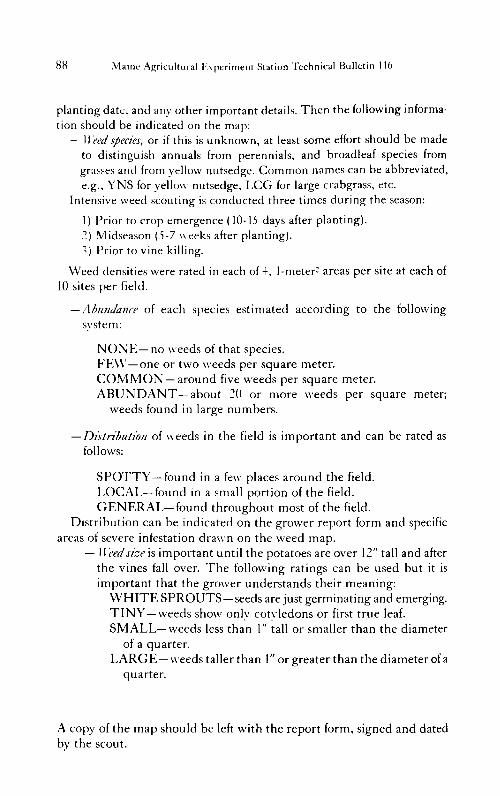
8S Maine Agricultural Kxperiment Station Technical Bulletin 116
planting date, and any other important details. Then the following information should be indicated on the map:
— Weed species, or if this is unknown, at least some effort should be made to distinguish annuals from perennials, and broadleaf species from grasses and from yellow nutsedge. Common names can be abbreviated, e.g., YNS for yellow nutsedge, LCG for large crabgrass, etc.
Intensive weed scouting is conducted three times during the season:
1) Prior to crop emergence (10-15 days after planting). 2) Midseason (5-7 weeks after planting). 3) Prior to vine killing.
Weed densities were rated in each of 4, l-meter: areas per site at each of 10 sites per field.
—Abundance of each species estimated according to the following system:
NONE—no weeds of that species. PEW—one or two weeds per square meter. C O M M O N —around five weeds per square meter. ABUNDANT—about 20 or more weeds per square meter;
weeds found in large numbers.
—Distribution of weeds in the field is important and can be rated as follows:
SPOTTY—found in a few places around the field. LOCAL—found in a small portion of the field. GENERAL—found throughout most of the field.
Distribution can be indicated on the grower report form and specific areas of severe infestation drawn on the weed map.
— Weed size is important until the potatoes are over 12" tall and after the vines fall over. The following ratings can be used but it is important that the grower understands their meaning:
W H I T E SPROUTS —seeds are just germinating and emerging. TINY—weeds show only cotvledons or first true leaf. SMALL—weeds less than 1" tall or smaller than the diameter
of a quarter. LARGE—weeds taller than 1" or greater than the diameter of a
quarter.
A copy of the map should be left with the report form, signed and dated by the scout.

Maine Agricultural Experiment Station Technical Bulletin 116 89


Maine Agricultural Experiment Station Technical Bulletin 116 91
A P P E N D I X C
POTATO IPM FIELD G U I D E TO
ACTION T H R E S H O L D S FOR DISEASE A N D INSECTS
Guidelines for Acceptable Seed (a) RHIZOCTONIA DISEASE COMPLEX (Rhizoctonia solan,): Seed
that has less than 5 percent of its surface affected by sclerotia, cracking, or russeting can be used without treatment whereas any seed with over 5-50 percent of its surface affected must be treated. Seed with over 50 percent of its surface affected should not be used as seed.
(b) FUSARIUM TUBER ROTS {Fusarium spp.): Seed with less than 0.5 percent of tubers with symptoms can be used if diseased tubers are removed before cutting. To determine presence of seedborne inoculum, cut 20 unwashed tubers in half, place in a plastic bag, and rotate to insure contact of cut surfaces with "dirty' skin, place in clean paper bag and store for 10-14 days at 60 F and high relative humidity (85 percent). At the end of storage period, cut a thin layer off the cut surface and observe for lesions caused by Fusarium spp. More than two lesions per cut surface is unsatisfactory, and seed should be treated before cutting.
(c) SILVER SCURF (Helminthosporium solani): Seed that has 10 percent or more of its surface affected should not be used for seed. No seed treatment has been shown to be highly effective in controlling this disease but treatment with thiabendazole does provide some control.
(d) BLACKLEG (Envinia carotovora var. atroseptica): Seed with more than one percent of the tubers showing symptoms should not be used for seed. No effective chemical treatment known.
(e) PINKEYE (Pseudomonas fluorescens): Pinkeye symptoms are generally observed in a dry state on seed tubers but could be possible source of inoculum for daughter tuber infection. Therefore, if observed on seed tubers in any amount it should not be used. No effective chemical treatment known.
(f) SOFT ROT (Em-inia carotovora var. carotovora): Seed with more than one percent of the tubers showing symptoms should not be used for seed. No effective chemical treatment known.
(g) EARLY BLIGHT [Alternaria solani): Seed with any tubers showing lesions should not be used. No effective chemical treatment known.
(h) LATE BLIGHT [Phytophthora infestans): Seed with tubers showing lesions should not be used. No effective chemical treatment known.
(i) VERTICILLIUM WILT ( Verticillium spp.): No guidelines available. Know source and history of seed.

92 Maine Agricultural Experiment Station Technical Bulletin 116
Weed Control Programs
In this program, three principal factors are considered to determine the weed pressure potential of a selected field. Each factor is given equal rank when determining the weed potential and practices necessary for control. The three factors are: a) weed types and species present in previous seasons; b) canopy density typical for the potato cultivar; and c) probable number of days from planting to harvest. Each factor is assigned one to three points and then thev are summed together. The higher the rating the greater potential weed problem. The highest rating possible is a nine and the lowest a three.
To determine the rating, the number of points each factor is assessed is based on the severity of the factor.
The first factor to be considered is weed species and type. The grower, for each field to be planted, checks his list of weeds and types which were prevalent in previous years at economic levels. One value point is assigned for each type of weed, (do not add points for more than one species in the same weed group). Consider annual grasses, annual broadleaves, perennial grasses (quackgrasses, nutsedge), and perennial broadleaves as types of weed grown.
The second factor, potato canopy types is also rated on a 1-3 scale where one = Dense canopies (Hudson and Kennebec), 2 = Moderate canopies (Katahdin and Superior), and 3 = Open or short canopies (Monona and BelRus).
The final factor considered is the number of days from planting to harvest where 1 = less than 100 days, 2 = 100-120 days, and 3 = more than 120 days.
When all factors are studied and a value assigned, the total rating for the three factors is then added to give the final value. The final rating is then used to determine which weed control program to follow for best results.
Program A. Rating of2 or 3
1) Use one herbicide at lowest approved label rate. 2) Give one early cultivation (hilling). 3) Hill just prior to vines closing rows. 4) Kill vines chemically.
Program B. Rating of 4-0
1) Use two appropriate herbicides at average rate. 2) Give two cultivations. 3) Hill just prior to vines closing rows. 4) Kill vines chemically.

Maine Agricultural Experiment Station Technical Bulletin 116 93
Program C. Rating of 7-9
1) Use two or more appropriate herbicides at average rate. 2) Follow-up with 's pound metribuzin prior to hilling if needed or
compatible with potato varietv. 3) Cultivate two or three times. 4) Hill just prior to vines closing rows. 5) Kill vines chemicallv.
Insect Control
Flea Beetle Control Options
A. Area where flea beetle populations are low. 1. Insecticidal control is probably not needed.
B. Area where flea beetle populations are high. 1. Apply a recommended foliar insecticide when there are 15 feeding holes per terminal leaflet (based on 25 plants).
European Corn Borer Control Options
A. Areas where borer populations are low and borers have not previously been a problem. 1. Insecticidal control is probably not needed.
B. Areas where populations are high and borers have previously been a problem. 1. Applv a recommended foliar insecticide when a total of 30 moths
for a five day period is caught in a black light trap, or when there is one egg mass per site, five sites per four to eight hectares (one egg mass per 15 plants). Repeat applications everv five davs as long as 30 moths for the five day period are caught, or until egg masses are no longer found.
2. In fields where the borer has been a problem, remove and destroy vines after harvest to kill larvae that might overwinter.
Aphid Control Options
1. If aphid populations in the area, especially green peach aphids, are usually low. a) Before the second week of blossom apply a recommended foliar
insecticide when there are 50 aphids per plant and 50 percent of the plants are infested (based on a count of 100 plants).
b) After the second week of blossom, apply a recommended foliar insecticide when there are 100 aphids per plant and 75 percent of the plants are infested.

94 Maine Agricultural Kxperiment Station Technical Bulletin lid
(Always apply a recommended foliar insecticide when five percent or more of the green peach aphid nymphs have wing pads, even if the above conditions have not been met.)
2. If aphid populations in the area, especially green peach aphids, are usually high. a) Before the second week of blossom apply a recommended foliar
insecticide when there are 50 aphids per plant and 40 percent of the plants are infested (based on a count of 100 plants).
(Always apply a recommended foliar insecticide when five percent or more of the green peach aphid nymphs have wing pads, even if the above conditions have not been met.)
Colorado Potato Beetle Control Options
A. Regions where beetle populations are low. 1. If the field was not planted to a susceptible crop the previous year.
a. Before the plants are IS centimeters high, apply a recommended foliar insecticide around the edges of the field when five adult beetles in 15 meters of row are observed (only in the row along the edges of the field).
b. After the plants are 15 centimeters high, apply a recommended foliar insecticide to the entire field when there are two larval or adult beetles per plant (based on counts in 15 meters of row).
2. If the field was planted to a susceptible crop the previous year, apply a recommended foliar insecticide to the entire field when there are two larval or adult beetles per plant (based on counts in 15 meters of row).
B. Regions where beetle populations are high. 1. Apply a recommended systemic insecticide to the soil at planting. 2. Apply a recommended foliar insecticide later in the season when
there are two larval or adult beetles per plant (based on counts in 15 meters of row).
Sampling Techniques for Insect Pests
The location of a 0.4 square hectare sampling area is usually determined randomly. If, however, a field is known to have places where one or more of the pest insects is especially troublesome, then a portion of the high risk places should be included in the sample area. This is especially important for Colorado potato beetles. It may be necessary to have different sampling areas for each pest insect. A history of a field will be helpful in locating the sampling areas and in choosing the best control strategies.

Maine Agricultural Kvperiment Station Technical Bulletin I \(i ( '5
I. Potato Infesting Aphids Mark off a 0.4 hectare area, as square as possible, in the field. One hundred sample plants are located throughout the hectare. Early in the growing season when plants are small the numbers of aphids on the entire plant are counted and recorded. When the plants are more than 20.3 cm high the records of aphid populations are restricted to three leaves (one top, one middle, and one bottom) per plant. Plants or leaves of plants are examined in place. Care should be taken in handling so that aphids are disturbed as little as possible. The total number of winged and wingless aphids is determined. The number of aphids per plant is obtained by dividing the total number of aphids by the number of plants sampled (100). Counts should be made weekly throughout the growing season, beginning when the plants are 10 to 15 cm high.
II. Colorado Potato Beetle A. Areas where beetle populations are low and the field was not planted
to a susceptible crop the previous year. When plants are 5 to IS cm high, examine the two rows on each side of the field and three plants on the ends of each row across the top and bottom of the field. Count and record the number of larval and adult beetles observed while walking around the field. The number of beetles per 15 meters is determined by dividing the total number of beetles by the total number of meters travelled. When plants are more than 15.25 cm high, week.lv counts should be made as in B below.
B. Areas where the field was planted to a susceptible crop the previous vear or where beetle populations are high. Mark off a 0.4 hectare area, as square as possible, in the field. Randomly choose 25 rows in the area. Count and record the number of plants and larval and adult beetles on the plants along 15 linear meters of each of the 10 rows. Avoid, where possible, having the 15 row meters parallel. The number of beetles per plant is determined by dividing the total number of larval and adult beetles by the total number of plants observed. Counts should be made weekly throughout the growing season beginning when plants are 5 cm high.

96 Maine Agricultural l.\periment Station Technical Bulletin 116

Maine Agricultural Experiment Station Technical Bulletin 116 97
INTEGRATED PEST MANAGEMENT SUMMARY SHEET
Grower Date IPM Plot Check Plot
I. Aphids
Potato Aphids % Infestation no. Aphids/Plant
Green Peach Aphids % Infestation no. Aphids/Plant
Buckthorn Aphids "<> Infestation no. Aphids/Plant
Comments:
II. Colorado Potato Beetles— Present Absent
Comments:
III. Flea Beetles— Present Absent
Comments:
IV. European Corn Borers —
Eggs— Present Absent
Larvae— Present Absent
Adults— Present Absent
Comments:
V. Late Blight— Present Absent
Comments:
VI. Early Blight— Present Absent
Comments:
VII. Other Pests:
Comments:
Survey Crew: