Embed Size (px)
Citation preview
Eurostat
Integrated system of Natural Capital and
ecosystem services Accounting (INCA) for
the European Union
Anton Steurer - Eurostat, Unit for environment
statistics and accounts; Sustainable development
14th meeting of the UN Committee of Experts
on Environmental Economic Accounting
New York, 24-25 June 2019
Eurostat
EU policy context
• Sustainable Development Goals
• EU 7th Environmental Action Plan
• EU Biodiversity strategy to 2020
• EU Action Plan for nature, people and the economy
• EU post-2020 framework
Eurostat
INCA project – idea and objectives
Address EU policy needs linked to ecosystems and natural capital:
• (Usual statistics bottom-up approach to sum country data too slow and
burdensome, so:) Integrating existing EU wide data sources using
geospatial information, models, EU-wide statistical data sets and
administrative reporting data and establish first actual estimates to
start virtuous cycles.
• Thus harmonising ecosystem accounting activities across EU MS
• Test and advance international environmental accounting guidelines
• While aiming to establish institutional conditions for regular production
• And identifying gaps and needs for adjusting existing sources…….
Eurostat
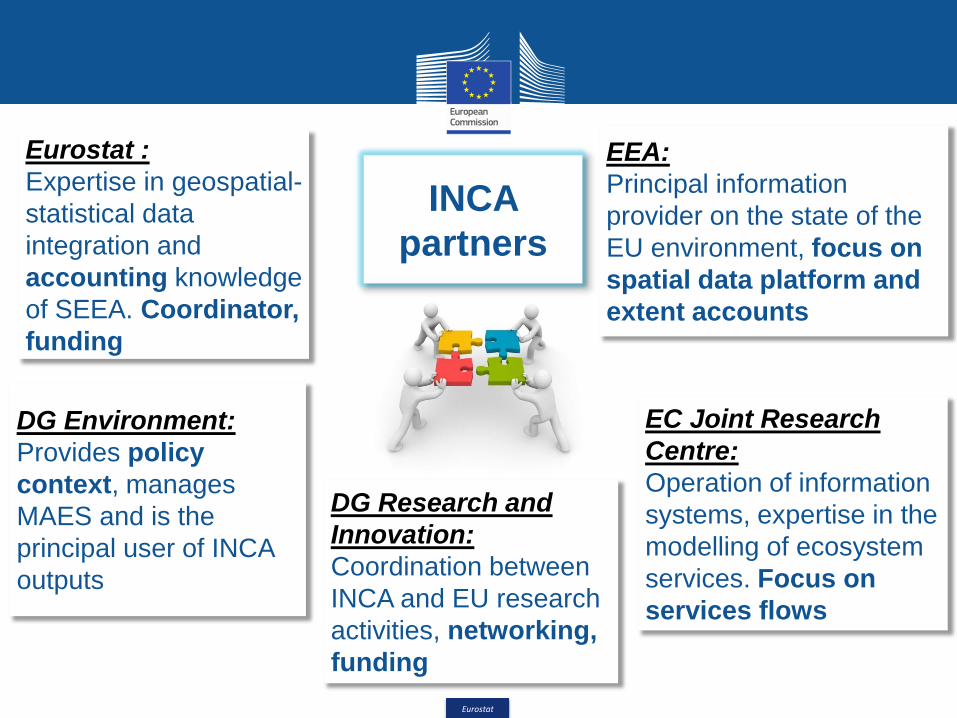
DG Environment:
Provides policy
context, manages
MAES and is the
principal user of INCA
outputs
EEA:
Principal information
provider on the state of the
EU environment, focus on
spatial data platform and
extent accounts
EC Joint Research
Centre:
Operation of information
systems, expertise in the
modelling of ecosystem
services. Focus on
services flows
Eurostat :
Expertise in geospatial-
statistical data
integration and
accounting knowledge
of SEEA. Coordinator,
funding
INCA
partners
DG Research and
Innovation:
Coordination between
INCA and EU research
activities, networking,
funding
Eurostat
INCA results so far
oReport of INCA Phase 1 (2016) (http://ec.europa.eu/environment/nature/capital_accounting/pdf/KIP_INCA_final_r
eport_phase-1.pdf)
oDedicated grant programme for researchers with
administrations (MAIA – 3 million euro) and NSIs
(Eurostat grants of some 0.5 million each year);
oReleased ecosystem extent accounts (EEA);
oReleased first physical and monetary accounts for a
set of ecosystem services (JRC);
oRuns until end 2020 (but will need to be extended)
oAll current reports etc. are here: http://ec.europa.eu/environment/nature/capital_accounting/index_en.htm
The EU MAIA project
• EU research action, 3 million €, 2018-2022, led by Prof. Lars Hein of Wageningen University, NL
• Supports testing and implementation in 9 EU Member States and Norway.
• With 18 partners including statistical offices, environmental departments, research institutes
Eurostat grants
• Financing of pilot studies for ecosystem accounts in EU Member States
• In 2017 and 2018, 8 countries got 11 grants (plus 4-5 in pipeline this year)
• Total budget around 0.5 million € each year, 12-18 months of duration, NSOs or environmental authority
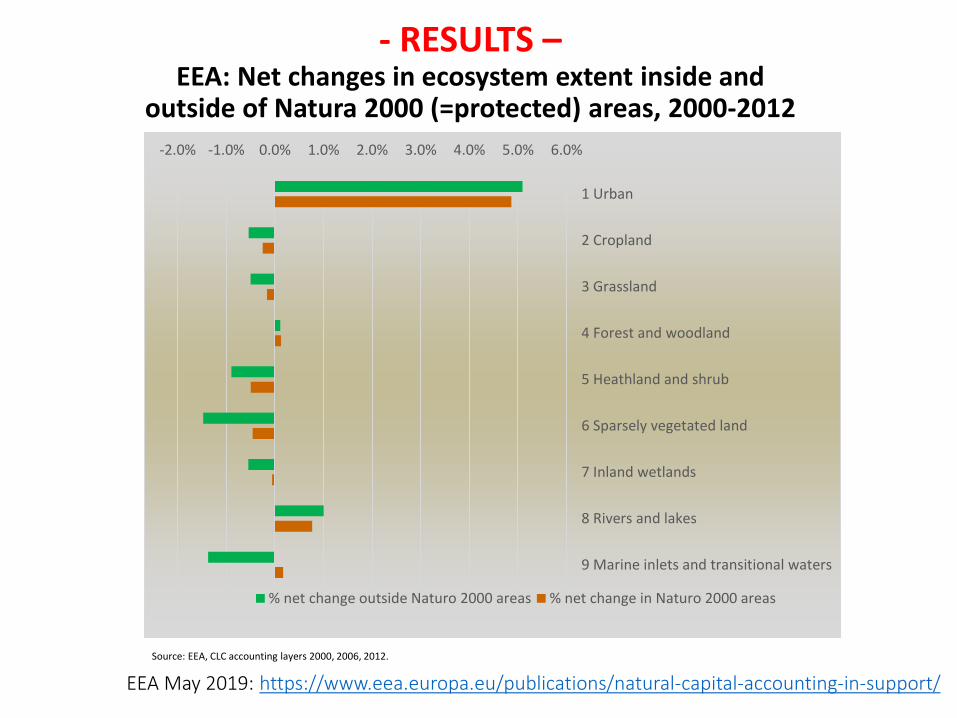
-2.0% -1.0% 0.0% 1.0% 2.0% 3.0% 4.0% 5.0% 6.0%
1 Urban
2 Cropland
3 Grassland
4 Forest and woodland
5 Heathland and shrub
6 Sparsely vegetated land
7 Inland wetlands
8 Rivers and lakes
9 Marine inlets and transitional waters
% net change outside Naturo 2000 areas % net change in Naturo 2000 areas
Source: EEA, CLC accounting layers 2000, 2006, 2012.
- RESULTS –EEA: Net changes in ecosystem extent inside and
outside of Natura 2000 (=protected) areas, 2000-2012
EEA May 2019: https://www.eea.europa.eu/publications/natural-capital-accounting-in-support/
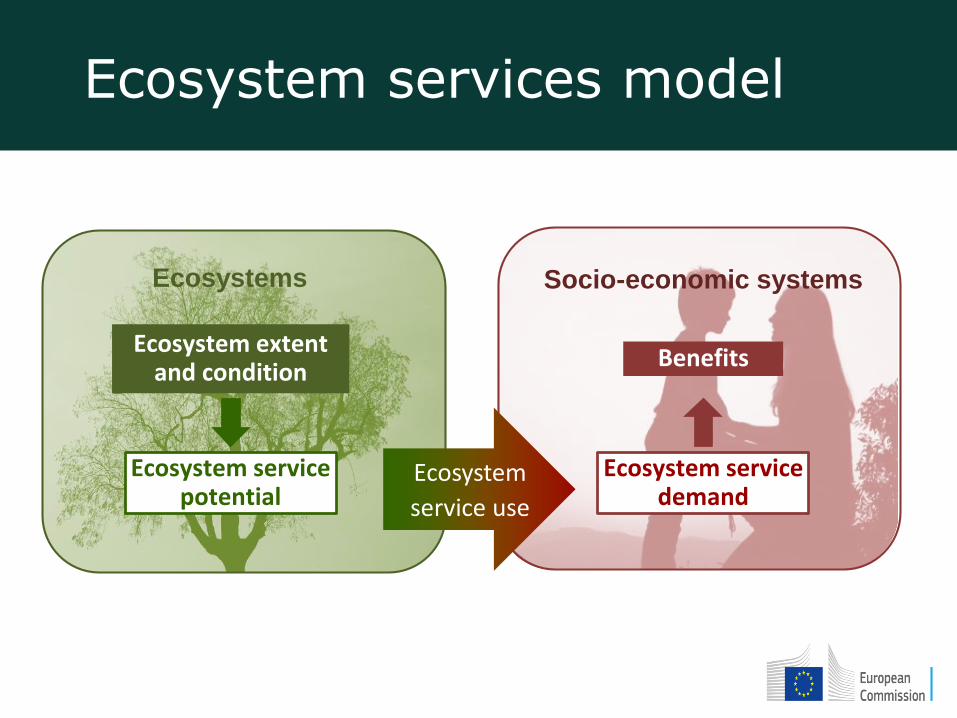
Ecosystem services model
Ecosystems Socio-economic systems
BenefitsEcosystem extent
and condition
Ecosystem service demand
Ecosystem service potential
Ecosystem
service use
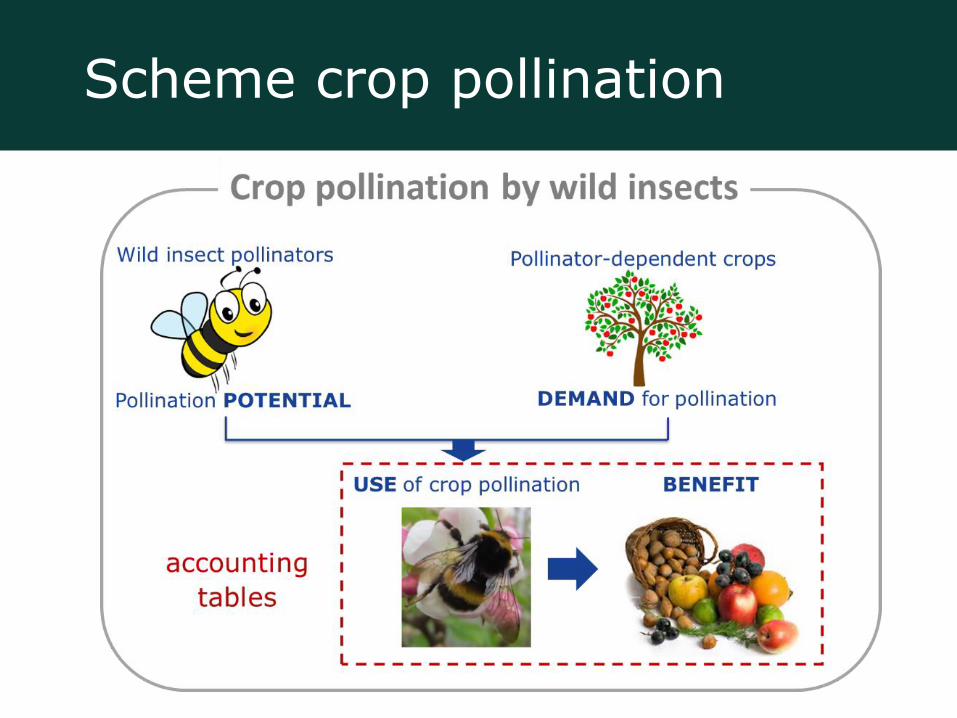
Scheme crop pollination
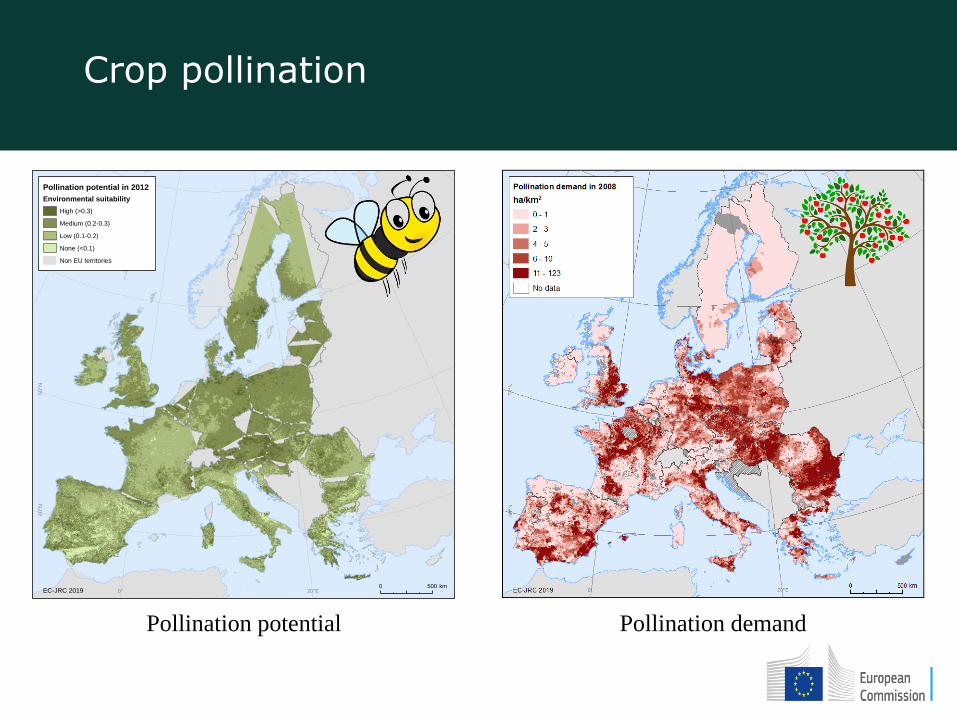
Crop pollination
20°E0°
60
°N50
°N40
°N
0 500 km
Environmental suitability
High (>0.3)
Medium (0.2-0.3)
Low (0.1-0.2)
None (<0.1)
Non EU territories
Pollination potential in 2012
EC-JRC 2019
Pollination potential Pollination demand
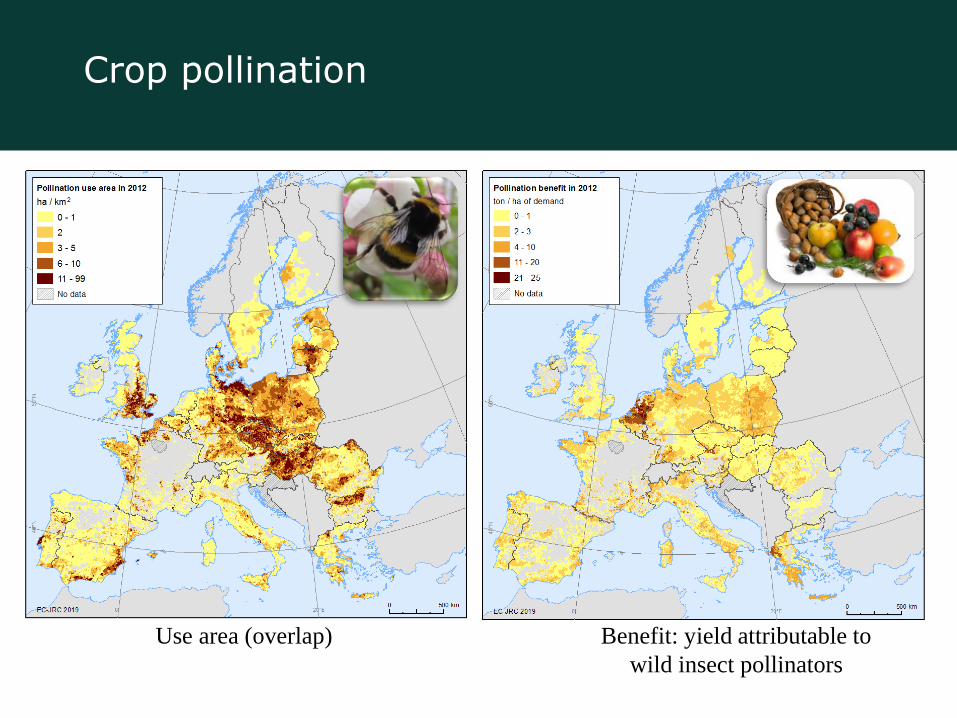
Crop pollination
Use area (overlap) Benefit: yield attributable to
wild insect pollinators
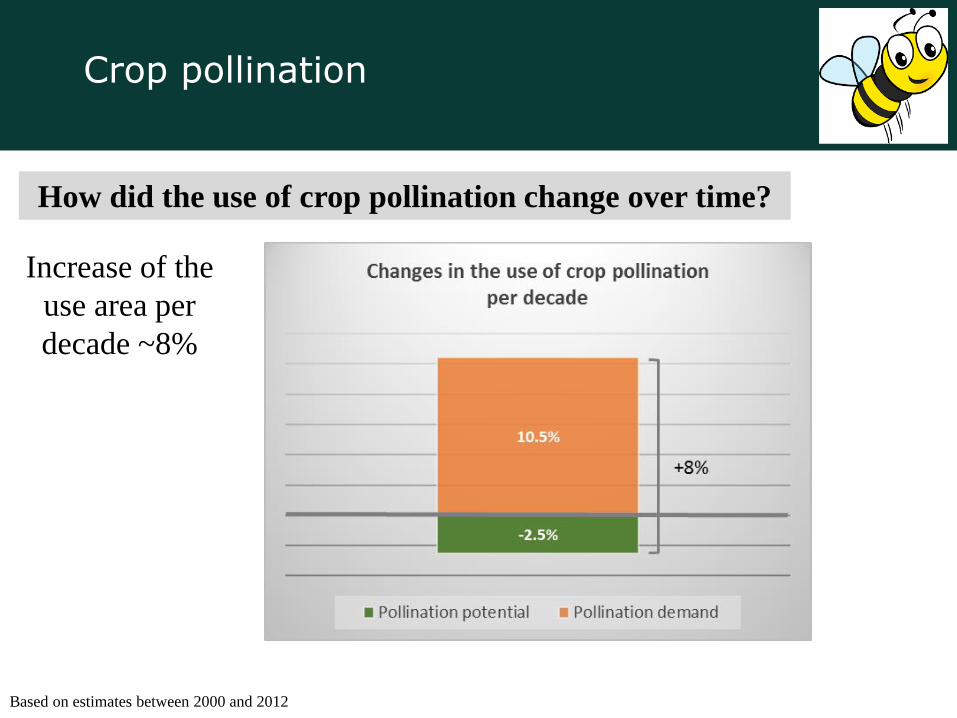
How did the use of crop pollination change over time?
Increase of the
use area per
decade ~8%
Crop pollination
Based on estimates between 2000 and 2012
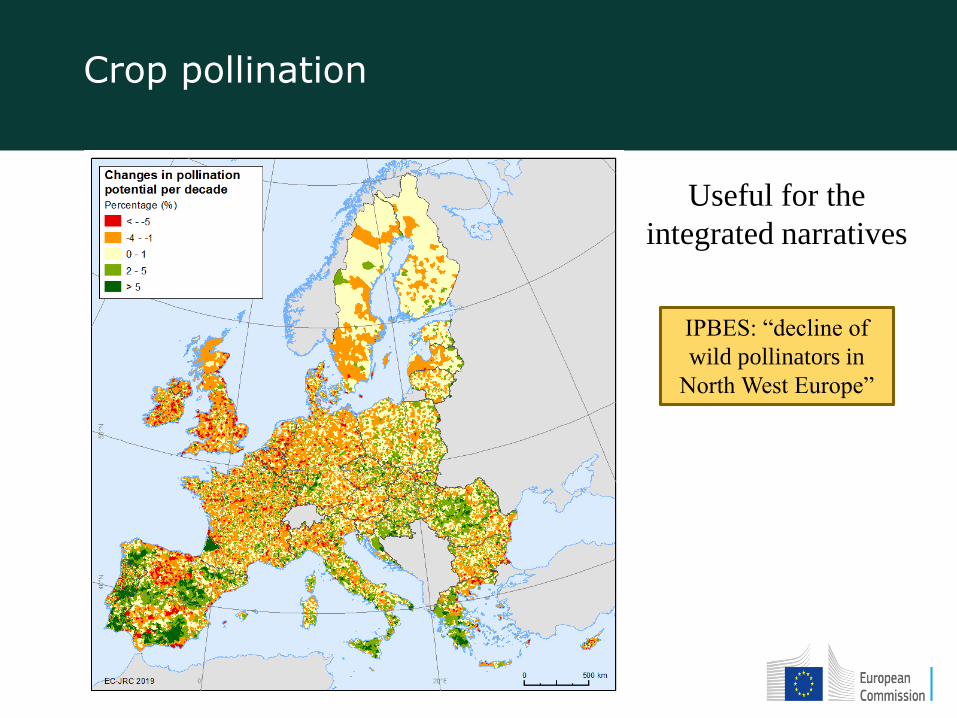
Crop pollination
Useful for the
integrated narratives
IPBES: “decline of
wild pollinators in
North West Europe”
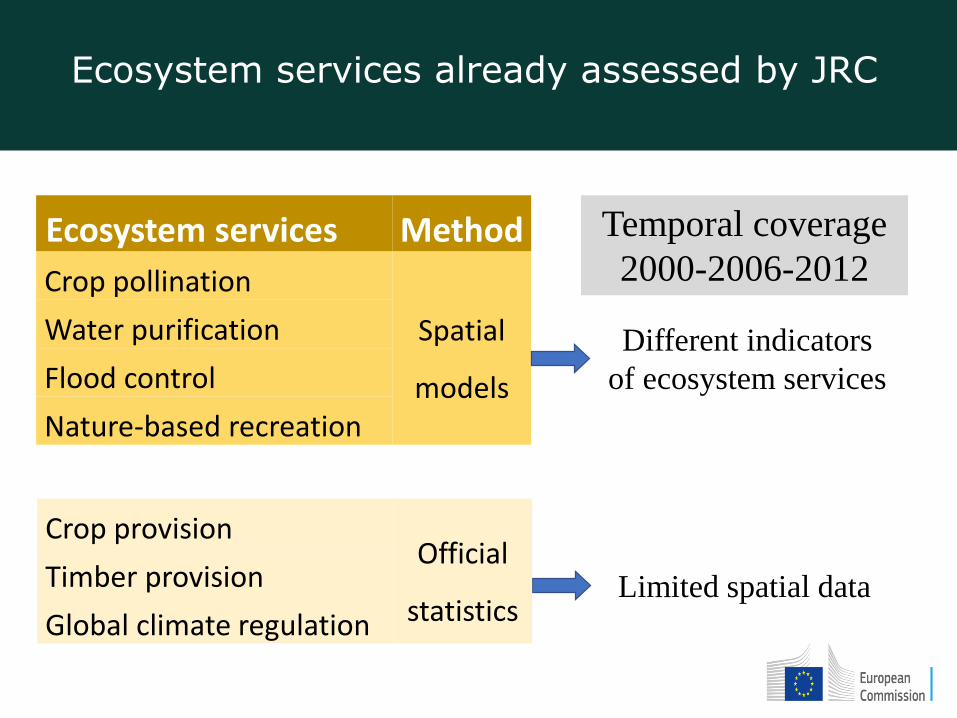
Ecosystem services already assessed by JRC
Ecosystem services Method
Crop pollination
Spatial
models
Water purification
Flood control
Nature-based recreation
Limited spatial data
Different indicators
of ecosystem services
Temporal coverage
2000-2006-2012
Crop provisionOfficial
statisticsTimber provision
Global climate regulation
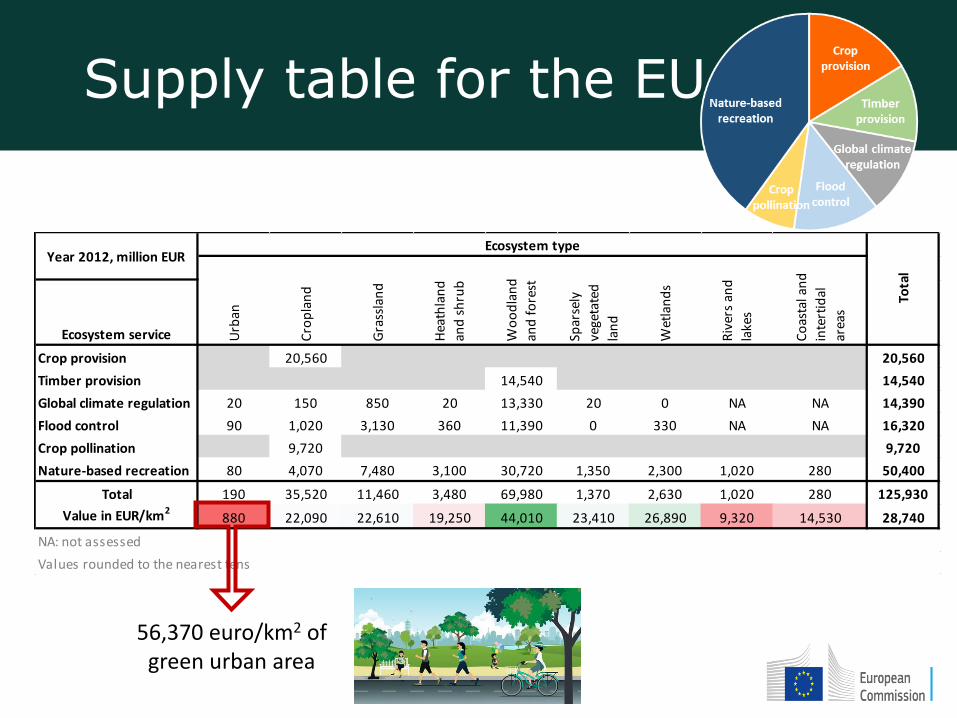
Supply table for the EU
Ecosystem service
Crop provision 20,560 20,560
Timber provision 14,540 14,540
Global climate regulation 20 150 850 20 13,330 20 0 NA NA 14,390
Flood control 90 1,020 3,130 360 11,390 0 330 NA NA 16,320
Crop pollination 9,720 9,720
Nature-based recreation 80 4,070 7,480 3,100 30,720 1,350 2,300 1,020 280 50,400
Total 190 35,520 11,460 3,480 69,980 1,370 2,630 1,020 280 125,930
Value in EUR/km2880 22,090 22,610 19,250 44,010 23,410 26,890 9,320 14,530 28,740
Values rounded to the nearest tens
Tota
l
Urb
an
Cro
pla
nd
Gra
ssla
nd
Hea
thla
nd
and
sh
rub
Wo
od
lan
d
and
fo
rest
Spar
sely
vege
tate
d
lan
d
Wet
lan
ds
Riv
ers
and
lake
s
Co
asta
l an
d
inte
rtid
al
area
s
NA: not assessed
Year 2012, million EUREcosystem type
56,370 euro/km2 of green urban area
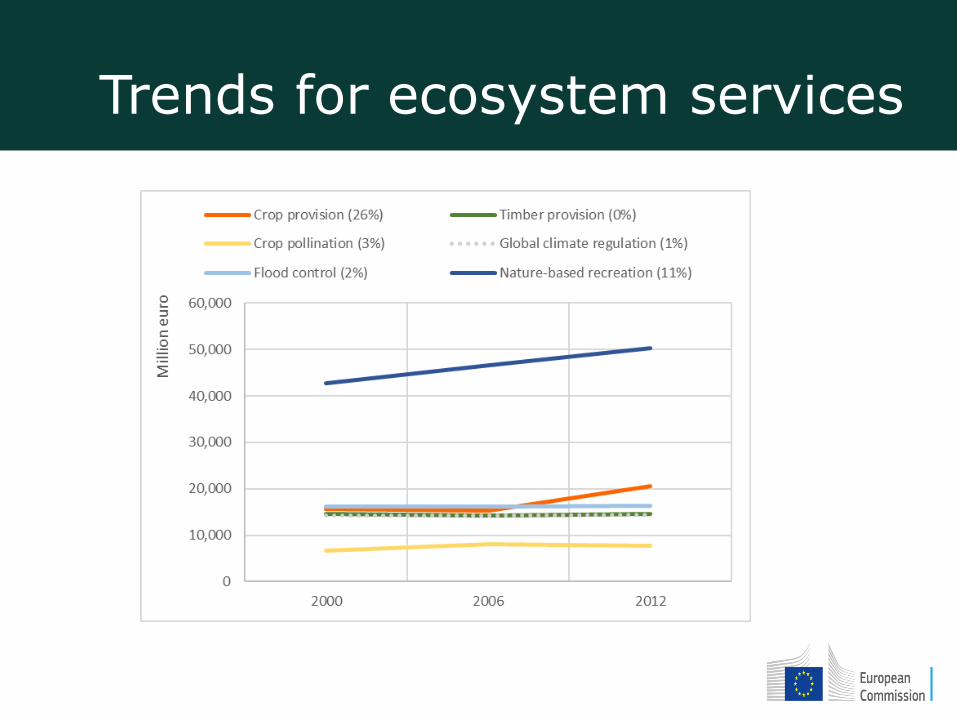
Trends for ecosystem services
Eurostat
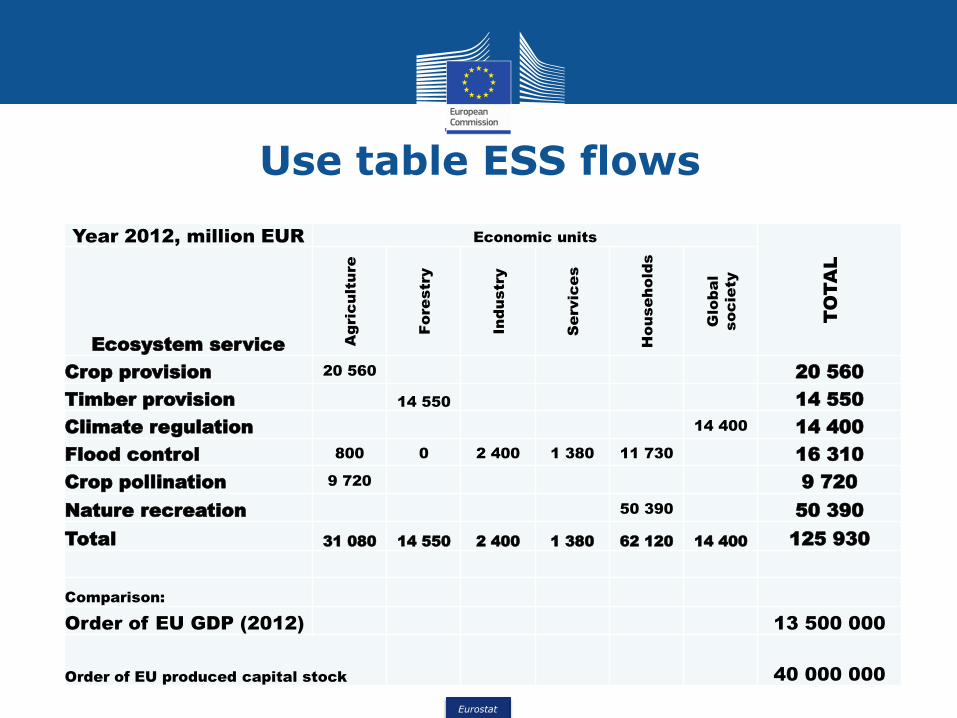
Use table ESS flows
Year 2012, million EUR Economic units
TO
TA
L
Ecosystem service Agricultu
re
Fore
stry
In
dustry
Services
Households
Global
society
Crop provision 20 560 20 560
Timber provision 14 550 14 550
Climate regulation 14 400 14 400
Flood control 800 0 2 400 1 380 11 730 16 310
Crop pollination 9 720 9 720
Nature recreation 50 390 50 390
Total 31 080 14 550 2 400 1 380 62 120 14 400 125 930
Comparison:
Order of EU GDP (2012) 13 500 000
Order of EU produced capital stock 40 000 000
Eurostat
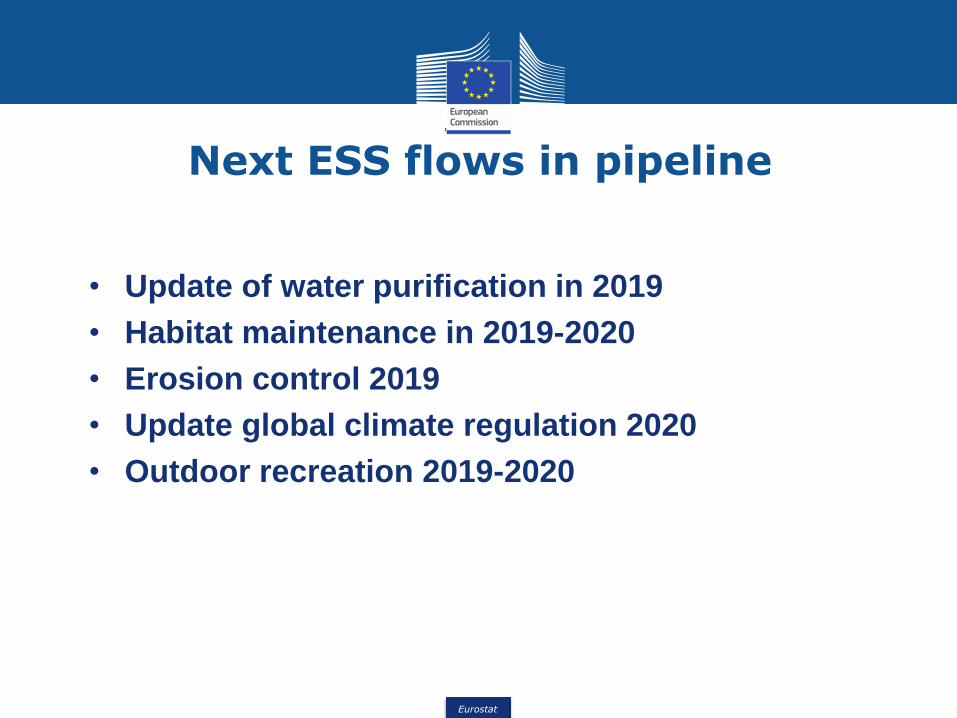
Next ESS flows in pipeline
• Update of water purification in 2019
• Habitat maintenance in 2019-2020
• Erosion control 2019
• Update global climate regulation 2020
• Outdoor recreation 2019-2020
Eurostat
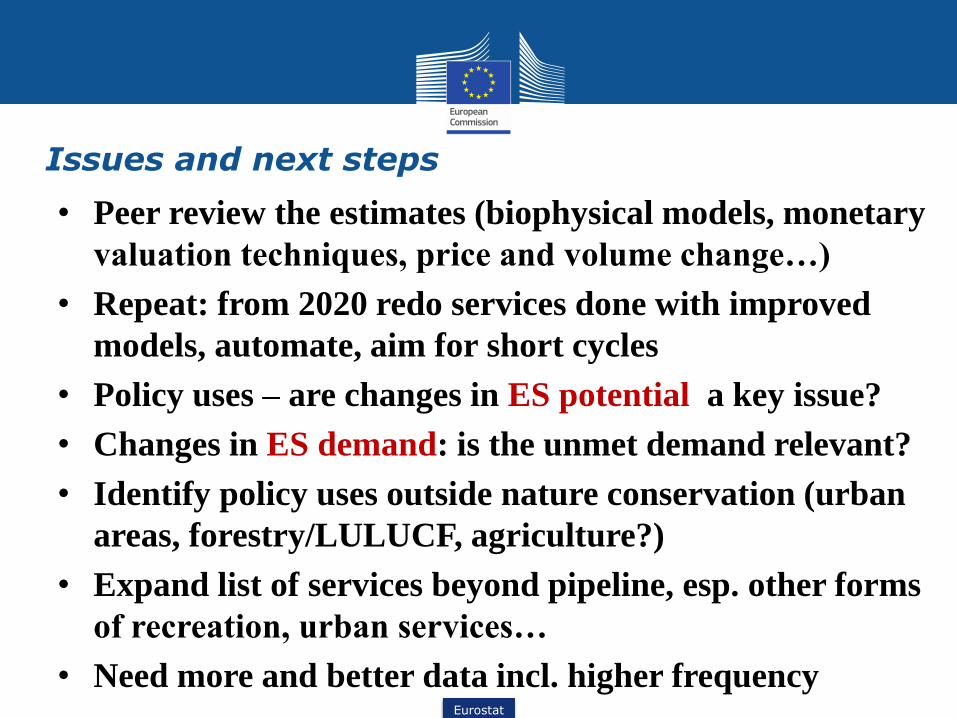
• Issues and next steps
• Peer review the estimates (biophysical models, monetary
valuation techniques, price and volume change…)
• Repeat: from 2020 redo services done with improved
models, automate, aim for short cycles
• Policy uses – are changes in ES potential a key issue?
• Changes in ES demand: is the unmet demand relevant?
• Identify policy uses outside nature conservation (urban
areas, forestry/LULUCF, agriculture?)
• Expand list of services beyond pipeline, esp. other forms
of recreation, urban services…
• Need more and better data incl. higher frequency