Embed Size (px)
Citation preview

Integrated surveillance of
Noncommunicable diseases
(iNCD) A European Union-WHO project
FINAL PROJECT REPORT FOR THE DISSEMINATION OF RESULTS

ABSTRACT
Noncommunicable diseases (NCD) make the largest contribution to the burden of disease in the WHO European Region. Information to characterize the health situation and trends, including risk factors and their determinants, is of key importance to informing policy formulation and programme development. A number of international organizations, such as WHO and the European Union, monitor NCD, each through its own frameworks and databases. However, there are still some information gaps and challenges that need to be addressed, from the completeness of data collections to the quality and comparability of the data. This report is the result of the WHO project, Integrated Surveillance of Noncommunicable Diseases, the aim of which was to assess the status quo regarding NCD data and indicators in European databases, provide international and national examples of good practice in NCD monitoring, and present innovative data sets and data-visualization tools. The coordinated effort of the WHO Regional Office for Europe, the European Commission, an expert group and representatives of the Member States, also provided an opportunity to analyse a pilot set of indicators and identify the basic steps towards improving the availability of information required to meet the policy targets of the NCD Global Monitoring Framework and Health 2020.
KEYWORDS
CHRONIC DISEASE DATASET
EUROPEAN UNION HEALTH POLICY SURVEILLANCE
Address requests about publications of the WHO Regional Office for Europe to: Publications WHO Regional office for Europe UN City, Marmorvej 51 DK-2100 Copenhagen Ø, Denmark Alternatively, complete an online request form for documentation, health information, or for permission to quote or translate, on the Regional Office website (http://euro.who.int/pubrequest).
© World Health Organization 2015
All rights reserved. The Regional Office for Europe of the World Health Organization welcomes requests for permission to reproduce or translate its publications, in part or in full. The designations employed and the presentation of the material in this publication do not imply the expression of any opinion whatsoever on the part of the World Health Organization concerning the legal status of any country, territory, city or area or of its authorities, or concerning the delimitation of its frontiers or boundaries. Dotted lines on maps represent approximate border lines for which there may not yet be full agreement. The mention of specific companies or of certain manufacturers’ products does not imply that they are endorsed or recommended by the World Health Organization in preference to others of a similar nature that are not mentioned. Errors and omissions excepted, the names of proprietary products are distinguished by initial capital letters. All reasonable precautions have been taken by the World Health Organization to verify the information contained in this publication. However, the published material is being distributed without warranty of any kind, either express or implied. The responsibility for the interpretation and use of the material lies with the reader. In no event shall the World Health Organization be liable for damages arising from its use. The views expressed by authors, editors, or expert groups do not necessarily represent the decisions or the stated policy of the World Health Organization.


iii
Contents
Foreword ..................................................................................................................................... v
Acknowledgements..................................................................................................................... vi
Executive summary .................................................................................................................... vii
Chapter 1. Introduction ................................................................................................................ 1
Chapter 2. Report on the completeness and quality of existing NCD data ...................................... 3
2.1 Introduction .................................................................................................................................. 3
2.2 Background ................................................................................................................................... 3
2.3 Methodology ................................................................................................................................. 4
2.4 Results ........................................................................................................................................... 4
2.5 Discussion of results ...................................................................................................................... 5
Chapter 3. Report on creation of a pilot data set for NCD surveillance in Europe .......................... 11
3.1 Introduction ................................................................................................................................ 11
3.2 Methodology ............................................................................................................................... 11
3.3 Results ......................................................................................................................................... 12
3.4 Discussion of results .................................................................................................................... 16
Chapter 4. Report on examples of national good practice in health-monitoring systems .............. 18
4.1 Introduction ................................................................................................................................ 18
4.2 Methodology ............................................................................................................................... 18
4.3 Examples of good practice in health monitoring in EU and EFTA countries ............................... 19
4.3.1 Denmark: elimination of trans-fatty acids in food products ............................................... 19
4.3.2 Finland: reduction of salt intake .......................................................................................... 19
4.3.3 Finland: using GMF goals and indicators to develop a national public health programme 20
4.3.4 Italy: Italian behavioural risk factor surveillance system (PASSI) ........................................ 20
4.3.5 Malta: the creation of a diabetes information system ........................................................ 21
4.3.6 Netherlands: harmonization of the regional health surveys through the Dutch Public
Health Monitor.............................................................................................................................. 22
4.3.9 United Kingdom of Great Britain and Northern Ireland: food marketing to children ......... 25
4.3.10 WHO European Childhood Obesity Surveillance Initiative (COSI) in EU Member States .. 25
4.4 Examples of good practice in health monitoring outside EU...................................................... 26
4.4.1 Israel: electronic health records for better NCD monitoring and control ........................... 26
4.4.2 Republic of Moldova: the national STEPwise approach to surveillance .............................. 27
Chapter 5. Report on innovative data sets and comparative analysis ........................................... 28
5.1 Introduction ................................................................................................................................ 28

iv
5.2 Methodology ............................................................................................................................... 28
5.3 Overview of data sources............................................................................................................ 31
5.3.1 Capturing and using social-media data ................................................................................ 31
5.3.2 Capturing and using data from digital trails and other big-data sources ............................ 32
5.3.3 Capturing and using EHR data .............................................................................................. 34
5.4 Visualizing data for comparative analysis ................................................................................... 36
5.4.1 Data visualization using the small-multiples technique for comparison of NCD trends
between countries and across time .............................................................................................. 36
5.4.2 Dynamic pictures for comparative trend analysis ............................................................... 36
5.4.3 WHO interactive atlases of health data at Nomenclature of Territorial Units for Statistics 2
(NUTS2) level ................................................................................................................................. 39
5.5 Discussion .................................................................................................................................... 41
Chapter 6. Next steps ................................................................................................................. 42
6.1 Enhancing data quality and availability ...................................................................................... 42
6.1.1 Data collection ..................................................................................................................... 42
6.1.3 NCD monitoring at national level ......................................................................................... 42
6.1.4 National and regional reporting on NCD surveillance and monitoring ............................... 42
6.1.5 Efficiency of NCD data collections ....................................................................................... 42
6.2 Strengthening capacity-building ................................................................................................. 43
6.2.1 Sharing methods, tools and knowledge ............................................................................... 43
6.2.3 Training processes ................................................................................................................ 43
6.3 Collaboration between networks and international organizations ............................................ 43
6.3.1 Harmonizing and comparing NCD indicators ....................................................................... 43
6.3.2 Reducing the burden of data collection and enhancing efficiency ...................................... 43
References ................................................................................................................................. 44
Annexes..................................................................................................................................... 50
Annex 1. Overview of NCD indicators and their definitions from three indicator systems
in Europe ........................................................................................................................................... 50
Annex 2. Overview of databases and sources .................................................................................. 58
Annex 3. Comparative analysis of data availability per indicator ..................................................... 66

v
Foreword
Today, noncommunicable diseases (NCD) account for nearly 80% of all deaths in Europe. As the
burden of NCD increases globally, affecting the most productive years of life, there is growing
concern in the world about their effects not only on health but also on sustainable development. In
accordance with the Political Declaration on the prevention and control of NCD adopted by the
United Nations General Assembly in 2011, WHO developed the Global action plan for the prevention
and control of noncommunicable diseases, 2013-20. To facilitate assessment of the action taken to
implement this plan, a global monitoring framework was also established, which includes a set of 9
voluntary targets and 25 indicators on health status, risk factors, and health-system capacity and
response.
Establishing a process of monitoring and assessing the implementation of action to prevent and
control NCD at the country level is linked with a number of challenges related to data availability,
comparability and quality. Although NCD-related data are available in European countries in a
number of traditional national and international sources, questions relating to these sources, as well
as the lack of comparability of some indicator definitions and the timeliness of data reporting, among
others, need to be addressed. In addition, data relating to some of the new indicators required by the
global monitoring framework are either completely lacking or difficult to collect. Thus, ways of
improving the harmonization and quality of data need to be considered, as well as alternative forms
of data collection.
The WHO Regional Office for Europe, the European Commission and experts and professionals from
Member States joined forces within the Integrated surveillance of NCD (iNCD) project to assess the
situation regarding the comparability of NCD data and NCD-related indicators in international
sources, determine the feasibility of creating a pilot set of GMF indicators, share good practice in
NCD monitoring at the local, national and regional levels, and explore the application of information
and communication technologies with a view to improving the diversity and timeliness of data
availability and the analysis and display of information.
Through this report, we are pleased to present a synthesis of the work carried out within the iNCD
project and our vision of the action necessary to enhance the availability and quality of NCD-related
information and to orient health policy in Europe towards addressing one of the major health and
development challenges of the 21st century.
Gauden Galea
Director, Division of Noncommunicable Diseases and Promoting Health through the Life-Course

vi
Acknowledgements
The concept and methodological approaches of the Integrated surveillance of noncommunicable
diseases (iNCD) project were developed by staff of the Division of Noncommunicable Diseases and
Promoting Health through the Life-Course, WHO Regional Office for Europe. Gauden Galea, Director
of the Division provided the overall direction and the following staff developed the report: Frederiek
Mantingh, Technical Officer, Damiët Onderstal, Technical Officer, and Manfred Huber, Coordinator,
Healthy Ageing, Disability and Long-term Care, Enrique Loyola, Coordinator, Surveillance of
Noncommunicable Diseases, and Altynai Satylganova, Intern.
The contributions to the report were made by Michael Roerecke, Scientist, Center for Addiction and
Mental Health, Toronto, Canada and Ran Balicer, Director, Clalit Research Institute, WHO
Collaborating Center for Noncommunicable Diseases Research, Prevention and Control, Tel Aviv,
Israel. The following staff of the WHO Regional Office for Europe and the European Union are also
gratefully acknowledged: Jo Jewell, Consultant, Nutrition, Physical Activity and Obesity; Susanna
Kugelberg, Consultant, Nutrition, Physical Activity and Obesity; Trudy Wijnhoven, Technical Officer,
Nutrition and Obesity Surveillance, WHO Regional Office for Europe; and Stefan Schreck, Head, DG
SANCO C2, Sigurlaug Hauksdottir, Policy Officer, DG SANCO C2 and Hristina Mileva, Scientific Project
Officer, Consumers, Health and Food Executive Agency, European Commission.
Much of the ground work was carried out with the support of a WHO Expert Group, comprising
Jurgen Rehm, Director, Center for Addiction and Mental Health, Toronto, Canada Stefano
Campostrini, Dean, Ca’Foscari Graduate School, University Ca’Foscari, Venice, Italy; Tiina Laatikainen,
Department of Chronic Diseases Prevention, National Institute for Health and Welfare Finland,
Helsinki, Finland; Aurelijus Veryga, Institute of Health Research, Lithuanian Institute of Health
Sciences, Kaunas, Lithuania; and Laurens Zwakhals, National Institute for Public health and the
Environment (RIVM), Bilthoven, Netherlands. Their technical recommendations and contributions to
the writing of the report are much appreciated.
In addition, many national professionals provided comments on the draft report and contributed
examples of good practice in NCD monitoring. Our sincere appreciation of their dedication and high
quality of work goes to all of them.
The report was produced with the financial assistance of the European Union. The views expressed
in the report do not necessarily reflect the official opinion of the European Union.

vii
Executive summary
Over recent decades, the global burden of noncommunicable diseases (NCD) has been increasing,
although levels vary from region to region. It is estimated that NCD currently account for at least
75% of all deaths in Europe. Their main risk factors are well known but more information about their
prevalence in different segments of the population is needed. In addition, traditional sources of
information present the challenge of providing the quality data required for policy-making,
programme formulation and monitoring in a timely manner. Thus, other data sources are being
explored.
Cooperation between the WHO Regional Office for Europe (the Regional Office) and the European
Commission (EC) in the area of health information is long-standing and includes the development of
indicators, the collection of data and the establishment of information systems. In the light of the
above-mentioned challenges, in 2013, they initiated the joint project, Integrated surveillance of
noncommunicable diseases (iNCD), to determine the current situation regarding NCD-related
indicators, the starting point being the European Core Health Indicators (ECHI) and the targets and
indicators of the WHO global monitoring framework for the prevention and control of NCD (GMF).
The project also aimed to: identify and share good practices in implementing the integrated
surveillance of NCD at the national level; compile and test a pilot data set for comparing the
prevalence of NCD and their risk factors at the international level; and identify new data sets and
ways of analysing and presenting the data.
Collecting the information involved a desk review of the different frameworks, an assessment of the
comparability of the indicators and the availability and quality of the existing data in different
international information sources and databases, and national workshops involving international
experts. The expected outcomes of the project were to: achieve a better understanding of the
availability and quality of the data required for the integrated surveillance of NCD in Europe to
address recent policy and strategy developments; synthesize examples of good practice that may be
applicable in national settings; propose action to address the remaining challenges, including gaps in
and quality issues related to information; and, based on case studies and experimental data sources,
develop innovative data sets for NCD monitoring.
The report is divided into four sections: the first addresses the completeness and quality of the NCD-
indicators data existing in the major international databases in European countries, including three
indicator systems linked to policy mandates of EC (the European Community Health Indicator
Monitoring (ECHIM)) and WHO (GMF and Health 2020). It provides a comparative overview of the
NCD indicators and their definitions, an overview of available databases that cover the NCD
indicators of all European Union (EU) Member States (EU28)1 and the European Free Trade
Association (EFTA) Member States2 ((and, thus, also WHO Member States included among these
countries), and a comparative analysis of data availability per indicator in selected international
1 EU Member States (EU28): Austria, Belgium, Bulgaria, Croatia, Cyprus, Czech Republic, Denmark, Estonia,
Finland, France, Germany, Greece, Hungary, Ireland, Italy, Latvia, Lithuania, Luxembourg, Malta, Netherlands, Poland, Portugal, Romania, Slovenia, Slovakia, Spain, Sweden, United Kingdom. 2 EFTA Member States: Iceland, Liechtenstein, Norway, Switzerland.

viii
databases. This information reveals that the indicator systems existing in these countries include a
diversity of NCD-related indicator dimensions (health outcomes and impacts, risk factors, health-
system response), suggesting a comprehensive approach. Although there is a substantial overlap in
indicators across systems, they differ in breadth, and only GMF takes national policies into account.
Furthermore, indicator definitions vary according to data source, target population, disaggregation,
type of measurement, and reporting method. Regarding the key international data sources involved
in NCD monitoring in the EU28 and EFTA countries, Eurostat is the main source for ECHI while the
WHO Global Health Observatory (GHO) and the European Health for All database (HFA-DB) are those
for indicators listed in GMF and Health 2020. These sources differ as regards detail and quality of
data, national coverage and timeliness, and they use different secondary international sources for
some indicators. Overall, the results of the project show an important improvement in the
availability of NCD indicators in EU28 and EFTA Member States, suggesting a potential for enhancing
and coordinating the approaches of the international organizations that collect and report NCD data,
and a need to improve the harmonization of indicator definitions and the measurement and quality
of the data.
The second section of the report deals with a pilot demonstration of data available for an array of
indicators aimed at exploring the feasibility of integrating a core set of indicators and databases for
the comprehensive surveillance of NCD in EU28 and EFTA Member States to address mandates of
common interest (such as GMF, ECHIM, Health 2020). The results were analysed according to level
of availability by country, conformity with standard international indicator definitions, and capacity
to facilitate identification of health inequalities. Indicators data are available for EU28 and EFTA
Member States in the selected EC and WHO databases (ECHI, GHO and HFA-DB) although, in most
cases, they are limited in number. The availability of data and their compliance with the defined
quality requirements varied across Europe, which supported the suggestion that additional work was
necessary to improve some of the indicators, such as, those measuring physical activity and other
NCD risk factors.
To facilitate knowledge sharing and learning, examples of different systems of good practice in the
integrated surveillance of NCD within and outside EU are presented in the third section of the
report. These were identified on the basis of a literature and evidence review and according to
quality criteria, and include information about the methodologies used by the systems and their
usefulness in informing policy. The systems vary from local to regional in scope and level of
application and consider different indicator dimensions for NCD surveillance (for example, outcomes
or risk factors). They make use of various types of data sources, from the more traditional
population-based registries for and health surveys on disease and risk factors, to sources that
monitor the content or marketing of food products, according to the population group targeted (for
example, children or adults). The systems also differ in approach, for example, from using electronic
health records (EHR) or integrating different sources of indicator dimensions to using a multipurpose
behavioural community surveillance system. The results of the review indicate that there is a
plethora of good practices that could be considered for adoption or adaptation by the countries to
strengthen their current NCD surveillance systems, although acceptability, feasibility and cost would
be important determinants. The sharing of experiences among neighbouring countries or regions
may become an important catalyser.

ix
Integrated NCD surveillance is confronted with several important challenges, such as, sensitivity to
change (capturing short- and long-term trends), the timeliness of data availability, coverage of
certain populations, costs, the feasibility of more continuous monitoring, and the interoperability of
health-related information systems. In addition, the analysis and visualization of data need to be
enhanced so that more accurate NCD-related evidence may be conveyed to the policy-makers. The
fourth section of the report illustrates innovative data sets, some of their sources, and their
potential application, as well as examples of good practice in the application of innovative data
sources and data visualization in integrated NCD surveillance. There is, however, much potential for
further development by the countries. The need for new applications for the integrated surveillance
of NCD can be partially addressed through EHR-based surveillance systems and, potentially,
throu½gh new data sources, such as social media and digital trails of everyday real-life activity. Each
presents both advantages and limitations. Social media provide opportunities to assess attitudes and
behaviours related to NCD and their risk factors, making it possible to measure trends and shed light
on the public’s views on important topics and inform public health policies and campaigns. However,
validating and standardizing indicators is more difficult, and selection biases or other influences may
play a part. Every day, millions of data are recorded digitally through electronic devices (such as
mobile phones), leaving a trail of our movements and actions. Purchases or orders made in
supermarkets or from other commercial entities are other sources of highly important data. Digital
trails may be used to reach large numbers of people at frequent intervals, enabling the detection of
pattern changes. They may be linked with other systems to obtain additional depersonalized
information. Some of the challenges associated with the use of digital trails are representativeness
of diverse populations, socioeconomic influences related to selection/participation, and privacy
concerns. Although large updated clinical and administrative data sets based on EHR and insurance
claims were not originally designed for surveillance, their use is spreading. Today, EHR show great
promise as an NCD surveillance tool. In addition to the cost of developing and deploying electronic
EHR, other challenges include their regulation, their linkage with other systems, and privacy
concerns.
The area of data visualization for comparative analysis is also changing with the introduction of new
and improved information and communication technologies. User-friendly data-visualization tools
provide further capacity for analysing and synthesizing the time trends and patterns of indicators,
comparing data across and within countries and, at the same time, enhancing communication with
policy-makers and other users. Three of these tools are briefly described in the report: the small-
multiples technique for comparing NCD trends between countries and across time; Gapminder, by
means of which dynamic pictures for comparative trend analyses can be produced; and the WHO
atlases of social inequalities, which allow visualization of the difference between a target value and
the value in a region or group of regions. The emphasis is on their capacity to show data in different
ways and provide answers to diverse questions.
In summary, the overall aim of the iNCD project was to contribute to streamlining NCD surveillance
to avoid duplication of effort by the different international organizations involved, and to provide EU
and WHO Member States with a common framework to this end. It was also the purpose to
contribute to bringing together data on the health impact, risk factors and policy measures related
to NCD in an integrated monitoring framework, using innovative data sets and other means of
enhancing the analysis of evidence and communicating the results to policy-makers.


1
Chapter 1. Introduction
NCD are major contributors to the burden of disease worldwide. While mortality from these
diseases is generally on the decline, population ageing means that the number of people they affect
is increasing and further strategies are needed for their prevention and control.
In EU, there are several frameworks for tracking progress on the prevention and control of the four
major NCD - cardiovascular disease (CVD), cancer, chronic respiratory diseases and diabetes - and
their key risk factors: the European Core Health Indicators (ECHI) (1), developed by the European
Commission (EC) in conjunction with the EU Member States as part of the EC Health Monitoring
Programme (2); a shortlist of 88 indicators for a sustainable health-monitoring system in EU (3) and
the Health in Europe: Information and Data Interface (HEIDI) tool for data visualization (4). The 88
indicators (3) represent a package of comparable data that are regularly collected and disseminated
across EU Member States.
Health 2020, the European health policy framework of the WHO Regional Office for Europe (5)
proposes a set of targets and indicators that include NCD, and covers all EU Member States that are
part of the WHO European Region. Following the adoption of the Political Declaration of the High-
level Meeting of the General Assembly on the Prevention and Control of Non-communicable Diseases
(6) by the United Nations General Assembly in 2011, WHO prepared the GMF (7) for tracking
progress in preventing and controlling the major NCD and their risk factors. GMF (7), which includes
9 voluntary targets and 25 indicators, was adopted by the WHO Member States at the sixty-sixth
session of the World Health Assembly in May 2013 (resolution WHA66.10) (9) and, thus, also covers
all EU Member States. Its aim is to create a pool of standardized comparable data across countries,
regions and subregions towards the achievement of its 9 voluntary global targets by 2025. The NCD
indicators and targets of Health 2020 (5) have been aligned with those of GMF (7) with adjustments
made to accommodate the relevant cut-off dates of the two frameworks, namely 2020 and 2025,
respectively (9). The variety of the indicators included in the various NCD monitoring frameworks
calls for a better understanding of the NCD data available in EU, their quality and how they are used.
The iNCD project, co-funded by EC and WHO, was the first step in helping WHO Member States that
are also EU and EFTA countries to reflect on the four major NCD and report progress made towards
reaching the goals of GMF (7), making optimal use of the ECHI shortlist of indicators (3). It sought to
assess the completeness and quality of existing indicator systems with a view to using them to
comply with global commitments in the area of NCD prevention and control. This would also support
WHO European Member States in reporting on the indicators included in Health 2020 (5) and GMF
(7).
This document comprises four chapters, each reporting on a different aspect of the integrated
surveillance of NCD. The first report presents the results of a assessment of the completeness and
quality of existing NCD data; the second is on pilot data sets for NCD surveillance in EU and EFTA
countries; the third presents examples of national good practice related to health-monitoring
systems; and the fourth elaborates on innovative data sets for NCD monitoring and provides
examples of improved data visualization for comparative analysis.

2
The outcomes of the iNCD project will contribute to:
addressing the main challenges associated with NCD reporting in EU and EFTA countries;
streamlining surveillance to avoid duplication of the efforts of international organizations and
provide Member States with a common framework, definitions and instruments;
bringing together, in an integrated monitoring framework, data on health impact and the risk
factors and policy measures related to NCD; and
uniting these data domains in such a way as to allow user-friendly analyses of the data and the
use of innovative ways to present them.
These outcomes will lead to improved information-based policy decisions in the area of NCD.
3
Chapter 2. Report on the completeness and quality of existing NCD
data
2.1 Introduction
This report is one of the main deliverables of the iNCD project and presents the results of a study to
assess the completeness and quality of NCD data existing in Europe, including the risk factors and
policy parameters relevant to NCD. The study was restricted to indicators linked to EC and WHO
mandates and based on work carried out within the ECHIM project (10). It focuses on the EU
Member States (EU28) and the four European Free Trade Association (EFTA) countries (Iceland,
Liechtenstein, Norway and Switzerland).
2.2 Background
Monitoring progress made in the area of NCD prevention and control requires a thorough analysis of
the existing information for use in policy-making. The monitoring and surveillance of NCD should be
based on retrospective analyses of mortality data and current cross-sectional analyses of morbidity
data to identify intervention targets, as well as on prospective analyses of risk-factor data to predict
the contribution of NCD to the future disease burden. Ideally, these data would be disaggregated by
sex and socioeconomic status, comprising a well-developed monitoring framework. Currently, there
are many monitoring and surveillance frameworks covering different aspects of NCD surveillance in
the EU countries and their indicator sets often overlap. The three major indicator systems covering
NCD are ECHI (1), Health 2020 (5) and GMF (7).
ECHI (1) were developed within the European Community Health Indicator Monitoring (ECHIM)
project (3), the main task of which was the Joint Action for ECHIM (2009-2012) aimed at the
implementation of health indicators and health monitoring in the EU Member States. The focus was
on harmonization of data collection and indicator definitions to be able to produce comparable
health data. The work was carried out in close collaboration with Member States, EC, Eurostat (11),
the Organisation for Economic Co-operation and Development (OECD), WHO, and other
international organizations with the aim of supporting the EU Health Strategy, “Together for Health”
(12). The project established the ECHI shortlist of 88 key health indicators (3), of which 28 cover
NCD.
Health 2020 (5), adopted by the WHO Regional Committee for Europe at its 62nd session in 2012
(13), aims to improve the health and well-being of populations, reduce health inequalities,
strengthen public health and ensure people-centred health systems that are universal, equitable,
sustainable, and of high quality. It has its own set of indicators corresponding to the main NCD risk
factors and outcome measures.
GMF (7) which was adopted at the 66th session of the World Health Assembly in May 2013 (8)
includes 25 indicators for tracking global progress in the prevention and control of the major NCD
and their key risk factors. These were developed on the basis of a global assessment of the burden
of NCD and projections for the future (14,15). The NCD indicators and targets of GMF (5) and Health
4
2020 (7) have been aligned, with adjustments made for their cut-off dates, namely 2020 and 2025,
respectively (9).
2.3 Methodology
The study included an analysis of the existing NCD monitoring frameworks to produce:
1. a comparative overview of the NCD indicators and their definitions included three principal
indicator systems relevant to EU28 and EFTA Member States (ECHIM (10)) and WHO (Health
2020 (5) and GMF (7)), taking age group, diagnostics, exposures, and other health-system
categories into consideration;
2. an overview of databases and data sources in EU28 and EFTA Member States that cover NCD
indicators;
3. a comparative analysis of data availability per indicator in selected databases.
The data for the analysis were derived from existing frameworks and databases with relevance for
NCD indicators.
With reference to the comparative analysis of data availability (point 3), taking the factors of
complete overlap, detailed specification of measurement, and specified causes of death into
account, we selected 67 NCD indicators related to the selected monitoring frameworks - GMF (27
indicators) (7) ECHIM (40 indicators) (10) and Health 2020 (7 indicators) (5) - for assessment of
availability. The analysis was based on a review of international health databases, such as Eurostat
(11), the European Health for All Database (HFA-DB) (16), the European Hospital Morbidity Database
(HM-DB) (17), the Global Health Observatory (GHO) (18), the Globocan database (19) of the
International Agency for Research on Cancer (IARC) and the WHO European Database on Nutrition,
Obesity and Physical Activity (NOPA) (20).
2.4 Results
The results achieved were:
1. a comparative overview of indicators and their definitions in EU, by NCD framework (GMF (7),
ECHIM (10) and Health 2020 (5)) in detailed form separated by age group, detailed diagnostic
information, exposure, and other health-system categories (Annex 1);
2. an overview of databases and data sources relative to the EU context with a detailed description
and links to their websites (Annex 2).
3. a comparative analysis of data availability in selected indicator systems, per indicator, including
an assessment of the NCD-related indicators of GMF (27 indicators) (7), ECHIM (40 indicators)
(10) and Health 2020 (7 indicators) (5) (Annex 3). Due to overlap between some of the indicators
in health 2020 and GMF overall there were 67 indicators analysed as can be seen in Fig. 1 .

5
Fig. 1. Indicator systems and number of selected indicators unique to NCD
2.5 Discussion of results
2.5.1 Comparative overview of NCD indicators and indicator definitions in three principal
indicator systems with relevance for EU28 and EFTA Member States
The indicator systems described in Chapter 2.2 (Background) have defined several indicators related
to NCD outcomes, risk factors and health-system response. These indicator definitions were based
mainly on available data. For example, the ECHI shortlist on self-reported NCD morbidity and risk
factors (3) was based on the European Health Interview Survey (EHIS) questionnaires (21,); the
development of the definitions of indicators included in the ECHI shortlist (3) and problems related
to availability of sources and/or alternative sources are described in the final reports on joint action
for ECHIM, parts I, II, and III (22, 23, 24) as well as in Evaluation of the use and impact of the
European Community health indicators, ECHI, by Member States – final report (25). The first wave of
EHIS was conducted in 2006-2009 on a voluntary basis in 17 EU countries3 (Annex 2) (26). The
second wave started in 2014 and is expected to greatly improve data availability in all EU Member
States. However, it is not clear whether the EHIS will continue after 2014. If not, a possible means of
increasing efficiency in this area would be for other surveys (for example, the EU Labour Force
Survey or the EU Survey of Income and Living Conditions) to incorporate some of the EHIS modules.
In terms of NCD morbidity, both the ECHI shortlist (3) and GMF (7) have indicators for site-specific
cancer incidence. The ECHI shortlist (3) also has indicators for in-patient hospital discharge relating
to several NCD diagnoses. Collecting morbidity statistics is a highly complex endeavour. Eurostat (11)
has conducted pilot data-collection exercises to determine the feasibility of identifying challenges
involved in gathering such data from multiple sources (including insurance- and register-based data)
at the EU level (27). However, register-based data - other than those for cancer - are not currently
available in international databases.
Indicators overlap substantially across systems and their definitions vary. All three systems selected
for analysis have NCD-mortality indicators; the ECHI shortlist (3) and Health 2020 (5) both specify
cause-specific mortality rates as indicators, whereas GMF (7) specifies combined premature NCD
mortality. The ECHI shortlist (3) and GMF (7) specify data disaggregated by sex, age, and
3 2006: Austria, Estonia; 2007: Slovenia; 2008: Belgium, Bulgaria, Cyprus, Czech Republic, France, Latvia, Malta,
Romania; 2009: Germany, Greece, Hungary, Poland, Slovakia, Spain.

6
sociodemographic variables; however, this is not possible in all cases. Age-standardization may not
reveal important time trends, and age-stratified data might be more useful for specific interventions.
It is quite difficult to standardize data on sociodemographic variables across countries.
As far as risk factors are concerned, all indicator systems name overweight/obesity, tobacco use and
alcohol consumption as risk factors related to NCD. However, age ranges and measurement types
may differ. Indicators related to alcohol consumption, for example, may vary depending on whether
the data are based on surveys or modelled estimation. On the other hand, indicators related to
obesity might be underestimated if self-reported data are used. In addition, the ECHI shortlist (3)
and GMF indicators (7) for low fruit and vegetable consumption consider different thresholds,
namely “eating fruits and vegetables (separately) at least once a day” and “400 g of fruits or
vegetables per day”, respectively. This is one example of the limitations of the methodologies used,
which do not allow a full comparison of indicators across all databases. The ECHI shortlist (3) and
GMF (8) also include raised blood pressure and diabetes as risk factors for NCD.
The ECHI shortlist (3) does not specify age-standardization for behavioural, biological, or nutritional
risk factors (alcohol consumption, tobacco consumption, physical inactivity, overweight and obesity,
self-reported blood pressure, self-reported diabetes, low levels of fruit and vegetable consumption).
Both Health 2020 and GMF (5,7) specify age-standardized indicators that are usually based on the
WHO world standard population.
GMF (8) calls for further national policies on reducing the NCD burden caused by unhealthy foods,
such as saturated fatty acids and partially hydrogenated vegetable oils, and on marketing to
children. The ECHI shortlist (3) widens the scope of use of medicines for NCD by including medication
for all major NCD in the relevant policy indicator. Table 1 gives an overview of the indicator
definitions with a complete overlap between indicator systems and of those that differ between
them.
Table 1. Overview of indicators whose definitions completely overlap, or differ, between indicator systems
NCD indicators whose definitions completely overlap
between indicator systems
NCD indicators whose definitions differ between
indicators systems
Adult per capita alcohol consumption (ECHI (3), Health
2020 (5), GMF (7))
Overall and site-specific cancer incidence (ECHI (3), GMF
(7))
Current tobacco use (Health 2020, (5), GMF (7))
Overweight and obesity (Health 2020 (5), GMF (7))
Hepatitis B vaccination (ECHI (3), GMF (7))
NCD mortality (ECHI (3), GMF (7))
Alcohol-related mortality (ECHI (3), GMF (7))
Tobacco consumption (ECHI (3), GMF (7))
Overweight/obesity (ECHI (3), GMF (7))
Blood pressure(ECHI (3), GMF (7))
Diabetes (ECHI (3), GMF (7))
Cervical-cancer screening (ECHI (3), GMF (7))
Episodic heavy drinking (ECHI (3), GMF (7))
Physical activity (ECHI (3), GMF (7))
Fruit and vegetable consumption(ECHI (3), GMF (7))
Policy indicators (ECHI (3), GMF (7))

7
2.5.2 Overview of available databases covering NCD indicators in EU28 and EFTA Member States
Eurostat (11) is the main source of the data for the ECHIM projects (10) while GHO (17) is that for
the indicators listed in GMF (7). While Eurostat (11) provides several indicators stratified by age and
sociodemographic factors, these do not cover all EU28 and EFTA Member States countries. On the
other hand, even if the databases did cover all of the countries, they may not provide detailed
enough data to fulfil indicator requirements or to enable action to be planned towards reaching the
GMF targets for NCD reduction (7). Both Eurostat (11) and GHO (18) may use data from other
databases, such as Globocan (19) (for cancer data) or the WHO European Information System on
Alcohol and Health (EISAH) (28) (for alcohol data, see Annexes 2 and 3). It is not possible to make a
direct comparison of age-standardized rates in EU and WHO databases because they use different
reference populations, namely the European standard population and the world standard
population, respectively. Data are as good as they are supplied by the countries. There are gaps in
data availability (Annex 3), and data need to be made comparable via estimation in some cases. For
example, the levels of quality and coverage of the data in Globocan (19) vary, ranging from high-
quality data on cancer incidence from registries covering more than 50% of the population to no
data at all (Annex 2, Table 1).
Table 2 compares features of two of the main European databases, Eurostat (11) and GHO (18) that
cover NCD indicators.
Table 2 Features of two main European databases holding NCD indicators
Eurostat GHO
Good detailed data by age and
sociodemographic characteristics
Cause-specific mortality and morbidity
Participation of 17 countries in first wave (2008–
09)
Participation of all EU countries mandatory in
second wave (2014]–15)
Not always stratified by sex
No sociodemographic data
Overall premature NCD mortality
Data available for most EU28 and EFTA countries
(sometimes estimated)
Does not always meet definition of NCD
indicator system
2.5.3 Comparative analysis of data availability per indicator in selected databases
2.5.3.1 Frequency of database updates
As can be seen from the overview of data available in countries, the most recent are from 2012. The
frequency and completeness of data updates present a twofold challenge. Firstly, in order to be
included in an international database, the presence of data at the national level is not enough; they
must be submitted within the timeline specified by the database. Thus, although more recent data
may exist in many countries, they might not necessarily have been included in the update of the
relevant international database. Secondly, the different international databases conduct updates at
different intervals and their timelines for the submission of national data vary. For example, HFA-DB
8
(16) is updated every six months; missing the deadline for submission of national data would create
a one-year time lag. A more integrated approach to data collection and submission could alleviate
this situation.
2.5.3.2 Age groups
There is a discrepancy between the indicator definition of “adult population” and data availability in
several databases. GMF (7) specifies “adult population” as people of 18 years or older; however,
most other databases define “adult population” as people of 15 years or older, or only have data on
populations over 20 or 25 years of age. While risk-factor data are age-standardized in GHO (18),
survey data from EHIS (21) as displayed in Eurostat (11) are not standardized but available for
various age groups.
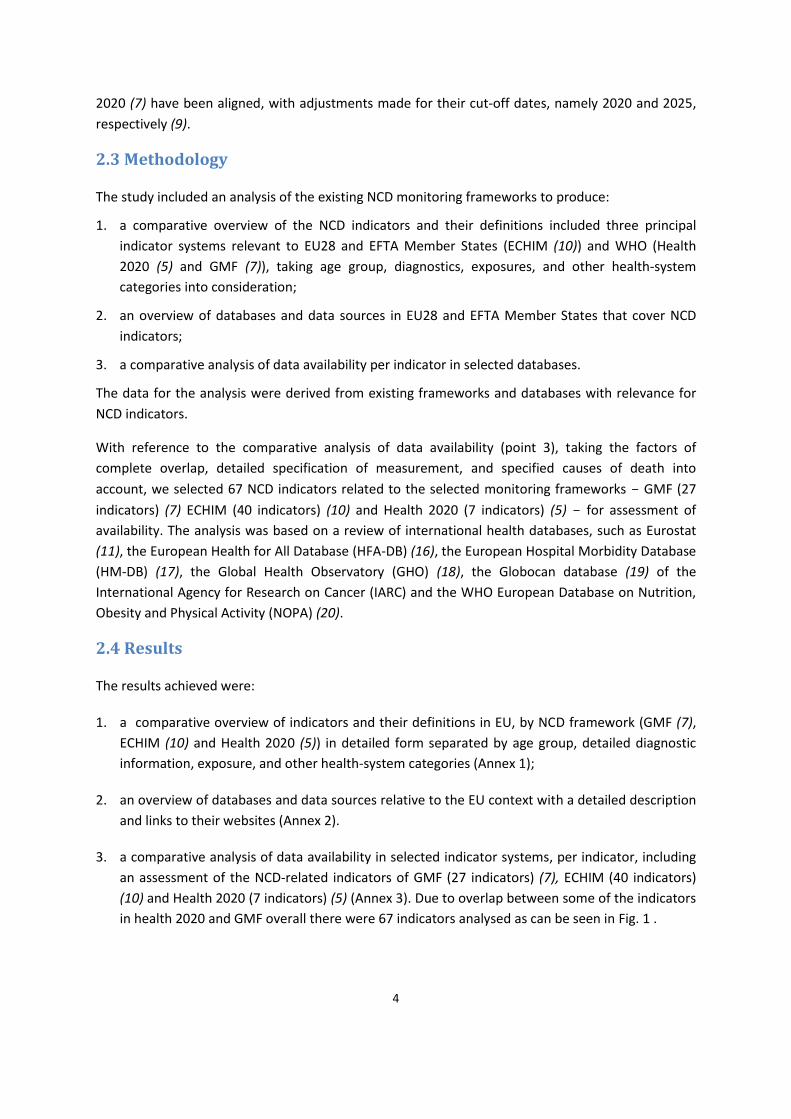
Table 3 shows the indicators where age-categorization in the database (shown in brackets) is not
according to the definition of the indicator system.
Table 3. Indicators where age-categorization in database differs from definition of indicator system
Indicator Database
Premature NCD mortality Health 2020 (5)
Current tobacco use Health 2020 (5), GMF (7)
Physical inactivity GMF (7)
Raised blood glucose/diabetes GMF (7)
Raised and mean blood pressure GMF (7)
Raised and mean cholesterol GMF (7)
Overweight/obesity, adults Health 2020 (5), GMF (7)
2.5.3.3 NCD mortality and morbidity
With regard to NCD mortality, Eurostat (11) has detailed mortality data available as specified in the
ECHI shortlist (3), whereas GMF (7) specifies premature NCD mortality of all major NCD combined.
Data availability for NCD mortality outcomes is good; more than 75% are available across databases
and EU28 and EFTA countries. Eurostat (11) has data for the indicator, “inpatient hospital discharges
per 100 000 population (not age-standardized)”, as specified in the ECHI shortlist (3), and similar
data exist in HMDB (17). However, data from HMDB (17)(age-standardized admission rates, in-
patients per 1000 population, number of discharges) are not mentioned explicitly in any of the three
indicator systems.
2.5.3.4 Definition of risk-factor exposure

9
The ECHI shortlist (3) specifies low thresholds for the intake of fruits and vegetables separately
(consumption at least once a day); in contrast, GMF (7) specifies a low threshold for fruit and
vegetable intake combined (less than 5 servings per day), that is, a specific amount per day:
ECHI (3): proportion of people reporting to eat fruits (excluding juice) at least once a day (15–24, 25–
64, 65+ years);
GMF (7): age-standardized prevalence of persons aged 18+ years consuming less than five total
servings (400 grams) of fruits and vegetables per day.
The ECHI (3) and GMF (7) definitions of risk-factor exposure relevant to alcohol-related mortality,
tobacco consumption, physical activity, blood pressure and diabetes are as follows.
Alcohol-related mortality
ECHI (3): death rates from combined, selected causes of death which are related to alcohol use in
people aged 15+, per 100,000.
GMF (7): alcohol-related mortality among adults (15+) according to ICD-10 codes:F10.1 – harmful
use of alcohol; F10.2 – alcohol dependence) during a given calendar year.
Tobacco consumption
ECHI (3): proportion of people reporting to smoke cigarettes daily (15–24, 25–64, 65+ years).
GMF (7): age-standardized prevalence of current tobacco use (includes daily, non-daily, or occasional
use) among persons aged 18+ years.
Physical activity
ECHI (3): proportion of inactive individuals (precise operationalization to be formulated, 15–64, 65+
years).
GMF (7): adolescents: 60 minutes of moderate to vigorous-intensity activity per day; adults (18+):
150 minutes of moderate-intensity activity per week.
Blood pressure
ECHI (3): proportion of individuals reporting to have been diagnosed with high blood pressure, which
occurred during the past 12 months (25–64, 65+ years) currently self-reported (EHIS (21)), in future
measured (European Health Examination Survey (EHES) (29)).
GMF (7): age-standardized prevalence of raised blood pressure among persons aged 18+ years (must
be measured, not self-reported).
Diabetes
ECHI (3): self-reported prevalence of ever having been diagnosed with diabetes and having been
affected by this condition during the past 12 months (15–64, 65+ years).
GMF (7): age-standardized prevalence of raised blood glucose/diabetes among persons aged 18+
years (must be measured, not self-reported) or on medication for raised blood glucose.

10
2.5.3.5 Indicator definition
It is striking that, during the course of the ECHI project (1), it was suggested that measured data be
collected through EHES (piloted in 2010-2011) (29) in addition to the self-reported data being
collected through EHIS (21). It was also proposed that GMF (7) focus on measuring risk factors, such
as overweight, obesity and blood pressure. Although this would lead to better information, it would
also mean that there would be fewer measurements, costs would be higher, and that the availability
of data on these indicators for every country on an annual basis could not be guaranteed. On the
other hand, self-reported survey data on these issues would be less reliable as they may be
differential by age and gender, but whether they would be less comparable over time and between
countries could be argued. Several NCD risk factors in Eurostat (11), such as overweight and obesity
(body mass index) and blood pressure rely on self-reported data.
2.5.3.6 National systems response
With regard to data from national health-surveillance systems, a few are available that partially
comply with the indicator definitions proposed in GMF (7). Data on the general availability of NCD
medicines, drug therapy and counselling (to prevent heart attacks and stroke) are available in the
WHO report entitled, Assessing national capacity for the prevention and control of
noncommunicable diseases. Report of the 2010 global survey (30), but data on affordability are not.
However, data on most of the indicators in GMF (7) relating to national health-system response are
not available in sufficient quality in international databases at this time.
Common problems across indicator systems are related to:
definitions of the same indicators sometimes differ widely;
data for cause of death depend on quality of data collected at country level and subsequent
processes;
overlap (for example, tobacco consumption: any vs daily);
measurement issues (self-reporting vs diagnosis/clinical measurement);
age categories (15+ vs 18+ years) (broad age categories vs age-standardization);
noncomparability ofdata between databasese (standard populations vary).
2.5.3.5 Reporting requirement
It is worth noting that some countries of the WHO European Region, particularly those with
populations of less than 1 million, frequently find it challenging to comply with the data-reporting
requirements of international organizations, often because of insufficient human and technical
capacity and resources. Representatives of these countries met for the first high-level meeting of
small countries, held in San Marina in July 2014 under the auspices of the WHO Regional Office for
Europe, to review the situation and agree on a course of action to improve it (31).
11
Chapter 3. Report on creation of a pilot data set for NCD surveillance
in Europe
3.1 Introduction
As could be seen from the comparative analysis on data availability per indicator in Chapter 2, there
are various discrepancies in the definitions of indicators, the age ranges used for each indicator, and
the availability of data per country. For the purpose of a real-time demonstration of the possibilities
of integrating various indicators and databases for the comprehensive surveillance of NCD in EU28
and EFTA Member States, a pilot data set was compiled from existing data sources to investigate the
feasibility of establishing a core data set for NCD surveillance in Europe. It was discussed with
Member States’ representatives and experts during a web-based consultation and face-to-face
meetings in December 2014, the results of which have informed the recommendations of the iNCD
project.
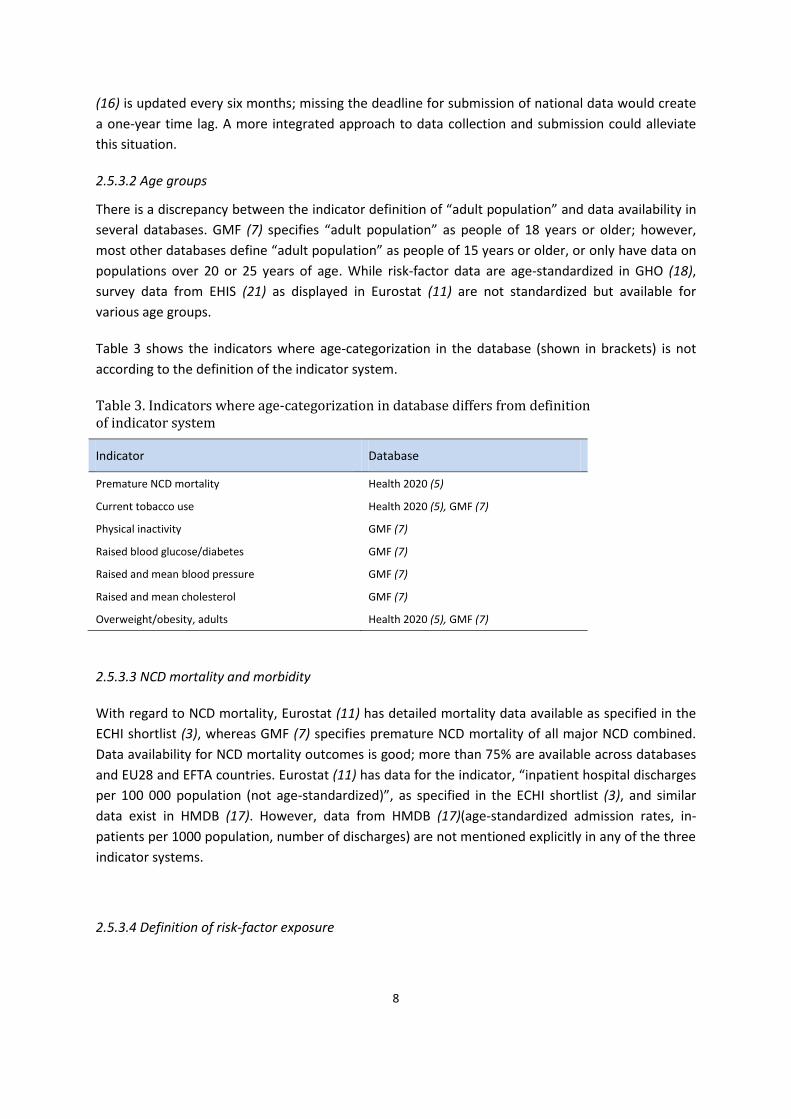
3.2 Methodology
Seven indicators were used to create a pilot data set to demonstrate the availability of data in the
EU28 and EFTA Member States (Table 4).
Table 4. Availability of data relative to seven indictors in EU28 and EFTA Member States
Indicators Latest year available
Source of indicator
1. Probability (%) of dying prematurely from NCD 2012 GHO database (18)
2. Age-standardized NCD mortality per 100 000 population
2012 GHO database (18)
3. Obesity (%), adults (18+ years, not age-standardized) 2008 Eurostat (11)
4. Obesity (%), adults (20+ years, age-standardized) 2008 GHO database (18)
5. Adult per capita alcohol consumption in litres of pure alcohol per year (APC) (15+ years)
2008-2010 (average)
WHO-EISAH (28)
6. Tobacco consumption (%), adults (not age-standardized, daily cigarette smoking) (18+ years)
2008 Eurostat (11)
7. Tobacco use (%), age-standardized rate of smoking of any tobacco product (15+ years)
2011 GHO database (7)
The values for each indicator were extracted from relevant databases. The numbering of the
indicators in the pilot data set is also used in the comparative analysis of data availability per
indicator (Annex 3) for ease of reference.
12
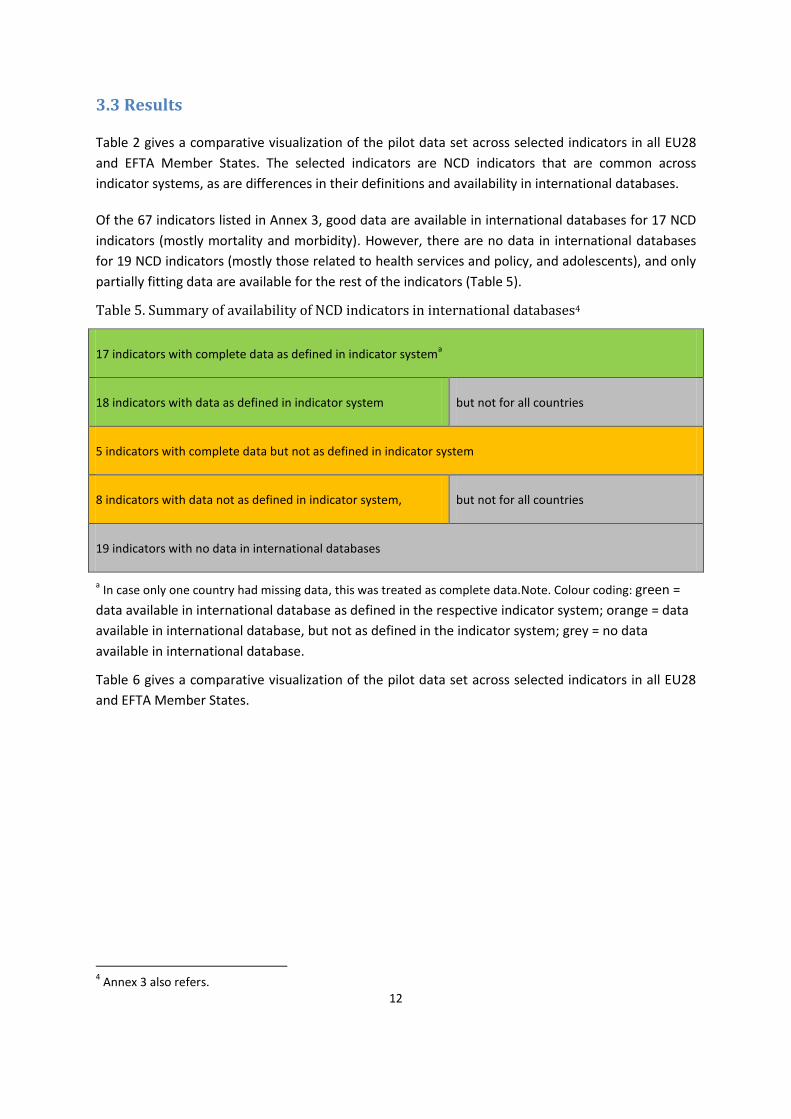
3.3 Results
Table 2 gives a comparative visualization of the pilot data set across selected indicators in all EU28
and EFTA Member States. The selected indicators are NCD indicators that are common across
indicator systems, as are differences in their definitions and availability in international databases.
Of the 67 indicators listed in Annex 3, good data are available in international databases for 17 NCD
indicators (mostly mortality and morbidity). However, there are no data in international databases
for 19 NCD indicators (mostly those related to health services and policy, and adolescents), and only
partially fitting data are available for the rest of the indicators (Table 5).
Table 5. Summary of availability of NCD indicators in international databases4
17 indicators with complete data as defined in indicator systema
18 indicators with data as defined in indicator system but not for all countries
5 indicators with complete data but not as defined in indicator system
8 indicators with data not as defined in indicator system, but not for all countries
19 indicators with no data in international databases
a In case only one country had missing data, this was treated as complete data.Note. Colour coding: green =
data available in international database as defined in the respective indicator system; orange = data
available in international database, but not as defined in the indicator system; grey = no data
available in international database.
Table 6 gives a comparative visualization of the pilot data set across selected indicators in all EU28
and EFTA Member States.
4 Annex 3 also refers.

13
Table 6. Pilot data set
Database GHO GHO Eurostat GHO WHO-EISAH Eurostat GHO
Indicator no.a 1 2 41 43 20 26 27
Indicator definition in database
Probability (%) of dying prematurely from NCD (2012)b
Age-standardized NCD mortality per 100 000 (2012)c
Obesity (%), adults (not age-standardized, 18+ years) (2008) d
Obesity (%), adults (age-standardized, 20+ years) (2008) b,c
(APC)e(15+ years, average) (2008-2010)b,c,d
Tobacco consumption(%), adults (not age-standardized, daily cigarette smoking,18+ years (2008)d
Tobacco consumption (%), age-standardized rate of current smoking any tobacco product (15+ years) (2011)b,c
Stratification Both sexes
Wo
men
Men
ISC
ED
0-2
ISC
ED
3-4
ISC
ED
5-6
Both sexes Both sexes
Tota
lf
Firs
t
qu
inti
le
Fift
h
qu
inti
le
Both sexes
Country
Austria 12 288 448 18.5 11.3 10.5 18.3 10.3 23.0 21.1 22.0 46
Belgium 12 283 449 19.2 14 8.6 19.1 11.0 19.4 28.0 15.6 27
Bulgaria 24 499 813 12.3 11.6 9.7 21.4 11.4 19.4 17.6 36.8 39
Croatia 18 376 656 - - - 21.3 12.2 - - - 33
Cyprus 9 279 390 22.2 12.8 10.8 23.4 9.2 26.9 18.7 25.1 30
Czech Republic 17 362 590 24.7 18.4 11.4 28.7 13.0 24.9 24.4 23.6 36
Denmark 13 342 481 - - - 16.2 11.4 - - - 29
Estonia 19 358 752 21.2 18.2 13.9 18.9 10.3 26.4 17.5 28.9 31
Finland 11 285 468 - - - 19.9 12.3 - - - 24
France 11 235 413 17.7 11 6.4 15.6 12.2 - - - 36
Germany 12 295 448 19.9 16.1 11.4 21.3 11.8 22.8 25.4 19.8 30

14
Greece 13 285 459 23.0 15.5 11.4 17.5 10.3 32.7 18.7 32.8 40
Hungary 24 459 808 25.8 19.1 15.0 24.8 13.3 26.4 29.6 20.4 31
Ireland 11 287 415 - - - 24.5 11.9 - - - -
Iceland 10 289 338 - - - 21.9 7.1 - - - 19
Italy 10 243 382 - - - 17.2 6.7 - - - 25
Latvia 24 459 896 18.4 17.1 14.8 22.0 12.3 28.8 52.0 22.7 32
Lichtenstein - - - - - - - - - - - -
Lithuania 22 411 848 - - - 24.7 15.4 - - - 33
Luxembourg 11 262 389 - - - 23.4 11.9 - - - -
Malta 12 307 435 30.5 20.3 17.6 26.6 7.0 19.5 20.8 20.5 25
Netherlands 12 302 424 - - - 16.2 9.9 - - - 26
Norway 11 282 404 - - - 19.8 7.7 - - - 27
Poland 20 367 668 21.3 16.7 10.4 23.2 12.5 24.7 27.3 22.0 32
Portugal 12 255 456 - - - 21.6 12.9 - - - 22
Romania 23 473 786 7.8 8.2 6.1 17.7 14.4 21.4 18.5 33.6 28
Sweden 10 286 390 - - - 16.6 9.2 - - - 24
Slovenia 13 277 488 23.8 16.9 7.3 - 11.6 19.2 17.6 19.1 24
Slovakia 19 402 713 23.6 15.2 9.6 - 13.0 19.9 18.0 19.0 29
Spain 11 240 426 21.1 10.6 9.4 24.1 11.2 25.5 22.3 24.3 30
Switzerland 9 238 360 - - - 14.9 10.7 - - - 26
United Kingdom
12 302 426 - - - 24.9 11.6 - - - 22
Data available as defined. No data available in international database. Data available but not as defined.

15
Notes. a
The numbering of the indicators is the same as that used in the comparative analysis of data availability per indicator (Annex 3) for ease of reference. b GMF indicator.
c Health 2020
indicator. d
ECHI. e
APC= ambulatory payment classification: adult per capita alcohol consumption in litres of pure alcohol per year. f
Income quintiles, computed by grouping the answer categories of the IN04 variable of the EHIS questionnaire (21).
ISCED = International Standard Classification of Education (levels 0-2: pre-primary, primary and lower secondary education; levels 3-4: upper secondary and post-secondary non-tertiary
education; levels 5-6: first and second stages of tertiary education) (32).

16
3.4 Discussion of results
As can be seen, the most important NCD outcome indicators (NCD premature and age-standardized
mortality) are well covered in existing databases. However, the stark differences by sex in NCD
mortality are not captured by the GMF indicator for premature NCD mortality as available in GHO
(18) because NCD mortality is not stratified by sex. Mortality data disaggregated by sex can be
calculated using mortality indicators and existing sociodemographic data.
Sex-specific and age-standardized NCD-mortality rates as specified in ECHI (1) are available in
Eurostat (11). Data for sex-specific age-standardized CVD and diabetes mortality, as well as chronic
respiratory disease mortality, are available in GHO (18).
The two selected indicators for obesity show that stratification by sociodemographic indicators
provides detailed data, which are valuable in identifying targets for intervention; however, such data
are not available for all EU28 and EFTA Member States. While all but three of these countries are
covered by the GMF indicator for obesity in the GHO database (18), the definition varies slightly
across the countries in terms of the age ranges covered. This indicator is also available stratified by
sex. It should be noted that the obesity indicators displayed in Table 3 are comparable within each
database, but not across databases because of differences in standardization. Furthermore,
socioeconomic variables may change over time within countries and the full extent of these
variables may not be captured by a (relatively) simple stratification of age-standardized rates.
Two of the best examples of well-matched indicators in terms of definition and availability are that
of alcohol and tobacco consumption and associated harms. Several indicators are provided by the
WHO European Information System on Alcohol and Health (WHO-EISAH) (28) to different databases;
these include adult per capita consumption, recorded and unrecorded consumption, tourist
consumption, and several estimates of disease burden. GHO (18) and Eurostat (11) also have data
available on several indicators related to tobacco consumption, but complete data across indicator
systems for several NCD risk factors are currently missing.
The results of this assessment show that, in most cases, some data are available for EU28 and EFTA
Member States. However, there is room for improvement with respect to indicators measuring
alcohol and tobacco consumption and several other NCD risk factors both in terms of meeting
definition requirements and of availability across Europe. Harmonization of the indicators will
require the international organizations involved to achieve the overall goal of the iNCD project to
improve the quality of health information for NCD surveillance, which includes taking concerted
action to review collection instruments and procedures for processing and disseminating the data.
Conclusions Conclusions relate to indicator definitions across indicator systems and their availability in international databases.
There is some overlap across indicator systems; however, specific definitions vary.

17
Collecting morbidity and risk-factor data is challenging and indicator definitions and available data do not match in some cases.
Some countries have better systems, but the data are not always comparable.
NCD mortality indicators are well covered, but the quality of the data depends on collection and subsequent processes at the country level.
Alcohol and tobacco consumption are well covered, but indicator definitions vary between systems.
Nutritional risk-factor data are poor at the moment (few countries have survey data; often only aggregated country-level data exist).
Data for adolescents are sparse.
Health-services and policy data are sparse.
Indicators for NCD-related health services and policies need much more development.
Systematic and harmonized register-based data and surveys would dramatically improve the comparability of NCD morbidity and risk-factor prevalence across countries.

18
Chapter 4. Report on examples of national good practice in health-
monitoring systems
4.1 Introduction
This chapter presents national good practice in the field of integrated NCD monitoring and
surveillance within and outside EU. According to the Action plan for implementation of the European
Strategy for the Prevention and Control of Noncommunicable Diseases 2012–2016, “surveillance
data are crucial for developing targeted action, monitoring progress and success in counteracting
NCD, and informing and evaluating strategies and policies” and “action to this end should be tailored
to the needs of countries and coordinated at the international level through common protocols,
indicator definitions, analytical tools and databases that allow for international trend comparisons”.
It also stresses that “the monitoring and evaluation of NCDs and [their] risk factors has to be
integrated into general health information systems to support linkages and sustainability and to
allow longer-term measurement of impact of the impact, and distribution of the impact, of
interventions on NCDs” (33).
The chapter presents examples of the implementation of 12 national integrated monitoring systems,
including the regular collection and evaluation of measured data, which play a crucial role in
informing policy development.
4.2 Methodology
Based on a review of relevant literature and evidence (34,35,36), for health monitoring to be defined
as good practice the following attributes should be involved:
timeliness;
disaggregation of data;
involvement of trends data;
diversity of content;
efficiency;
trustworthiness;
comparability;
credibility;
affordability;
sustainability;
application to policy.
On the basis of these criteria, a number of good practices in health monitoring within and outside EU
were identified. These are presented in the form of case studies. Lessons learnt are indicated in each
case. Examples submitted by several EU28 and EFTA Member States during the web-consultation in
December 2014 are also included.

19
4.3 Examples of good practice in health monitoring in EU and EFTA
countries
4.3.1 Denmark: elimination of trans-fatty acids in food products
Nutritional factors have an important influence on the development of NCD, especially CVD and
diabetes. The situation is exacerbated when food products contain components with no known
nutritional benefit, such as trans-fatty acids (TFA).
In Denmark, according to a regulation passed in January 2004, the content of TFA in food products
may not exceed 2 g per 100g of edible oils and fats. Pre-intervention surveys showed a TFA content
of up to 60g per 100 fats in certain foods (fast-food products, confectionery, margarines and
shortenings). Since the introduction of the regulation, biennial surveys of TFA content in food
samples have been conducted and population consumption estimated (post-intervention
monitoring). The data collected were disaggregated according to food groups, and age and gender of
consumers. The regulation resulted in a decline in the number of products containing more than 2g
of TFA from 26% in 2002 to 6% in 2013, showing that the elimination of TFA in food products is
achievable through food reformulation (37).
Analysis of good practice
Introducing a regulation on TFA content in food products, monitoring its implementation and using
the results to inform policy and practice on its impact, as done in Denmark, is a good example of
how to address the alimentary risk factors for NCD. Monitoring was conducted regularly (biennially)
and the results were disaggregated by several characteristics (food groups, age and gender) and
applied to policy. Thus, this action can be identified as good practice in the area of NCD.
4.3.2 Finland: reduction of salt intake
As excessive salt consumption is one of the main behavioural risk factors for NCD, monitoring
progress in reducing it is an important strategy. The relative reduction of salt intake by 30% is one of
the 9 voluntary global targets included in GMF of the Global action plan for the prevention and
control of noncommunicable diseases, 2013-2020 (7,38).
Finland has a long history of developing strategies for reducing salt intake, dating as far back as 1970
when the first salt-reduction initiatives were part of the North Karelia project. In 2008-2011, the
Government developed regulations to decrease salt content in industry-produced foods, according
to which, foods with high salt content had to be labelled “high-in-salt” to inform consumer choice.
As a result of the regulations, industry has worked to reformulate products so that their salt levels
are below the threshold requiring the “high-in-salt” warning. Since 1982, the salt intake in Finland
has been monitored through the FINDIET survey (as part of the national FINRISK study (39)), using
food diaries and dietary recalls validated in certain years (1982, 2002, 2007) with sodium-excretion
data resulting from 24-hour urine collection. In 2007, the salt intake in women was 7.0 g/day and in
men 8.3 g/day – much higher than the 5 g/day recommended by WHO. However, salt intake in
Finland has declined remarkably since 1982 when it was about 10 g/day in women and 13 g/day in
men. People’s awareness about food labelling and food choices have also been monitored by the
Health Behavior Among Adult Population survey (the Finnish data source for the FINBALT health
20
monitoring system), which is conducted annually. The impact of the regulations was also monitored
through other monitoring initiatives: the Finnish Food and Drink Industries’ Federation and the
Finnish Grocery Trade Association gathered and monitored information about food reformulation
and food products on the market, and consumer surveys were carried out. These initiatives have
shown that the salt content in bread, meat products, cheeses and ready-made meals has decreased
by 20-25%.
Analysis of good practice
The importance of benchmarking the impact of regulations, not only on the population but also on
industry, cannot be underestimated. The Finnish case is an example good practice in intersectoral
collaboration and continuous population monitoring: baseline assessment followed by regular
monitoring at 5-year intervals, and the integration of the monitoring systems involved (FINRISK (39))
meets the criteria of good practice in health monitoring described under 4.2 (Methodology) above.
Another important characteristic of this monitoring practice is that its methods of surveillance are
more objective; for example, population samples are representative and sodium-excretion
measurement surveys are included.
4.3.3 Finland: using GMF goals and indicators to develop a national public health
programme5
The Finnish public health programme, “Health 2015”, was initiated in 2001 as a Government
resolution. Based on the WHO health-for-all policy, Health 21 (1998), it includes long-term health-
policy targets for a 15-year period. Its main aim was to improve people’s health and functional
capacity so that they could live longer active lives, and to reduce health differences among
population groups.
With the “Health 2015” programme drawing to an end, discussions on the development of the next
Finnish public health programme are underway in Finland. While the scope of such a programme
includes more than only NCD, the work was initiated by evaluating the current situation in the light
of the 9 global voluntary targets and 25 indicators defined in GMF (7) of the WHO global action plan
for the prevention and control of NCD (38). Data from the existing national health-monitoring system
in Finland, including those collected through population-based health surveys and national health
registers, were used to study past trends and the current situation. In addition, predictions of
development to 2025 have been made for each of the global voluntary targets. These analyses will
enable the development of national public health policy, including that on NCD prevention, with a
focus on specific national needs and circumstances. National modifications of the voluntary global
targets can result in surpassing the aspirations of GMF (7,40).
4.3.4 Italy: Italian behavioural risk factor surveillance system (PASSI)
To effectively influence decision-making on public health policy, the prevalence of behavioural risk
factors and NCD in the general population must be monitored. It is also important that monitoring
systems to this end be disaggregated by smaller geographical units within the country to enable the
identification of regional disparities. In 2007, Italy established PASSI, a surveillance system to 5 Source: Department of Chronic Disease Prevention, National Institute for Health and Welfare of Finland,
unpublished data, 2014.

21
monitor health behaviour and associated risk factors, which guides health-promotion and disease-
prevention interventions, also at the local level (41).
PASSI (41) is an ongoing, multipurpose, community surveillance system. It is supported by the
Ministry of Health, coordinated by the National Institute of Health (ISS) and run by the local health
units and regional health authorities. Its main areas of investigation are: self-perceived health and
quality of life; self-reported symptoms of depression; smoking habits and exposure to second-hand
smoke; alcohol consumption; diet and nutritional status; physical activity; risk factors for CVD;
cancer screening and vaccination campaigns (through participation in national preventive
programmes); road safety; and domestic injuries. Telephone-based interviews are conducted on a
monthly basis in a representative sample of noninstitutionalized adults aged 18-69 years from all
regions of Italy, providing prevalence estimates for the main behavioural risk factors for chronic
diseases and information about adherence to preventive measures and access to preventive
services, which allows the evaluation of geographic differences and time trends. Sociodemographic
variables are also recorded. Data is encrypted and transmitted via the Internet to a common national
database. No personal identifiers appear in the database. Data quality is routinely monitored and
action, such as the analysis and dissemination of results and networking, is centrally supervised.
Interviews are carried out by nurses of the local health services (perceived as being “close” to the
population). Though participation varies among the regions, participation is generally very high with
response rates of over 80%. To date, more than 250 000 interviews have been conducted, resulting
in a huge amount of information. These interviews have served both as an assessment tool and as a
basis for setting the health objectives of the Italian national prevention plan and the respective
regional plans.
Analysis of good practice
PASSI (41) meets several of the criteria of good practice: it provides ongoing data collection in a
flexible, timely manner, allowing intraregional, region-to-region and region-to-nation comparison,
and its regional-specific data, including sociodemographic information, offer a sound basis for
developing and evaluating public health programmes, including those aimed at reducing social
disparities by addressing health risks.
4.3.5 Malta: the creation of a diabetes information system
The Directorate for Health Information and Research (DHIR) of the Ministry of Health of Malta is the
reference point to which project leaders or policy-makers turn for the background information they
need for decision-making. This is clearly the result of a move in international health policy towards
more evidence-based medicine. Indeed, the timelines for drawing up policies and position papers
are typically short, leaving no time for ad hoc data collection. They call for readily available,
disaggregated, reliable data.
Health-information specialists in Malta have learnt how to make use of the opportunities presented
by their country’s small size: a relatively centralized system with access to case-based information
close to the clinical interface. Most of the health registers are housed in DHIR where each is headed
by a medical doctor. In addition, Malta has a unique identity-card system, which is used in the
administration of all matters related, for example, to health, social security and taxation. All of this
allows the different registers in Malta to collate data at a disaggregated level. Though data linkage is

22
technically easy, it is, nevertheless, still firmly regulated by the Data Protection Act of 2001.
Collaboration with the Data Protection Commission led to the development of a manual specifying
the conditions for collecting and processing personal data and storing them at DHIR, as well as for
linkage between data sources. Data linkage may only be carried out under the supervision of, if not
directly by, medical professionals.
The most recent policy document to be drawn up by the Maltese Government is the draft diabetes
strategy, which was launched for consultation on World Diabetes Day, 14 November 2014 (42).
Diabetes is a major problem in Malta, estimated to affect around 10% of Maltese adults. Therefore,
estimates of the burden of diabetes and its complications, including cost-benefit assessment, are
essential for planning new services. Since Malta has no formal diabetes register, data pertaining to
individuals registered for treatment free of charge were linked hospital-admissions data, the
surgical-operations register, and laboratory biochemical data. Following this exercise, all identifiers
other than year of birth and gender were dropped from the data set to anonymize the data. This
linked data set makes it possible to estimate the incidence of diabetic complications and the
indicators of quality of diabetes care as regards the extent and effectiveness of glucose and lipid
monitoring in the diabetic population.
Analysis of good practice
In an era when the sustainability of health systems is increasingly on the agenda, the very existence
of longstanding registers is being threatened. On the other hand, the demand for data is also
increasing and does not follow any traditional request patterns. Therefore, versatility is called for,
which requires the timely registration of disaggregated data that can be enhanced through the
secondary use of health-care data and secure linkages. The secondary use of health-care data is
passive, making it both affordable and sustainable. It is quite difficult for a health register to predict
the high-resolution data required and keep up with the breadth of information demanded by health
policy. Even if this were possible, it would be very resource intensive to maintain. Therefore,
integrating disaggregated data from health registers with secondary health-care-associated data sets
permits the same health registers to remain relevant to an ever-increasing, evidence-driven health-
polic0y agenda.
4.3.6 Netherlands: harmonization of the regional health surveys through the Dutch Public Health
Monitor6
In the Netherlands, all municipal health services collect data on health indicators on an annual basis
to support local policy processes. The indicators include self-reported health, chronic diseases,
physical disabilities, smoking, alcohol consumption, physical exercise, body height and weight,
loneliness, risk of depression and informal care to support local health policy. Simultaneously,
Statistics Netherlands conducts an annual survey among 13 000-16 000 respondents to determine
national figures and trends.
In the past, the municipal health services and Statistics Netherlands used surveys that often
duplicated the collection of the information. The Dutch National Institute for Public Health and the
6 Dutch National Institute for Public Health and the Environment (RIVM), unpublished data, 2014.

23
Environment (RIVM), Statistics Netherlands and the municipal health services have worked together
to harmonize the surveys to the extent possible. In 2012, this collaboration, which was coordinated
by RIVM, resulted in a standardized health survey – the Dutch Public Health Monitor - which has
since been used by all municipal health services and Statistics Netherlands to collect data at the
municipal and national levels, respectively. The first round of harmonized data collection took place
among a representative sample of the population of 19 years and older. The total database includes
over 387 000 respondents and is available at an integrated source. Currently, RIVM is working on a
process to harmonize the surveys for the population of under 19 years of age. The next round of
data collection involving adults is planned for 2016.
Analysis of good practice
The Dutch Public Health Monitor is a standardized method of countrywide data collection that
allows both the aggregation and disaggregation of data by various geographical units. Data collection
is integrated and the data collected are diverse, allowing comparison at the regional level. This
results in much more reliable data on which national figures on all topics can be based. The
representativeness of the data is ensured through large sample sizes in all municipalities. Finally, the
results of the Dutch Public Health Monitor are widely applicable to policy. All in all, it is a national
example of good practice in health monitoring.
4.3.7 Norway: using registers and presentation systems to monitor NCD
As of January 2012, according to the National Public Health Act, Norwegian counties and
municipalities are obliged to collect data on health conditions and risk factors in the respective
territories. The data sets available in the two systems contain data on several of the 25 NCD
indicators included in GMF (7). They originate mainly from person-identifiable registers of
prescriptions, GP visits, hospitalization and causes of death; some of the data are collected through
surveys. The output is presented in the form of individual public health profiles for each of Norway’s
428 municipalities, based on data available in extensive online data banks.
The Norwegian Institute for Public Health (NIPH) maintains 10 of the 17 mandatory registers. Key
data are made available in the data banks, NorHealth and the Municipal Data Bank.
New versions of the public health profiles and the data in the Municipal Data Bank are made
available in January each year, allowing decision-makers at the municipal, regional and national
levels to compare selected indicators at relevant geographical levels (municipal and county) and
follow developments over time. The major goal of the National Public Health Act is to ensure
coordination of the efforts of the various municipalities, county authorities and central government
in the field of public health. In addition, data collection at the municipal and county levels makes it
possible to address regional differences and health inequalities. Fact sheets on specific diseases and
risk factors, written by journalists in cooperation with researchers, serve to inform decision-makers
with nonmedical backgrounds (43).

24
Analysis of good practice
The combination of quality registers and the health-information tools derived from them, adapted
for use by nonspecialists, promotes the 25 NCD indicators of GMF and other health indicators at the
level of public health decision-making for application to policy. Moreover, the registers make it
possible to follow the time trends of diverse sets of standardized indicators, and the methodology
used in data collection and storage allows aggregation and disaggregation of the data. The level of
privacy protection of these registers is another feature that qualifies them as an example of national
good practice.
4.3.8 Sweden: Västerbotten Intervention Programme
Risk-assessment strategies based on the evaluation of a composite score of individual behavioural
and biological risk factors are important in preventing NCD in populations at the highest risk.
However, the selection of a target population, individual interventions (in the form of counselling),
and subsequent follow-up have to be organized in a way that allows effective follow-up.
In Sweden, mortality from CVD increased steadily in the 20th century; in the mid-1980s it was
highest in the county of Västerbotten. Therefore, the Västerbotten Intervention Programme (VIP)
was launched – a community programme with the aim of reducing morbidity and mortality from
CVD and diabetes (44). VIP was developed in the small municipality of Norsjö in 1985 and
subsequently implemented across the county; it is now integrated into primary-care routines. A
population-based strategy directed towards the public is combined with a strategy for reaching all
middle-aged persons individually at ages 40, 50 and 60 years by inviting them to participate in
systematic risk-factor screening and individual counselling about healthy lifestyle habits. The target
population is identified through the link between the VIP database and the national population
register, “age” being the main selection criterion. Overall, VIP has conducted 113 203 health
examinations (6500–7000 examinations annually). Almost 27 000 people have participated twice.
Participation rates have ranged between 48% and 67%.
Assessment includes both subjective (for example, self-reported health) and objective
(anthropometric and laboratory) measurements. Outputs are presented in so-called ”star-profile”
form.7 They are analysed, and individual action plans and follow-up are suggested, using the
computerized decision-support system, EviBase, which was introduced in 2004. Assessment is made
at the PHC level, allowing immediate counselling and pharmacological intervention, if needed (44).
The data collected are stored in the VIP database and can easily be compared with follow-up
assessments and visualized in “star-profile”. VIP data are linked to other local, regional and national
registers and serve as a basis for interdisciplinary research, the investigation of various disease
outcomes, and the assessment of other demographic and socioeconomic conditions. Moreover, the
time-trend feature of the VIP database makes it possible to evaluate the predictive validity of risk
markers and the requirements for successful intervention in the field of NCD.
7 During the dialogue, a “star-profile” representing risk markers is drawn - the more risk indicators, the smaller
the points of the star. While none has a perfect nine-point star, this usefully illustrates the interrelationships between risk markers and behaviour, as well as options for health promotion (44).

25
Analysis of good practice
One of the main features of VIP is its ability to collect data on multiple NCD risk factors, making it a
diverse surveillance system. It also includes information on the time trends of the collected data and
allows data disaggregation by age, gender and socioeconomic features. Visualization of assessment
output and data collection at the PHC level make the system an example of good practice in this
area. Lastly, its links with other registers and availability for scientific research make VIP a desirable
NCD monitoring system.
4.3.9 United Kingdom of Great Britain and Northern Ireland: food marketing to children
Both ECHIM (3) and GMF (7) recommend policies on reducing the impact of marketing foods and
non-alcoholic beverages high in saturated fats, trans-fatty acids, free sugars or salt to children. The
adoption and implementation of such policies require thorough monitoring procedures to inform
and support both policy and practice.
In November 2006, the United Kingdom introduced a regulation on advertising products high in fat,
salt or sugar (HFSS) during children’s television airtime and around programmes with a
disproportionately high child audience. The regulation aimed to decrease marketing pressure on
children and subsequently decrease children’s consumption of HFSS products. The government
agency responsible for broadcast communications, Ofcom, monitored pre- and post-regulation
exposure to TV advertising of HFSS foods during the times in which the restrictions were applicable
and found that the regulation had resulted in a 37% decline in exposure during children’s airtime. Its
introduction has also changed the nature of the products being advertised on TV: between 2005 and
2009, the advertising of non-HFSS products increased from 22% to 33% (45).
Analysis of good practice
The above case study is an example of good practice in monitoring the impact of a policy
intervention on reducing a risk factor for NCD (food marketing to children). The monitoring system is
both timely and applicable to policy.
4.3.10 WHO European Childhood Obesity Surveillance Initiative (COSI) in EU Member States
It is important for countries to monitor the prevalence of biological risk factors for NCD, such as
overweight and obesity, especially in children, as this will define the future trends and prospects of
NCD. The significance of such surveillance in enhancing the prevention and control of NCD is
highlighted in the Vienna Declaration on Nutrition and Noncommunicable Diseases in the Context of
Health 2020 (46), which was endorsed in September 2013 at the sixty-third session of the WHO
Regional Committee for Europe. The establishment of COSI (47) in 2007 saw the start of regular
population-based monitoring of overweight and obesity in primary-school children in the WHO
European Region and currently involves 17 EU Member States. The initiative has been co-funded by
the European Commission since December 2013.
The initiative aims to measure trends in overweight and obesity in primary-school children (6-9
years) on a routine basis in order to understand the progress of the epidemic in this population
group and to permit intercountry comparison within the WHO European Region. The first round of
data collection took place during the school year 2007-2008 with the participation of 14 countries

26
(Belgium (Flemish region), Bulgaria, Cyprus, the Czech Republic, Ireland, Italy, Latvia, Lithuania,
Malta, Norway, Portugal, Slovenia, Sweden and the United Kingdom (Wales)). The prevalence of
overweight (including obesity) ranged from 19% to 49 % among boys and from 18% to 43% among
girls, while the prevalence of obesity ranged from 6% to 27% among boys and from 5% to 17%
among girls. Furthermore, multicountry comparisons suggested the presence of a north-south
gradient with the highest level of overweight found in southern European countries. These
anthropometric results were published in Pediatric Obesity in 2013 (48). The second round took
place during the school year 2009-2010 with the participation of 4 more countries: Greece,
Hungary, Spain and the former Yugoslav Republic of Macedonia. The countries with a higher
prevalence of overweight in round 1 (for example, Italy and Portugal) showed a decrease in
prevalence in round 2 (though their estimates remained among the highest in that round), and the
countries with lower prevalence in round 1 (such as Latvia and Norway) showed an increase in
prevalence in round 2 (though their estimates remained lower than those of the countries with the
highest decrease in prevalence in round 2). The anthropometric results of the second round of COSI
data collection were published in BMC Public Health in 2014 (49). An additional four countries
(Albania, the Republic of Moldova, Romania and Turkey) joined the third round of data collection,
which took place during the school year 2012-2013. The fourth round is planned for the school year
2015/2016.
Analysis of good practice
COSI (47) is an example of good intercountry practice in EU with regard to the prospective
monitoring of biological risk factors for NCD, allowing both the prediction of future trends in NCD
across countries and the evaluation of the effects of interventions addressing childhood obesity. The
COSI monitoring system is integrated (it includes several countries and participation is expanding),
allows disaggregation (by sex), it is standardized and it is applicable to relevant policy. Moreover,
monitoring results have been well disseminated through publications in peer-reviewed magazines.
4.4 Examples of good practice in health monitoring outside EU
4.4.1 Israel: electronic health records for better NCD monitoring and control
The purpose of monitoring NCD is to ensure the appropriate treatment of and prevent secondary
complications in people suffering from them. GMF (7) calls for the efficient monitoring of NCD
morbidity indicators and appropriate health-system response.
Israel is one of the global leaders in adopting innovative strategies to prevent and control NCD,
especially in field of management of people with these diseases. One vivid and highly effective
example is the early and wide adoption of ehealth tools, such as electronic health records (EHR), and
software for alerting health-care professionals as to when patient follow-up is due. Run by the Clalit
Health Services, one of Israel’s leading health-service organizations, the initiative has reoriented
health care towards more patient-centred practices with the interoperability of EHR data by
different service providers. It has allowed better stratification of the risks of NCD patients, timely
proactive follow-up, and effective care delivery. Using online EHR data allows management to
monitor the prevalence, incidence and control of most NCD in a precise and timely manner.
Furthermore, the interoperability of the system and its user friendliness have enabled the early

27
detection and prevention of complications and the continuity of health care, while containing costs
related to the duplication of diagnostic and laboratory procedures. Finally, continuous and ongoing
feedback to providers on more than 70 quality measures from general practitioners alone has
allowed quality improvement. A composite e-score of the inequalities relating to the key indicators
for quality health care saw a 60% reduction in these gaps in an underprivileged population group of
400 000 within 3 years (50).
Analysis of good practice
This example shows the efficiency and cost-effectiveness of using clinical data en masse to ensure
better NCD prevention and control. One of the important features of this multi-purpose monitoring
system is its interoperability, which adds functionality, integration and real-time monitoring of the
data and disaggregation of the indicators by socioeconomic status.
4.4.2 Republic of Moldova: the national STEPwise approach to surveillance
The WHO STEPwise approach to Surveillance (STEPS) is a simple, standardized method of collecting,
analysing and disseminating data in WHO Member States. The standardized questions and protocols
of STEPS result in information that can be used not only for monitoring in-country trends, but also
for making comparisons across countries. The STEPS approach encourages the collection of small
amounts of useful information on a regular and continuing basis (51).
The Republic of Moldova was one of the few countries of the WHO European Region that applied
this method in 2013. The goal of the Moldovan STEPS survey was to evaluate the prevalence of the
main NCD risk factors to enable the more efficient planning of NCD prevention and control policies
and activities. Steps 1, 2 and 3 were implemented: sociodemographic and behavioural information
was collected in step 1; physical measurements, such as height, weight, blood pressure, and heart
rate, were collected in step 2; and biochemical measurements were collected to assess blood
glucose and cholesterol levels in step 3. A total of 4807 respondents aged 18-69 years participated
in the survey, the overall response rate being 83.5%. The study showed that every third person
(30.3%) had three or more of the five NCD risk factors assessed, increasing proportionally with age.
Men were more affected (35.2%) than women (25.0%). A total of 61.7% of the respondents had one
or two of the five risk factors assessed, and only 8% of the population studied had none (52).
Analysis of good practice
The use of surveillance approaches, such as STEPS (51), allows the generation of a pool of national
evidence that can be used to assess the situation, plan NCD prevention and control activities,
increase political commitment to strategies targeting NCD risk factors, and follow up on the effects
of interventions. Some of the important characteristics of the STEPS survey in the Republic of
Moldova (52) were the use of a representative population sample (trustworthiness), the
disaggregation of data by gender and age, and the affordability of the monitoring system (applicable
to low-resource settings).

28
Chapter 5. Report on innovative data sets and comparative analysis
5.1 Introduction
This chapter presents innovative data sets, some of their sources and their potential application in
the area of integrated NCD monitoring and surveillance. It includes examples of three cases where
innovative data sources were applied in monitoring NCD or their risk factors. While these cases
represent good practice in pilot or demonstration projects, there is ample room for the development
and implementation of innovative data in the Member States.
Abrupt changes in the social and economic environment, such as economic downturn, can bring
about precipitous behavioural changes (for example, increased alcohol or tobacco consumption)
that are precursors to many chronic illnesses. Yet, existing NCD-surveillance systems are often
limited by incomplete reporting, small study sample sizes, considerable time lag, bias due to
predominantly self-reported data, and the absence of geographically linked or comparable data (53).
These limitations result in knowledge and monitoring gaps and, thus, in delaying the availability of
data for use in decision-making and intervention. Therefore, sudden changes in NCD risk factors
should be anticipated and addressed to prevent the expansion or mitigate the prevalence of chronic
illness. These emerging needs coincide with the advent and spread of real-time data-capturing
capabilities, including the more rapid turnaround of situational data relevant to health.
Today, data are being collected from many sources, including industry, and digitally amassed at an
exponential rate. The communications revolution has led to the rise of new methodologies and data
sources, and greater potential to collect and analyse data of previously inconceivable breadth and
depth. Applications in the realms of communication, entertainment and retail are continuously
expanding and challenging the limits of what is possible.
These advancements have brought with them the feasibility of using real-time data capture relevant
to health - within the area of reality mining - to address the need for change in disease surveillance.
Sources of reality mining include digital trails, social media and industry-specific databases (i.e.,
databases based on medical records). These potential new data sources represent a new era of real-
time surveillance of NCD and their key risk factors, and could result in a more effective monitoring of
the impact of policies to prevent and control them.
5.2 Methodology
A technical meeting on the use of big data and social media for the surveillance of NCD was co-
hosted by the WHO Regional Office for Europe and UN Global Pulse in Tallinn, Estonia, on 10–11
September 2013. The goal was to explore the potential application of new data sources to
supplement the traditional means of data collection for NCD surveillance purposes. Participants
included NCD-surveillance experts from WHO European Member States and representatives of the
United Nations Global Pulse initiative, Microsoft, and the Division of Noncommunicable Diseases and
Life-Course of the WHO Regional Office for Europe. Plenary and group discussions were held on the
theoretical and practical aspects of big data sources; three main groups focused on social media,

29
digital trails of daily activities, and mass EHR data. The issues debated in relation to each type of data
source, including the potential advantages of using them for NCD monitoring and their potential key
flaws, are summarized in Table 7.
Table 7. Three data types with potential data sources, NCD-related information, caveats and
stakeholders
Data type
Data source (list not exhaustive)
NCD-related information
Key flaws or challenges
Key stakeholders
Soci
al m
edia
an
d p
atte
rns
of
use
Social-media interactive platforms (e.g., Twitter, Facebook)
Attitudes, behaviours, risk factors
Population biases; difficulties identifying sociodemographic information; access to collected data (ownership and privacy); lack of standardization of data
Regulatory bodies and policy-makers responsible for data privacy and protection
Search engines (e.g., Google, Bing)
Search behaviour Population biases; difficulties identifying sociodemographic information; access to collected data (ownership and privacy)
Regulatory bodies and policy-makers responsible for data privacy and protection
News commentaries Attitudes toward health-related topics
Population biases; difficulties identifying sociodemographic information; access to collected data (ownership and privacy); lack of standardization of data
Individual users, moderators, publishing platforms
Blogs Attitudes, behaviours, risk factors
Population biases; difficulties identifying sociodemographic information; access to collected data (ownership and privacy); lack of standardization of data
Individual users, moderators, publishing platforms
Dig
ital
tra
ils
Mobile-phone data Movement and physical activity
Access to collected data because of ownership and privacy; population bias; difficulties in determining causal factors for data in digital trails
Phone companies; applications developers; online retailers
Mobile- applications data Physical activity, diet, blood pressure, etc.
Access to the data collected because of ownership & privacy; population bias; difficulties in determining causal factors for data in digital trails
Phone companies; applications developers
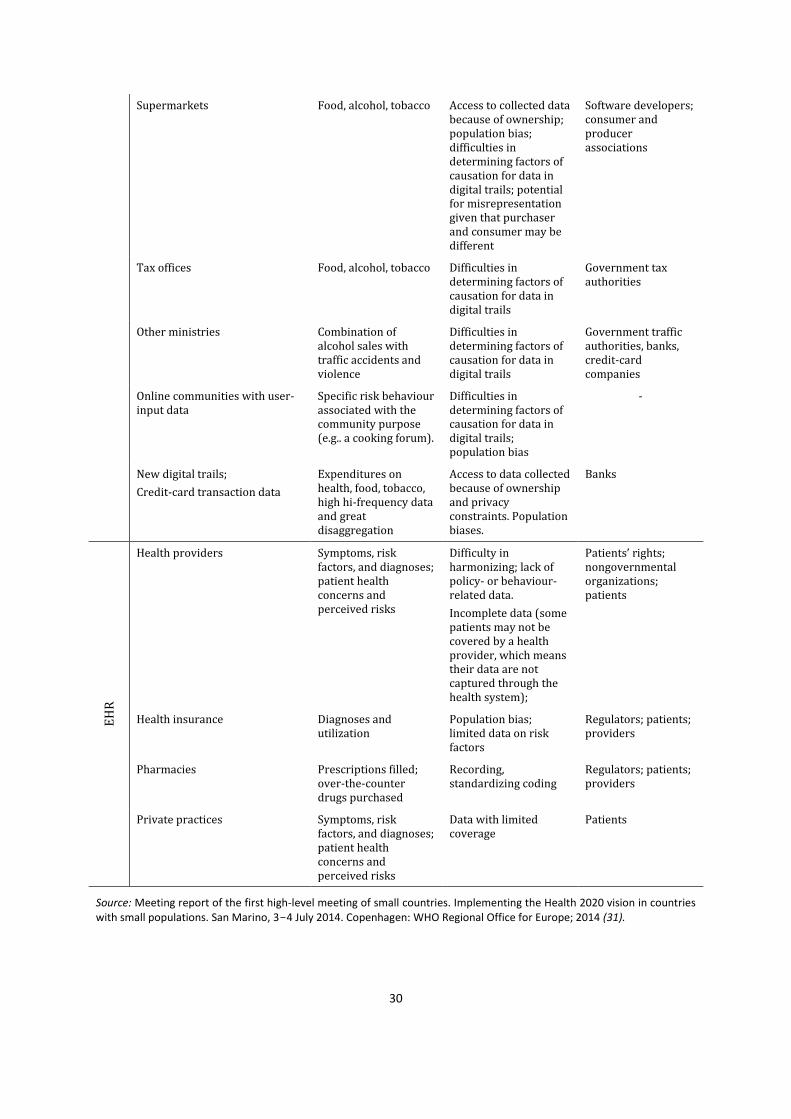
30
Supermarkets Food, alcohol, tobacco Access to collected data because of ownership; population bias; difficulties in determining factors of causation for data in digital trails; potential for misrepresentation given that purchaser and consumer may be different
Software developers; consumer and producer associations
Tax offices Food, alcohol, tobacco Difficulties in determining factors of causation for data in digital trails
Government tax authorities
Other ministries Combination of alcohol sales with traffic accidents and violence
Difficulties in determining factors of causation for data in digital trails
Government traffic authorities, banks, credit-card companies
Online communities with user-input data
Specific risk behaviour associated with the community purpose (e.g.. a cooking forum).
Difficulties in determining factors of causation for data in digital trails; population bias
-
New digital trails;
Credit-card transaction data
Expenditures on health, food, tobacco, high hi-frequency data and great disaggregation
Access to data collected because of ownership and privacy constraints. Population biases.
Banks
EH
R
Health providers Symptoms, risk factors, and diagnoses; patient health concerns and perceived risks
Difficulty in harmonizing; lack of policy- or behaviour-related data.
Incomplete data (some patients may not be covered by a health provider, which means their data are not captured through the health system);
Patients’ rights; nongovernmental organizations; patients
Health insurance Diagnoses and utilization
Population bias; limited data on risk factors
Regulators; patients; providers
Pharmacies Prescriptions filled; over-the-counter drugs purchased
Recording, standardizing coding
Regulators; patients; providers
Private practices Symptoms, risk factors, and diagnoses; patient health concerns and perceived risks
Data with limited coverage
Patients
Source: Meeting report of the first high-level meeting of small countries. Implementing the Health 2020 vision in countries with small populations. San Marino, 3-4 July 2014. Copenhagen: WHO Regional Office for Europe; 2014 (31).

31
5.3 Overview of data sources
The challenge of identifying acute changes in morbidity, mortality and risk factors related to chronic
illness using traditional periodic health surveys can be partially addressed through EHR-based
surveillance systems. New data sources, such as social media and digital trails of everyday real-life
action (for example, the digital recording of sales and the use of mobile telephones) can potentially
also be used.
As mentioned earlier (4.2), the attributes of a desirable data source for NCD surveillance include
timeliness, data disaggregation, involvement of trends data, diversity of content, efficiency,
trustworthiness, comparability, credibility, affordability, sustainability and application to policy. New
data sources may also track what people say (social media), do (digital trails of movements,
purchases and activities), and how they interact with the health system (mainly EHR). None of these
sources possess all of the desired attributes and, thus, a combination of them would likely be the
most reasonable scenario in the medium term.
5.3.1 Capturing and using social-media data
Social-media data offer the potential of assessing health-related attitudes and behaviours pertaining
to NCD and their risk factors, which can be helpful in measuring trends and shedding light on the
public’s views on important topics to inform policies and public health campaigns. Key stakeholders
can also be identified that previously may not have been known influencers. Public-opinion data can
also serve as early indicators of health scares, controversies or unexpected emerging issues not
taken into account by other means of surveillance (54).
Potential flaws and caveats associated with the use of social-media data
The key caveats associated with the use of social-media data in NCD monitoring include: biases
relating to data representation (only certain segments of the population will participate) and the
type of information users communicate publicly through the social media; difficulties and
inconsistencies in identifying sociodemographic information about the segment of the population
represented in the data; and difficulties related to gender disaggregation, geolocation of
information, and lack of standardization of information captured as it is all qualitative in nature.
There is, therefore, a need to validate these kinds of data on a large scale - via comparisons with
ground-truth information - so that the limits of such methodologies may be understood.
Case study and potential data applications
Social media have been used to create awareness about the perceptions and sentiments of the
population in relation to certain health-related topics, allowing action, such as communication
campaigns, to be taken to fight misconceptions and clarify false information. The United Nations
Global Pulse and the Indonesian Government used online social-media sources to investigate why
parents in Indonesia were refusing to have their children vaccinated (54). Parents’ sentiments were
tracked and validated through expert consultations and complementary studies. The data collected
constituted a temperature gauge of when to take action on what, illustrating - in real-time - the
factors people take into consideration when deciding whether or not to have their children
vaccinated. Recent scientific research has linked information contained in social-media data to

32
behavioural risk factors of NCD (obesity (55), smoking and alcohol consumption (56), or potential
post-partum depression (57)), indicating the high potential of the social media as a high-frequency
complementary source of information for the rapid identification of changes in behavioural trends.
However, social-media data have not yet been used on a large scale in any systematic way; to do so
would require significant developmental work and, for them to be used robustly, their validation in
different settings and population subgroups. Rather than analysing this type of information
independently, it would likely be more useful to integrate it into existing frameworks to close data
gaps.
5.3.2 Capturing and using data from digital trails and other big-data sources
Digital trails comprise data signals of our movements and actions, recorded electronically through
the devices we use in our everyday lives. Of particular interest in this regard are the digital trails of
data derived from the use of mobile phones, which – anonymized and aggregated in a way that
respects user privacy and safeguards user identity – can provide information regarding patterns of
movement and personal interaction. Other highly important sources of data are supermarkets and
other commercial entities, as well as records of credit-card transactions, which can be disaggregated
by type of expense and sociodemographic characteristics. A recent study showed a time series on
health and food expenditures at city level disaggregated by gender and age (58).
Data may also be recorded through dedicated applications (opt-in data collection), such as the
FoodSwitch application (59) that allows consumers to scan a food product, receive information on
its fat, salt and sugar content and choose a proposed alternative.
While data from digital trails were originally collected independently from other health-related
information, they can serve as a complementary data set, offering new insight into the aspects of
existing health data, and providing access to information on population segments that otherwise
may be difficult to survey using traditional health-surveillance methods. For instance, research has
demonstrated the possibility of measuring the distance walked per day by users using smart phones
(60). However, this kind of data is potentially more useful for detecting changes in disease or risk-
factor trends at an earlier stage than would be possible using other surveillance tools; this may also
be the case with regard to identifying patterns of abrupt seasonal change. In order to exploit this
new type of information fully at the population level, and in an ethical manner, it is important not to
work with raw data but with anonymized, aggregated data that do not allow identification of the
individuals to which they relate. It is important to conduct a privacy assessment prior to setting up a
system with this type of information. In connection with the use of private-sector data in NCD-
surveillance systems, consideration should be given to ensuring not only that individual privacy is
respected, but also that the format used for data-sharing preserves the competitive advantages of
the data providers. Current gaps in data collection through health surveys or from other traditional
sources can be filled by using data from digital trails that provide additional time points between
surveys or additional local-level data.
Potentially, digital trails may include the following stakeholders: telecom providers; supermarkets;
banks and credit-card organizations; online retailers; producers of mobile applications; online
communities; government and industry regulators; and privacy experts.

33
Theoretically, retail data, such as those from supermarkets, can be used not only to monitor NCD but
also to take action in certain settings, for example, to enable healthier food choices and predict the
impact of price policies, such as those on raising the price of alcohol.
Potential flaws and caveats associated with the use of data from digital trains and other big-data sources
There are difficulties related to identifying the factors that influence output data in digital trails, and
serious caveats concerning privacy issues connected with accessing this type of data. These relate to:
the potential lack of representativeness in total population;
the impact of affluence, for example, on mobile-phone data;
cause/effect vis-à- vis correlation;
distinguishing supermarket data by final user (for example, by purchases made for catering, household consumption, etc.);
the need (in view of the innovative nature of digital trails as a new data source for NCD surveillance) to determine their validity and accuracy in systematic use in different settings (for example, in low-resource vs high-resource countries, different population subgroups);
changing conditions of use of the different services (for example, new services appear,
others disappear, others change their market share).
Besides digital trails, other potential big-data sources that could be used in NCD surveillance are
rapidly emerging, from sensors to wearable technologies. The term “big data” usually refers to data
that is defined by the 4 V’s – that is, data of exceedingly high volume (petabytes, exabytes and
beyond) that streams in at high velocity in a variety of structured and unstructured formats and are
characterized by variable veracity. The use of such data usually poses technical challenges in every
step, including storage, cleaning, analysis and interpretation, which are tackled using dedicated big-
data techniques and technology. A literature search, entering the term, “big data“, in the title field
alone, resulted in more than 290 mentions in health literature published since 2010 (the majority in
2014), illustrating the recent expansion of and development in this area. However, most of the good-
practice examples are about how to use big data for medical and clinical research, including new
ways of collecting them, for example, by means of remote sensors worn by CVD patients.
Increasingly, the topic of big data is included in research on how better to serve ageing populations
in connection with which systems for the constant monitoring of assisted-living arrangements create
large new data sets. Also, the linking of large data sets and data mining add new perspectives for
research into ways of tackling some of the biggest challenges posed by ageing populations, such as
the growing number of dementia cases.
Case study: wearable fitness trackers and motion sensors
A recent example of gaining insight into regional variations of NCD risk factors relates to the data
created and shared by users of wearable fitness trackers. These devices track 24 hours of physical
activity and sleeping patterns and, although the users do not necessarily comprise a representative
sample, some interesting observations about these factors, and differences between countries in
relation to them, have emerged. To obtain these data, specialized and costly surveys are usually
required, such as interview surveys related to health or the use of household time, usually with a
limited sample size. Further research will be needed to analyse the results from the different data

34
sources and explore potential ways of calibrating data from big-data sources with population-survey
data.
5.3.3 Capturing and using EHR data
Large, updated clinical and administrative data sets, based on real-time or near-real-time streams of
EHR and insurance-claims data are now becoming more widely available to health organizations in
WHO Member States. While, until a decade ago, little or no use was made of EHR in patient care in
Europe, or use of EHR was restricted to payment purposes, many health-care organizations routinely
use EHR today and are able to query the database containing these records for multiple purposes
(61). This can be an effective method of monitoring NCD trends in diverse populations and is less
costly and labour-intensive than conducting health evaluation surveys.
Although not originally designed for surveillance, these big clinical- and administrative-data sources
show great promise for NCD surveillance, and could be a “game-changing” tool in NCD prevention
and control. As more countries in the Region are developing such databases, the potential of EHR as
a big-data source requires further assessment in the NCD context. EHR systems provide passive,
time-continuous data, allowing the observation of short-term medical outcomes and long-term
disease trends for near real-time monitoring. Such automatic passive registers (EHR) can be
internally cross-validated with other multiple data sources, such as diagnostic and laboratory results
and prescription data, to provide a more holistic picture of a tracked chronic disease.
The application of EHR data can enable other proactive and relevant NCD monitoring and control
strategies, including those for monitoring the effectiveness of care delivery, measuring disparities
between health and health-care quality indicators, and transforming NCD care towards more
targeted and proactive interventions.
Potential flaws and caveats associated with EHR data
Caveats associated with EHR data include biased representation, given that individuals who do not
come in contact with the medical or health system (for example, because they have limited access or
are healthy) are not captured. There are also some limitations in the kind of data captured through
EHR systems, and behaviour- or policy-related data are often missing. These data are also vulnerable
to coding biases, such as over-reporting for reimbursement, or inadequacies due to differences in
the way in which the sources or origins are coded. It is, thus, important to cross validate by using a
combination of variables and streams beyond diagnoses alone, whenever feasible.
The following challenges need to be resolved to increase the use of EHR as a data source:
legal and regulatory barriers, including harmonization of data-privacy legislation to create the
right framework;
gaining permission to access these data from private companies collecting them, as well as from
different Member States;
linkage and harmonization of data-privacy legislation (pharmacy-hospital-GP-etc.);
privacy aspects (related both to patient and medical organizations);
coding issues and access delays;
validation of behavioural data;
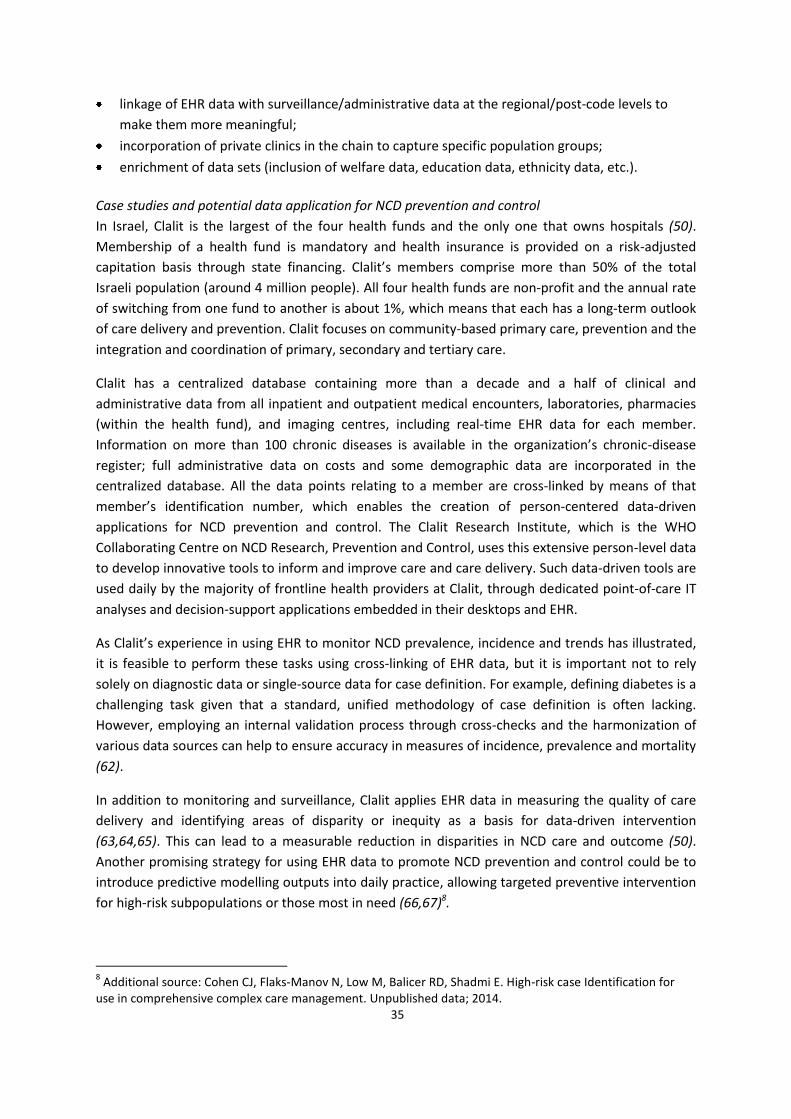
35
linkage of EHR data with surveillance/administrative data at the regional/post-code levels to
make them more meaningful;
incorporation of private clinics in the chain to capture specific population groups;
enrichment of data sets (inclusion of welfare data, education data, ethnicity data, etc.).
Case studies and potential data application for NCD prevention and control
In Israel, Clalit is the largest of the four health funds and the only one that owns hospitals (50).
Membership of a health fund is mandatory and health insurance is provided on a risk-adjusted
capitation basis through state financing. Clalit’s members comprise more than 50% of the total
Israeli population (around 4 million people). All four health funds are non-profit and the annual rate
of switching from one fund to another is about 1%, which means that each has a long-term outlook
of care delivery and prevention. Clalit focuses on community-based primary care, prevention and the
integration and coordination of primary, secondary and tertiary care.
Clalit has a centralized database containing more than a decade and a half of clinical and
administrative data from all inpatient and outpatient medical encounters, laboratories, pharmacies
(within the health fund), and imaging centres, including real-time EHR data for each member.
Information on more than 100 chronic diseases is available in the organization’s chronic-disease
register; full administrative data on costs and some demographic data are incorporated in the
centralized database. All the data points relating to a member are cross-linked by means of that
member’s identification number, which enables the creation of person-centered data-driven
applications for NCD prevention and control. The Clalit Research Institute, which is the WHO
Collaborating Centre on NCD Research, Prevention and Control, uses this extensive person-level data
to develop innovative tools to inform and improve care and care delivery. Such data-driven tools are
used daily by the majority of frontline health providers at Clalit, through dedicated point-of-care IT
analyses and decision-support applications embedded in their desktops and EHR.
As Clalit’s experience in using EHR to monitor NCD prevalence, incidence and trends has illustrated,
it is feasible to perform these tasks using cross-linking of EHR data, but it is important not to rely
solely on diagnostic data or single-source data for case definition. For example, defining diabetes is a
challenging task given that a standard, unified methodology of case definition is often lacking.
However, employing an internal validation process through cross-checks and the harmonization of
various data sources can help to ensure accuracy in measures of incidence, prevalence and mortality
(62).
In addition to monitoring and surveillance, Clalit applies EHR data in measuring the quality of care
delivery and identifying areas of disparity or inequity as a basis for data-driven intervention
(63,64,65). This can lead to a measurable reduction in disparities in NCD care and outcome (50).
Another promising strategy for using EHR data to promote NCD prevention and control could be to
introduce predictive modelling outputs into daily practice, allowing targeted preventive intervention
for high-risk subpopulations or those most in need (66,67)8.
8 Additional source: Cohen CJ, Flaks-Manov N, Low M, Balicer RD, Shadmi E. High-risk case Identification for
use in comprehensive complex care management. Unpublished data; 2014.

36
5.4 Visualizing data for comparative analysis
In addition to the use of new sources of data for more integrated monitoring and surveillance of
NCD, the area of data visualization for comparative analysis is also undergoing changes and
innovation. User-friendly data-visualization tools offer further capacity for analysing and synthesizing
time trends and indicator patterns, comparing data across and within countries, and enhancing
communication with policy-makers and other users. Examples of data-visualization techniques and
tools for enhancing NCD monitoring and surveillance are given below.
5.4.1 Data visualization using the small-multiples technique for comparison of NCD trends
between countries and across time
The small-multiples technique suggested by Edward Tufte is a visualization technique that presents
data in illustrations of postage-stamp size, indexed by category or label, sequenced over time, or
organized by quantitative or qualitative variable (68). In other words, small multiples use the same
basic graph or chart to display different slices of a data set. Such a technique allows an
understanding of the actual contents of the visual image, rather than the principles of chart
organization. It also allows an understanding of the common data patterns (69). Fig. 2 illustrates the
practical use of this technique, presenting time trends of mortality data across countries to compare
declining mortality trends and reveal the countries with the highest and lowest mortality rates in
comparison to the EU average. The small-multiples technique provides fast snapshots of mortality
and morbidity trends specifically relevant to NCD.
Fig. 2. Comparative time trend of mortality from circulatory diseases in EU (visualization using
small-multiples technique)
Source: WHO HFA-DB, 2014 (16).
5.4.2 Dynamic pictures for comparative trend analysis
National health information is usually available in at least three dimensions: indicator, geography
and time. Regardless of whether the data are derived from social media, digital trails, or EHR

37
systems, dynamic comparisons between countries will help to capture the constantly changing
landscape. Very seldom, however, data are presented in ways that allow the dynamic exploration of
the relationship between more than two variables at a time. Software and programmes, such as
Gapminder Trendalyzer (70), can be useful for presenting the dynamism of the relationship between
risk factors and disease prevalence, with a particular focus on gaps and disparities between
countries.
Gapminder Trendalyzer (70) makes it possible to follow the time trends of correlations between the
social determinants of health, such as, gross domestic product (GDP) per capita, and summary
health measures, such as life expectancy, while taking a third variable (such as population size) into
account across countries (Figs 3 and 4). The tool allows better visualization and, therefore,
understanding of the patterns and trends of demographics, diseases and risk factors, and their
dependence on the wider determinants of health.

38
Fig. 3. Comparative visualization of correlation between life expectancy and income per capita
in 1953, by country population size
Source: Gapminder, 2014 (70)

39
Fig. 4. Comparative visualization of correlation between life expectancy and income per capita
in 2012, by country population size
Source: Gapminder, 2014 (70).
5.4.3 WHO interactive atlases of health data at Nomenclature of Territorial Units for Statistics 2
(NUTS2) level
One of the goals of developing the interactive atlases of health data was to improve the availability
of and access to evidence on inequalities in health-system performance, including quality of care and
the structural determinants of such inequalities across countries and regions in Europe. The aim was
to do so by increasing the sample size of data by “drilling down” to subnational data from Eurostat
data sources at the NUTS2 level (71).
To analyse and display the data, the WHO Regional Office for Europe developed the following
interactive atlases (72).
The correlation map atlas allows the visualization of two variables and illustrates their
association in a graph where simple correlation analyses can also be performed. A filter function
allows the selection of a single country or group of countries.
The atlases of social inequalities allow the visualization of differences in values between regions
or groups of regions. Comparisons are possible using a hypothetical “target value”, which is
calculated as the population-weighted average of the most advantaged quintile of the

40
population. Differences between the target and the individual region are visualized as absolute
differences (area/target differences) and relative differences (area:target ratios).
The regional comparison atlas allows a quick comparison of several key indicators in a limited
number of regions.
It is the aim not only to provide more visibility to the subnational patterns of health and their
determinants through these atlases (72) but also to analyse, by using them, how this integrated
information system and its underlying data can inform policy in European countries.
Figs 5 and 6 illustrate the results of questions addressed interactively using the integrated dashboard
of the correlation map atlas. Fig. 5 shows the high correlation between cerebrovascular disease
mortality and disposable income in 300 subnational regions in EU countries. Within that context, a
close-up view displays the country situation (in this case, Germany) with regard to the magnitude
and geographical patterns of mortality and income. Fig. 6 shows the result of applying the filter
(selection) function to the same data for a subregion or country (in this case, Portugal): an analysis of
the data subset is then carried out and displayed on the dashboard.
Fig. 5. Interactive atlas of correlation between age-standardized death rate from cerebrovascular diseases and disposable household income in regions of Germany
Source: WHO European interactive atlases of health inequalities, 2014 (72).

41
Fig6. Interactive atlas of correlation between age-standardized death rate from malignant neoplasms and ageing index in regions of Portugal
Source: WHO Europe Interactive atlases of health inequalities, 2014 (72).
5.5 Discussion
Big data from social media, digital trails and other emerging sources of big data have shown their
potential as a supplementary source of NCD data, including the capacity for efficient data collection
and for reaching different population groups. However, they should not be considered as a
replacement for traditional health-surveillance sources.
Big-data sources could serve as a platform for validating health information derived from traditional
health-surveillance sources. Their potential for data disaggregation is also interesting. Innovative
data-visualization tools that combine information derived from different data sources also enable
the comparison of data across time and geographical units, providing the evidence required for
developing policies and strategies.

42
Chapter 6. Next steps
The iNCD project concluded in identifying action to further develop integrated NCD surveillance. The
main focus of this action would be to enhance data availability and quality, build capacity, and
strengthen collaboration between NCD networks and international organizations.
6.1 Enhancing data quality and availability
6.1.1 Data collection
Although there is consensus on limiting the number of indicators and data collections, alternative
ways of collecting information for NCD monitoring need to be considered. These include the
application of less traditional methods of collection, based on social media and digital trails, to
address aspects of NCD that, currently are not covered by routine systems, population-based
surveys or registers. In addition, it would be useful to identify further examples of good practice in
this area.
Approaches to improving the collection and sharing of data should take regulatory and legal aspects
into account as these differ from country to country. In addition, to gain a more comprehensive
overview of the NCD situation and trends in a country or region, it will be essential to increase the
involvement of the private sector in information sharing.
6.1.3 NCD monitoring at national level
National plans to improve NCD monitoring, including national definitions of targets and indicators
would involve developing or improving national processes of collecting data from the major NCD
monitoring sources, such as STEPS (51), registers and EHR. Relationships between NCD indicators
and relevant policy areas and target groups (for example, life-course approach or healthy ageing)
should be highlighted, and registries and other information systems linked to enable the monitoring
of NCD targets and indicators and the evaluation of policies and interventions. The sharing of best
practices of developing and implementing data collection, and of assessing the quality of the data
(including the comparison of registry data with models) would be beneficial.
6.1.4 National and regional reporting on NCD surveillance and monitoring
National and regional reporting on NCD surveillance and monitoring should be promoted and
facilitated, including the use of sound subnational and intercountry comparisons. Promoting the
availability of NCD data through the preparation of factsheets and guidelines, as well as the use of
information and communications technology and enhanced interactive visualization tools, should
also be considered. Communications to policy-makers about NCD indicators should be clear and
concise and should illustrate the relationship between the indicators and targets.
6.1.5 Efficiency of NCD data collections
International cooperation on NCD monitoring needs to be enhanced to improve the efficiency of
NCD data collections and the availability of survey data. This could be achieved by incorporating the

43
content of standardized EHIS modules (21), such as those for monitoring alcohol, nutrition and
tobacco, in the EU Survey on Income and Living Conditions (SILC) (73), which is carried out regularly
with support from Eurostat (11).
6.2 Strengthening capacity-building
6.2.1 Sharing methods, tools and knowledge
National professionals often feel hampered when confronted with conducting assessments and
reporting on NCD. In addition to developing their technical approaches to and sharing examples of
good practice on NCD surveillance and monitoring at subregional, national and subnational levels,
countries need to relate indicators to policy interventions. At the same time, it would be important
to promote bilateral or subregional collaboration among countries. To provide continuity to this
process, it has been suggested that a network be established for collaborating and sharing
information relevant to the integrated surveillance of NCD and health inequalities, including
documentation and repository tools.
Member States have expressed a request to facilitate understanding of the strengths and
weaknesses of WHO estimations and modelling and to provide details on the rationale, processes
followed, and means of improving estimates with country input. Sharing methodological information
and tools for producing and analysing estimated NCD data for monitoring and surveillance would
enhance transparency and stimulate country participation and ownership.
6.2.3 Training processes
The involvement of the NCD Policy Academy of the Countrywide Integrated Noncommunicable
Diseases Intervention (CINDI) Programme may be useful for strengthening national data-quality
assessment and analytical capacity to improve data collection, analysis and interpretation (74). This,
in turn, would enhance NCD surveillance and its relationship with policy-making.
6.3 Collaboration between networks and international organizations
6.3.1 Harmonizing and comparing NCD indicators
Improving the harmonization and comparability of NCD indicators used by international
organizations for NCD monitoring and surveillance, as well as the alignment of the various initiatives
to meet the requirements of the global and regional mandates of WHO, EC and other international
organization on NCD monitoring, would enhance efficiency. To this end, involving Eurostat and OECD
in reviews and discussions would be important.
6.3.2 Reducing the burden of data collection and enhancing efficiency
Countries are frequently burdened by multiple data-collection activities. To improve this situation,
ways to increase joint data collection by international organizations, as done, for example, through
the Eurostat/OECD/WHO joint data collection of non-monetary health indicators, should be
investigated. International organizations could also consider simplifying their processes of NCD data
collection and integrating specific contents in their databases to illustrate NCD from different
perspectives, from risk factors and health impacts to policies and interventions. Quality of health
care indicators may be the example to start with.

44
References1
1. European Core Health Indicators. In: Indicators [website]. Brussels: European Community; 2015 (http://ec.europa.eu/health/indicators/echi/index_en.htm).
2. Health Monitoring Programme. In: Health Programme [website]. Brussels: European Commission Directorate General for Health and Food Safety; 2015 (http://ec.europa.eu/health/programme/policy/eight_programmes/monitoring/index_en.htm).
3. Indicators. In: European Community Health Indicator Monitoring (ECHIM) [website]. Brussels: European Commission Directorate General for Health and Food Safety; 2014 (http://www.echim.org/indicators.html).
4. HEIDI data tool. In: European Community Health Indicator Monitoring (ECHIM) [website]. Brussels: European Commission Directorate General for Health and Food Safety; 2014 (http://www.echim.org/indicators.html).
5. Health 2020: A European policy framework and strategy for the 21st century. Copenhagen: WHO Regional Office for Europe; 2013. (http://www.euro.who.int/__data/assets/pdf_file/0011/199532/Health2020-Long.pdf).
6. Political Declaration of the high-level meeting of the General Assembly on the prevention and control of non-communicable diseases. New York: United Nations; 2012. (http://www.who.int/nmh/events/un_ncd_summit2011/political_declaration_en.pdf).
7. NCD Global Monitoring Framework [website]. Geneva: WHO; 2013 (http://www.who.int/nmh/global_monitoring_framework/en/).
8. Resolution WHA66.10. Follow-up to the Political Declaration of the high-level meeting of the General Assembly on the prevention and control of non-communicable diseases. In: Sixty-sixth World Health Assembly, Geneva, 20–27 May 2013. Resolutions and decisions, annexes. Geneva: WHO; 2013:16-21 (WHA66/2013/REC/1; http://apps.who.int/gb/ebwha/pdf_files/WHA66-REC1/A66_REC1-en.pdf).
9. Regional Consultation on targets and indicators for Health 2020 monitoring: Report of results. Copenhagen: WHO Regional Office for Europe; 2013. (http://www.euro.who.int/__data/assets/pdf_file/0005/214970/Regional-consultation-on-targets-and-indicators-for-Health-2020-monitoring-report-of-results-Eng.pdf).
10. European Community Health Indicator Monitoring (ECHIM) [website]. Brussels: European Commission Directorate General for Health and Food Safety; 2014 (http://www.echim.org/).
11. Eurostat [website]. Luxembourg: European Commission; 2014 (http://ec.europa.eu/eurostat).
12. White Paper. Together for Health: A Strategic Approach for the EU 2008-2013. Brussels: European Commission; 2007 (http://ec.europa.eu/health-eu/doc/whitepaper_en.pdf).
13. Resolution EUR/RC62/R4. Health 2020 – the European policy framework for health and well-being Health 2020. In: Report of the sixty-second session of the WHO Regional Committee for Europe Malta, 10–13 September 2012:41-44. Copenhagen: WHO Regional Office for Europe; 2012 (http://www.euro.who.int/__data/assets/pdf_file/0003/174585/RC62-Report-Eng-final-version.pdf?ua=1).
1 Unless otherwise indicated, URLs accessed 25 January 2015 (references 1-58) and accessed 26 January 2015
(references 59-69).
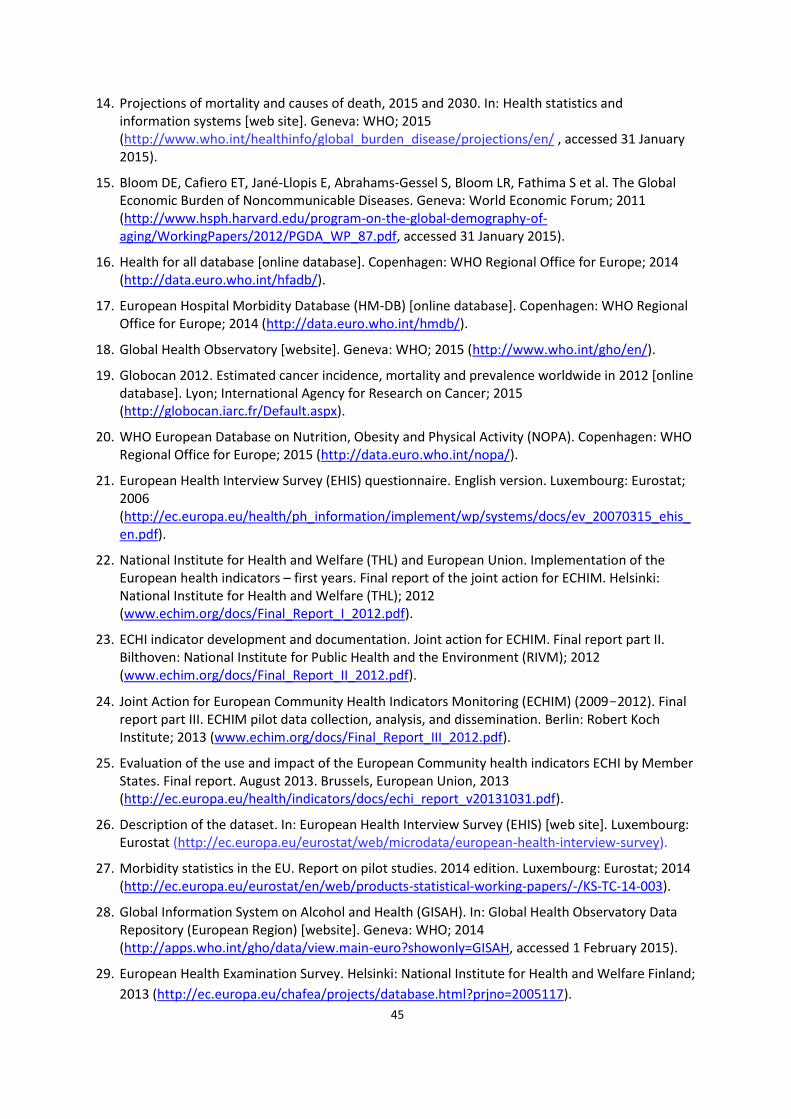
45
14. Projections of mortality and causes of death, 2015 and 2030. In: Health statistics and information systems [web site]. Geneva: WHO; 2015 (http://www.who.int/healthinfo/global_burden_disease/projections/en/ , accessed 31 January 2015).
15. Bloom DE, Cafiero ET, Jané-Llopis E, Abrahams-Gessel S, Bloom LR, Fathima S et al. The Global Economic Burden of Noncommunicable Diseases. Geneva: World Economic Forum; 2011 (http://www.hsph.harvard.edu/program-on-the-global-demography-of-aging/WorkingPapers/2012/PGDA_WP_87.pdf, accessed 31 January 2015).
16. Health for all database [online database]. Copenhagen: WHO Regional Office for Europe; 2014 (http://data.euro.who.int/hfadb/).
17. European Hospital Morbidity Database (HM-DB) [online database]. Copenhagen: WHO Regional Office for Europe; 2014 (http://data.euro.who.int/hmdb/).
18. Global Health Observatory [website]. Geneva: WHO; 2015 (http://www.who.int/gho/en/).
19. Globocan 2012. Estimated cancer incidence, mortality and prevalence worldwide in 2012 [online database]. Lyon; International Agency for Research on Cancer; 2015 (http://globocan.iarc.fr/Default.aspx).
20. WHO European Database on Nutrition, Obesity and Physical Activity (NOPA). Copenhagen: WHO Regional Office for Europe; 2015 (http://data.euro.who.int/nopa/).
21. European Health Interview Survey (EHIS) questionnaire. English version. Luxembourg: Eurostat; 2006 (http://ec.europa.eu/health/ph_information/implement/wp/systems/docs/ev_20070315_ehis_en.pdf).
22. National Institute for Health and Welfare (THL) and European Union. Implementation of the European health indicators – first years. Final report of the joint action for ECHIM. Helsinki: National Institute for Health and Welfare (THL); 2012 (www.echim.org/docs/Final_Report_I_2012.pdf).
23. ECHI indicator development and documentation. Joint action for ECHIM. Final report part II. Bilthoven: National Institute for Public Health and the Environment (RIVM); 2012 (www.echim.org/docs/Final_Report_II_2012.pdf).
24. Joint Action for European Community Health Indicators Monitoring (ECHIM) (2009-2012). Final report part III. ECHIM pilot data collection, analysis, and dissemination. Berlin: Robert Koch Institute; 2013 (www.echim.org/docs/Final_Report_III_2012.pdf).
25. Evaluation of the use and impact of the European Community health indicators ECHI by Member States. Final report. August 2013. Brussels, European Union, 2013 (http://ec.europa.eu/health/indicators/docs/echi_report_v20131031.pdf).
26. Description of the dataset. In: European Health Interview Survey (EHIS) [web site]. Luxembourg: Eurostat (http://ec.europa.eu/eurostat/web/microdata/european-health-interview-survey).
27. Morbidity statistics in the EU. Report on pilot studies. 2014 edition. Luxembourg: Eurostat; 2014 (http://ec.europa.eu/eurostat/en/web/products-statistical-working-papers/-/KS-TC-14-003).
28. Global Information System on Alcohol and Health (GISAH). In: Global Health Observatory Data Repository (European Region) [website]. Geneva: WHO; 2014 (http://apps.who.int/gho/data/view.main-euro?showonly=GISAH, accessed 1 February 2015).
29. European Health Examination Survey. Helsinki: National Institute for Health and Welfare Finland;
2013 (http://ec.europa.eu/chafea/projects/database.html?prjno=2005117).

46
30. Assessing national capacity for the prevention and control of Noncommunicable diseases.
Report of the 2010 Global Survey. Geneva: World Health Organization; 2012
(http://www.who.int/cancer/publications/national_capacity_prevention_ncds.pdf?ua=1).
31. Meeting report of the first high-level meeting of small countries. Implementing the health 2020
vision in countries with small populations. San Marino, 3-4 July 2014. Copenhagen: WHO
Regional Office for Europe; 2014
(http://www.euro.who.int/__data/assets/pdf_file/0005/259799/Meeting-report-of-the-First-
High-level-Meeting-of-Small-Countries.pdf?ua=1).
32. ISCED: International Standard Classification of Education. In: United Nations Educational,
Scientific and Cultural Association (UNESCO) [website]. Paris: UNESCO; 2014
(http://www.uis.unesco.org/Education/Pages/international-standard-classification-of-
education.aspx).
33. Action plan for implementation of the European Strategy for the Prevention and Control of
Noncommunicable Diseases 2012–2016. Copenhagen: WHO Regional Office for Europe; 2011
(EUR/RC61/12; http://www.euro.who.int/en/about-us/governance/regional-committee-for-
europe/past-sessions/sixty-first-session/documentation/working-documents/wd12-action-plan-
for-implementation-of-the-european-strategy-for-the-prevention-and-control-of-
noncommunicable-diseases-20122016).
34. AbouZahr C, Adjei S, Kanchanachitra A. From data to policy: good practices and cautionary tales.
The Lancet. 2007;369(9566):1039-46.
35. Walker N, Bryce J, Black RE. Interpreting health statistics for policymaking: the Story behind the
headlines. The Lancet. 2007;639(9565):956-63.
36. Mathers CD, Murray CJL, Ezzati M, Gakidou E, Salomon JA, Stein C. Population health metrics:
crucial inputs to the development of evidence for health policy. Population Health Metrics.
2003;1:6.
37. Trans-fatty acid content in food. Copenhagen: The Ministry of Food, Agriculture and Fisheries of
Denmark and the Danish Technical University, National Food Institute; 2014
(http://www.foedevarestyrelsen.dk/english/Food/Trans%20fatty%20acids/Pages/default.aspx).
38. Global action plan for the prevention and control of noncommunicable diseases, 2013-20.
Geneva: WHO; 2013
(http://apps.who.int/iris/bitstream/10665/94384/1/9789241506236_eng.pdf).
39. The National FINRISK study. In: Terveyden ja Hyvinvoinnin Laitos [website]. Helsinki: National
Institute for Health and Welfare; 2014 (http://www.thl.fi/fi/tutkimus-ja-
asiantuntijatyo/vaestotutkimukset/finriski-tutkimus/the-national-finrisk-study).

47
40. Mapping salt-reduction initiatives in the WHO European Region. Copenhagen: WHO Regional
Office for Europe; 2013
(http://www.euro.who.int/__data/assets/pdf_file/0009/186462/Mapping-salt-reduction-
initiatives-in-the-WHO-European-Region.pdf).
41. Baldissera S, Campostrini S, Binkin N, Minardi V, Minelli G, Ferrante G, et al. Features and initial
assessment of the Italian behavioral risk factor surveillance system (PASSI), 2007-2008. Prev
Chronic Dis. 2011;8(1).
42. Diabetes: a national public health priority 2015-2020. Valletta: Ministry of Health of the
Republic of Malta; 2014 (http://socialdialogue.gov.mt/en/Public_Consultations/MEH-
HEALTH/Documents/Diabetes%20%20A%20Public%20Health%20Priority%20final%20document.
pdf).
43. Norwegian Institute of Public Health [website]. Public health profiles for municipalities and
counties. Oslo: Norwegian Institute of Public Health; 2014
(http://www.fhi.no/artikler/?id=109337).
44. Norberg M et al. The Västerbotten Intervention Programme: background, design and
implications. Global health Action. 2010;3:4643.
45. HFSS advertising restrictions – final review. Statement published 26|07|10. In: Ofcom [website].
London: Ofcom; 2010 (http://stakeholders.ofcom.org.uk/market-data-research/other/tv-
research/hfss-final-review/)
46. Vienna Declaration on Nutrition and Noncommunicable Diseases in the Context of Health 2020.
Copenhagen: WHO Regional Office for Europe; 2013 http://www.euro.who.int/en/media-
centre/events/events/2013/07/vienna-conference-on-nutrition-and-noncommunicable-
diseases/documentation/vienna-declaration-on-nutrition-and-noncommunicable-diseases-in-
the-context-of-health-2020).
47. WHO European Childhood Obesity Surveillance Initiative (COSI). In: Nutrition [website].
Copenhagen: WHO Regional Office for Europe; 2014 (http://www.euro.who.int/en/health-
topics/disease-prevention/nutrition/activities/monitoring-and-surveillance/who-european-
childhood-obesity-surveillance-initiative-cosi).
48. Wijnhoven TMA, van Raaij JMA, Spinelli A, Rito AI, Hovengen R, Kunesova M et al. WHO
European Childhood Obesity Surveillance Initiative 2008: weight, height and body mass index in
6–9-year-old children. Pediatric Obesity. 2013;8:79–97.
49. Wijnhoven TMA, Raaij JMA, Spinelli A, Starc G, Hassapidou, M, Spiroski I, et al. WHO European
Childhood Obesity Surveillance Initiative: body mass index and level of overweight among 6–9-
year-old children from school year 2007/2008 to school year 2009/2010. BMC Public Health.
2014;14:806 (http://www.biomedcentral.com/1471-2458/14/806, accessed 1 February 2015).
50. Balicer RD, Shadmi E, Lieberman N et al. Reducing Health Disparities: Strategy Planning and
Implementation in Israel's Largest Health Care Organization. Health Services Research.
2011;46(4):1281-99 (http://www.ncbi.nlm.nih.gov/pmc/articles/PMC3165188/).

48
51. STEPS: A framework for surveillance. The WHO STEPwise approach to Surveillance of
noncommunicable diseases (STEPS). Geneva: WHO; 2003 (WHO/NMH/CCS/03.01;
http://www.who.int/ncd_surveillance/en/steps_framework_dec03.pdf).
52. The first national study on the prevalence of non-communicable disease risk factors in the
Republic of Moldova. The UN in Moldova Magazine. 2014;2(59):29-31
(file:///C:/Users/Anna/Downloads/rev_ONU_259_25-07-2014_pentru_WEB%20(1).pdf).
53. Alwan A, MacLean D, Riley LM et al. Monitoring and surveillance of chronic non-communicable
diseases: progress and capacity and high-burden countries. Lancet. 2010;376:1861-8
(http://www.thelancet.com/pdfs/journals/lancet/PIIS0140-6736(10)61853-3.pdf).
54. Understanding parental perceptions of immunisation in real-time. Jakarta: United Nations Global
Pulse, 2014 (http://www.unglobalpulse.org/immunisation-parent-perceptions).
55. Chunara R, Bouton L, Ayers JW, Brownstein JS. Assessing the online social environment for
surveillance of obesity prevalence. PLoS ONE. 2013;8(4)
(http://journals.plos.org/plosone/article?id=10.1371/journal.pone.0061373).
56. Kosinski M, Stillwell D, Graepel T. Private traits and attributes predict digital records of human
behavior. PNAS. 2013;110(15):5802-5 (http://www.pnas.org/content/110/15/5802.full).
57. De Choudhury M, Counts S, Horvitz E. Major life changes and behavioral markers in social
media: case of childbirth. In: CSCW’13: Proceedings of the 2013 conference on computer
supported cooperative work. New York: ACM; 2013.
58. Lenormand M, Louail T, Cant´u-Ros OG, Picornell M, Herranz R, Arias JM, et al. Influence of
sociodemographic characteristics on human mobility. arXiv:1411.7895v1 [physics.soc-ph]
(http://arxiv.org/abs/1411.7895).
59. FoodSwitch. In: The George Institute for Global Health Australia [website]. Sidney: The George
Institute for Global Health Australia; 2013
(http://www.georgeinstitute.org.au/projects/foodswitch).
60. Horanont T, Phithakkitnukoon S, Leong TW, Sekimoto Y, Shibasaki R. Weather effects on the
patterns of people’s everyday activities: a study using GPS traces of mobile phone users. PLOS
One. 2013;8(12) (http://www.ncbi.nlm.nih.gov/pmc/articles/PMC3867318/).
61. ProeHealth. Estonian electronic health record case study. Brussels: European Commission
(http://www.pro-ehealth.eu/casestudies/ProeHealth_Case_Report_Estonia_EHR.pdf, accessed 1
February 2015).
62. Karpati T, Cohen-Stavi CJ, Leibowitz M, Hoshen M, Feldman BS, Balicer RD. Towards a subsiding
diabetes epidemic: trends from a large population-based study in Israel. Popul Health Metr.
2014;12(1):32.
63. Reges O, Leibowitz M, Hoshen M, Rabi Y, Gluzman I, Cohen CJ, Balicer RD. Reduction in
myocardial infarction incidence: focus on socioeconomic disparities. Int J Cardiol.
2014;174(3):773-4.
49
64. Feldman BS, Cohen-Stavi CJ, Leibowitz M, Hoshen MB, Singer SR, Bitterman H et al. Defining the
role of medication adherence in poor glycemic control among a general adult population with
diabetes. PLoS One. 2014;9(9):e108145.
65. Singer SR, Hoshen M, Shadmi E, Leibowitz M, Flaks-Manov N, Bitterman H, Balicer RD. EMR-
based medication adherence metric markedly enhances identification of nonadherent patients.
Am J Manag Care. 2012;18(10):e372-7.
66. Balicer RD, Cohen CJ, Leibowitz M, Feldman BS, Brufman I, Roberts C, Hoshen M. Pneumococcal
vaccine targeting strategy for older adults: customized risk profiling. Vaccine. 2014;32(8):990-5.
67. Low M, Nitzan O, Bitterman H, Cohen C, Hammerman A, Lieberman N et al. Trends in outpatient
antibiotic use in Israel during the years 2000-2010: setting targets for an intervention. Infection.
2013;41(2):401-7.
68. Tufte E. The visual display of quantitative information. Cheshire, CT: Graphics Press, 2001.
69. Core health indicators in the WHO European Region. Special focus: Noncommunicable diseases.
Copenhagen: Regional Office for Europe; 2013
(http://www.euro.who.int/__data/assets/pdf_file/0019/216703/RC63-Core-Health-Indicators-
in-the-WHO-EURO-Eng.pdf?ua=1).
70. Gapminder Trendalyzer software. Stockholm: Stiftelsen Gapminder (http://www.gapminder.org)
71. Eurostat. Regions in the European Union Nomenclature of territorial units for statistics NUTS
2006 /EU-27. 2007 edition. Luxembourg: Office for Official Publications of the European
Communities; 2007 (http://ec.europa.eu/eurostat/documents/3859598/5902901/KS-RA-07-
020-EN.PDF/5aceb8d2-f395-4843-92e9-a2dbd6443f16?version=1.0).
72. Inequalities in health system performance and their social determinants in Europe. Interactive
atlases. In: Equity in health project [webpage]. Copenhagen: WHO Regional Office for Europe;
2013 (http://www.euro.who.int/en/data-and-evidence/equity-in-health-project/interactive-
atlases).
73. European Union Statistics on Income and Living Conditions (EU-SILC), In Eurostat [website].
Luxembourg: European Commission; 2015 (http://ec.europa.eu/geninfo/legal_notices_en.htm,
accessed 2 February 2015).
74. NCD Policy Academy. In: CINDI [website]. Kaunas, Lithuanian University of Health Sciences, 2012
(http://cindi.info/index.php?option=com_content&task=view&id=66&Itemid=139, accessed 11
February 2015).

50
Annexes
Annex 1. Overview of NCD indicators and their definitions from three indicator systems
in Europe
Indicator No.a ECHI definition No.b GMF definition Health2020 definition
Mortality 13 Age-standardized premature NCD mortality (cause-specific for: acute myocardial infarction (AMI), stroke, cancer, diabetes, asthma, COPD).
1 Unconditional probability of dying between ages 30 and 70 years from (combined) CVD (ICD-10: I00-I99), cancer
(C00-C97), diabetes
(E10-E14), or chronic respiratory diseases (J30-J98).
Age-standardized premature NCD mortality (cause-specific for: CVD (I00-I99), cancer (C00--
C97), diabetes (E10-E14), chronic respiratory diseases (J40-J47)).
Proposed: digestive diseases (K00-K93).
15 Death rates from combined, selected causes of death related to smoking, per 100 000 population (1).
- N/A N/A
16 Death rates from combined, selected causes of death related to alcohol use in people aged 15+, per 100 000 population (1).
5 Alcohol-related mortality among adults (15+) according to ICD-10: F10.1 - harmful use
of alcohol; F10. 2 - alcohol dependence during a given calendar year.
N/A
Morbidity
20 Total cancer incidence and incidence of the most important cancers, per 100 000 population (0-64, 65+): age standardized incidence rate calculated for the following 10 cancer-groups: (1) all cancers combined without non-melanoma skin (ICD10 codes C00-C97); (2) trachea, bronchus or
lung (C33-34); (3) breast (C50); (4)
colorectal (C18-C21); (5) prostate (C61); (6) stomach (C16); (7) melanoma (C43); (8) cervical (C53); (9) leukemias/lymphomas (C91-
C95).
2 Cancer incidence, by type of cancer, per 100 000 population.
N/A
24 AMI: age-standardized attack rate (non-fatal and fatal) (ICD-10 codes I21, I22) and coronary death (ICD-10 codes I20-I25) by sex, age
group 35-74, per 100 000
- N/A N/A

51
population.
25 Stroke: age-standardized attack rate (non-fatal and fatal, ICD-10 codes I60-I64) by sex, age group
35-84, per 100 000 population.
2 N/A N/A
67 Hospital in-patient discharges per 100 000 population (treatment episodes), cause-specific for: circulatory system (I00-I99); AMI
(I21-I22); stroke (I60-I69); cancer
(C00-D48 and site-specific), diabetes (E10-E14), respiratory
diseases (J00-J99), asthma (J45-
J46), COPD (J40-J44, J47).
- N/A N/A
N/A 5 Adults (15+ years) suffering from disorders attributable to consumption of alcohol (according to ICD-10: F10.1 - harmful use of alcohol; F10.2 - alcohol dependence) during a given calendar year.
N/A
Behavioural risk factors
Harmful use of alcohol
46 Total (recorded and unrecorded) adult (15+ years) per capita consumption.
3 Total (recorded and unrecorded) alcohol per capita (APC) (15+ years) consumption within a calendar year in litres of pure alcohol.
Total (recorded and unrecorded) per capita alcohol consumption among people aged 15 years and over within a calendar year (litres of pure alcohol), reporting recorded and unrecorded consumption separately, if possible.
47 Proportion of individuals reporting to having had an average rate of consumption of more than 20 grams pure alcohol daily for women and more than 40 grams daily for men (15-64, 65+ years).
4 Age-standardized prevalence of heavy episodic drinking.
N/A
N/A - N/A Heavy episodic drinking (60g/occasion at least weekly) among adolescents (15+ years).
Tobacco use
44 Proportion of people reported as smoking cigarettes daily (15-24, 25-64, 65+ years).
10 Age-standardized prevalence of current tobacco use among
persons aged 18+ years.
Adults (age-standardized prevalence of current tobacco use that includes daily, non-daily, or occasional use, 18+ years).
N/A 9 Prevalence of current tobacco use among
adolescents aged 13 to 17.
Prevalence of weekly tobacco use among adolescents.

52
Physical activity
N/A 6 Percentage of adolescents (aged 13 to 17) participating in less than 60 minutes of moderate to vigorous intensity physical activity daily.
N/A
52 Proportion of individuals reported as performing a certain period of time of health enhancing physical activity on an average day/at least X times per week (precise operationalization to be formulated) (15-64, 65+ years).
7 Age-standardized prevalence of insufficiently physically active (less than 150 minutes of moderate to vigorous intensity physical activity per week) persons aged 18+ years.
N/A
Biological risk factors
Blood pressure
43 Proportion of individuals reported as having been diagnosed with high blood pressure during the past 12 months. (25-64, 65+ years) (currently self-reported (EHIS), in future measured (EHES)).
11a) Age-standardized prevalence of raised blood pressure among persons aged 18+ years. Blood pressure must be measured, not self-reported.
N/A
N/A 11b) Age-standardized mean systolic blood pressure in persons aged 18+ years. Blood pressure must be measured, not self-reported.
N/A
Diabetes 21(A) Self-reported prevalence reported as having ever been diagnosed with diabetes and as having been affected by this condition during the past 12 months (15-64, 65+ years).
12 Age-standardized prevalence of raised blood glucose/diabetes among persons aged 18+ years or on medication for raised blood glucose. Fasting blood glucose must be measured, not self-reported, and measurements must be taken after the person has fasted for at least eight hours.
N/A
21(B) Register-based percentage of total population having ever been diagnosed with diabetes and having been affected by this condition during the past 12 months (15-64, 65+ years).
- N/A N/A
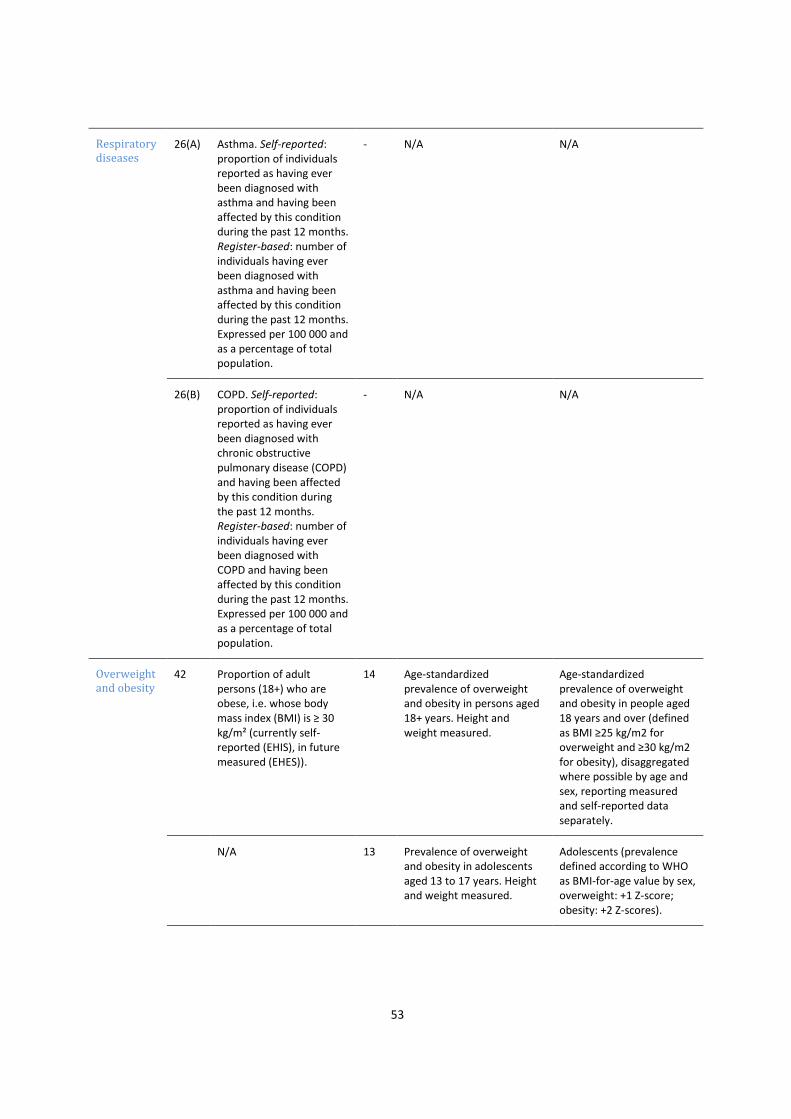
53
Respiratory diseases
26(A) Asthma. Self-reported: proportion of individuals reported as having ever been diagnosed with asthma and having been affected by this condition during the past 12 months. Register-based: number of individuals having ever been diagnosed with asthma and having been affected by this condition during the past 12 months. Expressed per 100 000 and as a percentage of total population.
- N/A N/A
26(B) COPD. Self-reported: proportion of individuals reported as having ever been diagnosed with chronic obstructive pulmonary disease (COPD) and having been affected by this condition during the past 12 months. Register-based: number of individuals having ever been diagnosed with COPD and having been affected by this condition during the past 12 months. Expressed per 100 000 and as a percentage of total population.
- N/A N/A
Overweight and obesity
42 Proportion of adult persons (18+) who are obese, i.e. whose body mass index (BMI) is ≥ 30 kg/m² (currently self-reported (EHIS), in future measured (EHES)).
14 Age-standardized prevalence of overweight and obesity in persons aged 18+ years. Height and weight measured.
Age-standardized prevalence of overweight and obesity in people aged 18 years and over (defined as BMI ≥25 kg/m2 for overweight and ≥30 kg/m2 for obesity), disaggregated where possible by age and sex, reporting measured and self-reported data separately.
N/A 13 Prevalence of overweight and obesity in adolescents aged 13 to 17 years. Height and weight measured.
Adolescents (prevalence defined according to WHO as BMI-for-age value by sex, overweight: +1 Z-score; obesity: +2 Z-scores).

54
Total cholesterol
N/A 17a) Age-standardized prevalence of raised total cholesterol (≥5.0 mmol/L) among persons aged 18+ years. Total cholesterol must be measured, not self-reported.
N/A
N/A 17b) Age-standardized mean total cholesterol among persons aged 18+ years. Total cholesterol must be measured, not self-reported.
N/A
Nutritional risk factors
Intake of fruits and vegetables
49 Proportion of people reported as eating fruits (excluding juice) at least once a day (15-24, 25-64, 65+ years).
16 Age-standardized prevalence of persons aged 18+ years consuming less than five total servings (400 grams) of fruit and vegetables per day.
N/A
50 Proportion of people reported as eating vegetables (excluding potatoes and juice) at least once a day (15-24, 25-64, 65+ years).
- See above. N/A
Intake of salt and fats
N/A 8 Age-standardized mean population intake of salt (sodium chloride) per day in grams in persons aged 18+ years.
N/A
N/A 15 Age-standardized mean proportion of total energy intake from saturated fatty acids in persons aged 18+ years.
N/A
Health services
Medication and therapy
74 Usage of medication for NCD (asthma, COPD, high blood pressure, CVD, diabetes) prescribed by a physician during the past 2 weeks (15-64, 65+ years).
18 Percentage of eligible persons (defined as aged 40 years and older with a 10-year CVD risk ≥30%, including those with existing CVD) receiving drug therapy and counselling (including glycaemic control) to prevent heart attacks and strokes.
N/A
84 Diabetes control (proportion of - N/A N/A

55
adult diabetics receiving appropriate care in terms of regular retinal exams). The topic needs further development.
N/A 19 Availability and affordability of quality, safe and efficacious essential NCD medicines, including generics, and basic technologies in both public and private facilities. Percentage of public and private primary health care facilities, which have all of the following available: medicines - at least aspirin, a statin, an angiotensin-converting enzyme inhibitor, a thiazide diuretic, a long acting calcium channel blocker, metformin, insulin, a bronchodilator and a steroid inhalant; technologies - at least a blood pressure measurement device, a weighing scale, blood sugar and blood cholesterol measurement devices with strips, and urine strips for albumin assay.
N/A
N/A 20 Access to palliative care assessed by morphine-equivalent consumption of strong opioid analgesics (excluding methadone) per death from cancer.
N/A
Vaccination 56 Percentage of infants reaching their (a) first and (b) second birthday in the given calendar year who have been fully vaccinated (including hepatitis B (Hep B)).
24 Vaccination coverage against Hep B virus monitored by number of third doses of Hep-B vaccine (HepB3) administered to infants.
N/A
N/A 22 Availability, as appropriate, if cost-effective and affordable, of vaccines against human papillomavirus, according to national programmes and policies.
N/A
Cancer screening
59 Proportion of women (aged 20-69) reported as having undergone a cervical cancer screening test within the past three years.
25 Proportion of women between the ages of 30 and 49 screened for cervical cancer at least once, or more often, and for lower or higher age groups according to national programmes or
N/A
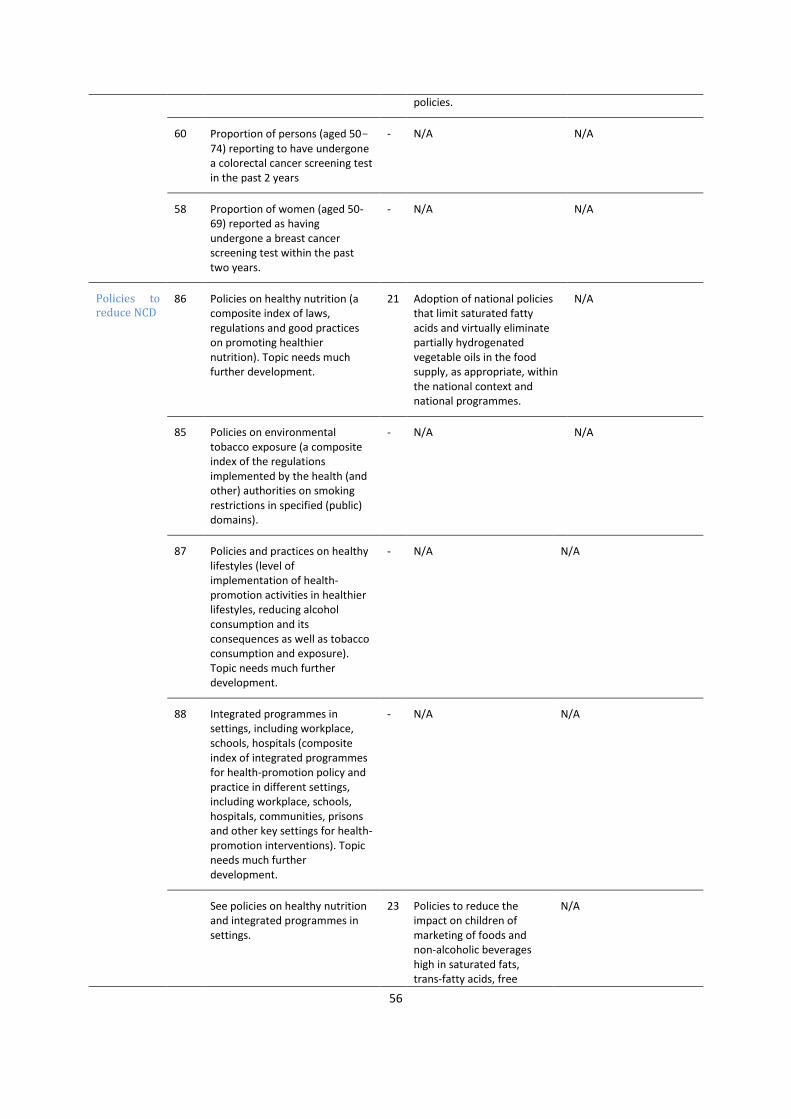
56
policies.
60 Proportion of persons (aged 50-74) reporting to have undergone a colorectal cancer screening test in the past 2 years
- N/A N/A
58 Proportion of women (aged 50-69) reported as having undergone a breast cancer screening test within the past two years.
- N/A N/A
Policies to reduce NCD
86 Policies on healthy nutrition (a composite index of laws, regulations and good practices on promoting healthier nutrition). Topic needs much further development.
21 Adoption of national policies that limit saturated fatty acids and virtually eliminate partially hydrogenated vegetable oils in the food supply, as appropriate, within the national context and national programmes.
N/A
85 Policies on environmental tobacco exposure (a composite index of the regulations implemented by the health (and other) authorities on smoking restrictions in specified (public) domains).
- N/A N/A
87 Policies and practices on healthy lifestyles (level of implementation of health-promotion activities in healthier lifestyles, reducing alcohol consumption and its consequences as well as tobacco consumption and exposure). Topic needs much further development.
- N/A N/A
88 Integrated programmes in settings, including workplace, schools, hospitals (composite index of integrated programmes for health-promotion policy and practice in different settings, including workplace, schools, hospitals, communities, prisons and other key settings for health-promotion interventions). Topic needs much further development.
- N/A N/A
See policies on healthy nutrition and integrated programmes in settings.
23 Policies to reduce the impact on children of marketing of foods and non-alcoholic beverages high in saturated fats, trans-fatty acids, free
N/A
57
sugars, or salt.
Notes: a
Numbering of indicators according to the ECHI shortlist (2); bNumbering of indicators according to the GMF
indicators (3)
References for Annex 1 1. Verschuuren M, Achterberg PW, Gijsen R, Harbers MM, Vijge E, Wilk EA Van D, Kramers PGN.
ECHI indicator development and documentation. Joint Action for ECHIM Final Report Part II (pp. 80-86). Bilthoven: ECHIM project partners; 2012 (.
2. Indicators. In: European Community Health Indicator Monitoring (ECHIM) [website]. Brussels: European Commission Directorate General for Health and Food Safety; 2014 (http://www.echim.org/indicators.html).
3. NCD Global Monitoring Framework [website]. Geneva: WHO; 2013 (http://www.who.int/nmh/global_monitoring_framework/en/). ..

58
Annex 2. Overview of databases and sources
International databases
European Health for All database (HFA-DB)
HFA-DB, established in the mid 1980s, is the central statistical database of the WHO Regional Office
for Europe. With the aim of supporting the monitoring of health trends in the Region, it is used as a
tool for assessing the health situations and trends in the 53 WHO European Member States and
comparing them in the international context. Part of the data is submitted by the Member States on
an annual basis. The technical units collect appropriate statistical information within their own fields.
Secondary information sources, such as other international organizations and agencies, are also
important sources of data for a number of HFA-DB indicators (1).
July 2010 update
In an effort to improve data quality and comparability, international organizations constantly review
their data sources and the methodologies used to produce health indicators, provide more recent
estimates and replace earlier time series. As a result of the latest HFA-DB update, there are major
differences in some of the indicators due to changes in either data sources or estimation methods,
or both. The following major changes should be noted.
In the alcohol-consumption-indicators time series, new estimates for populations aged 15 or
more have replaced estimates for total populations. The source is the European Information
System on Alcohol and Health.
The availability-of-nutrients-indicators time series has also been updated with newer estimates.
The source is the Food and Agriculture Organization of the United Nations (FAO).
European hospital morbidity database (HMDB)
HMDB contains data on hospital discharge detailed by diagnosis, age and sex, submitted by WHO
European Member States to the Regional Office. It is a unique tool for analysing and comparing
morbidity and hospital activity patterns at the international level. The main diagnosis, or reason for
hospital admission, is coded using one of the following disease-coding systems:
International Statistical Classification of Diseases and Related Health Problems, 10th Revision (ICD-10);
International Classification of Diseases, 9th Revision (ICD-9 );
International Shortlist for Hospital Morbidity Tabulation (ISHMT).
The data provided may contain some coding errors or be affected by specific national practices in
applying ICD codes for reasons for hospitalization. Users should keep this in mind when interpreting
differences in hospitalization rates between countries. It is important to note that the data relate to
individual treatment episodes and do not aggregate multiple episodes for the same condition for an
individual. Thus, multiple treatment episodes within one year are separate data points. National

59
practices also vary vis-à-vis the kind of hospital visits recorded as hospitalizations (for example, visits
to acute wards are sometimes recorded as hospitalizations and sometimes not) (2).
Eurostat
Eurostat, established in 1953 to meet the requirements of the coal and steel community, is the EU
statistical office, situated in Luxembourg. Over the years, its task broadened and, when the
European Community was founded in 1958, it became a Directorate-General (DG) of the European
Commission. Eurostat’s key role is to supply statistics to other DGs and data to the Commission and
other European institutions so that they can define, implement and analyse EU policies. Eurostat
statistics cover various health-related issues related to the different areas of life, including key
indicators on the functioning of health-care systems, namely:
health status (self-reported health and morbidity; functional and activity limitations; injuries);
health determinants (overweight and obesity; physical activity; dietary habits; risky behaviour,
such as tobacco and alcohol consumption);
health care (health-care expenditure; health-care resources (staff and facilities) and activities
(hospital and ambulatory services));
morbidity (diagnosis-specific morbidity (prevalence and incidence rates for defined diseases -
under development));
disability (prevalence; employment of disabled persons; barriers to the social integration of
disabled persons);
causes of death (national and regional mortality data by causes of death).
Eurostat consolidates the data and ensures they are comparable, using harmonized methodology. All
EU28 and EFTA Member States are covered (3).
Global Health Observatory (GHO)
GHO is the main health-statistics repository of WHO. It aims to facilitate access to country data and
statistics with the focus on comparable estimates and analyses for monitoring global, regional and
national situations and trends. Data are based on official registers and surveys in WHO Member
States (for example, the 2010 global survey to assess national capacity for the prevention and
control of NCD (4)). Where countries lack complete or reliable data, WHO sometimes makes
estimates on the basis of modelling (using data from other populations, for example, neighbouring
countries), available surveys and census sources. All EU28 and EFTA Member States are covered,
with the exception of Liechtenstein.
WHO European Database on Nutrition, Obesity and Physical Activity (NOPA)
The NOPA database compiles information, which allows WHO European Member States to monitor
progress on nutrition, diet, physical activity and obesity. It contains national and subnational
surveillance data, policy documents, information on policy action, and examples of good-practice
programmes and interventions.
As a monitoring tool, NOPA can stimulate policy-makers to identify gaps and needs in data collection
and policy development, or to demonstrate progress made in their fight against obesity. At present,

60
the database contains information on policy documents of the 53 WHO European Member States. It
will be continuously updated and expanded with data on the nutritional status, food consumption,
nutrient intake, physical-activity levels and policy implementation of each Member State
(information can be searched and viewed by country). This facilitates sharing information and
making comparisons across the Region. The NOPA database is one of the deliverables of the three-
year collaborative project between WHO and the EC Directorate-General for Health and Consumers,
which began in 2008 (2007WHO02) under the title, “Monitoring progress on improving nutrition and
physical activity and preventing obesity in the European Union”. The Regional Office manages the
NOPA database in close collaboration with information focal points and the WHO nutrition
counterparts in the countries (5).
International data sources
WHO European Childhood Obesity Surveillance Initiative (COSI)
COSI was set up as a response toDuring the WHO European Ministerial Conference on Counteracting
Obesity held in Istanbul, Turkey, on 15–17 November 2006, Member States recognized the need for
harmonized surveillance systems, providing measured and comparable data on rates of
overweight/obesity among primary-school children, which are essential for informing policy
development within the European Region, indicating trends and providing an insight into the impact
of action taken. COSI was set up as a response to this need. The importance of, and political
commitment to, such surveillance mechanisms were reinforced through the Vienna Declaration on
Nutrition and Noncommunicable Diseases in the Context of Health 2020 and the new European Food
and Nutrition Action Plan 2015–2020.
Countries participating in COSI routinely measure trends in overweight and obesity in primary school
children (6–9 years) in order to understand the progress of the epidemic in this population group,
make intercountry comparisons within the European Region and inform action to reverse the trend.
The COSI system does not aim to replace countries’ existing health, anthropometric and dietary
surveillance systems or those in the planning stages; on the contrary, the COSI approach has a strong
potential to be integrated into existing systems, if possible. Countries are expected to collect data
according to the COSI protocol, which allows each participating country to develop a system that fits
its local circumstances.
Twenty-four countries (and the number is increasing) are participating in COSI: Albania, Belgium,
Bulgaria, Croatia, Cyprus, Czech Republic, Greece, Hungary, Ireland, Italy, Kazakhstan, Latvia,
Lithuania, Malta, Norway, Poland, Portugal, Republic of Moldova, Romania, Slovenia, Spain, Sweden,
the former Yugoslav Republic of Macedonia and Turkey.
Prior to introducing COSI, the country identifies an institute, which will be responsible for the overall
national coordination and management of the system, and assigns a principal investigator as the
institute's authorized representative. The institute then signs a Collaboration Arrangement with the
WHO Regional Office for Europe describing the roles of the participating country and the Regional
Office, including data release and publication policies, principles, terms and procedures (6).

61
European School Survey Project on Alcohol and Other Drugs (ESPAD)
ESPAD is a collaborative effort of independent research teams in more than 40 European countries
and the largest cross-national research project on adolescent substance use in the world. ESPAD was
initiated due to the lack of comparable data on substance use among European teenagers. In order
to collect such data, a common methodological protocol was established in the early 1990s,
including a master questionnaire. For pragmatic reasons, it was decided to conduct the survey in
classrooms. The most important long-term objectives in are to monitor national trends and compare
them between countries and groups of countries. In order to do so, the survey is repeated every four
years, with 1995 as the starting point. The results of the fifth wave of data collection are presented
in the 2011 ESPAD Report (7); the next wave of data collection is planned for 2015. A database set
up for research purposes can be accessed on application (8).
WHO European Information System on Alcohol and Health (EISAH)
Indicators for alcohol consumption and related harm are provided by EISIAH to several databases.
EISAH contains data resulting from the collection of data through GISAH, as well as published and
fugitive data, providing a reference source of information for the regional epidemiological
surveillance of alcohol use, alcohol-related problems and for alcohol policies. EISAH brings together
a large amount of information about the key aspects of the alcohol situation and the consequences
of alcohol consumption in individual countries and, wherever possible, includes trends in alcohol
use. Information on national alcohol-control measures and policies has also been collected. In
addition to large databases maintained by international governmental or non-governmental
organizations, thousands of published sources were identified and consulted. The information
system is updated regularly (9).
The European Health Interview Survey (EHIS)
EHIS aims at harmonized measurement of the health status and lifestyles (health determinants) of,
and the use of health-care services by, EU citizens with a high degree of comparability among EU
Member States. It was developed in 2003-2006 through a process involving largely all EU Member
States. It consists of four modules on health status, health care, health determinants and
background variables. These modules may be implemented at the national level either as one
specific survey or as an element of an existing survey (for example, a national health interview
survey, a labour-force survey or a household survey).The final version of the questionnaire for the
first wave of EHIS was adopted by the EU Member States at the Working Group on Public Health
Statistics in November 2006 (10) and implemented during the period 2006-2009 under gentlemen's
agreement. It contained around 130 questions split among the four modules, covering the following
topics: background variables on demography and socio-economic status; health status; health care;
and health determinants. Seventeen countries were involved in the first wave of EHIS:
2006: Austria, Estonia
2007: Slovenia,
2008: Belgiuim, Bulgaria, Czech Republic, Cyprus, France, Latvia, Malta, Romania,
2009: Germany, Greece, Hungary, Poland, Slovakia, Spain.

62
Germany provided aggregated data. For breakdowns with a strata size of less than 20, the values
were marked as confidential (flag ~c). No data were received for Switzerland.
The indicators presented distribution percentages, which were calculated with different breakdowns
according to the indicator: sex, age group (10-years intervals: 15–24; 25–34; …; 75–84; 85 or over)
and educational attainment levels (International Standard Classification of Education level 2 (ISCED-
2), ISCED 3-4, ISCED 5-6); or sex, age group (18-44, 45-54, 55-64, 65-74, 75 or over) and income
quintiles. For example, 4.5% of Latvian women aged 25-34 were found to be obese (BMI equal to or
greater than 30). Records in which the values for age and sex were missing were excluded from the
calculation of indicators.
Most of the indicators were worked out for the population of 15+ years. Nevertheless, for some
specific indicators, frequencies were calculated on different populations: BMI was calculated for
adults only (18+) (11, 12); self-reported prevalence of high blood pressure was computed for people
aged 25+ (13); self-reported vaccination against influenza was computed for people aged 65+ (14);
self-reported breast examination by X-ray was computed for women aged 50-69 (15); self-reported
cervical smear test was computed for women aged 20-69 (16); and the self-reported colorectal
cancer screening test was computed for people aged 50-74 (17).
EHIS wave 2 is being conducted in all EU Member States between 2013 and 2015 and it is the aim to
disseminate the data in 2016.
EHIS data are available on the Eurostat website (18).
Global database on the Implementation of Nutrition Action (GINA)
GINA(19) is an interactive platform for sharing standardized information on nutrition policies and
action (commitments made, who is doing what, where, when, why and how, including lessons
learnt). Users can apply this tool in:
mapping nutrition policies and action;
linking policies and action to indicators of nutrition status;
monitoring the implementation of key nutrition-related action;
identifying overlapping and gaps;
share experiences in implementation practices.
GINA policy data
The GINA policy section tracks commitments to ensuring good nutrition made in policy and
legislative documents. The documents are sometimes specific to nutrition, such as, national nutrition
policies, vitamin A strategies, or codes of marketing breast-milk substitutes. Sometimes they are
broader in scope, as, for example, in health- or agriculture-sector strategies, or development plans.1
GINA action data
1 Further information available: https://extranet.who.int/nutrition/gina/en/about.

63
The GINA action section tracks action taken to improve nutrition as implemented through
programmes and interventions. The programmes are user-defined and can contain an unlimited
number of pre-defined nutrition actions, including both nutrition-specific and nutrition-sensitive
interventions. Pre-defined actions span from e.g. Feeding of low-birth-weight infants to
Implementation of maternity protection, and cover all age groups.1
Global Tobacco Surveillance System Data (GTSSData)
GTSSData houses and displays data from four tobacco-related surveys conducted around the world
(the Global Youth Tobacco Survey (GYTS), the Global School Personnel Survey (GSPS), the Global
Health Professions Student Survey (GHPSS), and the Global Adult Tobacco Survey (GATS)). The
purpose of GTSSData is to enhance the capacity of the countries to monitor tobacco use, guide
national tobacco-prevention and control programmes, and facilitate the comparison of tobacco-
related data at the national, regional, and global levels.
Global youth tobacco survey (GYTS)
In December 1998, the Tobacco Free Initiative convened a meeting in Geneva, Switzerland, with the
Centres for Disease Control and Prevention (CDC), the United Nations Children’s Fund (UNICEF), the
World Bank and representatives of countries in each of the six WHO regions. The meeting resulted in
the development by WHO and CDC of the Global Tobacco Surveillance System, which uses the Global
Youth Tobacco Survey (GYTS) as a data-collection mechanism. GYTS is school-based and designed to
enhance the capacity of countries to monitor tobacco use among youth and guide the
implementation and evaluation of tobacco-prevention and control programmes. GYTS uses a
standard methodology for constructing the sampling frame, selecting schools and classes, preparing
questionnaires, following consistent field procedures, and using consistent data-management
procedures for data processing and analysis. The information generated from GYTS can be used to
stimulate the development of tobacco-control programmes and can serve as a means of assessing
progress in meeting programme goals. In addition, GYTS data can be used to monitor progress
achieved in relation to seven of the WHO FCTC articles. GYTS comprises 56 "core" questions
designed for gathering data pertaining to the following seven domains: knowledge and attitudes of
young people towards cigarette smoking; prevalence of cigarette smoking and other forms of
tobacco use among young people; role of the media and advertising in connection with young
people’s use of cigarettes; access to cigarettes; tobacco-related school curricula; environmental
tobacco smoke; and cessation of cigarette smoking. The questionnaire also allows countries to insert
their own country-specific questions (20).
GYTS is conducted in 14 of the EU28 countries: Bulgaria, Croatia, Cyprus, Czech Republic, Estonia,
Greece, Hungary Italy, Lithuania, Luxembourg, Poland, Romania, Slovakia and Slovenia. The latest
available data are from 2008-2011.
Health Behaviour in School-aged Children (HBSC)
After conducting the HBSC survey, participating countries submit their data to the HBSC Data Bank,
which is based at the University of Bergen in Norway where the Norwegian Social Science Data
Services create and store an international data file. The file is restricted for the use of HBSC member
countries for a period of three years from the time of its completion. The final international data file

64
is produced 4-5 months after the deadline for submission of national data sets. Data can be
accessed via application by academics, international organizations, and public-sector researchers
working in relevant fields. HBSC data are available for the following periods: 1985-86, 1989-90,
1993-94, 1997-98, 2001-02, 2005-06 and 2009-10 (21).
International Agency for Research on Cancer (IARC)
The International Agency for Research on Cancer (IARC) is the specialized cancer agency of the
World Health Organization. The objective of the Agency is to promote international collaboration in
cancer research. It is interdisciplinary, bringing together skills in epidemiology, laboratory sciences
and biostatistics to identify the causes of cancer so that preventive measures may be adopted and
the burden of disease and associated suffering reduced. A significant feature of IARC is its expertise
in coordinating research across countries and organizations, which is facilitated by its independent
role as an international organization. IARC has an important role in describing the burden of cancer
worldwide, through cooperation with and the provision of assistance to cancer register, and in
monitoring geographical variations and trends over time (22). Data on cancer incidence in both
Eurostat and GHO are derived from IARC and its key publications, which include the series, Cancer
Incidence in Five Continents series (23, 24) and the Globocan project (25). The aim of Globocan (ref)
is to provide contemporary estimates of the incidence and prevalence of, and mortality from major
types of cancer, at national level, for 184 countries of the world. The Globocan estimates are
presented for 2012, separately for each sex. 1-, 3- and 5-year prevalence data are available for the
adult population only (ages 15 and over). The following is important to note.
1. These estimates are based on the most recent data available at IARC and on information
publically available on the Internet, but more recent figures may be available directly from local
sources.
2. Because sources of data are continuously improving in quality and extent, estimates may not be
truly comparable over time and care should be taken when comparing these estimates with
those published earlier. The observed differences may be the result of a change in methodology
and should not be interpreted as a time-trend effect (25).
In terms of cancer incidence, Greece and Hungary do not currently have data in Globocan, and only
regional data are available for Romania (Table 1).
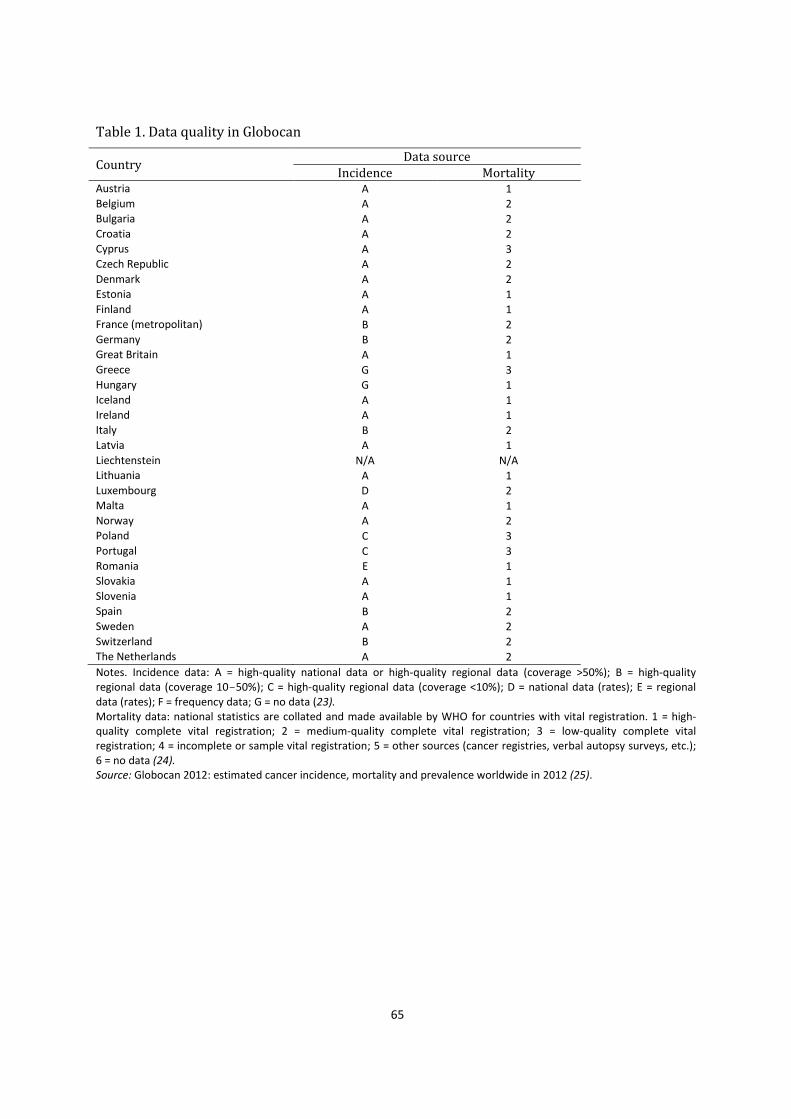
65
Table 1. Data quality in Globocan
Country Data source
Incidence Mortality Austria A 1 Belgium A 2 Bulgaria A 2 Croatia A 2 Cyprus A 3 Czech Republic A 2
Denmark A 2 Estonia A 1 Finland A 1 France (metropolitan) B 2 Germany B 2 Great Britain A 1 Greece G 3 Hungary G 1 Iceland A 1 Ireland A 1 Italy B 2 Latvia A 1
Liechtenstein N/A N/A Lithuania A 1 Luxembourg D 2 Malta A 1 Norway A 2 Poland C 3 Portugal C 3 Romania E 1 Slovakia A 1 Slovenia A 1 Spain B 2 Sweden A 2
Switzerland B 2 The Netherlands A 2
Notes. Incidence data: A = high-quality national data or high-quality regional data (coverage >50%); B = high-quality regional data (coverage 10-50%); C = high-quality regional data (coverage <10%); D = national data (rates); E = regional data (rates); F = frequency data; G = no data (23). Mortality data: national statistics are collated and made available by WHO for countries with vital registration. 1 = high-quality complete vital registration; 2 = medium-quality complete vital registration; 3 = low-quality complete vital registration; 4 = incomplete or sample vital registration; 5 = other sources (cancer registries, verbal autopsy surveys, etc.); 6 = no data (24). Source: Globocan 2012: estimated cancer incidence, mortality and prevalence worldwide in 2012 (25).

66
NCD Country Capacity Survey (NCD CCS)
NCD are currently responsible for over 60% of global deaths. This burden is one of the major public
health challenges facing all countries, regardless of their economic status. NCD threaten economic
and social development and, without concerted efforts at country level, are predicted to increase in
the coming decade. To respond to this burden, WHO conducts periodic assessment of national
capacity for NCD prevention and control through the use of a global survey in all Member States,
known as the NCD Country Capacity Survey (NCD CCS). Such periodic assessment allows countries
and WHO to monitor progress and achievements in expanding capacities to respond to the epidemic
of NCD.
The questionnaire covers the following topics: health-system infrastructure; funding; policies, plans
and strategies; surveillance; primary health care; and partnerships and multilateral collaboration; it
is completed by national NCD focal points or designated colleagues within ministries of health or
national institutes/agencies. Implementation of NCD CCS is managed collaboratively by WHO
headquarters and the six WHO regional offices. NCD CCSs were carried out in 2000, 2005, 2010 and
2013 (26).
UNICEF
UNICEF is the preferred data source for rates of vaccination against Hepatitis B (HepB3 vaccine) and
human papillomavirus (HPV) in infants. In an effort to strengthen collaboration and minimize the
reporting burden, WHO and UNICEF collect information relating to these areas jointly, using a
standard questionnaire (the Joint Reporting Form), which was developed through a consensus
process involving UNICEF and WHO staff and selected ministries of health. The form is sent to all
Member States for completion and the results include estimates of national immunization coverage,
and information about reported cases of vaccine-preventable disease (VPD), immunization
schedules, and indicators of immunization-system performance. These are available online in July of
the following year; the global summary of the WHO vaccine-preventable diseases: monitoring
system and the UNICEF immunization summary are published by December of the same year (27).
References pertinent to Annex 22
1. Health for all database [online database]. Copenhagen: WHO Regional Office for Europe; 2014
(http://data.euro.who.int/hfadb/).
2. European Hospital Morbidity Database (HM-DB) [online database]. Copenhagen: WHO Regional
Office for Europe; 2014 (http://data.euro.who.int/hmdb/).
3. Eurostat [website]. Luxembourg: European Commission; 2014 (http://ec.europa.eu/eurostat).
2 Unless otherwise indicated, all URLs accessed 26 January 2015.

67
4. Assessing national capacity for the prevention and control of Noncommunicable diseases.
Report of the 2010 Global Survey. Geneva: World Health Organization; 2012
(http://www.who.int/cancer/publications/national_capacity_prevention_ncds.pdf?ua=1).
5. WHO European Database on Nutrition, Obesity and Physical Activity (NOPA). Copenhagen: WHO
Regional Office for Europe; 2015 (http://data.euro.who.int/nopa/).
6. WHO European Childhood Obesity Surveillance Initiative (COSI). In: Nutrition [website].
Copenhagen: WHO Regional Office for Europe; 2014 (http://www.euro.who.int/en/health-
topics/disease-prevention/nutrition/activities/monitoring-and-surveillance/who-european-
childhood-obesity-surveillance-initiative-cosi).
7. Hibell B, Guttormsson U, Ahlstrom S, Balakireva O, Bjarnason T, Kokkevi A, Kraus L. The 2011
ESPAD Report. Substance Use Among Students in 36 European Countries. Stockholm: 2012
(http://www.espad.org/Uploads/ESPAD_reports/2011/The_2011_ESPAD_Report_FULL_2012_1
0_29.pdf).
8. The European School Survey project on Alcohol and Drugs (ESPAD) [website]. ESPAD; 2012
(http://www.espad.org/).
9. Global Health Observatory Data Repository (European Region) [website]. Geneva: WHO; 2014
(http://apps.who.int/gho/data/node.main-euro.GISAH?showonly=GISAH).
10. Eurostat, European Commission. Working Group "Public Health Statistics”, Luxembourg, 21-22
November 2006. Summary conclusions. Luxembourg: Directorate for Social Statistics and
Information Society; 2006 (Doc. ESTAT/F5/06/HEA/20;
http://ec.europa.eu/eurostat/documents/4187653/5771857/F5-WGM-20061122-
EN.PDF/9630dfdf-6516-4af8-8240-21ce3505fa35?version=1.0, accessed 1 February 2015).
11. Body mass index (BMI) by sex, age and educational attainment level (%). In: Eurostat Data Explorer [website]. Luxembourg: European Commission; 2014 (http://appsso.eurostat.ec.europa.eu/nui/show.do?dataset=hlth_ehis_de1&lang=en).
12. Body mass index (BMI) by sex, age and income quintile (%).(%). In: Eurostat Data Explorer [website]. Luxembourg: European Commission; 2014 (http://appsso.eurostat.ec.europa.eu/nui/show.do?dataset=hlth_ehis_de2&lang=en).
13. People reporting a chronic disease, by disease, sex, age and educational attainment level (%). In: Eurostat Data Explorer [website]. Luxembourg: European Commission; 2014 (http://appsso.eurostat.ec.europa.eu/nui/show.do?dataset=hlth_ehis_st1&lang=en).
14. Self-reported vaccination against influenza by sex, age and educational attainment level (%). In: Eurostat Data Explorer [website]. Luxembourg: European Commission; 2014 (http://appsso.eurostat.ec.europa.eu/nui/show.do?dataset=hlth_ehis_hc1&lang=en).
15. Self-reported breast examination by X-ray by educational attainment level among women aged 50-69 (%). In: Eurostat Data Explorer [website]. Luxembourg: European Commission; 2014 (http://appsso.eurostat.ec.europa.eu/nui/show.do?dataset=hlth_ehis_hc2).
16. Self-reported cervical smear test by educational attainment level among women aged 20-69 (%). In: Eurostat Data Explorer [website]. Luxembourg: European Commission; 2014 (http://appsso.eurostat.ec.europa.eu/nui/show.do?dataset=hlth_ehis_hc3&lang=en).

68
17. Self-reported colorectal cancer screening test by sex, age and educational attainment level
among people aged 50-74 (%). In: Eurostat Data Explorer [website]. Luxembourg: European Commission; 2014 (http://appsso.eurostat.ec.europa.eu/nui/show.do?dataset=hlth_ehis_hc4&).
18. Eurostat [website]. Luxembourg: European Commission; 2015 (http://epp.eurostat.ec.europa.eu/cache/ITY_SDDS/en/hlth_det_esms.htm).
19. Global database on the Implementation of Nutrition Action (GINA) [website]. Geneva: World Health Organization; 2012 (https://extranet.who.int/nutrition/gina/en/about, accessed 26 February 2015).
20. Global TobaccoSurveillance System Data (GTSSData) [website]. Atlanta, GA: Centers for Disease Control and Prevention; 2010 (http://nccd.cdc.gov/GTSSData/default/default.aspx, accessed 26 February 2015).
21. Survey data – data access forms. In: HBSC [website]. St Andrews: HBSC International
Coordinating Centre Child & Adolescent Health Research Unit
(http://www.hbsc.org/data/index.html).
22. Bray F, Ren JS, Masuyer E, Ferlay J. Estimates of global cancer prevalence for 27 sites in the adult
population in 2008. Int J Cancer. 2013;132(5):1133-45
23. Curado MP, Edwards B, Shin HR, Storm H, Ferlay J, Heanue M, Boyle P, editors. Cancer incidence
in five continents. Vol. IX. Lyon: International Agency for Research on Cancer; 2007 (IARC
Scientific Publications No. 160; http://www.iarc.fr/en/publications/pdfs-
online/epi/sp160/CI5vol9-A.pdf).
24. Forman D, Bray F, Brewster DH, GombeMbalawa C, Kohler B, Piñeros M et al, editors. Cancer
Incidence in Five Continents, Vol. X (electronic version). Lyon: International Agency for Research
on Cancer; 2013 (http://ci5.iarc.fr )
25. Globocan 2012: estimated cancer incidence, mortality and prevalence worldwide in 2012
[website]. Lyon: International Agency for Research on Cancer; 2012
(http://globocan.iarc.fr/Pages/DataSource_and_methods.aspx).
26. Assessing national capacity for the prevention and control of NCDs. In: Chronic diseases and
health promotion [website]. Geneva: World Health Organization; 2015
(http://www.who.int/chp/ncd_capacity/en/, accessed 26 February 2015).
27. WHO/UNICEF joint reporting process. In: Immunization, vaccines and biological [website].
Geneva: WHO; 2015
(http://www.who.int/immunization/monitoring_surveillance/routine/reporting/reporting/en/).

69
Annex 3. Comparative analysis of data availability per indicator The following tables provide a comparative analysis of data availability per indicator in the EU28 and
EFTA countries.
The names of the countries are indicated according to the International Organization for
Standardization (ISO) 3166 alpha-2 code3. Colour codes indicate the availability of the indicator,
as follows.
- data available as specified in the respective international database
- data available in the international database, but does not meet indicator definition
- data not available in international data bases
The monitoring frameworks involved (for example, ECHIM, Health 2020, GMF) and databases in
which the respective indicator can be found (for example Eurostat, GHO, HFA-DB) appear in
brackets.
Databases
Original and potential data sources
3 ISO 3166 Alpha-2 country codes – AT: Austria; BE: Belgium; BU: Bulgaria; CH: Switzerland; CY: Cyprus; CZ:
Czech Republic; DE: Germany; DK: Denmark; EE: Estonia; ES: Spain; FE: Finland; FR: France; GB: United Kingdom of Great Britain and Northern Ireland; GR: Greece; HR: Croatia; HU: Hungary; IE: Ireland; IS: Iceland; IT: Italy; LI: Liechtenstein; LT: Lithuania; LU: Luxembourg; LV: Latvia; MT: Malta; NL: Netherlands; NO: Norway; PL: Poland; PT: Portugal; RO: Romania; SE: Sweden; SI: Slovenia; SK: Slovakia. Source: Country codes – ISO 3166. In: ISO [website]. Geneva: International Organization for Standardization; 2015 (http://www.iso.org/iso/country_codes.htm, accessed 10 February 2015).
Statistical office of the European Union (Eurostat) Global Health Observatory (GHO) Database of the International Agency for Research on Cancer (IARC) (Globocan) European Health for All Database (HFA-DB) European hospital morbidity database (HMDB)
WHO European Childhood Obesity Surveillance Initiative (COSI) European Information System on Alcohol and Health (EISAH) European School Survey Project on Alcohol and Other Drugs (ESPAD) Food and Agriculture Organization of the United Nations (FAOSTAT) Global database on the Implementation of Nutrition Action (GINA) Global Youth Tobacco Survey (GYTS) Health Behaviour in School-aged Children (HBSC) NCD Country Capacity Survey (NCD CSS) WHO European Database on Nutrition, Obesity and Physical Activity NOPA) Tobacco Control Database for the WHO European Region (TCD) United Nations Children's Fund (UNICEF)

70
NCD mortality
1. Probability (%) of dying prematurely from NCD (GMF indicator in GHO)
Note: No disaggregation. Latest year available: 2012. Expected update: every 2-3 years.
2. Age-standardized premature NCD mortality (Health 2020 indicator in GHO)
Note. Not premature (30-70 years old) NCD mortality but all ages. Disaggregated by sex. Latest year available:
2012. Expected update every 2-3 years. Standardized NCD mortality by cause of death for 0-64 year-olds available in HFA-DB.
3. CVD mortality (ICD-10 Code: I00-I99) (ECHI indicator in Eurostat)
Note. Disaggregated by age and sex. Latest year available: 2011. Expected update: every 2 years.
4. AMI mortality (ICD-10 Code: I21-I22) (ECHI indicator in Eurostat)
Note. Disaggregated by age and sex. Latest year available: 2011. Expected update: every 2 years.
5. Cerebrovascular mortality (ICD-10 Code: I60-I69) (ECHI indicator in Eurostat)
Note. Disaggregated by age and sex. Latest year available: 2011. Expected update: every 2 years.
6. Chronic lower respiratory diseases mortality (ICD-10 Code: J40-J47) (ECHI indicator in Eurostat)
Note. Disaggregated by age and sex. Latest year available: 2011. Expected update: every 2 years.
7. Asthma mortality (ICD-10 Code: J45-J46)(ECHI indicator in Eurostat)
Note. Disaggregated by age and sex. Latest year available: 2011. Expected update: every 2 years.
8. COPD mortality (ICD-10 Code: J40-J44, J47) (ECHI indicator in Eurostat)
Note. Disaggregated by age and sex. Latest year available: 2011. Expected update: every 2 years.
9. Cancer mortality (ICD-10 Code: C00-C97) (ECHI indicator in Eurostat)
AT BE BG CH CY CZ DE DK EE ES FI FR GB GR HR HU
IE IS IT LI LT LU LV MT NL NO PL PT RO SE SI SK
AT BE BG CH CY CZ DE DK EE ES FI FR GB GR HR HU
IE IS IT LI LT LU LV MT NL NO PL PT RO SE SI SK
AT BE BG CH CY CZ DE DK EE ES FI FR GB GR HR HU
IE IS IT LI LT LU LV MT NL NO PL PT RO SE SI SK
AT BE BG CH CY CZ DE DK EE ES FI FR GB GR HR HU
IE IS IT LI LT LU LV MT NL NO PL PT RO SE SI SK
AT BE BG CH CY CZ DE DK EE ES FI FR GB GR HR HU
IE IS IT LI LT LU LV MT NL NO PL PT RO SE SI SK
AT BE BG CH CY CZ DE DK EE ES FI FR GB GR HR HU
IE IS IT LI LT LU LV MT NL NO PL PT RO SE SI SK
AT BE BG CH CY CZ DE DK EE ES FI FR GB GR HR HU
IE IS IT LI LT LU LV MT NL NO PL PT RO SE SI SK
AT BE BG CH CY CZ DE DK EE ES FI FR GB GR HR HU
IE IS IT LI LT LU LV MT NL NO PL PT RO SE SI SK
AT BE BG CH CY CZ DE DK EE ES FI FR GB GR HR HU
IE IS IT LI LT LU LV MT NL NO PL PT RO SE SI SK

71
Note. Disaggregated by age and sex. Latest year available: 2011. Expected update: every 2 years.
10. Cancer mortality site-specific (ECHI indicator in Eurostat)
Note. Disaggregated by age and sex. Latest year available: 2011. Expected update: every 2 years.
11. Diabetes mortality (ECHI indicator in Eurostat)
Note. Disaggregated by age and sex. Latest year available: 2011. Expected update: every 2 years.
12. Alcohol-related mortality (ECHI indicator in GHO)4
Note. This ECHI indicator is classified as work in progress. The availability of alcohol-attributable mortality is shown here. Data are disaggregated by sex. Latest year available: 2012. Expected update: periodically.
13. Smoking-related mortality (ECHI indicator in HFA-DB)5
Note. This ECHI indicator is classified as work in progress. The availability of standardized death rate is shown here. Data are available disaggregated by sex. Data presented for 2010; latest year available for some countries: 2012.
NCD morbidity
14. Cancer incidence, (total and site-specific, crude and age-standardized) (ECHI, GMF indicator in Globocan)
Note. Disaggregated by age and sex. Latest year available: 2012 (projected from 2008 data). Expected update:
continuously. Data quality for each country can be found in Annex 2.
15. AMI morbidity (register-based) (ECHI indicator)
16. Stroke morbidity (register-based) (ECHI indicator)
17. Hospital discharges (ECHI indicator in Eurostat)6
4 Alcohol-attributable fractions: alcohol-attributable fractions, all-cause deaths (%); alcohol-related mortality will be first
implemented in connection with the next EHIS based on an estimation methodology developed by the EU project, Optimizing delivery of health care interventions (ODHIN). 5 HFA-DB has mortality data for combined, selected causes of death known from the literature to be related to smoking. It
is a relatively rough indicator and is NOT an estimate of tobacco-attributable mortality, which is more complex and difficult to calculate.
AT BE BG CH CY CZ DE DK EE ES FI FR GB GR HR HU
IE IS IT LI LT LU LV MT NL NO PL PT RO SE SI SK
AT BE BG CH CY CZ DE DK EE ES FI FR GB GR HR HU
IE IS IT LI LT LU LV MT NL NO PL PT RO SE SI SK
AT BE BG CH CY CZ DE DK EE ES FI FR GB GR HR HU
IE IS IT LI LT LU LV MT NL NO PL PT RO SE SI SK
AT BE BG CH CY CZ DE DK EE ES FI FR GB GR HR HU
IE IS IT LI LT LU LV MT NL NO PL PT RO SE SI SK
AT BE BG CH CY CZ DE DK EE ES FI FR GB GR HR HU
IE IS IT LI LT LU LV MT NL NO PL PT RO SE SI SK
AT BE BG CH CY CZ DE DK EE ES FI FR GB GR HR HU
IE IS IT LI LT LU LV MT NL NO PL PT RO SE SI SK
AT BE BG CH CY CZ DE DK EE ES FI FR GB GR HR HU
IE IS IT LI LT LU LV MT NL NO PL PT RO SE SI SK

72
Note. Disaggregated by age and sex. Latest year available: 2011 (some countries 2012). Expected update: every 15 months.
18. Hospital discharges, by ICD-code (ECHI indicator in HMBD)
Note. Disaggregated by age, sex. Last complete year available: 2009, most countries for 2010, 2011, some for 2012. Latest update: 2013.
19. Alcohol-related morbidity (alcohol use disorders) (GMF indicator in GHO)
Note. Disaggregated by sex.
Behavioural risk factors
20. Adult per capita consumption (ECHI, GMF, Health 2020 indicators in HFA-DB, Eurostat and GHO)
Note. Original source: EISAH. Disaggregated by sex. Latest three-year coverage period available: 2008-2010.
Estimated tourist consumption and many other measures also available. Expected update: continuously.
21. Hazardous drinking, adolescents (Health 2020 indicator)
Note. Potential source disaggregated by sex: ESPAD. Currently not available in publicly accessible databases. Latest year available: 2011.
22. Heavy episodic drinking, adults (GMF indicator in GHO)
Note. Original source: EISAH. Disaggregated by sex. Latest year available: 2010. Expected update: every 3-5 years.
23. Heavy episodic drinking, adults (ECHI indicator in Eurostat)
Note. Original source: EHIS. Disaggregated by age, sex, education, binge-drinking frequency. Latest year available: 2008. Expected update: every 5 years.
24. Tobacco use, adolescents (any tobacco product) (GMF indicator in GHO)
6 Hospital in-patient discharges per 100 000 population (treatment episodes), cause-specific for: circulatory system (I00-
I99); AMI (I21-I22); stroke (I60-I69); cancer (C00-D48 and site-specific), diabetes (E10-E14), respiratory diseases (J00-
J99), asthma (J45-J46), COPD (J40-J44, J47). Details about the disease groups included can be found in: ECHI indicator development and documentation. Joint action for ECHIM. Final report part II. Bilthoven: National Institute for Public Health and the Environment (RIVM); 2012:211-219 (www.echim.org/docs/Final_Report_II_2012.pdf, accessed 1 February 2015).
AT BE BG CH CY CZ DE DK EE ES FI FR GB GR HR HU
IE IS IT LI LT LU LV MT NL NO PL PT RO SE SI SK
AT BE BG CH CY CZ DE DK EE ES FI FR GB GR HR HU
IE IS IT LI LT LU LV MT NL NO PL PT RO SE SI SK
AT BE BG CH CY CZ DE DK EE ES FI FR GB GR HR HU
IE IS IT LI LT LU LV MT NL NO PL PT RO SE SI SK
AT BE BG CH CY CZ DE DK EE ES FI FR GB GR HR HU
IE IS IT LI LT LU LV MT NL NO PL PT RO SE SI SK
AT BE BG CH CY CZ DE DK EE ES FI FR GB GR HR HU
IE IS IT LI LT LU LV MT NL NO PL PT RO SE SI SK
AT BE BG CH CY CZ DE DK EE ES FI FR GB GR HR HU
IE IS IT LI LT LU LV MT NL NO PL PT RO SE SI SK
AT BE BG CH CY CZ DE DK EE ES FI FR GB GR HR HU
IE IS IT LI LT LU LV MT NL NO PL PT RO SE SI SK

73
Note. Original source: GYTS. Disaggregated by sex. Latest year available: 2010. Expected update: continuously.
25. Tobacco use, adolescents (Health2020 indicator)
Note. Potential source: HBSC. Disaggregated by age and sex. Not currently available in publicly accessible databases.
26. Tobacco use, adults (proportion daily cigarette smokers) (ECHI indicator in Eurostat)
Note. Original source: EHIS. Disaggregated by age, sex, education, income, number of cigarettes smoked daily. Latest year available: 2008. Expected update: every 5 years.
27. Tobacco use, adults(currently any tobacco product) (GMF, Health 2020 indicator in GHO)
Note. Disaggregated by sex. Age limit is 15+ years, not 18+ years. Latest year available: 2011. Expected update: continuously.
28. Physical inactivity, adults (ECHI indicator in Eurostat)
Note. Original source: EHIS. Disaggregated by age, sex, education. Latest year available: 2008. Expected update: every 5 years.
29. Physical inactivity, adolescents (GMF indicator)
Potential data source: HBSC. Not currently available in publicly accessible databases.
30. Physical inactivity, adults (age-standardized) (GMF indicator in GHO)
Note. Disaggregated by sex. Age limit is 15+ years, not 18+ years. Latest year available: 2008. Expected update not stated.
Biological risk factors
31. Raised blood glucose/diabetes (measured or on medication, age-standardized) (GMF indicator in GHO)
Note. Disaggregated by sex. Age limit: 25+ years, not 18+ years. Latest year available: 2008. Expected update: not stated.
32. Diabetes prevalence (self-reported having ever been diagnosed and affected in last 12 months) (ECHI indicator in Eurostat)
AT BE BG CH CY CZ DE DK EE ES FI FR GB GR HR HU
IE IS IT LI LT LU LV MT NL NO PL PT RO SE SI SK
AT BE BG CH CY CZ DE DK EE ES FI FR GB GR HR HU
IE IS IT LI LT LU LV MT NL NO PL PT RO SE SI SK
AT BE BG CH CY CZ DE DK EE ES FI FR GB GR HR HU
IE IS IT LI LT LU LV MT NL NO PL PT RO SE SI SK
AT BE BG CH CY CZ DE DK EE ES FI FR GB GR HR HU
IE IS IT LI LT LU LV MT NL NO PL PT RO SE SI SK
AT BE BG CH CY CZ DE DK EE ES FI FR GB GR HR HU
IE IS IT LI LT LU LV MT NL NO PL PT RO SE SI SK
AT BE BG CH CY CZ DE DK EE ES FI FR GB GR HR HU
IE IS IT LI LT LU LV MT NL NO PL PT RO SE SI SK
AT BE BG CH CY CZ DE DK EE ES FI FR GB GR HR HU
IE IS IT LI LT LU LV MT NL NO PL PT RO SE SI SK
AT BE BG CH CY CZ DE DK EE ES FI FR GB GR HR HU
IE IS IT LI LT LU LV MT NL NO PL PT RO SE SI SK

74
Note. Original source: EHIS. Disaggregated by age, sex, education. Latest year available: 2008. Expected update: every 5 years.
33. Diabetes prevalence, register-based (ECHI indicator)
34. Asthma, self-reported (ECHI indicator in Eurostat)
Note. Original source: EHIS. Disaggregated by age, sex, education. Latest year available: 2008. Expected update: every 5 years.
35. Asthma, register-based (ECHI indicator)
36. COPD, self-reported (ECHI indicator in Eurostat)
Note. Original source: EHIS. Disaggregated by age, sex, education. Latest year available: 2008. Expected update every 5 years.
37. COPD, register-based (ECHI indicator)
38. Raised blood pressure (measured, age-standardized) (GMF indicator in GHO)
Note. Disaggregated by sex. Age limit: 25+ years, not 18+ years. Latest year available: 2008. Expected update: not stated.
39. Mean blood pressure (measured, age-standardized) (GMF indicator in GHO)
Note. Disaggregated by sex. Age limit: 25+ years, not 18+ years. Latest year available: 2009. Expected update: not stated.
40. Hypertensive diseases, self-reported (ECHI indicator in Eurostat)
Note. Original source: EHIS. Disaggregated by age, sex, education. Latest year available: 2008. Expected update: every 5 years.
41. Overweight and obesity, adults (ECHI indicator in Eurostat)
AT BE BG CH CY CZ DE DK EE ES FI FR GB GR HR HU
IE IS IT LI LT LU LV MT NL NO PL PT RO SE SI SK
AT BE BG CH CY CZ DE DK EE ES FI FR GB GR HR HU
IE IS IT LI LT LU LV MT NL NO PL PT RO SE SI SK
AT BE BG CH CY CZ DE DK EE ES FI FR GB GR HR HU
IE IS IT LI LT LU LV MT NL NO PL PT RO SE SI SK
AT BE BG CH CY CZ DE DK EE ES FI FR GB GR HR HU
IE IS IT LI LT LU LV MT NL NO PL PT RO SE SI SK
AT BE BG CH CY CZ DE DK EE ES FI FR GB GR HR HU
IE IS IT LI LT LU LV MT NL NO PL PT RO SE SI SK
AT BE BG CH CY CZ DE DK EE ES FI FR GB GR HR HU
IE IS IT LI LT LU LV MT NL NO PL PT RO SE SI SK
AT BE BG CH CY CZ DE DK EE ES FI FR GB GR HR HU
IE IS IT LI LT LU LV MT NL NO PL PT RO SE SI SK
AT BE BG CH CY CZ DE DK EE ES FI FR GB GR HR HU
IE IS IT LI LT LU LV MT NL NO PL PT RO SE SI SK
AT BE BG CH CY CZ DE DK EE ES FI FR GB GR HR HU
IE IS IT LI LT LU LV MT NL NO PL PT RO SE SI SK
AT BE BG CH CY CZ DE DK EE ES FI FR GB GR HR HU
IE IS IT LI LT LU LV MT NL NO PL PT RO SE SI SK

75
Note. Original source: EHIS. Disaggregated by age, sex, education, income. Latest year available: 2008. Expected update every 5 years.
42. Overweight and obesity (measured), adolescents (GMF, Health 2020 indicators)
Note. Potential data sources: HBSC (self-reported); COSI (measured). Not currently available in publicly accessible databases.
43. Overweight and obesity, adults (measured, age-standardized) (GMF, Health 2020 indicators in GHO)
Note. Disaggregated by sex, overweight, obesity. Age limit is 20+ years, not 18+ years. Last year available: 2008. Expected update not stated.
44. Raised cholesterol (measured, ≥5.0 mmol/L) (GMF indicator in GHO)
Note. Disaggregated by sex. Age limit is 25+ years, not 18+ years. Last year available: 2008. Expected update not stated.
45. Mean cholesterol (measured) (GMF indicator in GHO)
Note. Disaggregated by sex. Age limit is 25+ years, not 18+ years. Last year available: 2009. Expected update not stated.
Nutritional risk factors
46. Fruit consumption (ECHI indicator in Eurostat)
Note. Original source: EHIS. Disaggregated by age, sex, education, frequency of intake up to twice a day. Last year available: 2008. Expected update every 5 years.
47. Vegetable consumption (ECHI indicator in Eurostat)
Note. Original source: EHIS. Disaggregated by age, sex, education, frequency of intake up to twice a day. Last year available: 2008. Expected update every 5 years.
48. Low fruit and vegetable consumption (GMF indicator)
Note. Only aggregated data available based on data from FAOSTAT (average amount per person per year from sales data).
49. Salt intake (GMF indicator)
AT BE BG CH CY CZ DE DK EE ES FI FR GB GR HR HU
IE IS IT LI LT LU LV MT NL NO PL PT RO SE SI SK
AT BE BG CH CY CZ DE DK EE ES FI FR GB GR HR HU
IE IS IT LI LT LU LV MT NL NO PL PT RO SE SI SK
AT BE BG CH CY CZ DE DK EE ES FI FR GB GR HR HU
IE IS IT LI LT LU LV MT NL NO PL PT RO SE SI SK
AT BE BG CH CY CZ DE DK EE ES FI FR GB GR HR HU
IE IS IT LI LT LU LV MT NL NO PL PT RO SE SI SK
AT BE BG CH CY CZ DE DK EE ES FI FR GB GR HR HU
IE IS IT LI LT LU LV MT NL NO PL PT RO SE SI SK
AT BE BG CH CY CZ DE DK EE ES FI FR GB GR HR HU
IE IS IT LI LT LU LV MT NL NO PL PT RO SE SI SK
AT BE BG CH CY CZ DE DK EE ES FI FR GB GR HR HU
IE IS IT LI LT LU LV MT NL NO PL PT RO SE SI SK
AT BE BG CH CY CZ DE DK EE ES FI FR GB GR HR HU
IE IS IT LI LT LU LV MT NL NO PL PT RO SE SI SK

76
50. Saturated fat intake (GMF indicator)
Note. Only aggregated data available based on data from FAOSTAT (average amount per person per year from sales data).
Health services
51. Usage of medication for NCDs, self-reported (ECHI indicator in Eurostat)
Note. Original source: EHIS. Disaggregated by age, sex, education. Last year available: 2008. Expected update every 5 years.
52. Diabetes control (ECHI indicator)
53. Drug therapy and counselling to prevent heart attacks and stroke, including glycaemic control (GMF)
54. Essential medicines and technologies for NCD (GMF indicator)
Note. Only general availability (yes/no) available from NCD CCS (WHO),last conducted in 2013.
55. Palliative care (GMF indicator)
Note. Only general availability (yes/no) available from NCD CCS (WHO), last conducted in 2013.
56. Vaccination for HPV (GMF indicator)
Note. Potential source: annual WHO and UNICEF estimates of national immunization coverage (WUENIC)
reports, WHO-UNICEF joint reporting form.
57. Vaccination for Hep B (ECHI, GMF indicators in GHO)
Note. Original source: Annual WUENIC reports, WHO-UNICEF Joint Reporting Form.
58. Cervical cancer screening (ECHI indicator in Eurostat)
Note. Original source: EHIS. Disaggregated by education. Last year available: 2008. Expected update every 5 years.
59. Cervical cancer screening (GMF indicator in Eurostat)
AT BE BG CH CY CZ DE DK EE ES FI FR GB GR HR HU
IE IS IT LI LT LU LV MT NL NO PL PT RO SE SI SK
AT BE BG CH CY CZ DE DK EE ES FI FR GB GR HR HU
IE IS IT LI LT LU LV MT NL NO PL PT RO SE SI SK
AT BE BG CH CY CZ DE DK EE ES FI FR GB GR HR HU
IE IS IT LI LT LU LV MT NL NO PL PT RO SE SI SK
AT BE BG CH CY CZ DE DK EE ES FI FR GB GR HR HU
IE IS IT LI LT LU LV MT NL NO PL PT RO SE SI SK
AT BE BG CH CY CZ DE DK EE ES FI FR GB GR HR HU
IE IS IT LI LT LU LV MT NL NO PL PT RO SE SI SK
AT BE BG CH CY CZ DE DK EE ES FI FR GB GR HR HU
IE IS IT LI LT LU LV MT NL NO PL PT RO SE SI SK
AT BE BG CH CY CZ DE DK EE ES FI FR GB GR HR HU
IE IS IT LI LT LU LV MT NL NO PL PT RO SE SI SK
AT BE BG CH CY CZ DE DK EE ES FI FR GB GR HR HU
IE IS IT LI LT LU LV MT NL NO PL PT RO SE SI SK
AT BE BG CH CY CZ DE DK EE ES FI FR GB GR HR HU
IE IS IT LI LT LU LV MT NL NO PL PT RO SE SI SK

77
Note. This indicator is similar to the ECHI indicator; however, the specified age range differs.
60. Colon cancer screening (ECHI indicator in Eurostat)
Note. Original source: EHIS. Disaggregated by education. Last year available: 2008. Expected update every 5 years.
61. Breast cancer screening (ECHI indicator in Eurostat)
Note. Original source: EHIS. Disaggregated by education. Last year available: 2008. Expected update every 5 years.
62. Policy: marketing to children (GMF indicator)
Note. Only general availability (yes/no) available from NCD CCS (WHO), last conducted in 2013.
63. Policy: elimination of trans-fats (GMF indicator)
Note. Only general availability (yes/no) available from NCD CCS (WHO), last conducted in 2013.
64. Policy: environmental tobacco exposure (ECHI indicator in GHO)
Note. Original source: TDC.
65. Policy: healthy nutrition (ECHI indicator)
Note. Potential sources: NOPA, GINA. This topic needs much further development.
66. Policy: healthy lifestyles (ECHI indicator)
Note. This topic needs much further development.
67. Policy: Integrated programs in settings (ECHI indicator)
Note. This topic needs much further development.
AT BE BG CH CY CZ DE DK EE ES FI FR GB GR HR HU
IE IS IT LI LT LU LV MT NL NO PL PT RO SE SI SK
AT BE BG CH CY CZ DE DK EE ES FI FR GB GR HR HU
IE IS IT LI LT LU LV MT NL NO PL PT RO SE SI SK
AT BE BG CH CY CZ DE DK EE ES FI FR GB GR HR HU
IE IS IT LI LT LU LV MT NL NO PL PT RO SE SI SK
AT BE BG CH CY CZ DE DK EE ES FI FR GB GR HR HU
IE IS IT LI LT LU LV MT NL NO PL PT RO SE SI SK
AT BE BG CH CY CZ DE DK EE ES FI FR GB GR HR HU
IE IS IT LI LT LU LV MT NL NO PL PT RO SE SI SK
AT BE BG CH CY CZ DE DK EE ES FI FR GB GR HR HU
IE IS IT LI LT LU LV MT NL NO PL PT RO SE SI SK
AT BE BG CH CY CZ DE DK EE ES FI FR GB GR HR HU
IE IS IT LI LT LU LV MT NL NO PL PT RO SE SI SK
AT BE BG CH CY CZ DE DK EE ES FI FR GB GR HR HU
IE IS IT LI LT LU LV MT NL NO PL PT RO SE SI SK
AT BE BG CH CY CZ DE DK EE ES FI FR GB GR HR HU
IE IS IT LI LT LU LV MT NL NO PL PT RO SE SI SK