Embed Size (px)
Citation preview

United StatesDepartment ofAgriculture
Forest Service
Pacific Nor thwestResearch Station
United StatesDepartment of theInterior
Bureau of LandManagement
General TechnicalReportPNW-GTR-382September 1996
Integrated Scientific Assessmentfor Ecosystem Managementin the Interior Columbia Basin
And Portions of the Klamath and Great Basins

Interior Columbia Basin Ecosystem Management Project
This is not a NEPA decision document
United States United StatesDepartment of DepartmentAgriculture of the Interior
Forest Service Bureau of LandManagement

Integrated Scientific Assessment forEcosystem Management
in the Interior Columbia Basin
And Portions of the Klamath and Great Basins
Thomas M. Quigley, Richard W. Haynes,and Russell T. Graham
Technical Editors
Thomas M. Quigley is a range scientist at the Pacific Northwest Research Station, Walla Walla, WA 99362;Richard W. Haynes is a research forester at the Pacific Northwest Research Station, Portland, OR 97208;
Russell T. Graham is a research forester at the Intermountain Research Station, Moscow, ID 83843.
September 1996United States Department of Agriculture
Forest ServicePacific Northwest Research Station
Portland, Oregon

ii
AbstractQuigley, Thomas M.; Haynes, Richard W.; Graham, Russell T., tech. eds. 1996. Integrated
scientific assessment for ecosystem management in the interior Columbia basin andportions of the Klamath and Great Basins. Gen. Tech. Rep. PNW-GTR-382.Portland, OR: U.S. Department of Agriculture, Forest Service, Pacific NorthwestResearch Station. 303 p. (Quigley, Thomas M., tech. ed. The Interior Columbia BasinEcosystem Management Project: Scientific Assessment.)
The Integrated Scientific Assessment for Ecosystem Management for the InteriorColumbia Basin links landscape, aquatic, terrestrial, social, and economic character-izations to describe biophysical and social systems. Integration was achieved througha framework built around six goals for ecosystem management and three differentviews of the future. These goals are: maintain evolutionary and ecological processes;manage for multiple ecological domains and evolutionary timeframes; maintainviable populations of native and desired non-native species; encourage social andeconomic resiliency; manage for places with definable values; and, manage to main-tain a variety of ecosystem goods, services, and conditions that society wants. Ratingsof relative ecological integrity and socioeconomic resiliency were used to make broadstatements about ecosystem conditions in the Basin. Currently in the Basin highintegrity and resiliency are found on 16 and 20 percent of the area, respectively. Lowintegrity and resiliency are found on 60 and 68 percent of the area. Different ap-proaches to management can alter the risks to the assets of people living in the Basinand to the ecosystem itself. Continuation of current management leads to increasingrisks while management approaches focusing on reserves or restoration result intrends that mostly stabilize or reduce risks. Even where ecological integrity is pro-jected to improve with the application of active management, population increasesand the pressures of expanding demands on resources may cause increasing trends inrisk.
Keywords: Ecosystem assessment, management and goals; ecological integrity; socio-economic resiliency; risk management

iii
PrefaceThis document summarizes much of the work of the Science Integration Team (SIT) ofthe Interior Columbia Basin Ecosystem Management Project (ICBEMP). The backgroundinvestigations that underlie this report are described in three other documents. The first isa Framework for Ecosystem Management (Haynes and others 1996); the second is the com-pilation of detailed reports from each science team staff, referred to as the Assessment ofEcosystem Components (Quigley and Arbelbide 1996); and, the third document is theEvaluation of the Environmental Impact Statement Alternatives by the Science IntegrationTeam (Quigley and others 1996b). These reports supply the detailed information used bythe Science Integration Team to assemble the integrated assessment.
The specific content of this Integrated Assessment was written primarily by Thomas M.Quigley, Richard W. Haynes, Russell T. Graham, James R. Sedell, Danny C. Lee, Bruce G.Marcot, Paul F. Hessburg, Steven F. McCool, Bruce E. Reiman, Wendel J. Hann, James A.Burchfield, Michael G. Karl, Amy L. Horne, Thomas P. Frost, John F. Lehmkuhl, IrisGoodman, and Christopher E. DeForest.
All members of the Science Integration Team participated in the discussions and contrib-uted to the writing of two early versions of this report. Christopher E. DeForest helpedwrite the final Current Status section. Three subsequent drafts were written by the techni-cal editors based on review comments of the earlier drafts and intensive work by severalgroups of SIT members who developed concepts related to and estimates of integrity,resiliency, and risk ratings. James R. Sedell, Danny C. Lee, Paul F. Hessburg, Bruce E.Reiman, Mark E. Jensen, Kenneth C. Brewer, Bradley G. Smith, J.L. Jones, and Wendel J.Hann developed the ecological integrity elements and the forest and range clusters. Thematerial related to composite ecological integrity was developed by James R. Sedell, DannyC. Lee, Richard S. Holthausen, Bruce G. Marcot, Wendel J. Hann, J.L. Jones, and Tho-mas M. Quigley. Richard W. Haynes, Amy L. Horne, and James A. Burchfield developedmeasures of socioeconomic resiliency. Richard W. Haynes, Wendel J. Hann, and ThomasM. Quigley developed the risk ratings for ecological integrity and risk to human assetsfrom conditions in wildlands.
Content concerning American Indian Tribes originated from SIT Social Science Staff andthe Tribal Liaison Group of the Project (specifically, Richard Hanes, Mary Keith, andRalph Perkins). Content concerning management options originated from the Project’s EISTeams under the leadership of Jeff Blackwood, Steve Mealey, and Pat Geehan. Literallyhundreds of individuals contributed to this product. We are certain to have failed in recog-nizing everyone’s contribution. We apologize for any oversights.

iv
The SIT Members Making SpecificContributions to This Document Include:Aquatics: James R. Sedell, Danny C. Lee, Bruce E. Reiman,
Kristine M. Lee, Lynn Decker, Russell F. Thurow,Jack E. Williams
Economics: Richard W. Haynes, Amy L. Horne,Nicholas E. Reyna
Landscape Ecology: Wendel J. Hann, Paul F. Hessburg, Mark E. Jensen,Iris Goodman, Thomas P. Frost, Carl L. Almquist,J.L. Jones, Kenneth C. Brewer, Bradley G. Smith
Social Science: Steven F. McCool, James A. Burchfield,Jon S. Bumstead, Steven J. Galliano,Stewart D. Allen, Richard C. Hanes
Terrestrial Ecology: Bruce G. Marcot, John F. Lehmkuhl,Michael G. Karl, Richard S. Holthausen,Martin G. Raphael
Spatial Analysis: Rebecca A. Gravenmier

v
Team LeadersArbelbide, Sylvia J., Geologist
USDA Forest Service, Pacific Southwest Region, Minerals Area Management Director, SanFrancisco, CA.
Graham, Russell T., Research ForesterUSDA Forest Service, Intermountain Research Station, Forestry Sciences Laboratory, Moscow, ID.
*Quigley, Thomas M., Range ScientistUSDA Forest Service, Pacific Northwest Research Station, Interior Columbia Basin Ecosystem Man-agement Project, Walla Walla, WA.
AquaticsDecker, Lynn, Regional Fisheries Program Leader
USDA Forest Service, Pacific Southwest Region, Regional Office, San Francisco, CA.
*Lee, Danny C., Research BiologistUSDA Forest Service, Intermountain Research Station, Forestry Sciences Laboratory, Boise, ID.
Lee, Kristine M., Fisheries/Aquatic Ecology Program LeaderUSDA Forest Service, Intermountain Region, Regional Office, Ogden, UT.
Rieman, Bruce E., Research Fisheries BiologistUSDA Forest Service, Intermountain Research Station, Forest Science Laboratory, Boise, ID.
*Sedell, James R., Principal Research EcologistUSDA Forest Service, Pacific Northwest Research Station, Forestry Sciences Laboratory, Corvallis, OR.
Thurow, Russell F., Fisheries Research ScientistUSDA Forest Service, Intermountain Research Station, Forestry Sciences Laboratory, Boise, ID.
*Williams, Jack E., Science AdvisorUSDI, Bureau of Land Management, Columbia Northwest Technical Assistance Network, Boise, ID.
SCIENCE INTEGRATIONTEAM MEMBERS

vi
Economics*Haynes, Richard W., Research Forester
USDA Forest Service, Pacific Northwest Research Station, Forestry Sciences Laboratory, Portland, OR.
*Horne, Amy L., Research ForesterUSDA Forest Service, Pacific Northwest Research Station, Forestry Sciences Laboratory, Portland, OR.
Reyna, Nicholas E., Forest EconomistUSDA Forest Service, Pacific Northwest Research Station, Interior Columbia Basin Ecosystem Man-agement Project, Walla Walla, WA.
Landscape EcologyAlmquist, Carl L., Geologist
USDI Bureau of Mines, Western Field Operations Center, Spokane, WA.
Borman, Michael, Range EcologistUSDI National Biological Service, Forest and Rangeland Ecosystem Science Center, Corvallis, OR.
Brewer, Kenneth C., Landscape EcologistUSDA Forest Service, Northern Region, Flathead National Forest, Hungry Horse Ranger District,Hungry Horse, MT.
Frost, Thomas P., Research GeologistUSDI Geological Survey, Western Mineral Resources Branch, Spokane, WA.
Goodman, Iris, Research/Landscape HydrologistU.S. Environmental Protection Agency (EPA), Office of Landscape Characterization Research andDevelopment, Las Vegas, NV.
*Hann, Wendel J., Landscape EcologistUSDA Forest Service, Northern Region, Regional Office, Missoula, MT.
*Hessburg, Paul F., Research Plant Pathologist/EntomologistUSDA Forest Service, Pacific Northwest Research Station, Forestry Sciences Laboratory,Wenatchee, WA.
*Jensen, Mark, E., Landscape EcologistUSDA Forest Service, Regional Office, Missoula, MT.
Jones, J.L., Wildlife BiologistUSDA Forest Service, Northern Region, Beaverhead National Forest, Wisdom Ranger District,Wisdom, MT.
Karl, Michael G., Rangeland Management Specialist-EcologistUSDA Forest Service, Pacific Northwest Research Station, Interior Columbia Basin Ecosystem Man-agement Project, Walla Walla, WA.
Keane, Robert E., Research EcologistUSDA Forest Service, Intermountain Research Station, Fire Sciences Lab, Missoula, MT.

vii
Leonard, Stephen G., Range SpecialistUSDI, Bureau of Land Management, Resource Division, Reno, NV.
Smith, Bradley G., Quantitative Community EcologistUSDA Forest Service, Pacific Northwest Region, Deschutes National Forest, Silviculture Laboratory,Bend, OR.
SocialBumstead, Jon S., Social Scientist
USDA Forest Service, Pacific Northwest Research Station, Interior Columbia Basin EcosystemManagement Project, Walla Walla, WA.
*Burchfield, James A., SociologistUSDA Forest Service, Pacific Northwest Research Station, Interior Columbia Basin EcosystemManagement Project, Walla Walla, WA.
Galliano, Steven J., Landscape ArchitectUSDA Forest Service, Pacific Northwest Research Station, Interior Columbia Basin EcosystemManagement Project, Walla Walla, WA.
Hanes, Richard C., AnthropologistUSDI, Bureau of Land Management, Eugene, OR.
*McCool, Steven F., Social ScientistUSDA Forest Service, Pacific Northwest Research Station, Interior Columbia Basin EcosystemManagement Project, Walla Walla, WA.
SpatialGravenmier, Rebecca A., Natural Resource Specialist/GIS
USDI, Bureau of Land Management, Oregon State Office, Portland, OR.
Steffenson, John R., GIS SpecialistUSDA Forest Service, Pacific Northwest Region, Regional Office, Portland, OR.
Wilson, Andrew E., GIS SpecialistUSDA Forest Service, Pacific Northwest Region, Regional Office, Portland, OR.
TerrestrialCroft, Lisa K., Plant Ecologist
USDA Forest Service, Pacific Northwest Region, Ochoco National Forest, Prineville Ranger District,Prineville, OR.
Hickenbottom, Randal J., Wildlife BiologistUSDA Forest Service, Pacific Northwest Region, Regional Office, Portland, OR.
*Holthausen, Richard S., Wildlife EcologistUSDA Forest Service, Washington Office, Fish, Wildlife and Rare Plants Staff, Terrestrial HabitatEcology Leader, Corvallis, OR.

viii
*Lehmkuhl, John F., Wildlife EcologistUSDA Forest Service, Pacific Northwest Research Station, Forestry Sciences Laboratory,Wenatchee, WA.
*Marcot, Bruce G., Wildlife EcologistUSDA Forest Service, Pacific Northwest Research Station, Ecological Framework for ManagementProgram, Portland, OR.
Naney, Robert H., Wildlife BiologistUSDA Forest Service, Pacific Northwest Region, Okanogan National Forest, Supervisor’s Office,Okanogan, WA.
Nelson, Kurt, Supervisory Forester/Branch ChiefUSDA Forest Service, Intermountain Region, Payette National Forest, Resource Ecology Branch,McCall, ID.
Niwa, Christine G., Research EntomologistUSDA Forest Service, Pacific Northwest Research Station, Forestry Sciences Laboratory, Corvallis, OR.
Raphael, Martin G., Research Wildlife BiologistUSDA Forest Service, Pacific Northwest Research Station, Forestry Sciences Laboratory, Olympia, WA.
Saab, Victoria A., Research Wildlife BiologistUSDA Forest Service, Intermountain Research Station, Forestry Sciences Lab, Boise, ID.
* = Lead science responsibilities

EXECUTIVE SUMMARY 11
CHAPTER 1. INTRODUCTION 17Ecosystem Management Mandate 17
Assessments 19
The Basin 19
Science Team 22
Basin Assessment Objectives 22
Assessment Process 24
CHAPTER 2. ECOSYSTEM MANAGEMENT 27Ecosystem Management Goals 29
Goal 1. Maintain evolutionary and ecological processes 30
Goal 2. Manage with an understanding of multiple ecologicaldomains and evolutionary timeframes 32
Goal 3. Maintain viable populations of native and desirednon-native species 33
Goal 4. Encourage social and economic resiliency 35
Goal 5. Manage for places with definable values 36
Goal 6. Manage to maintain the mix of ecosystem goods, functions,and conditions that society wants 37
Ecosystem Management Concepts 39
Treatment of risk and uncertainty 39
Risk management 39
Scales 41
Land classifications 44
Biophysical template 45
TABLE OFCONTENTS

2
CHAPTER 3. CURRENT STATUS OF THE BASIN 47Overview 47
Context 52
Land area 52
Population 53
Recreation 53
Forestry 54
Range 56
Threatened and endangered species 57
Water supply 59
Energy 59
Environmental initiatives 60
Current Status of the Basin 60
Landscape ecology 60
Aquatic/riparian 68
Terrestrial 74
Economics 76
Social 86
CHAPTER 4. ECOSYSTEM INTEGRITY:ECOLOGICAL INTEGRITY AND SOCIOECONOMIC RESILIENCY 95
Ecological Integrity Ratings 96
Forestland and Rangeland Integrity 97Forestland integrity 97
Rangeland integrity 97
Hydrologic Integrity 100
Aquatic Integrity 103
Terrestrial Community Types 105
Forest and Rangeland Cluster Descriptions 105Forest Cluster 1 108
Forest Cluster 2 108
Forest Cluster 3 115
Forest Cluster 4 115
Forest Cluster 5 116
Forest Cluster 6 116

3
Rangeland Cluster 1 117
Rangeland Cluster 2 119
Rangeland Cluster 3 119
Rangeland Cluster 4 120
Rangeland Cluster 5 121
Rangeland Cluster 6 123
Composite Ecological Integrity 123
Social and Economic Resiliency 124
Economic Resiliency 124
Social Resiliency 125
Risks to Social and Economic Resiliency 127
Social and Economic Clusters 127
Developing a Measure of Socioeconomic Resiliency 128
Risks Associated with the People-Wildland Interaction 130
Discussion of Ecosystem Integrity 134
CHAPTER 5. THE FUTURE OF THE BASIN:ECOLOGICAL INTEGRITY AND SOCIOECONOMICRESILIENCY CONDITIONS AND TRENDS 137
Future Management Options 138
Option 1 138
Option 2 138
Option 3 140
Differences among options 140
Resource-Specific Outcomes 142
Landscape ecology 142
Terrestrial ecology 144
Social 145
Aquatic ecology 146
Economics 148
Methods for Assessing Future Integrity 149
Trends in ecological integrity 149
Population density 153
Risks to ecological integrity and people and their assets 155
Discussion of Management Options and Ecosystem Integrity 157

4
CHAPTER 6. POLICY QUESTIONS, EFFECTS OFSPECIFIC POLICY ACTIONS, AND PROCESS QUESTIONS 163
Policy Questions 163
Effects of Specific Policy Actions 172
Process Questions 173
CHAPTER 7. EMERGINGMANAGEMENT ISSUES AND SCIENCE GAPS 177
Management Issues 177
Science Gaps 179
Biophysical Science and Information Gaps 179
Socioeconomic Science and Information Gaps 179
Gaps in Scientific Methods 180
Emerging Science Issues 180
CHAPTER 8. FINDINGS 181Overall Findings 181
Landscape Ecology Findings 181
Terrestrial Ecology Findings 182
Aquatic Ecology Findings 183
Social Findings 183
Economic Findings 183
Geographic Information Findings 183
Findings for Selected Issues 183
Findings From the Future Management Options 185
CHAPTER 9. LESSONS LEARNED 187
ACKNOWLEDGMENTS 188
REFERENCES 189
APPENDIX A 199
APPENDIX B 215
APPENDIX C 231
APPENDIX D 287
APPENDIX E 297
LIST OF ACRONYMS 303
METRIC CONVERSIONS 303

5
LIST OF TABLESTable 1—Attributes and characteristics typically associated with broadresolution, regional assessments. 41Table 2—Attributes and characteristics typically associated withmid-resolution, sub-regional assessments. 42Table 3—Attributes and characteristics typically associated with fineresolution, landscape assessments. 42Table 4—Ownership of lands within the Basin assessment area. 48Table 5—Land ownership, by Ecological Reporting Unit for theBasin assessment area. 51Table 6—Summary of potential vegetation groups within the Basin. 52Table 7—Population, population growth rate, forest area, and forest areaper capita, 1990. 55Table 8—Areas of timberland in the United States by type of ownershipand sections, 1992. 57Table 9—Counts or estimates of total species biota of the Basin assessmentarea, estimated total U.S. species, and global diversity of organisms. 58Table 10—National and Basin federally-listed threatened andendangered plant and animal species. 59Table 11—Fire regime severity/frequency classes within the Basin Assessment area. 62Table 12—Historical and occupied range and habitat status for key salmonidswithin the Basin Assessment area. 73Table 13—Percent of predicted unroaded (<0.1km/km2) area in subwatersheds(~8,000 ha in size) with key salmonid species strongholds. 74Table 14— Current economic indicators for the United States, Idaho, Montana,Oregon, and Washington; totals, metropolitan and non-metropolitan counties,current and percent change since previous year or decade. 77Table 15—Employment in economic sectors of United States, the Basin, andBureau of Economic Analysis (BEA) regions for 1995; asterisks indicate valuesabove the national average. 81Table 16—Net economic value (willingness to pay) of current recreationactivities on FS-BLM lands, by ecological reporting unit (ERU). 87Table 17—Changes of broadscale terrestrial communities betweenhistorical and current periods within the Basin assessment area. 106Table 18—Examples of species associated with specific community types. 107Table 19—Percent of subbasins within each Forest Cluster having a net departurein terrestrial community type from 75 percent range of the historic 400 yearsimulation run. 107Table 20—Percent of subbasins with range clusters having a netdeparture, reduction (-) and increase (+), in 400 year simulation run. 108Table 21—Summary of Characteristics of Forest Clusters. 109

6
Table 22—Summary of characteristics of Range Clusters. 110Table 23—Forest and Rangeland Clusters - primary characteristics, risksto ecological integrity, and opportunities to address risks to integrity. 113Table 24—Selected landscape ecology related outcomesshown by future management options. 143Table 25—Terrestrial communities for the current situationand management options (year 100) for FS/BLM administered lands. 144Table 26—Societal acceptability for several variables considered importantby the public compared for each management option. 145Table 27—Scenic integrity classes for the current situation andmanagement options (year 10) for FS- and BLM-administered lands. 146Table 28—Predicted road density classes for the current situation andmanagement options (year 100) for FS- and BLM-administered lands. 147Table 29—Number of key salmonids or endemic rare or sensitive fishspecies for which the management options would conserve strong populations,prevent further declines or rebuild depressed populations. 147Table 30—Selected elements relating the aquatic conservationstrategies of each option to their effectiveness in maintaining andprotecting aquatic ecosystem function. 148Table 31—Selected economic measures for each of the management options. 148

7
LIST OF FIGURESFigure 1—Topography of the assessment area. 18Figure 2—Each step of the General Planning Model for ecosystem managementhas several parts. Because the model is iterative, external or internal influences caninitiate any step in the process and the process never ends. 20Figure 3a & 3b—Ecosystem organization can be viewed as a hierarchy. Eachlevel of the hierarchy has both time frames and spatial extents. A vegetationhierarchy is shown in 3a and a social hierarchy is shown in 3b. 21Figure 4—Ecological Reporting Units were used to differentiate thecharacterizations within the Basin. 23Figure 5—An example of hydrologic hierarchy from subwatersheds to subbasins. 25Figure 6a—Example of partitioning risk to ecological integrity across multiplegeographic extents. 40Figure 6b—An example of cumulative risks to ecological integrity at multiplegeographic extents. Ovoids A, B, and C represent analysis and decision levelsthat address risks associated with those levels. 40Figure 7—Typologies of land classifications. 44Figure 8—Major land ownerships within the Basin. 49Figure 9—Percentage of Ecological Reporting Unit area by land ownership. 50Figure 10—Historic and projected softwood timber harvest in the UnitedStates and in the Basin, 1952-2040. 55Figure 11—Comparison of historic and current selected landscape elements. 61Figure 12—Changes in Basin fire regimes from historic to current by severity class. 63Figure 13—Changes in Basin fire regimes from historic to current byfrequency class. 64Figure 14—Fire Severity for FS- and BLM-administered Forested PotentialVegetation Groups. 65Figure 15—Predicted road density classes. 66Figure 16—An example of road density categories for subwatershedswithin the Basin. 67Figure 17—Current number of key salmonid species present within the Basin. 69Figure 18—Historic number of key salmonid species present within the Basin 70Figure 19—Number of key salmonid species within strongholds. 71Figure 20—The location of aquatic strongholds in relation to areas of verylow road densities. 72Figure 21—Proportion of subwatersheds supporting strong populations ofkey salmonids by road density class and land ownership. 73Figure 22—Location of centers of endemism and rarity and of centers ofbiodiversity (for plants and animals). 78Figure 23—Location of hotspots for rarity/endemism and biodiversity. 79

8
Figure 24—Recreation opportunities and metropolitan areas account forhigher rates of population growth by county. 80Figure 25—Economic subregions as defined by the Bureau of Economic Analysis. 83Figure 26_The location of isolated timber-dependent communities within eachBEA area. 85Figure 27—Per acre market basket value of selected goodsand services from FS- and BLM-administered lands. 86Figure 28—Mine and deposit status are shown for the Basin.Adapted from Bookstrom and others (1996), figures 2-6. 88Figure 29—Reliance on timber harvested from FS- and BLM-administered lands. 89Figure 30—Reliance on forage from FS- and BLM-administered lands. 90Figure 31—Landscape themes assigned to regions within the Basin. 92Figure 32—Current scenic integrity predicted across the Basin. 93Figure 33—Forest integrity was rated for those 112 subbasinsthat had 20 percent of their area in forest PVGs. 98Figure 34—Range integrity was rated for those 86 subbasinsthat had 20 percent of their area in range PVGs. 99Figure 35—Hydrologic integrity was rated for the 112subbasins that had forest PVGs. 101Figure 36—Hydrologic integrity was rated forthe 86 subbasins that had range PVGs. 102Figure 37—Aquatic integrity was rated for the 164 subbasins. 104Figure 38—Subbasins grouped into six Forest Clusters. 111Figure 39—Subbasins grouped into six Range Clusters. 112Figure 40—Composite ecological integrity ratings synthesized theforest, rangeland, forest and rangeland hydrologic, and aquaticcomponent integrity ratings. 122Figure 41a—Percent of the Basin by composite ecological integrity. 124Figure 41b—Percent of FS- and BLM-administered land by compositeecological integrity rating. 124Figure 42—The economic diversity of each county was used to developeconomic resiliency ratings. 126Figure 43—Socioeconomic resiliency ratings are the sum of ratings foreconomic resiliency, population density, and lifestyle diversity. 129Figure 44—Societal risk of human-ecological interaction: percent of theBasin with low, moderate, high, or very high risk associated with themanagement of human ecological interactions. 131Figure 45—Level of risk associated with the management of humanecological interactions on FS-and BLM-administered lands. 133

9
Figure 46—FS/BLM risk of human-ecological interaction: percent ofFS- and BLM-administered land with very high, high, moderate, and low riskassociated with the management of human ecological interactions. 134Figure 47—Percentage of the Basin by ecological integrity andsocioeconomic resiliency ratings. 135Figure 48—Proposed reserves on FS- and BLM-administeredlands in Management Option 3. 141Figure 49—Long-term trends in ecological integrity for FS- and BLM-administered lands: Management Option 1. 150Figure 50—Long-term trends in ecological integrity forFS- and BLM-administered lands: Management Option 2. 151Figure 51—Long-term trends in ecological integrity for FS-and BLM-administered lands: Management Option 3. 152Figure 52—Trends in composite ecological integrityprojected by Management Option. 153Figure 53—Distribution of population density categories by areaand population of 1994 and 2040. 154Figure 54—Trends in economic resiliency by area forManagement Options 2 and 3. 155Figure 55—Long-term trends in risk of human ecological interactionBLM-administered lands only: Management Option 1. 158Figure 56—Long-term trends in risk of human ecological interactionBLM-administered lands only: Management Option 2. 159Figure 57—Long-term trends in risk of human ecological interactionBLM-administered lands only: Management Option 3. 160

10
LIST OF PHOTOSPhotos 1a and 1b—This Blue Mountain photo pair shows the change in stream,meadow, and riparian conditions between 1919 and 1992. Notice the forests inthe background are more densely stocked. 28Photo 2—The area called the Seven Devils has both culturaland recreational significance. 36Photo 3—Forest Service employee examining a log deck with a purchaser.FS- and BLM-administered lands accounted for 46 percent of harvest in theBasin in 1991. 37Photo 4— American Indian picking huckleberries in an area of traditionalcultural significance. 38Photo 5. Roads provide access for a wide array of uses including cold water fishing. 54Photo 6—Production of aggregates is a common mining activity on FS-BLM-administered lands. 84Photo 7—This young mixed forest stand of western redcedar,western hemlock, and western white pine in northern Idahoillustrates characteristics of a moist forest cluster. 115Photo 8a and 8b. The expansion of western juniper into sagebrush-grass isevident in this photo pair showing 1920 to 1956 change resulting formgrazing and fire exclusion. The photo pair typifies changes commonly foundin the juniper woodland rangeland cluster.. 118Photo 9—This photo illustrates characteristics of a moderate integrity,dry forest rangeland cluster. Livestock use on FS- and BLM-administeredlands is common within the Basin. 121Photo 10—The separation of towns and cities from the forest land and rangelandis becoming less as this central Oregon community scene demonstrates. 130Photo 11—The expansion of human habitation into the wildland settingintroduces risks from fire and other disturbances. This complicates theFS- and BLM-management of these risks. 132Photos 12a and 12b—One management tool considered in the dry forestedvegetation types that addresses the role of fire in these ecosystems. 139Photo 13—Small rural communities have traditionally been closely linked tothe flow of commodities from FS- and BLM-administered lands. 156Photos 14a and 14b—Due to wide-spread infestation of white pine blister rust(Cronartium ribicola), white pine and whitebark pine have decreased in moistand cold forest vegetation types in the Basin. These photos show before andafter effects of blister rust on forest stands dominated by western white pine. 182

11
In July 1993, as part of his plan for ecosystemmanagement in the Pacific Northwest, PresidentClinton directed the Forest Service to “develop ascientifically sound and ecosystem-based strategyfor management of Eastside forests.” To accom-plish this, the Chief of the Forest Service and theDirector of the Bureau of Land Managementjointly established the Interior Columbia BasinEcosystem Management Project (ICBEMP). Theoverall assignment of the ICBEMP Science Inte-gration Team (SIT) is to develop a scientificframework, to conduct detailed functional assess-ments, and to generate an integrated assessment.This document is the Integrated Scientific Assess-ment for Ecosystem Management for the InteriorColumbia Basin and addresses one of the threeprimary assignments. This integrative assessmentlinks landscape, aquatic, terrestrial, social, andeconomic characterizations to describe biophysicaland social systems. Integration was achievedthrough the use of a framework built around sixgoals for ecosystem management and three differ-ent views of the future.
This assessment addresses the interior ColumbiaBasin east of the Cascade crest and those portionsof the Klamath and Great Basins within Oregonwith emphasis on land administered by the ForestService (FS) and Bureau of Land Management(BLM). The total area includes more than 145million acres (58 million ha) of which 76 millionacres (30 million ha) are administered by the FSand BLM. Within the assessment area, the Kla-math Basin comprises more than 4 million acres(1 million ha) and the Great Basin comprisesmore than 10 million acres (4 million ha).
In the last century, major changes have occurred invegetation patterns, fish and wildlife distributions,processes of terrestrial and aquatic ecosystems, andhuman communities in the assessment area (theBasin). Some changes have permanently con-verted lands and ecosystems to something otherthan what was there before European influence.Fire regimes have changed in both frequency andseverity; large, high intensity fires have begun toshape the landscapes. Extensive road networkshave been constructed, increasing sediment pro-duction and transport, fragmenting wildlife habi-tat, but also increasing access for recreation users,management activities, and commodity produc-tion. Exotic plants have been introduced to theBasin and have spread widely, especially in therange ecosystems. Introduced fish and wildlifespecies, some highly valued, have left a legacyof wide-ranging non-native species that competewith, prey upon, or have replaced native species.
Changes in human uses of the Basin, as well aschanges in values, have affected ecosystems andtheir management. Social change has beendramatic as scattered populations of AmericanIndian tribes have given way to the Europeanimmigrants working farms, mines, mills, andranches; to a diverse mix of ethnic backgrounds;and to the urban and rural dwellers of today.Human social and political institutions operatewith greater variability and on shortertimeframes than most ecological processes.Local, regional, and national interests disagreeabout the costs and benefits of commodityextraction from the public lands, relative toother economic activity and ecosystem outputs.
EXECUTIVE SUMMARY

12
Today, Federal land management in the Northwest isunder scrutiny from more varied interests, each usingCongressional, judicial, and administrative powers togain advantage. Issues include protection of uniqueecosystems and species, management of riparianareas and old forests, and experimentation withmethods of forest and rangeland management.Proposed management strategies strive to retainprocesses and features important to ecosystem func-tion and to mimic natural disturbance regimes.Tribal governments are concerned about culturallyand economically significant resources. Other stake-holders are concerned about the availability of com-modities from Federal lands and the protection ofprivate property rights. Those with environmentalinterests express concern about the conditions in theforest, rangeland, and aquatic systems and particu-larly wildlife species in these systems. Issues arisefrom conflicting values, and often involve more thanone spatial extent or timeframe. Therefore, issuesplay a major role in defining analysis boundaries,types of assessments, and data collection. TheICBEMP was initiated to address many of theseissues as they relate to public land management.
In its broadest terms, management of ecosystemintegrity is composed of two parts: maintainingecological integrity, and maintaining the resiliencyof social and economic systems. Ecological integrityis defined as the degree to which all ecological com-ponents and their interactions are represented andfunctioning. Resiliency is defined as the degree towhich systems adapt to change.
Ecological integrity and socioeconomic resiliency arerooted in scientific concepts that reflect humanvalues, including the normative purpose of maintain-ing the integrity of a combined natural and culturalecosystem. These end-states may include some thatare judged by management and the public as being“normal and good” but that may not be pristine ornaturally whole. In this sense, the integrity of ecosys-tems is more an expression of environmental policythan scientific theory. We acknowledge that manyresource managers may be reluctant to includesocietal issues and values in the definition (andevaluation) of ecosystem integrity. However, since
maintaining the integrity of ecosystems is a manage-ment goal, it, by definition, needs to reflect thevalues of both managers and users.
We assume that goals that fulfill the purpose ofecosystem management are: maintain evolutionaryand ecological processes; manage with an under-standing of multiple ecological domains and evolu-tionary timeframes; maintain viable populations ofnative and desired non-native species; encouragesocial and economic resiliency; manage for placeswith definable values; and, manage to maintain avariety of ecosystem goods, functions, and condi-tions that society wants.
Ecological Integrityand Socioeconomic ResiliencyRatings of ecological integrity and socioeconomicresiliency are used together to make general state-ments about ecosystem conditions in the Basin.Currently high ecological integrity and high socio-economic resiliency are found on 16 and 20 percentof the area in the Basin. Low integrity and resiliencyare found on 60 and 68 percent of the area. Theecological integrity ratings are relative estimates ofthe degree to which ecosystem functions and pro-cesses are present and operating. A low rating doesnot, in and of itself, imply low productivity or de-clining conditions; much of the area rated as lowecological integrity included lands used for agricul-tural and grazing uses. Finally, 84 percent of the areawith high integrity is on FS- and BLM-administeredlands while 39 percent of the area rated as low is onFS- and BLM-administered lands.
The results for socioeconomic resiliency are some-what deceptive. While 63 percent of the area withinthe Basin is rated as having low resiliency, 67 percentof the people of the Basin live in areas with highresiliency. In terms of where people live, only 17percent of the population lives in areas of low resil-iency. One should not assume that those who live inareas of low resiliency experience low economic orsocial well-being, just as one should not assume thatthose living in areas of high resiliency experiencehigh economic or social well-being. Rather, peopleliving in areas with low resiliency are in areas thathave a low level of adaptability to change.

13
A few areas like Flathead County, Montana, andChelan and western Yakima Counties, Washington,have both high ecological integrity and socioeco-nomic resiliency. These areas would likely accom-modate and respond to ecological or economicdisruptions better than other areas in the Basin.Those areas with medium ecological integrity andmedium or high resiliency include Hood River andDeschutes Counties, Oregon; Missoula County,Montana; Asotin County, Washington; and, NezPerce County, Idaho. Areas of medium or highsocioeconomic resiliency and low ecological integrityare dominated by the metropolitan counties andmajor transportation corridors. Although areas withhigh socioeconomic resiliency are more likely to bein areas of low ecological integrity, it is not alwaystrue. Likewise, although areas with high ecologicalintegrity are generally associated with areas of lowsocioeconomic resiliency, it is not always true. Theserelations are not necessarily cause and effect either.
There are several areas where human pressures maypose risks to high ecological integrity. The Basin isfortunate in that some of the highest ecologicalintegrity for both forest and rangelands is in largecontiguous blocks in areas of low current and pro-jected human population density. The greatestopportunities for restoration activities by Federalland management agencies are on FS- and BLM-administered lands in those areas with moderate orlow ecological integrity. There are opportunities insystems exhibiting moderate integrity because theyare resilient and provide for ecological restoration.
Future trends in integrity and resiliency were esti-mated for three views of the future. These differentfutures display the effects of broad managementactions on biophysical and social ecosystem compo-nents. Three options were used to describe a set ofpossible futures and their consequences: continua-tion of current management, management emphasiz-ing restoration, and management centered on areserve system. The focus was on potential responsesto an array of possible management activities andfuture events. Projected trends in ecological integrityfor the three options are stable or improving in therestoration management option; mostly stable orimproving but with a small area trending downward
in the reserve option; and the majority of the FS-and BLM-administered land in the Basin is trendingdownward in integrity for the continuation of thecurrent management option.
In terms of the risks to both the assets of peopleliving in the Basin and to the ecosystem itself, wefound that continuation of current management willlead to increasing risks. Both the reserve option andthe restoration option resulted in trends that mostlystabilized or reduced risks. Developing strategiesthat actively manage risks where the interaction ofpeople and ecological integrity are projected toincrease risks will likely become more important.Even where ecological integrity is projected to im-prove with the application of active management,population increases and the pressures of expandingdemands on resources cause increasing trends in risk.While these different management options exploredfor FS- and BLM-administered lands do not, inthemselves, influence population growth, the ecosys-tems and the ability to manage change are greatlyinfluenced by human populations. By the year2040, the population may double and 80 percent ofthe population will likely live in relatively urbanizedenvironments. Those areas most likely to experienceincreased risk owing to increasing human popula-tions are northern Idaho and northwest Montana;the areas surrounding Spokane and Wenatchee,Washington; Deschutes County, Oregon; the areanorth of Boise, Idaho; and the area between theFlathead and Lolo National Forests in Montana.
We found that proactive approaches to ecosystemmanagement within an adaptive framework wouldlead to higher ecological integrity and social andeconomic resiliency within the Basin. This approachwould recognize the dynamic nature of the interiorecosystems, their current ecological status, and thehuman demands on interior ecosystems. Finally,these management options show that long-termsustainability of resources and environments, resil-iency of social and economic systems, and meetingsocially desired resource conditions cannot be pre-dicted without continually assessing and monitoringresults of management activities and adjusting man-agement activities accordingly.
14
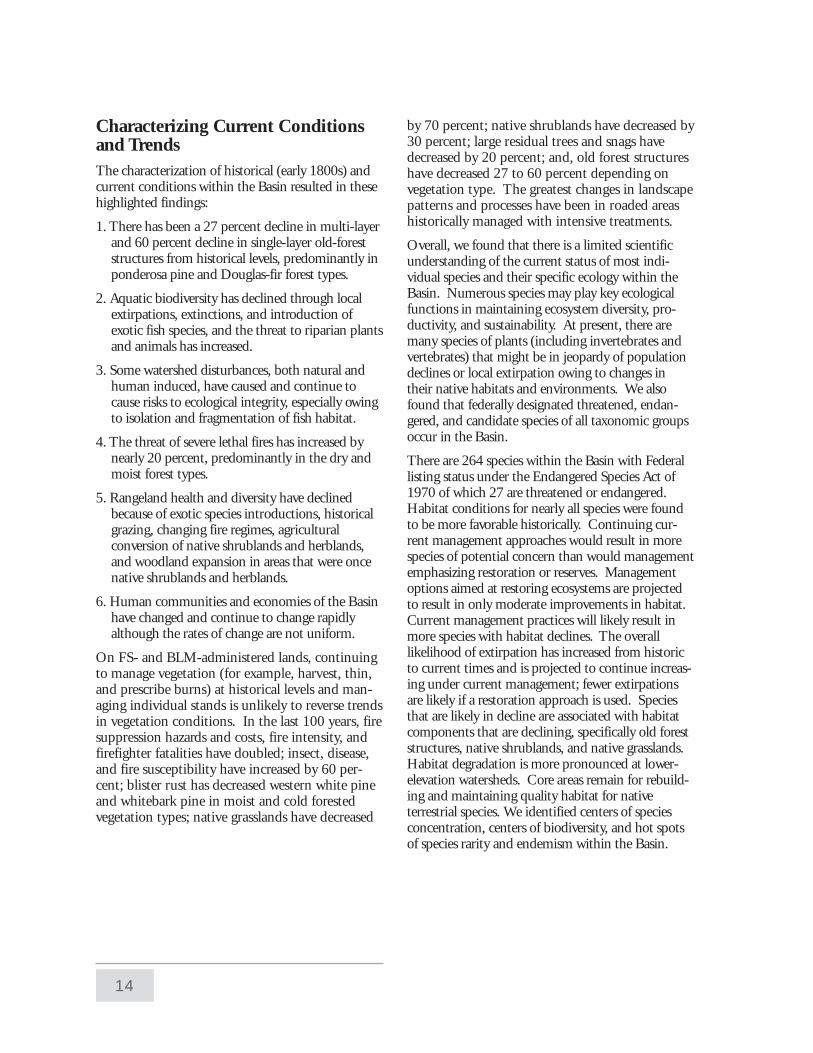
Characterizing Current Conditionsand TrendsThe characterization of historical (early 1800s) andcurrent conditions within the Basin resulted in thesehighlighted findings:
1. There has been a 27 percent decline in multi-layerand 60 percent decline in single-layer old-foreststructures from historical levels, predominantly inponderosa pine and Douglas-fir forest types.
2. Aquatic biodiversity has declined through localextirpations, extinctions, and introduction ofexotic fish species, and the threat to riparian plantsand animals has increased.
3. Some watershed disturbances, both natural andhuman induced, have caused and continue tocause risks to ecological integrity, especially owingto isolation and fragmentation of fish habitat.
4. The threat of severe lethal fires has increased bynearly 20 percent, predominantly in the dry andmoist forest types.
5. Rangeland health and diversity have declinedbecause of exotic species introductions, historicalgrazing, changing fire regimes, agriculturalconversion of native shrublands and herblands,and woodland expansion in areas that were oncenative shrublands and herblands.
6. Human communities and economies of the Basinhave changed and continue to change rapidlyalthough the rates of change are not uniform.
On FS- and BLM-administered lands, continuingto manage vegetation (for example, harvest, thin,and prescribe burns) at historical levels and man-aging individual stands is unlikely to reverse trendsin vegetation conditions. In the last 100 years, firesuppression hazards and costs, fire intensity, andfirefighter fatalities have doubled; insect, disease,and fire susceptibility have increased by 60 per-cent; blister rust has decreased western white pineand whitebark pine in moist and cold forestedvegetation types; native grasslands have decreased
by 70 percent; native shrublands have decreased by30 percent; large residual trees and snags havedecreased by 20 percent; and, old forest structureshave decreased 27 to 60 percent depending onvegetation type. The greatest changes in landscapepatterns and processes have been in roaded areashistorically managed with intensive treatments.
Overall, we found that there is a limited scientificunderstanding of the current status of most indi-vidual species and their specific ecology within theBasin. Numerous species may play key ecologicalfunctions in maintaining ecosystem diversity, pro-ductivity, and sustainability. At present, there aremany species of plants (including invertebrates andvertebrates) that might be in jeopardy of populationdeclines or local extirpation owing to changes intheir native habitats and environments. We alsofound that federally designated threatened, endan-gered, and candidate species of all taxonomic groupsoccur in the Basin.
There are 264 species within the Basin with Federallisting status under the Endangered Species Act of1970 of which 27 are threatened or endangered.Habitat conditions for nearly all species were foundto be more favorable historically. Continuing cur-rent management approaches would result in morespecies of potential concern than would managementemphasizing restoration or reserves. Managementoptions aimed at restoring ecosystems are projectedto result in only moderate improvements in habitat.Current management practices will likely result inmore species with habitat declines. The overalllikelihood of extirpation has increased from historicto current times and is projected to continue increas-ing under current management; fewer extirpationsare likely if a restoration approach is used. Speciesthat are likely in decline are associated with habitatcomponents that are declining, specifically old foreststructures, native shrublands, and native grasslands.Habitat degradation is more pronounced at lower-elevation watersheds. Core areas remain for rebuild-ing and maintaining quality habitat for nativeterrestrial species. We identified centers of speciesconcentration, centers of biodiversity, and hot spotsof species rarity and endemism within the Basin.

15
Salmonid species have experienced declines in habi-tat, abundance, and life histories. Population strong-holds for the key salmonids ranges from less than1 percent to 32 percent of the occupied range of thespecies. The occupied area ranges from 28 percentto 85 percent of the historic range. Declines foranadromous species have been the greatest--even ifhabitat conditions stabilize, fragmentation, isolation,and off-site hazards put remaining populations atrisk. Habitat degradation is greatest in lower-elevation watersheds, which include private lands.Though much of the native ecosystem has beenaltered, the core pieces remain for rebuilding andmaintaining functioning native aquatic systems.Rehabilitating depressed populations of anadro-mous salmonids cannot rely on habitat improve-ment alone but requires a concerted effort toaddress causes of mortality in all life stages. Theseinclude freshwater spawning and rearing, juvenilemigration, ocean survival, and adult migration.
Social and economic conditions within the Basinhave changed considerably over the last severaldecades. People and communities within the Basinare undergoing rapid change. Social resiliency varies;drier climates are generally associated with lowerresiliency, such as dry herblands and shrublandsassociated with ranching and agricultural communi-ties. Communities that have experienced recenteconomic or social disruptions are generally moreresilient. Human attachment to places are importantin determining the acceptability of managementactions. Overall scenic quality within the Basin ishigh and is projected to remain high.
Overall, Basin economies are experiencing growth,especially in metropolitan and recreation counties.Regional economies are diverse and have high resil-iency, but resiliency varies by size of the economicsectors. FS and BLM activities account for13 percent of the regional economies of the Basin.The importance of FS and BLM activities varieswithin the Basin; such activities are of the mostimportance in eastern Oregon. Recreation ishighly valued as a regional, national, and interna-tional resource. At current growth rates, recre-ation use will double in the next 31 years.
At the Basin level, consistent databases to supportassessments and planning are scarce. An interagencyapproach could greatly improve the quality of infor-mation, and support continuing assessments that arepart of the adaptive management process.
Findings Related to General IssuesWithin the BasinAccessibility—We found a great deal of ambiguityabout the amount of roads required to satisfy publicneeds. Issues include the ecological consequences ofroading, and the effects (both good and bad) ondifferent kinds of public recreation. Many peopleoppose extensive road closures, but at the same timesupport improving habitats and reducing erosion.Management strategies include reducing road densi-ties and redesigning and improving maintenance ofroad networks.
Communities—Communities are more complexthan labels such as “timber dependent” make themout to be. Most communities in the Basin havemixed economies and their vitality is linked tofactors broader than resource flows from FS- andBLM-administered lands. In the Basin, both com-munities and economies associated with agriculturalor ranching operations are less resilient than othercommunity types.
Fire—It is not possible to “fireproof” ecosystems inthe Basin, but the potential of severe fire can bereduced by proactive land management. In terms ofsocial and economic outcomes, the greatest potentialmanagement concerns are likely to be in the rural/urban wildland interface. Severe fires do put humancommunities and ecological integrity at risk. Man-agement treatments aimed at reducing severe fire arenot without risk to ecological integrity and to com-munities, pointing to the need for an integratedapproach to risk management.
Fish—The identification of aquatic strongholds,areas of high fish community integrity, and otheraquatic information provides a basis for the conserva-tion and restoration of aquatic ecosystems.
16
It also provides a basis for building effective strategiesthat can simultaneously benefit terrestrial andaquatic ecosystems. This strategy could includeprotection of high-integrity areas and restoration ofareas with lower integrity.
Forest health—We found that forested ecosystemshave become more susceptible to severe fire andoutbreaks of insects and diseases. Reducing theserisks and hazards involves maintaining forest coverand structure within a range consistent with long-term disturbance processes.
Rangeland health—Rangeland ecosystems havebeen affected by historical overgrazing, woody spe-cies encroachment, changes in fire regimes, andexotic species invasion. Integrated weed manage-ment strategies, use of prescribed fire, and managingthe season and intensity of grazing use can result inimproved rangeland health. Grazing strategies withspecific objectives for riparian areas within aquaticstrongholds and with habitats identified for threat-ened and endangered species would address many ofthe concerns of rangeland health related to speciesdiversity.
Managing risk to ecological integrity—Wefound that the management of risks to ecologicalintegrity involves maintenance of high integrity andenhancement of areas with low integrity. We foundthat an integrated approach will be necessary becauserisks to integrity arise from many sources (hydro-logic, forest, rangeland, and aquatic as well as eco-nomic and social). Reducing risks from one sourcemay increase risks to another ecological component.The strategy for risk management will need to beboth integrated and adaptive.
Restoration—We found that there are substantialopportunities to restore and improve ecologicalintegrity on forest and rangeland areas with 74percent of the FS- and BLM-administered lands inlow or moderate integrity. There are opportunitiesto restore landscape patterns, improve connectivity inaquatic and terrestrial habitats, restore vegetation
cover types and structure, and restore hydrologicfunctions within subbasins. There are opportunitiesto restore these patterns, structures, and vegetationtypes to be more consistent with those occurringunder long-term disturbance processes. We foundthat opportunities exist, albeit at a different scale, forrestoration in virtually every subbasin in the Basin.
Salvage—We found that salvage activities couldcontribute to the achievement of long-term eco-logical integrity by emphasizing prevention ofinsect and disease outbreaks rather than focussingon the removal of large recently dead trees. Suchan approach would include removing smallerliving trees as part of the overall managementregime and emphasizing stand structure and com-position at the watershed level, rather than manag-ing at the stand level. Low risks to ecologicalintegrity would exist from treating currentlyroaded areas, where companion efforts mightinclude reducing adverse effects associated withroads. Such approaches can be consistent withattainment of economic objectives for salvageactivities.
Special forest products—We found an increas-ing potential for conflicts between recreational,cultural, subsistence collection, and the growingcommercial collection of products such as huckleber-ries, mushrooms, and firewood on Federal lands.Land management strategies will be complicated bythe localized commercial and cultural importance ofthese products.
Timber—An ecosystem-based approach to timberharvest places greater emphasis on outcomes in areastreated than on volumes of timber extracted (that is,a focus on area rather than volume regulation). Theimplication is that the volumes and mix of speciesremoved can become a by-product of achieving goalsof stand structure and landscape patterns. Underthis approach, volumes may be more variable thanunder past forest management approaches.