Embed Size (px)
Citation preview

1
Integrated Operation Application on Upstream Petrobras Services
Cristina Pinho Executive Manager – Petrobras • September, 2014.

2
The presentation may contain forecasts about future events. Such forecasts merely reflect the
expectations of the Company's management. Such terms as "anticipate", "believe", "expect",
"forecast", "intend", "plan", "project", "seek", "should", along with similar or analogous
expressions, are used to identify such forecasts. These predictions evidently involve risks and
uncertainties, whether foreseen or not by the Company. Therefore, the future results of
operations may differ from current expectations, and readers must not base their expectations
exclusively on the information presented herein. The Company is not obliged to update the
presentation/such forecasts in light of new information or future developments. All
projects forecasted herein are subject to approval by the appropriate stakeholders.
The United States Securities and Exchange Commission permits oil and gas companies, in their
filings with the SEC, to disclose only proved reserves that a company has demonstrated by
actual production or conclusive formation tests to be economically and legally producible under
existing economic and operating conditions. We use certain terms in this presentation, such
as oil and gas resources, that the SEC’s guidelines strictly prohibit us from including in
filings with the SEC.
CAUTIONARY STATEMENT FOR US INVESTORS

3
Integrated Operations – Petrobras - E&P Motivation
Petrobras
Others
Potiguar
Bahia Sul
Espírito Santo
Campos
Santos
Ceará & Potiguar
Pelotas
Margem Equatorial
Solimões
São Francisco
SEAL & REC & TUC
Growth and Complexity of Activities 1
New challengers 2
New opportunities 3

4
Contracting Services
E&P Services - Portfolio
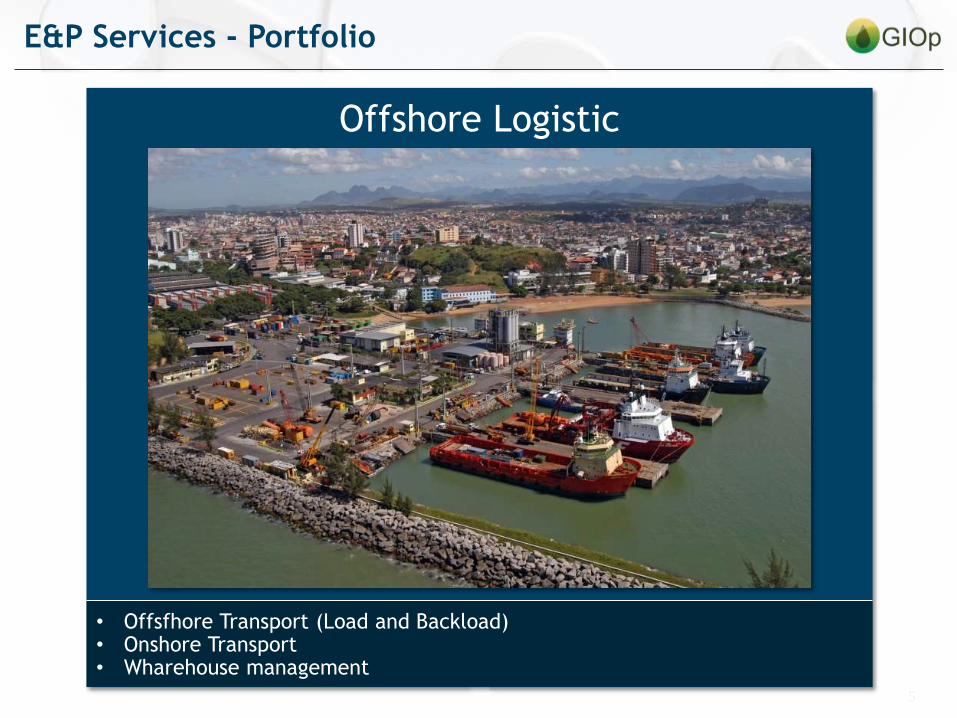
Offshore Logistic
• Offsfhore Transport (Load and Backload) • Onshore Transport • Wharehouse management
• Contract to E&P Services
Subsea Operations
• Subsea projects • Subsea operations (anchoring, installation and
maintenance of pipelines)
• Subsea Equipments (installation and maintenance)
Upstream Operations Support
• Air Transport (Offshore) • Chemical Products Supply to offshore Units • Maintenance (machine and turbomachinery)
5
Offshore Logistic
• Offsfhore Transport (Load and Backload) • Onshore Transport • Wharehouse management
Operations Support
• Air Transport (Offshore) • Chemical Products Supply to offshore Units • Maintenance (machine and turbomachinery)
Contracting Services
• Contract to E&P Services
Subsea Operations
• Subsea projects • Subsea operations (anchoring, installation and
maintenance of pipelines)
• Subsea Equipments (installation and maintenance)
Offshore Logistic
• Offsfhore Transport (Load and Backload) • Onshore Transport • Wharehouse management
E&P Services - Portfolio
6
Offshore Logistic
• Offsfhore Transport (Load and Backload) • Onshore Transport • Wharehouse management
Operations Support
• Air Transport (Offshore) • Chemical Products Supply to offshore Units • Maintenance (machine and turbomachinery)
Contracting Services
• Contract to E&P Services
Subsea Operations
• Subsea projects • Subsea operations (anchoring, installation and
maintenance of pipelines)
• Subsea Equipments (installation and maintenance)
E&P Services - Portfolio
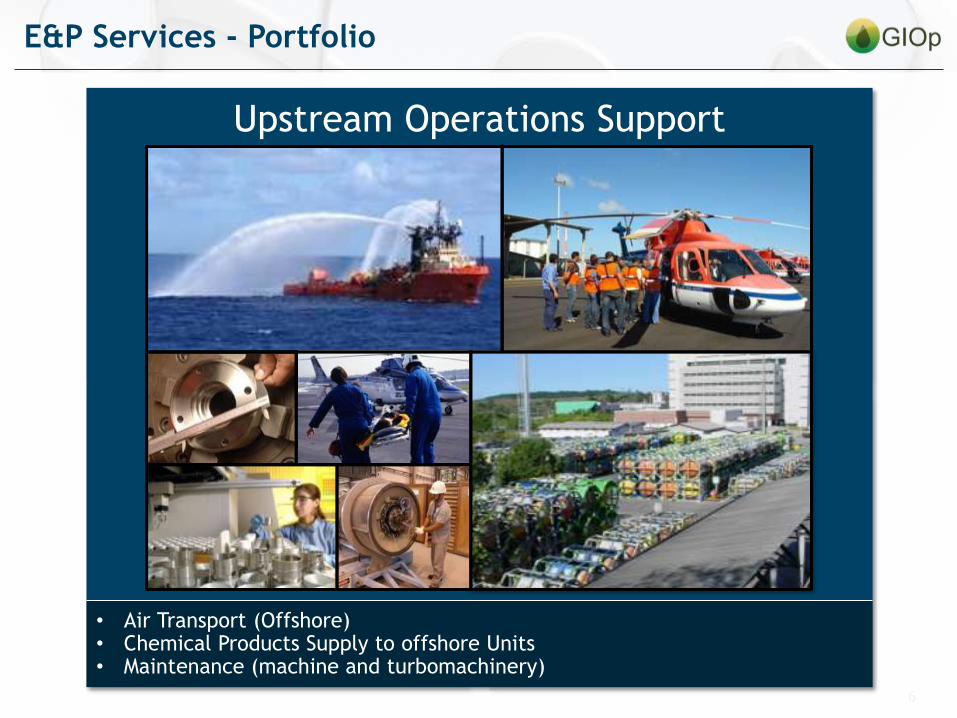
Upstream Operations Support
• Air Transport (Offshore) • Chemical Products Supply to offshore Units • Maintenance (machine and turbomachinery)

7
Offshore Logistic
• Offsfhore Transport (Load and Backload) • Onshore Transport • Wharehouse management
Operations Support
• Air Transport (Offshore) • Chemical Products Supply to offshore Units • Maintenance (machine and turbomachinery)
Contracting Services
• Contract to E&P Services
Subsea Operations
• Subsea projects • Subsea operations (anchoring, installation and
maintenance of pipelines)
• Subsea Equipments (installation and maintenance)
Subsea Operations
• Subsea projects • Subsea operations (anchoring, installation and maintenance of pipelines) • Subsea Equipments (installation and maintenance)
E&P Services - Portfolio

8
Offshore Logistic
• Offsfhore Transport (Load and Backload) • Onshore Transport • Wharehouse management
Operations Support
• Air Transport (Offshore) • Chemical Products Supply to offshore Units • Maintenance (machine and turbomachinery)
Contracting Services
• Contract to E&P Services
Subsea Operations
• Subsea projects • Subsea operations (anchoring, installation and
maintenance of pipelines)
• Subsea Equipments (installation and maintenance)
Contracting Services
• Contract to E&P Services
E&P Services - Portfolio

9
Upstream Operations Support

10
Equipment's Maintenance in onshore
shopfloor. More than 40.000 items in
annual volume.
People Air Transportation: • 9 airports • 1.0 x 10⁶ pax/year • 60.000 flights/year • Fleet: 110 helicopters
Chemical Products Supply for
Upstream units, providing more than
146.000 m³ in products volume / year.
Upstream Operations Support
CHEMICAL PRODUCTOS SUPPLY
ONSHORE EQUIPMENTS MAINTENANCE
PEOPLE AIR TRANSPORTATION
Different processes,
common problems...
• Low visibility on future
demands
• Difficulty in exchanging
information for decision
making
• Lack of collaboration
between different
disciplines
• Lack of specific/technical
knowledge sharing

11
Upstream Operations Support
Operational
Cells
Integrated
Integrated
Planning
Services
Programming
Services
Execution
Integrated Monitoring and Control
Decision
support
collaboration
Process
monitoring

12
Process Indicators – Evolution – Example from GIOp Actions
0
52
71.21
81.15 81.62 84.49
76.79
71.16
77.7
71.84 70.91 70.14 70.4 71.34 72.3
0
23
46
69
92
11 12 13 JAN FEB MAR APR MAY JUN JUL AUG SEP OCT NOV DEC 14 14 14 14
%
Last Years Results 2014 Fisrt Semester - Results 2014 Secont Semester - Expectation
Chemical Products Supply Indicator
Peso: 0 Meta: 71,00 Desafio (%): 5,63 Meta c/desafio: 75,00

13
Upstream Operations Support
RESULTS ACHIEVED
• Adaptation of IO concepts for the
services area
• Work philosophy changes - Emphasis on
Planning and collaboration
• Wide and effective stakeholders’
communication
• IT support
• Skilled staff allocation
Chemical Products
51% Service
Level increase
Equipments Maintenance
47% Service Level Increase
Equipments Maintenance
30% downtime reducing
in dynamics equipments
LESSONS LEARNED – IO
MAIN CHALLENGES FOR THE NEXT YEAR
• Expand the operational cells providing appropriate
infrastructure and IT solutions
• Intensify IO practice with services requesters
• Workforce continuous training in order to operate the new
operating model

14
E&P Logistics Services

15
Former Situation
Maritime Units
Re
gion
al LOG
M
TM
ARM
TT
CC
OPRT
Re
gion
al LOG
S
TM
ARM
OPRT
Re
gion
al LOG
ES
TM
ARM
OPRT
Re
gion
al LOG
CM
E
TM
ARM
OPRT
Regional Logistics
Current Situation
GIOP
PLANNER
Environment Collaborative
Platforms
Drilling
rig
UO-BC
UO-RIO
UO-BS
UO-ES
UO-SEAL
UO-SUL
Polo Macaé
Polo Rio
Polo EXP
Polo Vitória
Polo Itajaí
Polo Santos
Polo Papa-
Terra/LIBRA
Polo Aracaju
PLSVs
Special
Vessels
GIOP’s bases
GIOP
PLANNER
REGIONAL
LOGISTICS
REPRESENTATIVE
INTELOG
GIOP
PLANNER
Re
gion
al LOG
M
TM
ARM
TT
CC
OPRT
Re
gion
al LOG
S
TM
ARM
OPRT
Re
gion
al LOG
ES
TM
ARM
OPRT
Re
gion
al LOG
CM
E
TM
ARM
OPRT
Regional Logistics
Collaborative Environment Evolution Project
16
Collaborative Environment Technology
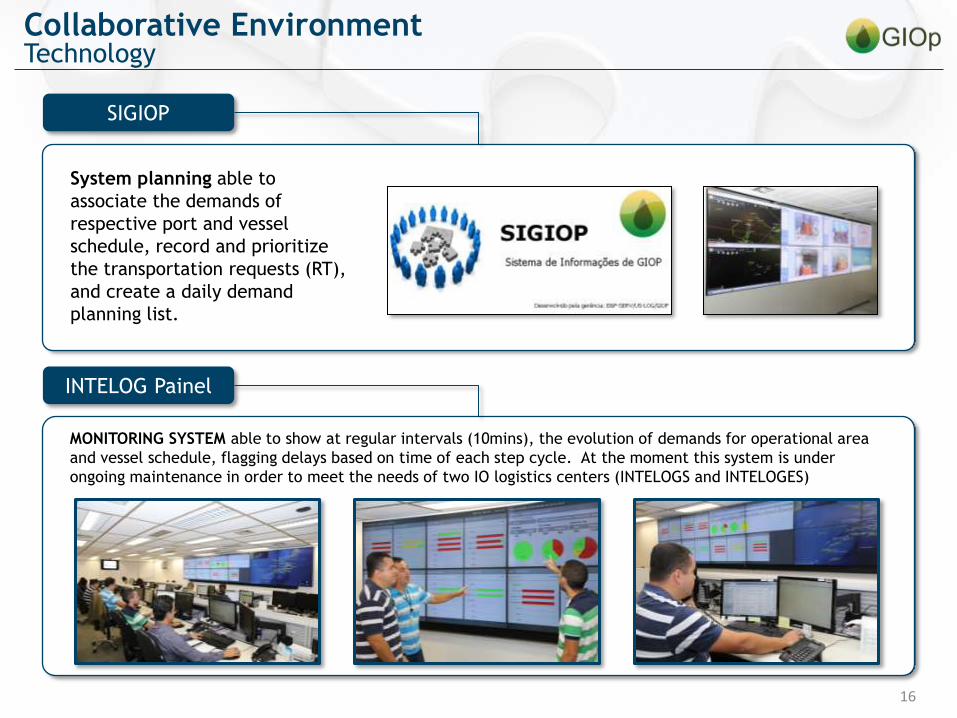
SIGIOP
System planning able to
associate the demands of
respective port and vessel
schedule, record and prioritize
the transportation requests (RT),
and create a daily demand
planning list.
INTELOG Painel
MONITORING SYSTEM able to show at regular intervals (10mins), the evolution of demands for operational area
and vessel schedule, flagging delays based on time of each step cycle. At the moment this system is under
ongoing maintenance in order to meet the needs of two IO logistics centers (INTELOGS and INTELOGES)

17
SIGIOP
System planning able to
associate the demands of
respective port and vessel
schedule, record and prioritize
the transportation requests (RT),
and create a daily demand
planning list.
INTELOG Painel
MONITORING SYSTEM able to show at regular intervals (10mins), the evolution of demands for operational area
and vessel schedule, flagging delays based on time of each step cycle. At the moment this system is under
ongoing maintenance in order to meet the needs of two IO logistics centers (INTELOGS and INTELOGES)
Collaborative Environment Technology

18
SIGIOP
System planning able to
associate the demands of
respective port and vessel
schedule, record and prioritize
the transportation requests (RT),
and create a daily demand
planning list.
INTELOG Painel
MONITORING SYSTEM able to show at regular intervals (10mins), the evolution of demands for operational area
and vessel schedule, flagging delays based on time of each step cycle. At the moment this system is under
ongoing maintenance in order to meet the needs of two IO logistics centers (INTELOGS and INTELOGES)
Collaborative Environment Technology

19
SIGIOP
System planning able to
associate the demands of
respective port and vessel
schedule, record and prioritize
the transportation requests (RT),
and create a daily demand
planning list.
INTELOG Painel
MONITORING SYSTEM able to show at regular intervals (10mins), the evolution of demands for operational area
and vessel schedule, flagging delays based on time of each step cycle. At the moment this system is under
ongoing maintenance in order to meet the needs of two IO logistics centers (INTELOGS and INTELOGES)
Collaborative Environment Technology

20
Indicators ISPL - Drilling Rig stopped due to Logistics
ISPL Evolution
47.38
36.94
8.40
2.76%
1.95%
0.43%
2012 2013 2014
Total days of stopping Rig due to logisticsISPL
8.04 6.13
15.31
4.50
9.60
4.27
10.98
0.32% 0.26%
0.84%
0.25%
0.54%
0.24%
0.53%
JAN FEB MAR APR MAY JUN JUL
ISPL Development Year 2014
Total days of stopping Rig due to logistics
ISPL
Reduction of approx. 80% of lost time
allocated to US-LOG, considering the
average between 2013 and 2014
ISPL Formula = Total time drilling rig stopped US-LOG reason / Total time of operation drilling rig Source: OpenWells

21
• Effective sponsorship by the upper
managements;
• Participation of related areas in developing
project implementation;
• Robust communication plan;
• Human Resources Support identifying the
appropriate profile of the components of
the IO staff, conducting diagnostic team and
preparation of specific training;
• Working group with great knowledge of IO
processes, participating on systems
development;
About the project Difficulties in Implementation and Lessons Learned
LESSONS LEARNED
• Develop prioritization procedure between
customers to act in critical situations;
• Standardize internal procedures with the
Logistics Regional and formalize it in SAP;
• Adapt IO systems and develop performance
evaluation tools;
• Develop the philosophy of integration
between all customers, suppliers and
logistics;
FUTURE CHALLENGES

22
Subsea Services

23
Integrated Operation Center
The Subsea Services IO Center
is a pilot project that aims
accelerated learning and
anticipation of earnings by
integration in some critical
processes of this business unit,
such as:
• Planning and scheduling of
subsea operations, involving
SIMOPs (PLSV, RSV, DSV, RIG;
AHTS) and logistics of material;
• Operational monitoring,
control and technical support.

24
Operational Results Integrated Fleet Control
49% 46%
19% 18% 18% 19% 22% 22% 15% 16% 21% 20% 22% 24% 25%
29% 29% 26% 29% 31% 28%
27% 27% 27% 25% 24% 24% 24%
52% 53% 55% 52% 47% 50% 57% 56% 53% 55% 55% 53% 50%
48% 47% 45% 48%
53% 50%
43% 44% 47% 45% 45% 47% 50%
0%
20%
40%
60%
80%
100%
2013 2014 1-Jul 1-Aug 1-Sep 1-Oct 1-Nov 1-Dec 1-Jan 1-Feb 1-Mar 1-Apr 1-May 1-Jun 1-Jul
NVA BVA CVA Improdutividade
% Fleet Unproductivity
Unproductivity
BVA = Business Value Added Ex: Navigation , Port , Complementary services ,
Operational stop
NVA = Non Value Added Ex: Waiting programming , Waiting in the Lease,
Waiting Seacondition
Unproductivity =
BVA + NVA
CVA = Customer Value Added (operational time)
Fleet composition
AHTS - 42 vessels
PLSV - 12 vessels
RSV and DSVs - 16 vessels

25
Operational Results Integrated Fleet Control
BVA = Business Value Added Ex: Navigation , Port , Complementary services ,
Operational stop
NVA = Non Value Added Ex: Waiting programming , Waiting in the Lease,
Waiting Seacondition
Unproductivity =
BVA + NVA
CVA = Customer Value Added (operational time)
% RSV Fleet Unproductivity
34% 27%
8% 9% 10% 8% 9% 11% 3% 5% 4% 5% 6% 3% 3%
27% 32% 26%
26% 25% 24% 25%
29% 26% 21% 20% 18% 21%
65% 59% 63% 67% 66% 66% 71% 67% 70% 74% 74% 79% 75%
35% 41%
37% 33% 34% 34%
29% 33%
30% 26% 26%
21% 25%
0%
20%
40%
60%
80%
100%
2013 2014 Jul-13 Aug-13 Sep-13 Oct-13 Nov-13 Dec-13 Jan-14 Feb-14 Mar-14 Apr-14 May-14 Jun-14 Jul-14
NVA BVA CVA ImprodutividadeUnproductivity
Fleet composition
Frota RSV and DSVs - 16 vessels

26
About the project Difficulties in Implementation and Lessons Learned
• Transparency and trust;
• Representativeness;
• Technical and behavioral training ;
• Focus on operational planning;
• Quality control of data;
• Integrated tools that support the
process;
• Continuous improvement;
LESSONS LEARNED
• Implant the process as designed TO-BE;
• Select people with technical knowledge that
work as a team;
• Continuous communication with the team
about changes (transparency)
• Identify the impacts caused by the redesign
of processes and treat them;
• Integrate some existing systems to the new
tool (in development) to support the
integrated processes.
FUTURE CHALLENGES

27
Petrobras´ Integrated Operations Management
Thank you!
FO
TO
: M
ich
al T
roch
imia
k/S
tock.x
ch
ng


![An Integrated QFD-TOPSIS Method for Prioritization of Major ......69 An integrated QFD-TOPSIS method for prioritization of ajor lean tools: a case study et al. [19] investigated the](https://img.dokumen.tips/doc/110x75/5f9a4974df9f7e323759560b/an-integrated-qfd-topsis-method-for-prioritization-of-major-69-an-integrated.jpg)