Embed Size (px)
Citation preview

Integrated Food Security and
Humanitarian Phase Classification
(IPC)
Pilot in Cambodia
Final Report
April 2007
Table of Contents Acknowledgements .........................................................................................................3 List of Acronyms ............................................................................................................4 Executive Summary ........................................................................................................5
Overview ....................................................................................................................5 Household Food Insecurity Status and Location .........................................................5 Underlying Causes of Household Food Insecurity ......................................................6 Recommended Interventions and Targeting for WFP .................................................7
Chapter 1. Introduction.................................................................................................10 1.1 Background and Objectives .................................................................................10 1.2 Methodology .......................................................................................................10 1.3 Limitations ..........................................................................................................14
Chapter 2. Socio-Economic Background.......................................................................16 2.1 Poverty and Income Patterns...............................................................................16 2.2 Macro-Economic Performance............................................................................17 2.3 Post-Conflict Stability..........................................................................................18 2.4 Hazards ...............................................................................................................18
Chapter 3. Food Availability and Access .......................................................................20 3.1 Rice Self-Sufficiency Status..................................................................................21 3.2 Food Imports ......................................................................................................21 3.3 Food Aid .............................................................................................................22 3.4. Food Consumption and Dietary Diversity ..........................................................23 3.5 Livelihoods..........................................................................................................24 3.6 Education ............................................................................................................26 3.7 Risks, Vulnerability and Coping Strategies ...........................................................27
Chapter 4. Food Market and Household Food Security.................................................29 4.1 Food Marketing Channels ...................................................................................29 4.2 Cross-Border Trade of Food and Trade Regime ..................................................29 4.3 Food Price Patterns .............................................................................................30 4.4 Market Sources of Food ......................................................................................32
Chapter 5. Health, Nutrition and Food Utilization ........................................................34 5.1 Crude Mortality Rate ...........................................................................................34 5.2 Malnutrition ........................................................................................................36
5.2.1 Direct Evidence of Malnutrition ...................................................................36 5.2.2 Indirect Evidence of Malnutrition.................................................................38
5.3 Diseases...............................................................................................................40 5.4 Access to Water and Sanitation............................................................................42
Chapter 6. Strategic Response Options .........................................................................43 6.1 Cambodian IPC at-a-Glance ................................................................................43 6.2 Government Actions and Strategic Response Options ........................................45 6.3 Targeted Population Estimates ............................................................................47 6.4 Implications for WFP Interventions and Targeting..............................................47
Selected List of References............................................................................................51 Annex 1: Thematic Maps ..............................................................................................53

3
Acknowledgements A number of people representing government and partners contributed significantly in shaping and finalizing this report. The mission team is particularly grateful to the IPC working group members (listed below) who spared time to advise, comment and share their country knowledge during the course of the analysis. Support received from WFP Country Office staff in Cambodia is acknowledged. The overall analysis would not have been possible without full support received from WFP staff both at country office and sub-office levels, especially from Thomas J. Keusters (Country Director) and Coco Ushiyama (Deputy Country Director). Special thanks to Brian Bogart, Saravy Tep and Ratha Khim for outstanding support in coordinating the mission, collating and processing data, mapping the findings, commenting and contributing to the report finalization. Brian’s involvement in organizing meetings with the working group was a key to the success of partner contributions to the IPC process. A special acknowledgement goes to Bun Thol (FAO/MAFF) for providing very useful data and insights on agriculture, household consumption and expenditures, which proved to be critical in understanding issues related to food availability and access in Cambodia. Technical backstopping from Nicholas Haan and valuable comments received from colleagues in WFP headquarters, especially Darlene Tymo, Agnes Dhur, Alexis Hoskins and Caroline Chaumont played an instrumental role in finalizing the report. Financial support was provided mainly by the Strengthening Emergency Needs Assessment Capacity (SENAC) project and WFP country office in Cambodia.
The report was prepared by Issa Sanogo ([email protected]), Rita Bhatia ([email protected]), Dipayan Bhattacharyya ([email protected]), Tobias Flaemig ([email protected]) and Brian Bogart ([email protected]), with input from Yon Fernandez ([email protected]).
Members of the IPC Working Group Name Organization/Institution E-mail Bun Thol Food and Agriculture
Organization/Ministry of Agriculture, Forestry and Fisheries, Royal Government of Cambodia
Chea Marong Economic Institute of Cambodia [email protected] Kent Helmers Independent Consultant [email protected] Neak Samsen The World Bank [email protected] Peter Kaufmann Council for Agricultural and Rural
Development, Royal Government of Cambodia
Thanongdeth Insisiengmay
Asian Disaster Preparedness Center [email protected]
Tuy Pheap Partnership for Local Governance/Seila, Royal Government of Cambodia
Zaman Talukder Helen Keller International [email protected]

4
List of Acronyms
ADB Asian Development Bank AFLC Acute Food and Livelihood Crisis ANC Antenatal Care CARD Council for Agriculture and Rural Development CDHS Cambodia Demographic and Health Survey CDRI Cambodia Development Resource Institute CIDA Canadian International Development Agency CIPS Inter-Censal Population Survey CMR Crude Mortality Rate CSES Cambodia Socio-Economic Survey ECHO European Commission Humanitarian Aid Office EIC Economic Institute of Cambodia EMIS Education Management Information Systems FAO Food and Agricultural Organization of the United Nations FDI Foreign Direct Investment FFE Food for Education FFT Food for Training FFW Food for Work FHC Famine/Humanitarian Catastrophe FSAU Food Security Analysis Unit, Somalia GDP Gross Domestic Production GFS Generally Food Secure GNP Gross National Production HCFI High Chronically Food Insecure HE Humanitarian Emergency ILO International Labor Organization IMF International Monetary Fund IMR Infant Mortality Rate IPC Integrated Food Security and Humanitarian Phase Classification JICA Japan International Cooperation Agency LCFI Low Chronically Food Insecure MAFF Ministry of Agriculture, Forestry and Fisheries MCH/MCN Maternal Child Health/Nutrition MDG Millennium Development Goals NCDM National Committee for Disaster Management NGO Non-Government Organization NIS National Institute of Statistics NSDP National Strategic Development Plan PRRO Protracted Relief and Recovery Operation SENAC Strengthening Emergency Needs Assessment Capacity U5MR Under-Five Mortality Rate UNDAF United Nations Development Assistance Framework UNDP United Nations Development Program UNICEF The United Nations Children’s Fund USDA United States Department of Agriculture UXO Unexploded Ordinance VAM WFP Vulnerability Analysis and Mapping Unit WB The World Bank WFP World Food Programme WTO World Trade Organization

5
Executive Summary Overview The WFP team, with contribution from FAO, carried out the IPC exercise in Phnom Penh from February 5-23, 2007 to: • Review the food security and nutritional situation in Cambodia, identifying food insecure
people and their location, using the IPC approach as an analytical tool; • Review the underlying causes of food insecurity and malnutrition; • Make projections on the evolution of the situation over the next 2-3 years on the basis of
past trends, current situation and causes of food insecurity and malnutrition, and exposure to shocks (risks and hazards);
• Review the need for continuation of food aid and nutritional rehabilitation programmes, in the light of the above; and
• Prioritize any related food aid needs to serve as the basis for planning WFP’s new PRRO. The IPC exercise collated and analyzed secondary data from various sources and summarized the information in analysis templates. During the course of the mission, a working group composed of government entities (Ministry of Agriculture, Forests and Fisheries, National Institute of Statistics, Council for Agricultural and Rural Development, National Committee for Disaster Management), donors and research institutes (Economic Institute of Cambodia, Cambodia Development Resource Institute) was set up as a means of cross-checking the information and building consensus and ownership of the findings. A one-day field visit was organized in two provinces (Kampong Chhnang and Kampong Spueu) for further cross-checking with key informants. The Integrated Food Security and Humanitarian Phase Classification (IPC) shows that most provinces in Cambodia are chronically food insecure, except Bat Dambang and Phnom Penh. The severity is exacerbated by limited economic growth in rural areas, when compared with urban areas, and drought. Drought is seen as a major cause of reduced food availability in many provinces, driving up food prices since 2003. Local markets can hardly stabilize food prices because of high transaction costs to move food from surplus to deficit areas and a trade regime with neighbouring countries that is distorted by export restrictions on rice and tariffs on imports. This situation has a negative impact on livelihoods, as various negative coping strategies are adopted to meet food requirements, such as seasonal migration, increasing child work, withdrawal of students from school, debt, deforestation, sales of livestock and land. Beyond reduced household access to food, the IPC shows that nutrition and health status are poor in most of the provinces. An estimated 4.6 million, out of a total population of 13.1 million people, live below the poverty line. About 2.6 million live in extreme poverty. Depending on resource availability, WFP interventions could target the population living in extreme poverty, as this category is more likely to face food deprivation. The response to this chronic food insecurity situation includes a mixture of short-term and long-term interventions aimed at providing safety nets, providing livelihood support, addressing structural constraints, and reducing exposure to vulnerability caused by temporary crises, such as drought. Household Food Insecurity Status and Location Population estimates suggest that about 4.6 million individuals live below the poverty line in Cambodia. They can be classified in majority as chronically food insecure. About 2.6 million living in extreme poverty are likely to face food deprivation. Using the poverty line, population estimates indicate there are more chronically food insecure people in the plains region, but the degree of food insecurity is more intense in the plateau region. Overall, the food security situation of the concerned population has worsened over the last three years because of persistent drought. In 2004 and 2005, pockets of inadequate food access appeared in almost all

6
provinces. Given the chronic nature of the food insecurity situation, the IPC map is not expected to be updated in the near future unless a major shock occurs. However, a close monitoring of the hazard profile (e.g. drought and/or flood) is advised. Underlying Causes of Household Food Insecurity Availability/Accessibility: Food availability and access in Cambodia are predominantly driven by weather-dependent rice production. Although the country has become rice-surplus over the last years, rice access at the household level has been fluctuating with unstable rainfall patterns. Several southern provinces have been severely affected by consecutive years of drought since 2003, resulting in production shortfalls. In the meantime, due to trade restrictions and transaction costs, markets have failed so far to stabilize food prices, despite dynamic cross-border imports and some surplus production recorded in provinces in the Tonle Sap basin and in the plains. The combination of inadequate economic opportunity in rural areas, limited access to land for small farmers, UXO/mines contamination, land grabbing, low yields, poor infrastructure and the increase of food prices over recent years has further reduced poor household access to food. The current trend of drought, mostly in southern and eastern provinces, could increase the vulnerability of households to food insecurity, unless proper safety-net programmes are set-up. Food Consumption and Dietary Diversity: Household food consumption, especially in rural areas, accounts for about two-thirds of the total expenditures, indicating the subsistence nature of the livelihoods. In general, the diet is largely rice-based in rural areas, indicating potential risk for protein and micronutrient deficiencies and poor nutrition status. Health and Nutrition: The final report of the 2005 Cambodia Demographic and Health survey (CDHS) suggests remarkable improvement in the health and nutrition status of the population since the 2000 survey. The report shows that infant mortality (IMR) declined from 95 to 66 deaths for every 1,000 live births and under-five deaths (U5MR) declined from 124 to 83 for every 1,000 live births. This represents a decrease of over 30 percent. Still, one in every 12 Cambodian children dies before reaching 5 years of age. Maternal mortality is 472 deaths per 100,000 live births, indicating a statistically insignificant change since 2000. Despite progress made, the health status of the Cambodian people is still among the lowest in the region. Health status warrants continued multi-sector interventions, addressing nutrition and food security, access to safe water and sanitation and basic health services, including health and nutrition education. The report states nutritional status of children has improved in the past five years. Currently 37 percent of children are stunted, 36 percent underweight and 7 percent are wasted, compared with 45 percent stunting, 45 percent underweight and 15 percent wasting in 2000. Poor dietary diversity, with 65 percent of calories provided by cereals, results in micronutrient deficiencies, such as anaemia and vitamin A deficiency. Stunting, underweight and wasting are most common in Pousat and least common in Phnom Penh. In general, children with uneducated mothers and those living in the poorest households are most likely to be malnourished. The data also shows stunting is apparent even among children less than 6 months of age (6 percent). Stunting increases with the age of the child. There is very little difference in the level of stunting by gender. Education: Even though Cambodia has a high enrolment rate at primary school (91.3 percent), the ratio of enrolment decreases sharply in lower and upper secondary education to less than 31.3 percent for lower secondary education (grades 7, 8 and 9) and 11.3 percent for upper secondary education (grades 10, 11 and 12) due to very low transition and completion rates. The lowest primary enrolment rates are recorded in Rotanak Kiri (67.5 percent) and Kaoh Kong (78.3 percent) provinces. In general, primary completion rates are very low (42.9 percent on average) with the lowest rates recorded in Rotanak Kiri (21.2 percent) and Modul Kiri (28.3 percent). Details of the provincial differences of all the above indicators are presented in the report.

7
Recommended Interventions and Targeting for WFP Given time limits, the response analysis was not carried out as recommended by the IPC approach. Therefore, it is recommended to conduct further discussions with stakeholders in Cambodia to: i) validate the situation analysis of the current report, and ii) work out an in-depth response analysis accompanied by a framework for actions, which can serve as the basis for the government and partners’ interventions. The interventions recommended below are built upon the situation analysis but emphasize only the response options that can be implemented by WFP.
Health, Nutrition and Utilization interventions:
Expand safety net activities, i.e. maternal child health (MCH) and supplementary feeding in priority provinces with the poorest nutrition, health and utilization indicators;
In order to maximize appropriate nutrition interventions, further nutrition assessment and monitoring in Kandal, Otdar Mean Chey, Pousat and Prey Veaeng (IPC recommended) provinces where wasting rates are high, in addition to the current MCH provinces, is recommended;
Specific supports to other vulnerable populations (such as TB, HIV/AIDS patients) can be envisaged to complement the safety nets activities;
Advocacy for increased wells and water filtering facilities to provide clean drinking water; and
Food-for-training programmes can be envisaged for nutrition, health and hygiene education.
Access, Availability, Markets and Livelihoods support activities:
Food-for-work and food-for-training activities to improve rural incomes, agricultural practices, reduce post-harvest losses and augment irrigation facilities in order to enhance resilience to, and mitigate the adverse impact of, drought, floods and other natural disasters.
Education interventions:
Expand safety net activities, i.e. food for education to provinces classified as high chronically food insecure and to those with the poorest education indicators; and
Continue monitoring and reporting primary school attendance and advocate an expansion of WFP project monitoring system to national level.
In order to prioritize and eventually maximize cost effectiveness, an integrated intervention approach is proposed by province, combining MCH/MCN, FFW and FFE, wherever possible. A combination of key reference indicators and/or indirect evidence indicators is used, following the IPC classification. In addition to the underweight and stunting indicators, the under-five anemia and infant mortality rates are used to prioritize MCH/MCN activities. Poverty rate and the average percentage of rice areas destroyed by drought over the last three years (2004-2006) were selected to prioritize FFW interventions. Finally, primary school enrolment, school attendance and completion rates were used to prioritize FFE activities. In addition, nutrition assessments are recommended to support the operations, given weak reliability of data in some provinces. The package approach consisted of combining the priority order of these activities to come up with a single priority rank of the province. Details can be found in chapter 6.
Following the integrated approach, the summary table below indicates that most of the high chronically food insecure provinces would become first priority provinces for WFP interventions. Notwithstanding operational constraints, the integrated interventions could be extended to second priority provinces. The generally food secure provinces of Phnom Penh and

8
Bat Dambang are not considered as priority intervention areas, unless further fine tuning of the selection criteria, specific indicators and arguments can be established.
Recommended Priority Intervention Provinces for WFP
FFW MCH/MCN FFENutrition
Assessment
Tonle Sap Banteay Mean Chey LCFI 2 2 2 3 2Tonle Sap Bat Dambang GFS - - - - -Plains Kampong Cham LCFI 1 2 1 2 1Tonle Sap Kampong Chhnang LCFI 2 2 2 3 2Plateau Kampong Spueu HCFI 1 1 1 2 1Tonle Sap Kampong Thum HCFI 1 1 2 3 1Coastal Kampot LCFI - 3 2 3 3Plains Kandal LCFI - 3 3 1 3Coastal Kaoh Kong LCFI - 1 1 1 1Plateau Kracheh LCFI 1 2 2 3 2Coastal Krong Kaeb LCFI - 2 2 3 2Plateau Krong Pailin LCFI 2 2 2 2 2Coastal Krong Preah Sihanouk LCFI - 1 2 1 2Plateau Mondol Kiri HCFI 1 1 1 1 1Plateau Otdar Mean Chey HCFI 2 1 1 1 1Phnom Penh Phnom Penh GFS - - - - -Tonle Sap Pousat HCFI 1 1 1 1 1Plateau Preah Vihear HCFI 2 1 1 1 1Plains Prey Veaeng HCFI 2 1 2 1 1Plateau Rotanak Kiri HCFI 1 1 1 1 1Tonle Sap Siem Reab HCFI 2 1 2 2 2Plateau Stueng Traeng HCFI 2 2 1 1 1Plains Svay Rieng LCFI - 1 3 1 2Plains Takaev LCFI - 2 3 1 2
Legend Generally food secure -GFS Low chronically food insecure - LCFIHigh chronically food insecure- HCFI Acute food and livelihood crisis - AFLCHumanitarian emergency - HE Famine/Humanitarian catastrophe - FHC
Note 1 = First priority (red); 2 = Second Priority (orange); 3 = Third Priority (yellow); - = Not a priority or GFS (green)
Underlying Indicators used for prioritizationFFW: Poverty rate and % of rice area destroyed by drought (2004-2006) FFE: Primary enrolment rate, Primary attendance rate and Primary completion rateMCH/MCN: Stunting and underweight are bad everywhere. Added U5 anemia and IMRNutrition assessment: 1st priority wherever wasting >7,3%; 2nd priority between 5-7.3%; 3rd priority <5%
Priority Province for integrated
interventions
Order of Priority of Interventions
Ecological Zone Province NameIPC
Classification

9

10
Chapter 1. Introduction 1.1 Background and Objectives WFP and FAO are working closely to develop, implement and advocate a commonly accepted, standardized tool for classifying food insecurity, under the Strengthening Emergency Needs Assessment Capacity (SENAC) project. This tool is known as the Integrated Food Security and Humanitarian Phase Classification (IPC), which was initially developed for Somalia. Cambodia is among the countries selected to further pilot the approach of the IPC. WFP in Cambodia is currently implementing a PRRO1, which expires in December 2007. A new PRRO document will be developed by April 2007, with implementation starting in 2008. As per corporate regulations, the new PRRO should be based on a solid needs assessment. In a relief and recovery context, the method chosen is to review secondary data, using the IPC approach to inform decision making. In addition to using the expected outputs to help the design of the new PRRO, this second pilot in the Asia Region2 is expected to provide additional inputs for refining the IPC approach for broader application. The objectives of the food security assessment as laid out in the terms of references consist of : • Reviewing the food security and nutritional situation in Cambodia, including who is affected,
where they reside and trends (past and future), using the IPC approach as an analytical tool; • Reviewing the underlying causes of food insecurity and malnutrition; • Making projections on the evolution of the situation in the next two to three years (life time
of the PRRO) on the basis of past trends, current causes of food insecurity and malnutrition, and exposure to shocks (risks and hazards);
• Reviewing the need for eventual continuation of food aid and nutritional rehabilitation programmes in the light of the above and in relation with the IPC analysis; and
• Prioritizing any related food aid needs to serve as the basis for planning WFP’s new PRRO. After a brief presentation of the methodology and its limitations, the rest of the report highlights the general background of Cambodia, including social, demographic, economic and political issues (chapter 2). In this context, the report reviews the current state of food security and underlying causes in Cambodia, focusing on the main dimensions of food insecurity, i.e. food availability/access (chapter 3), the role of markets in food security (chapter 4), the health, nutrition and utilization dimension of food security (chapter 5). The last chapter (6) builds on the situation analysis findings to identify some of the major response packages and priorities for WFP operations. 1.2 Methodology The methodology applied the meta analysis approach of the Integrated Food Security and Humanitarian Phase Classification (IPC). The exercise followed a sequential process in order to arrive at the final IPC map. These steps are narrated below: Step 1: Literature Review The essence of IPC analysis is ‘integration’ of key reference outcomes and indirect supportive evidence. The literature review included methodological or technical guidelines on the IPC, as well as Cambodia-specific documents, reports, studies and data on food security, poverty, nutrition and hazards. This information was derived from various sources published by the 1 Protracted relief and recovery operation (PRRO) 2 A first IPC pilot was conducted by WFP in Indonesia in December 2006

11
government, donors, UN Agencies and NGOs. The literature review allowed the team to identify the relevant indicators and other supportive evidence that could be used for the exercise. These documents were also used as qualitative and quantitative reference materials for the overall synthesis of sections on food availability, access and utilization, as well as livelihoods. Step 2: Indicator Selection The selection of key reference outcomes (direct evidence) generally depends on what data is available and at what level of aggregation. After thoroughly scrutinizing all the relevant data that could be collated from various sources and stakeholders, the following indicators were selected for the analysis:
Table 1.1: Indicators Used for Cambodia IPC Analysis Applicable Reference
Outcomes (As defined by IPC Reference Table)
Direct Evidence
Indirect Evidence (e.g., process or proxy indicators)
Crude mortality rate • Crude Mortality Rate • Under 5 moratility rate (U5MR) • Infant mortality rate (IMR)
Malnutrition
• Prevalence of wasting (<-2 z-scores)
• Prevalence of stunting (<-2 z-scores)
• Prevalence of underweight (<-2 z-scores)
• Severe + moderate anaemia among children under 5 years
• Severe + moderate anaemia among women • Consumption of iodized salt • Night blindness among children 18-59 months • Night blindness among lactating women with
children <24 months • Immunization coverage among children 12-23
months • Measles immunization coverage among children
12-23 months
Disease
• Not applicable/available • Diarrhea among children • Risk of malaria • HIV sero-prevalence among ANC • TB – CDR
Food Access/Availability
• Number of income deciles with deficiency in calorie intake per capita per day (compared to 2100 kcal)
• Percentage of people below poverty line • Percentage of children (5-14 years) engaged in
economic activities • Per capita cereal availability • Sources of dietary energy intake among 2 lowest
income deciles (including purchase from market) • Percentage of household facing food deprivation • Rainfall • Crop damage due to flood and drought • Number of casualties due to mines and UXOs
1979-1993 Dietary diversity • Not applicable/available
Water access/availability • Not applicable/available • Access to potable drinking water ( percent of
Household - HH) • Access to sanitation ( percent of HH)
Destitution/Displacement • Not applicable/available Civil Security • Not applicable/available Coping • Not applicable/available
Structural Issues • Not applicable/available • Road accessibility
• International borders • Percentage of migration due to economic reasons
Hazards • Not applicable/available • Flood • Drought

12
• Number of casualties due to mines and UXOs 1979-1993
Livelihood Assets (5 capitals)
• Not applicable/available • Major livelihood groups • Percentage of female illiteracy • Net enrolment ratio for primary education • Primary school completion rate • Number of people per km2 of agricultural land,
forests and water bodies • Draught power (in # of heads/ cultivated ha of
rice) After a review of the available data, it was decided that the IPC analysis would be undertaken at a provincial (24 provinces) level. This decision is justified by the lack of disaggregated data below the provincial level and the fact that some data were further aggregated beyond the provincial level to agro-ecological zones3. As could be seen from the above table, very little direct evidences is available for Cambodia. This is primarily due to the incompatibility of the indicator definition followed by the IPC analysis (which is designed for emergency situations) and what is available in Cambodia. Accordingly, many indicators, though very relevant for the overall analysis, were used as indirect and supporting evidence due to lack of internationally recognized thresholds for classification. Step 3. Spatial Analysis
For each indicator, ranges were determined using the following criteria:
a. Incorporate IPC thresholds.
b. Where IPC thresholds were not available, select internationally accepted standards.
c. Where the above two were not available, ranges were decided based on national average.
A first spatial analysis, using only IPC thresholds, indicated that Cambodia is largely chronically food insecure (CFI), with only two provinces being classified as generally food secure (GFS). Therefore, this classification did not allow the team to easily map out differences between provinces. Consequently, the mission divided the phase of chronic food insecurity into two phases, i.e. low chronic food insecurity (LCFI) and high chronic food insecurity (HCFI). The IPC color coding, therefore, became green for GFS, yellow light for LCFI, yellow dark for HCFI, orange for acute food and livelihood crisis (AFLC), red for humanitarian emergency (HE) and red dark for famine/humanitarian catastrophe (FHC). The resulting ranges and related color codes are indicated in the table below.
3 These comprise Tonle Sap, Mountain/Plateau, Plains, and Coastal.

13
Table 1.2. Proposed Thresholds by Indicator
Indicator Description Range 0-9% (green)10-29.9% (yellow light)>30% (yellow dark)0-2.9% (green)3-5.9% (yellow light)6-9.9% (yellow dark)10-15% (orange)>15% (red)0-19.9% (green)20-39.9% (yellow light)>40% (yellow dark)<25% (green)25-35.9% (yellow light)>36% (yellow dark)<20% (green)20-35.9% (yellow light)>36% (yellow dark)0-28.9 (green)29-59.9 (yellow light)60-85.9 (yellow dark)86-120 (orange)121-150 (red)>150 (red dark)0-35.9 (green)36-79.9 (yellow light)80-105.9 (yellow dark)106-169.9 (orange)170-215 (red)>215 (red dark)>=75% (green)44.2-74.9% (yellow light)<44.2% (yellow dark)<5% (green)5-10% (yellow light)>10% (yellow dark)
UnderweightPercentage of children under 5 years withweight for age <-2 SD
WastingPercentage of children under 5 years withweight for height <-2 SD
StuntingPercentage of children under 5 years withheight for age <-2 SD
PovertyPercentage of population below the nationalpoverty line
Female Illiteracy Percentage of female population illiterate
IMR Number of infants deaths per 1,000 live births
Areas prone to flood anddrought
Average percentage of cultivated rice fielddestroyed over the last 3 years (2004-2006)
U5MRNumber of deaths for children under 5 yearsper 1000 live births
Access to safe drinkingwater
Percentage of households having access tosafe drinking water
Step 4: Filling up the IPC Analysis Template (Part One) for each province Each key reference outcome is analyzed separately and the appropriate phase for each indicator is determined. To support the analysis, templates are prepared to provide rigor and transparency, a salient feature of the IPC. The templates record details of each indicator. In addition to source, collection dates and geographic coverage, the templates also capture the evidence reliability score for each piece of evidence to be assigned by the analysts to the particular data set. These scores range from 1=very reliable, 2=somewhat reliable to 3=unconfirmed. Data were considered to be very reliable if the estimation and methodology were sound and the data were collected rather recently (2005-2006). Data were considered somewhat reliable if it was older, methodology less convincing or if the level of aggregation (agro-ecological zones or alike) was too high, thereby masking inter-provincial differences. Finally, data were deemed unconfirmed when the estimation methods and definitions were not clearly indicated by the source, sample sizes were too low to predict the provincial prevalence with high precision or if the data were likely to be outdated.

14
Also included in the templates is the indirect evidence taken into account while determining the overall phase classification. Part one of the analysis template was filled up for every province, following the design in table 1.1, including the indication of data source and its reliability score. Step 5: Assigning Phase Classification and Mapping Results After the templates were filled in with the data/information, each province was assigned a food security phase and early warning status, as reflected from the data. The overall impact of the combined information (direct indicator, indirect indicator) was considered while assigning an overall phase classification to each province. An early warning level (alert) was assigned to smaller areas exposed to flood-related hazards unique from the rest of the province. Although other hazards exist such as drought and/or mines and UXOs, floods were considered the most relevant for the next 6 months. Drought was not included as it would not have an impact on food security for at least 9 months from the time of the IPC analysis (i.e. February). As for UXO and mines, they were considered more as structural constraints than hazards. Although UXO and mines continue to cause casualties and damage to livelihoods, they are not considered as hazards because their impact more structural and long term. UXO and mine clearance are part of the government’s rural development strategy, supported by various donors and NGOs. The resulting classification is illustrated in a map with color codes for each Phase. Drop boxes with text and data are included to provide relevant information on population, type of hazards, trends and underlying causes. The IPC is a dynamic product. Each map indicates a time limit regarding the early warning forecasts. Through regular data collection, the map can be periodically updated so that decision makers have constant access to predictions of potential changes in the phase assigned to a particular area or group. Step 6: Validation of the Map though Task Force Throughout the previous 5 steps, three meetings were convened to inform stakeholders about the mission, to establish a working group that would provide further data, advice, review, and, finally, indicate consensus on the final product. In order to arrive at the level of consensus, draft templates and maps were disseminated prior to meetings and then jointly reviewed. Further to external stakeholders, WFP country office and sub-office staff were continuously involved in the review of the draft maps. A one-day field visit was also organized in two provinces (Kampong Chhnang and Kampong Spueu) for further discussions with key informants. Lastly, backstopping by an IPC expert helped throughout the process, especially on issues related to the IPC methodology. 1.3 Limitations The following limitations of the analysis process and data quality/availability need to be mentioned:
The low frequency of (primary) data collection, compounded by the high lead time between primary data collection and the official launch of reports resulted in a reliance on data from 2005 or before. Due to the fact that the mission team did not have the opportunity for primary data collection itself, depicting the most recent scenario was constrained by the available data. Sampling design of various surveys did not provide individual province-specific results for a number of indicators. Results were rather clustered together in agro-ecological zones

15
(Plateau/Mountains, Tonle Sap, Coastal, Plains) or similar aggregations. Thus the high aggregation level clearly limited the number of indicators that would help differentiate food security phases between provinces. In addition to the constraint of aggregation, the reliability scores of results needed to be reduced in cases, where for example the prevalence malnutrition indicators was based on sample sizes of around 70 children. Given that the IPC is designed for emergency situations and apart from the general lack of reliable data, the number of direct reference outcomes relevant to chronic food insecurity is considerably limited. Since Cambodia is known to be largely chronically food insecure with only two provinces being generally food secure, the current IPC classification did not allow for clear mapping out of differences between provinces. Therefore, the mission tried to divide the phase of chronic food insecurity into two phases, i.e. low and high chronic food insecurity. However, the distinction is rather based on preliminary thresholds for this sub-classification that need to be formally agreed upon during the refinement of the general IPC. Trend analysis as required by the IPC is hardly possible with data being two or more years old and with lack of evidence for the period 2005-07. Additionally, if an historic trend is considered it would be based, for many health indicators, on two points in time, i.e. 2000 and 2005. The possibility to obtain reliable projection for the coming years is, therefore, limited. By design, the IPC allows flexibility in phase determination. This flexibility is deliberately built-in to allow classification where data is limited in type, quality and quantity. The flexibility allows utilizing ‘all’ available data sources for a particular area. This means that different areas of the country were, at times, evaluated through different information sources and data sets. Such subjectivity exposes the classification to criticism where ‘expert opinion’ may in reality be ill-informed guesses. Finally, the limited timeframe for the field mission and the deadline to produce recommendations to help with the design of a WFP programme did not allow the team enough time to complete parts 2 and 3 of the IPC analysis templates. Furthermore, the timing of the assessment and the short notice given to stakeholders limited their involvement in the process.
16
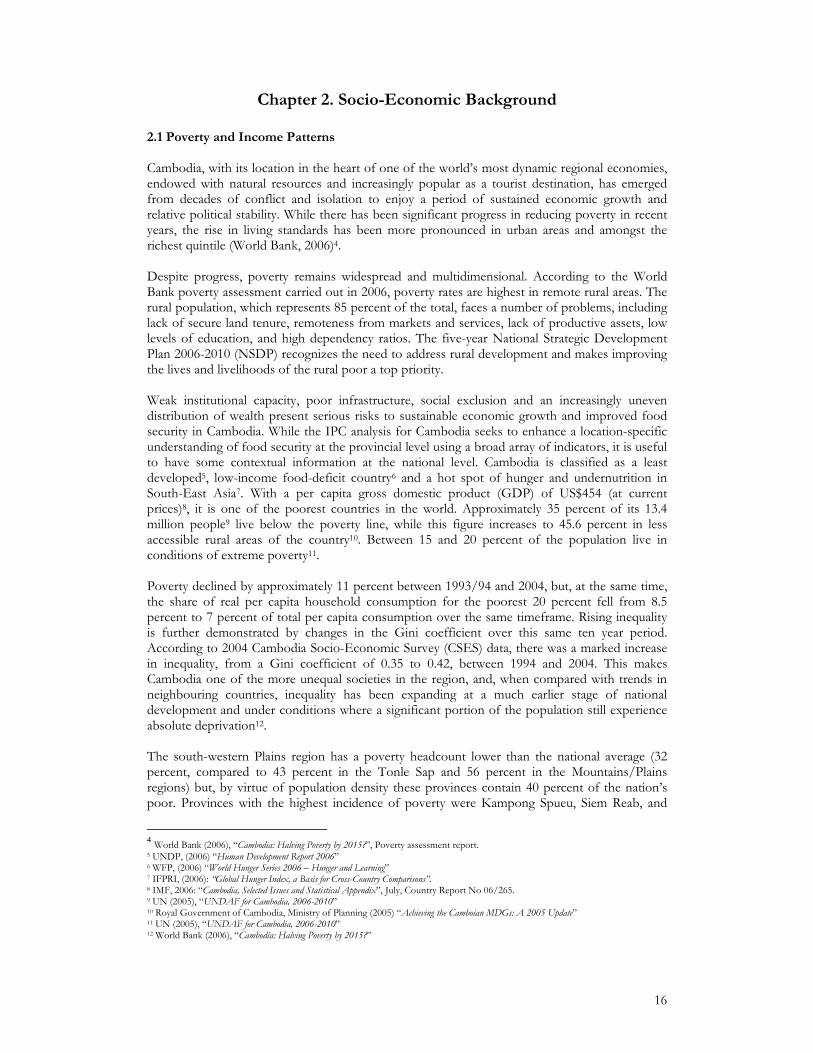
Chapter 2. Socio-Economic Background
2.1 Poverty and Income Patterns Cambodia, with its location in the heart of one of the world’s most dynamic regional economies, endowed with natural resources and increasingly popular as a tourist destination, has emerged from decades of conflict and isolation to enjoy a period of sustained economic growth and relative political stability. While there has been significant progress in reducing poverty in recent years, the rise in living standards has been more pronounced in urban areas and amongst the richest quintile (World Bank, 2006)4. Despite progress, poverty remains widespread and multidimensional. According to the World Bank poverty assessment carried out in 2006, poverty rates are highest in remote rural areas. The rural population, which represents 85 percent of the total, faces a number of problems, including lack of secure land tenure, remoteness from markets and services, lack of productive assets, low levels of education, and high dependency ratios. The five-year National Strategic Development Plan 2006-2010 (NSDP) recognizes the need to address rural development and makes improving the lives and livelihoods of the rural poor a top priority. Weak institutional capacity, poor infrastructure, social exclusion and an increasingly uneven distribution of wealth present serious risks to sustainable economic growth and improved food security in Cambodia. While the IPC analysis for Cambodia seeks to enhance a location-specific understanding of food security at the provincial level using a broad array of indicators, it is useful to have some contextual information at the national level. Cambodia is classified as a least developed5, low-income food-deficit country6 and a hot spot of hunger and undernutrition in South-East Asia7. With a per capita gross domestic product (GDP) of US$454 (at current prices)8, it is one of the poorest countries in the world. Approximately 35 percent of its 13.4 million people9 live below the poverty line, while this figure increases to 45.6 percent in less accessible rural areas of the country10. Between 15 and 20 percent of the population live in conditions of extreme poverty11. Poverty declined by approximately 11 percent between 1993/94 and 2004, but, at the same time, the share of real per capita household consumption for the poorest 20 percent fell from 8.5 percent to 7 percent of total per capita consumption over the same timeframe. Rising inequality is further demonstrated by changes in the Gini coefficient over this same ten year period. According to 2004 Cambodia Socio-Economic Survey (CSES) data, there was a marked increase in inequality, from a Gini coefficient of 0.35 to 0.42, between 1994 and 2004. This makes Cambodia one of the more unequal societies in the region, and, when compared with trends in neighbouring countries, inequality has been expanding at a much earlier stage of national development and under conditions where a significant portion of the population still experience absolute deprivation12. The south-western Plains region has a poverty headcount lower than the national average (32 percent, compared to 43 percent in the Tonle Sap and 56 percent in the Mountains/Plains regions) but, by virtue of population density these provinces contain 40 percent of the nation’s poor. Provinces with the highest incidence of poverty were Kampong Spueu, Siem Reab, and
4 World Bank (2006), “Cambodia: Halving Poverty by 2015?”, Poverty assessment report. 5 UNDP, (2006) “Human Development Report 2006” 6 WFP, (2006) “World Hunger Series 2006 – Hunger and Learning” 7 IFPRI, (2006): “Global Hunger Index, a Basis for Cross-Country Comparisons”. 8 IMF, 2006: “Cambodia, Selected Issues and Statistical Appendix”, July, Country Report No 06/265. 9 UN (2005), “UNDAF for Cambodia, 2006-2010” 10 Royal Government of Cambodia, Ministry of Planning (2005) “Achieving the Camboian MDGs: A 2005 Update” 11 UN (2005), “UNDAF for Cambodia, 2006-2010” 12 World Bank (2006), “Cambodia: Halving Poverty by 2015?”

17
Kampong Thum (Map 1). The highland tribal groups, living mostly in forested uplands of Rotanak Kiri, Mondol Kiri, Kracheh and Steung Traeng are the poorest among ethnic minorities. 2.2 Macro-Economic Performance
The Cambodian economy has experienced strong growth in recent years. Cambodia became the second LDC to accede to the WTO, in October 2004. Overall economic growth averaged nearly 8 percent between 2002 and 2006, while exports increased from US$1.8 billion to US$3.0 billion over the same period13. Similarly, foreign direct investment (FDI) expanded from US$139 million to US$394 million14. While this economic performance is certainly encouraging, it would be misleading to assume that such trends indicate an unqualified parallel with the export-led development miracles in neighboring countries. Cambodia currently has a trade deficit of approximately US$1.3 billion, and total outstanding debts in excess of US$2.2 billion or 34 percent of GDP15. However, with a short-term debt load of US$220 million and foreign exchange reserves in excess of US$1.0 billion, it is not currently vulnerable to the type of currency-driven crisis that affected East Asian economies in the late 1990s. According to the IMF, general inflation is projected to remain stable at about 3.5 percent over the next three years (2007-2009)16, but volatility in global oil prices may exert upward pressure on the inflation rate. Exports from the garment sector have been rising rapidly in recent years, increasing by over 10 percent to US$2.2 billion in 200517. Most of these exports are destined for the US and EU markets and are highly dependent on trade quotas placed by these markets on Chinese manufactures. Tourist arrivals increased by 35 percent to reach a total of over 1 million visitors in 2004.
As the World Bank notes, most of the economic activity related to tourism and the garment industry is concentrated in Siem Reab and Phnom Penh. Therefore, the major impacts on the rural economy are in the form of remittances. Recent studies indicate that only 13 percent of rural households received such remittances.18 Economic concessions have recently been given to explore for petroleum, natural gas, gold, and bauxite in Cambodian territory. The economic opportunities represented by the possible discovery and exploitation of these resources must, however, be balanced with realistic expectations related to corruption and the ‘resource curse’ experienced by other developing countries.19 Official employment data, which shows the unemployment rates at 1 percent or lower, cannot be relied upon or, due to the nature of definitions for employment used in Cambodia, used for comparison with other countries. However, data from the 2004 Inter-Censal Population Survey suggests that 7 percent of the population is unemployed. This figure counts those involved in agriculture and other seasonal occupations as employed, however, suggesting very high rates of under-employment. The same data indicates that 74 percent of the working population is employed in the primary sector, including agriculture, forestry and fisheries; 7 percent employed in the secondary sector, which comprises mining, manufacturing, and construction; and 18 percent in the tertiary sector, which includes services and the public sector20. Seasonal migration is common among agricultural households, with many migrants crossing into neighboring countries to find wage labor opportunities.
13 World Bank (2006), “East Asia Update: Key Indicators” 14 World Bank (2006), “East Asia Update: Key Indicators” 15 World Bank (2006), “East Asia Update: Key Indicators” 16 IMF, 2006: “Article IV Consultations”, July, Country Report No 06/264. 17 World Bank (2006), “East Asia Update: Cambodia Overview” 18 World Bank (2006), “East Asia Update: Cambodia Overview” 19 UNDP (2006), “A SWOT Analysis of the Cambodian Economy” 20 Royal Government of Cambodia, National Institute of Statistics (2004), “Cambodia Inter-Censal Populations Survey 2004”

18
2.3 Post-Conflict Stability
Cambodia has a history dominated by political instability and conflict, with six different political regimes and four distinct economic systems in effect since independence in 1953. In 1993, with the promulgation of a new constitution, Cambodia became a multi-party democracy with separate executive, legislative, and judicial branches of government. Freedom of the press in Cambodia is improving. Civil society organizations operate rather freely, with local and international NGOs able to criticize aspects of government policy and practice. Decentralization has moved forward, devolving increasing levels of resources and decision-making powers to provincial and commune-level authorities. Public administration and regulatory reforms have been undertaken and modest progress has been made in certain areas, such as in the recent passage of laws regulating economic concessions, investment, and commercial enterprises.
Despite some notable progress in key areas, governance weaknesses limit the potential for broad-based development. According to the IMF, low revenue has led to development spending shortfalls, while corruption has contributed to inefficient government services and contributed to the high cost of doing business. Cambodia ranks 130 (out of 158 countries) in Transparency International’s Corruption Perceptions Index.
2.4 Hazards Cambodia is one of the most disaster-prone countries in the region, experiencing disastrous flooding along the Mekong basin every couple of years, flash flooding in mountainous areas during the monsoon season, and regular localized drought in certain parts of the country. With a large proportion of the population dependent on alluvial or rain-fed agriculture as the main source of income and the cash economy only providing limited off-farm employment opportunities, natural disasters can have devastating consequences for the livelihoods of the food insecure. Major floods in 2000 affected approximately 3.4 million people, causing widespread crop failures, as well as damage to homes and infrastructure. Similar flooding occurred again in 2002 and 2004. Extensive drought conditions in 2004 led to major food shortages across many parts of the country. A report from the Ministry of Agriculture, Forestry, and Fisheries indicates that an average of 6 percent of crop land was destroyed by floods, crop infestation, and drought between 2004 and 200621. The amount of crop land destroyed ranges from a low of 1 percent in Svay Rieng and Siem Reab to highs of 15 percent in Kampong Speu and 22 percent in Mondol kiri22. Further threats to food security in Cambodia relate to the precariousness of the overall economic situation. Political instability could lead to a rapid withdrawal of investment capital. A global economic recession or change in the international terms of trade, such as a rapid and sustained increase in the price of oil, could slow economic growth. Other economic shocks could occur with a change to the international trade regime for garments, such as with the renegotiation of the multi-fibre agreement in 2008, or with a decline in tourism caused by a public health emergency, such as avian flu23.
21 Royal Government of Cambodia, Ministry of Agriculture, Forestry, and Fisheries (2007), Ministry Data 22 Royal Government of Cambodia, Ministry of Agriculture, Forestry, and Fisheries (2007), Ministry Data 23 World Bank (2006), “Cambodia: Halving Poverty by 2015?”

19
Map 2.1. Cambodia, Poverty Rates by province (CSES, 2004)

20
Chapter 3. Food Availability and Access
Food access and availability are analyzed using a combination of indicators. Following the IPC approach, a common reference for measuring adequate food access and availability for individual consumption is 2,100 kcal per person per day (FSAU, 2006). However, the energy intake measurement causes some methodological difficulties, as it hardly converges with the interpretation of indirect evidence in Cambodia. FAO estimates the minimum dietary energy requirement to be 1,719 kcal/person/day24. This minimum dietary energy requirement is used to estimate the prevalence of undernourishment according to the FAO approach25. The World Bank and the Ministry of Planning use a different threshold to calculate the food poverty line for Cambodia. The food poverty line is obtained by translating the food intake into Riels at constant prices to achieve a level of 2,100 kcal/person/day. Given the methodological uncertainties, a broader approach, emphasizing more indirect evidence was preferred to the calorie intake approach. A phase classification of food availability and access resulting from these broad-based indicators is summarized below.
Table 3.1. Summary of Availability and Access Reference Indicators
Calorie intake (# income
deciles below 2100 Kcal)
3-year average rice area
destroyed by drought (%)
3-year average rice area
destroyed by flood (%)
Draught Power
(#head/Ha)
Rice self-sufficiency (average
Kg/capita, 2005-2006)
Poverty rate (%)
Tonle Sap Banteay Mean Chey LCFI 4.0 2.3 0.3 0.2 165.5 37.2Tonle Sap Bat Dambang GFS 4.0 3.2 0.3 0.3 192.0 33.7Plains Kampong Cham LCFI 3.0 6.9 1.6 0.9 41.3 37.0Tonle Sap Kampong Chhnang LCFI 4.0 2.5 0.1 0.8 139.4 39.6Plateau Kampong Spueu HCFI 5.0 14.9 0.1 1.8 17.1 57.2Tonle Sap Kampong Thum HCFI 4.0 7.2 1.5 0.7 132.7 52.4Coastal Kampot LCFI 1.0 3.7 0.2 1.4 130.3 30.0Plains Kandal LCFI 5.0 5.9 1.3 0.6 10.8 22.2Coastal Kaoh Kong LCFI 1.0 0.6 5.8 0.7 -85.4 23.2Plateau Kracheh LCFI 5.0 11.0 2.7 1.3 18.1 46.1Coastal Krong Kaeb LCFI 1.0 0.0 0.5 1.9 -43.5 23.2Plateau Krong Pailin LCFI 4.0 1.5 0.0 0.1 -25.0 46.1Coastal Krong Preah Sihanouk LCFI 1.0 0.7 0.1 0.4 -65.4 23.2Plateau Mondol Kiri HCFI 5.0 20.2 2.2 93.7 46.1Plateau Otdar Mean Chey HCFI 5.0 0.6 0.0 0.6 322.4 46.1Phnom Penh Phnom Penh GFS 3.0 3.1 4.4 1.2 -134.7 4.6Tonle Sap Pousat HCFI 4.0 5.2 0.4 0.8 114.5 39.6Plateau Preah Vihear HCFI 5.0 4.7 1.7 1.8 79.3 46.1Plains Prey Veaeng HCFI 3.0 3.9 2.3 0.5 303.4 37.2Plateau Rotanak Kiri HCFI 5.0 9.0 2.2 0.4 22.9 46.1Tonle Sap Siem Reab HCFI 4.0 0.9 0.0 0.8 70.9 51.8Plateau Stueng Traeng HCFI 5.0 4.4 2.7 0.7 163.1 46.1Plains Svay Rieng LCFI 2.0 0.5 0.0 0.9 127.4 35.9Plains Takaev LCFI 2.0 1.6 0.1 0.6 328.8 27.7National Average 4.8 0.1 1.3 88.3 35.9Maximum Value 20.2 5.8 1.9 328.8 57.2Minimum Value 0.0 0.0 0.1 -134.7 4.6
Legend Generally food secure GFS <=2 decile <5 <5 >2 >88.3 <25Low chronically food insecure LCFI 3 deciles 5-<10 5-<10 1-<2 0-88.3 25-35.9High chronically food insecure HCFI > 3 deciles >=10 >=10 <1 <0 >36
Ecological Zone
Province
Overall Phase Classification
of the Province
Food Availability, Access and Livelihood Indicators
The rest of the chapter analyzes the underlying causes of the food security status depicted by the above summary table.
24 Minimum Dietary Energy Requirements: In a specified age and sex group, the amount of dietary energy per person is that considered adequate to meet the energy needs for maintaining a healthy life and carrying out a light physical activity. In the entire population, the minimum energy requirement is the weighted average of the minimum energy requirements of the different age and sex groups in the population. This is expressed in kcal per person per day. 25 The 1,719 kcal data is a threshold of minimum energy requirements for measuring the prevalence of food deprivation. This is based on a minimum acceptable weight (5th percentile of reference population) for Cambodian attained heights, energy requirements, current sex-age population structure and a minimum sedentary physical activity.

21
3.1 Rice Self-Sufficiency Status Rice is by far the most important food item in the daily diet of Cambodians. According to CSES 2004 data, rice consumption accounts for almost two-third of the calorie intake, followed by fish (8 percent on average). MAFF estimates indicate that Cambodia has maintained a national surplus of rice production since 1995/96. According to MAFF, rice surplus was estimated at 1.4 million mt in 2006, after adjusting for per capita food requirement of 143kg per year. However, while some provinces have large rice surpluses, others face regularly rice shortages (figure 3.1), aggravated in some years by adverse climatic conditions such as droughts and floods. Over the last two years (2005 and 2006), six provinces (out of 24) are reported to be rice deficient (Kraceh, Phnom Penh, Kaoh Kong, Krong Keab, Krong Preah Sihanouk and Krong Pailin) and four are at the edge of self-sufficiency (Kampong Cham, Rotanak Kiri, Kampong Spueu and Kandal).
Figure 3.1. Trend of rice balance per province (2002-2006)
-300,000
-200,000
-100,000
0
100,000
200,000
300,000
400,000
500,000
600,000
(Ton
es)
2002 2003 2004 2005 2006
Kampong Cham Kandal Takaev Svay Rieng Prey Veaeng Kampong Thum
Kampong Chhnang Pousat Kaoh Kong Krong Preah Sihanouk Krong Kaeb Kampot
Kampong Spueu Krong Pailin Kracheh Mondol kiri Rotanak Kiri Stueng Traeng
Preah Vihear Otdar Mean Chey Banteay Mean Chey Siem Reab Bat Dambang Phnom Penh
Source: MAFF data 3.2 Food Imports Although official figures indicate Cambodia is self sufficient in rice production, the country remains a net importer of rice, indicating that part of household rice requirements is met through external markets. According to FAO data, rice imports have almost doubled from 2000 to 2004, rising from less than 40,000 mt in 2000 to more than 70,000 mt in 2004. However, import figures could be misreported given the cross-border trade between some surplus rice-producing areas, such as Bat Dambang, and Thailand, where paddy is reported to be exported and milled on the Thai side of the border and then imported back into Cambodia.

22
Figure 3.2: Imports and Exports of Rice (2000-2004, mt)
0
10,000
20,000
30,000
40,000
50,000
60,000
70,000
80,000
2000 2001 2002 2003 2004
Rice Import Rice Export
Source: FAOSTAT 3.3 Food Aid Cambodia has been receiving food aid, predominantly rice, for more than two decades now. However, the country has reduced its food aid dependence over the last years. From a high of 120,000mt of food aid per year in the early 1980s to support refugee operations on the Thai border, food aid shipments to Cambodia have consistently ranged from 30,000mt to 50,000mt for the past ten years. In terms of share of food consumption, the share of food aid in overall food consumption declined from 2.3 percent in 1990-92 to 1.4 percent in 2001-03. WFP has been the major food aid donor in Cambodia from the Khmer Rouge period to the present, but considerable levels of food assistance were channeled through NGOs, as well. The average level of food aid distributed by WFP for the period 1999-2006 was 38,000mt, varying between a high of 62,000mt in 2002 and a low of 15,000mt in 2005. Data on NGO food assistance is not available over this period, but figures for 2005 indicate that USDA provided 9,400mt to Cambodia through several NGOs. Food aid from donors accounts for a relatively small share in total food available at national level. As shown in table 3.2 below, the amount of food aid entering Cambodia through WFP has been erratic over the last 8 years. In this period, some 250,500 mt of rice were donated through WFP. In 2006, WFP distributed about 19,000 mt, representing 0.3 percent of the total rice production in 2006 and 1.4 percent of the rice surplus.
Table 3.2. Food Aid Distribution in Cambodia by WFP (mt)
YEAR Rice Veg. Oil Fish/
CannedSalt Corn-Soya
Blend/Pea- Wheat Blend
Sugar Beans TOTAL
1999 23,906 1,567 959 200 0 0 0 26,632
2000 51,536 1,394 1,857 478 3,667 278 0 59,210
2001 45,582 1,510 643 295 2,752 449 0 51,230
2002 53,205 2,409 2,875 357 2,365 420 0 61,632
2003 15,412 948 1,425 397 877 0 0 19,059
2004 31,203 1,786 777 230 2,901 257 0 37,154
2005 10,687 115 150 200 1,591 70 2,241 15,054
2006 18,970 198 942 211 3,653 417 620 25,010
Total 250,500 9,926 9,629 2,368 17,805 1,891 2,861 294,980
Source: UN-World Food Programme, Cambodia Office

23
3.4. Food Consumption and Dietary Diversity The household socio-economic survey of 2004 indicates a significant reduction in poverty, falling from 47 percent to 35 percent since 1994. Based on a comparable sample frame, the poverty in both rural and urban areas has fallen. However, 91 percent of the poor live in rural areas. Per capita consumption also increased across all expenditure groups. Within a geographically comparable sample frame, the real per capita household consumption increased by 32 percent between 1994 and 2004. However, the increase was lower in rural areas, at 24 percent, than it was in urban areas. Rising living standards were also reflected through an increased proportion of expenditure on non-food items. While overall consumption improved for all quintiles between 1994 and 2004 (figure 3.3), this growth has not been evenly distributed. Consumption in rural areas grew at a slower pace than it did in urban areas, indicating continued higher levels of poverty. In 1994, real consumption in rural areas was 67 percent compared to other urban areas. This fell to 61 percent in 2004. Similarly, the growth in consumption has not been uniform across consumption quintile groups. While real per capita consumption increased significantly in all quintile groups between 1994 and 2004, the relative gains were inversely related to the initial level of average per capita consumption. Real per capita consumption in the poorest quintile increased by only 8 percent, whereas, for the richest quintile, it rose by 45 percent. These data suggest that the share of total consumption for the poor fell between 1994 and 2004. As reflected in Figure 3.3, the average consumption of the bottom two quintiles is extremely low, indicating chronic energy deficiency among these groups.
Figure 3.3. Average Energy Consumption of the Quintiles – 1994 and 2004
010002000300040005000600070008000
Poore
st
Next P
oore
st
Middle
Group
Cambo
dia A
vera
ge
Next R
iches
t
Riches
t
Kca
l/cap
ita
1994
2004
A draft statistical report prepared by National Institute of Statistics and FAO, using CSES 2004, suggests low dietary diversity, especially in rural areas. The ratio of calorie per Riel spent in rural areas is lower than in Phnom Penh, except for rice. For fish and seafood, the ratio is 1.31 in Phnom Penh and 0.31 in rural areas. For meat and poultry, this ratio stands at 0.57 in Phnom Penh, against 0.36 in rural areas. According to these figures, rural households would allocate more food expenditure to other food items than to protein sources to meet their calorie requirement. Rice and fish cover respectively 69 percent and 6 percent of calorie needs, in rural areas. With the predominance of rice in their diet, rural households can be vulnerable to food insecurity due to fluctuations of rice prices and production levels. Seasonal variations in food consumption in rural areas closely follow seasonal variations in local food supply, particularly among poorer families or in more remote areas where the community is less integrated into wider markets. Some of the most food-insecure farming households often only have rice stocks sufficient to last three to six months of the year. Accordingly, the more food-insecure households may start being short of rice from March onwards, till the next harvest in December. Many rural households are short of food from May to August, but September to November is usually the period in which food stocks are the lowest. Inland fish is more abundant

24
between November and early February, but processing of fish by traditional methods provides some continued fish protein throughout the year. According to CSES 2004 data, other food items account for less than 25 percent of rural household calorie consumption. Livestock products, chickens, ducks and eggs can provide regular food supplies throughout the year but account for only 6 percent of the calorie intake. Fruits and vegetables are harvested at various times of the year in different parts of the country. On average, they make up about 8 percent of the calorie intake at the household level. The main gaps in fruit and vegetable supply are in April/May, and again in September/October. Accordingly, there are two periods in the year when rural food supply from local production can be weak, namely June/early July (the time of transplanting and weeding) and late September/October (just before the main harvest). 3.5 Livelihoods Income-generation activities: Agro-climatic conditions largely influence income diversification of the households. Rural households in Cambodia depend on multiple sources of income for their livelihoods, but they differ according to the agro-climatic conditions. The majority of rural residents still live in traditional ways, primarily cultivating rice and collecting natural resources from water bodies and forests. Agriculture - defined here as including crop and livestock production, forestry and fishing - remains the primary occupation for 72 percent of households, yet accounts for only 31 percent of GDP. The importance of off-farm income is growing rapidly, like remittances, wage labour and non-agricultural self employment etc. According to CSES 2004, 30 percent of the poor’s income is sourced from crop cultivation against 10 percent for livestock rearing and 25 percent for common property resources, such as forestry and fisheries. The remaining income is sourced from non-agricultural activities, wage employment, remittances and transfers. Among wealthier households, the dependence on agriculture declines and the significance of non-agricultural activities and wage employment increases. In terms of employment, the agricultural sector employs almost 60 percent of the people over the age of ten (table 3.3). The CSES 2004 data shows the dominance of agricultural sector in all provinces except in Phnom Penh. The industrial sector is most vibrant in Phnom Penh, Kaoh Kong, Krong Preah Sihanouk and Kandal. The services sector employs as much as 70 percent in Phnom Penh. Other provinces with considerably high proportion of employment in the tertiary sector are Kaoh Kong, Krong Preah Sihanouk, Kandal, Bat Dambang, Krong Pailin, Banteay Mean Chey, Otdar Mean Chey and Kampong Cham. Child involvement in economic activity is widespread in Cambodia and considered as a key obstacle to achieving universal primary education and other Millennium Development Goals (ILO, UNICEF, World Bank, 2006)26. In total, an estimated 52 percent of 7-14 year-olds, over 1.4 million children in absolute terms, were economically active in the 2001 reference year, reaching a high of 80 percent in some provinces, such as Kampong Speu. While child participation in economic activities can be seen as a means for households to meet basic needs requirements, the long term impact of this phenomenon is harmful to the welfare of individual children and limits the pace of broader national poverty reduction and development efforts.
26 ILO, UNCICEF, World Bank (2006): Children’s Work in Cambodia: A Challenge for Growth and Poverty Reduction, Report No 38005, December.

25
Table 3.3. Provincial Distribution of Employment by Sector
Primary Sector Province
Crop Livestock Forestry Fishery Total
Secondary sector
Tertiary sector
Banteay Mean Chey, Otdar Mean Chey 67.8 5.4 0.2 0.3 73.7 8.7 17.6
Bat Dambang, Krong Pailin 69.6 4.4 0.2 2.6 76.8 4.6 18.5 Kampong Cham 70.9 5.9 0.4 1.5 78.7 6.1 15.2 Kampong Chhnang 78.4 2.2 2.3 1.3 84.3 3.6 12.1 Kampong Spueu 85.2 3.4 0.3 88.9 5.6 5.4 Kampong Thum 69.0 6.0 0.1 2.5 77.6 3.7 18.6 Kampot, Krong Kaeb 77.3 7.2 0.0 1.3 85.8 2.8 11.5 Kandal 56.9 1.5 0.4 4.3 63.2 14.7 22.0
Kaoh Kong, Krong Preah Sihanouk 33.9 0.9 1.4 11.4 47.5 13.3 39.2
Kracheh, Mondol Kiri, Preah Vihear, Rotanak Kiri, Stueng Traeng 80.6 1.9 0.6 1.1 84.2 2.1 13.6
Phnom Penh 3.6 0.3 1.3 5.2 25.4 69.4 Prey Veaeng 83.0 5.5 0.1 0.5 89.1 2.4 8.5 Pousat 74.5 5.5 0.6 2.4 83.0 4.3 12.7 Siem Reab 73.0 3.6 0.5 0.6 77.8 6.8 15.4 Svay Rieng 85.1 5.9 0.3 91.4 1.2 7.4 Takaev 81.9 3.1 0.1 0.1 85.2 3.5 11.2 Total 68.7 4.1 0.4 1.6 74.7 7.0 18.3
Data: CIPS 2004 Draught power: A major constraint on many households is inadequate means of food production. Most Cambodian farmers rely heavily on draught animals to cultivate their land. Buffalo are usually used in pairs for ploughing. Cattle (and horses) are preferred for pulling carts. The level of farm mechanization is very low and most forms of mechanization are uneconomical for many producers. The total number of draught animals available for the rice cultivation is considered to be low, despite the continued increase of draught cattle. Most of the provinces have insufficient number of cattle per hectare of paddy field cultivated, especially in the major rice production regions, such as the Tonle Sap and the plains. Key informant discussions in Kampong Chhnang province suggest that the majority of small farmers do not have a pair of draught animals and have to share with neighbors if they have only one, as they do not have access to sufficient credit to purchase them. Besides constraints on farming households, insufficient numbers of draught animals put small farmers at risk of vulnerability. If a household loses its draught animals through accident, theft, landmine, disease or financial difficulties, they may have difficulty in accumulating sufficient funds for replacement animals. With high hiring costs, this can lead households into longer-term food insecurity. Natural Resources: A large proportion of poor depend heavily on forestry and fisheries as their sources of income, especially during periods of adversity. The Tonle Sap and Mekong River provide abundant fish stocks. CSES 2004 data reveal that approximately 16 percent of the poor derive more than 50 percent of their income from forestry and fisheries. Land tenure: The average farm size in rural Cambodia is 1.5 ha. Almost 40 percent of rural farmers possess only 0.5 ha of farm land, which provides less than 50 percent of their annual rice consumption requirements, or 165 kg. Moreover, with the rise in population, land is increasingly scarce in some parts of the country. Distress land sales, land grabbing and speculative land purchases are causing rising inequality in land ownership. Landlessness has been rising steadily – from 13 percent in 1997 to 20 percent in 2004. Land tenure in Cambodia remains insecure mainly for the rural poor, which acts as disincentive for productive investments and limits access to credit. According to CSES 2004, secure land tenure in the form of a certificate for land title

26
increases rental value by 57 percent, sale value by 38 percent, crop yields by 65 percent, and household consumption by 24 percent. 3.6 Education
Although Cambodia has made considerable progress in expanding basic education in recent years, high dropout rates, low retention and the inadequate quality and acute shortage of teachers, especially in remote rural areas, remain major concerns. The number of primary teachers has increased by only 7 percent since 1993, compared with a 67 percent increase in enrolment, resulting in a high pupil-teacher ratio of 56:127. A main factor contributing to high drop-out and low retention rates is the high proportion – 40.5 percent28 – of “incomplete” schools, which are unable to offer the full six years of primary education.
With the abolition of school fees in 2001, the primary school net enrolment rate has increased significantly over the past years, though enrolment rates remain relatively low in Rotanak Kiri, Mondol Kiri and Kaoh Kong as shown in the table below. According to the Education Management Information Systems (EMIS) data, the WFP School Feeding Programme has had a positive impact on the net enrolment rate. The net enrolment rate for the districts covered by WFP was 92 percent (91.23 percent for female pupils) while net enrolment nation wide is 91.3 percent in school year 2005-06. Further analysis of EMIS data shows that the net enrolment had a net increase from 95.52 percent to 96.04 percent in the districts where WFP assisted more than 90 percent of the schools over the academic period of 2004-2005 to 2005-2006. The attendance rate for the academic year 2005-2006 was very high. In 2005-2006, girls in all WFP-assisted schools attended 97.5 percent of the school days, and boys attended 97 percent of the school days. In 2005-2006, out of the total number of children enrolled in the supported schools in grade 6, 91.89 percent of girls and 90.29 percent of boys successfully completed and passed grade 6. The gender ratio has increased from 0.82 to 0.92 in existing schools, and from 0.86 to 0.95 in new schools during the academic years 2003-2004 and 2005-2006 respectively. This represents an increase of 10 girls for every 100 boys in existing schools, and 9 girls for every 100 boys in new schools within the same period of school year. Overall, primary attendance and completion rates remain low as opposed to net enrolment rates (table 3.4). In the 2006 WFP base line survey29, focus group discussions with parents, teachers and students explored the reasons for non-enrolment, drop-out and absenteeism. The main reasons cited for children not enrolling in school were poverty, followed by the negative attitude of parents towards the value of education, illness or disabilities, distances from school and alternative employment.
27 EMIS, 2005 28 World Bank, 2005 29 WFP Baseline Survey, 2006

27
Table 3.4. Summary of Education Reference Indicators
Primary net enrolment ratio (%)
Primary attendance
rate (%)
Primary Completion
rate (%)
Drop out rate (%)
Female illiteracy rate
(%)
Tonle Sap Banteay Mean Chey LCFI 93.7 75.0 40.2 12.7 34.5Tonle Sap Bat Dambang GFS 92.3 80.0 36.0 14.0 32.3Plains Kampong Cham LCFI 87.3 65.0 35.2 13.6 34.8Tonle Sap Kampong Chhnang LCFI 96.6 70.0 52.2 9.1 40.2Plateau Kampong Spueu HCFI 89.9 70.0 31.2 15.6 37.5Tonle Sap Kampong Thum HCFI 92.3 67.0 37.0 13.9 34.7Coastal Kampot LCFI 91.8 65.0 52.2 9.4 31.8Plains Kandal LCFI 95.8 81.0 61.1 7.0 26.1Coastal Kaoh Kong LCFI 78.3 50.0 34.1 14.8 32.4Plateau Kracheh LCFI 93.4 60.0 41.4 12.0 45.5Coastal Krong Kaeb LCFI 94.7 75.0 40.8 12.8 31.8Plateau Krong Pailin LCFI 91.7 65.0 41.4 11.8 32.3Coastal Krong Preah Sihanouk LCFI 95.5 38.4 13.4 32.4Plateau Mondol Kiri HCFI 79.5 40.0 28.2 19.5 45.5Plateau Otdar Mean Chey HCFI 88.9 55.0 34.9 13.3 34.5Phnom Penh Phnom Penh GFS 91.6 83.0 63.9 6.7 15.2Tonle Sap Pousat HCFI 84.2 70.0 36.5 14.3 36.3Plateau Preah Vihear HCFI 88.2 40.0 35.5 14.0 45.5Plains Prey Veaeng HCFI 92.4 30.0 45.4 11.0 34.7Plateau Rotanak Kiri HCFI 67.5 45.0 21.2 20.9 45.5Tonle Sap Siem Reab HCFI 95.4 55.0 30.4 15.6 40.5Plateau Stueng Traeng HCFI 89.8 60.0 35.6 14.0 45.5Plains Svay Rieng LCFI 90.8 80.0 51.9 9.0 27.6Plains Takaev LCFI 94.9 80.0 62.5 6.7 32.3National Average 91.3 63.5 42.9 11.7 35.9Maximum Value 96.6 83.0 63.9 20.9 45.5Minimum Value 67.5 30.0 21.2 6.7 15.2
Legend Generally food secure GFS >91.3 >=80 >75 <10 <20Low chronically food insecure LCFI 80-91.3 80-63.5 43-75 10-15 20-35.9High chronically food insecure HCFI <80 <63.5 <43 >=15 >=36
Ecological Zone
Province
Overall Phase Classification
of the Province
Education Indicators
3.7 Risks, Vulnerability and Coping Strategies People in Cambodia are exposed to a variety of risks that could cause relatively wealthy households to become poorer and drive the poor into destitution (World Bank, 2005). Idiosyncratic shocks such as illness, field or farmer specific crop failure, loss of livestock, theft or violence expose the vulnerability of the poor. Mines/UXOs cause death or injury to family member – the “breadwinner”, the caregiver (mother), or children. They can also cause loss of livelihood assets – death or injury to draft animals. The presence of UXO / landmines or even the fear of presence constrains farmers’ ability to open new land for cultivation. The extra safeguards provided by the USA and the EU through 2008, after the expiry of Multi-Fiber Agreement (MFA) in 2005, helped the Cambodian garment industry to continue recording impressive growth. If it is not replaced by another protection measure after 2008, many people will face the prospect of unemployment. With the approval of Viet Nam’s membership by the General Council of WTO on 7 November 2006, the Cambodian garment industry will face increasing competition in the near future. As shown in previous sections, vulnerability to these shocks is heightened by the following factors: (i) limited asset base, (ii) underdeveloped basic services; (iii) lack of economic diversification among rural poor households; (iv) over-dependence on common property resources, especially when these are declining; (v) insufficient access to cultivable land, mainly for the poor, and (vi) unstable weather conditions with persistent drought in some parts of the country.

28
In response to these shocks and stresses, rural households adopt a range of coping strategies, which themselves contain inherent risks. The coping strategies of rural households concern the re-allocation of resources at their disposal to try to continue to meet basic needs. A literature review carried out by Helmers, Gibson and Wallgren in 2004, summarizes the ways in which households cope with food insecurity. Recent assessments conducted by OXFAM in 2005 and 2007 suggest that coping strategies remain unchanged over time and space. All these reports converge on the fact that coping strategies for the poorest households consist of re-allocating labour (including child labour) and reducing consumption. For wealthier households, a wider range of coping strategies are available, as shown in table 3.5 below. Common coping strategies related to activities among rural households include the use of savings, reducing consumption, borrowing money or rice and fishing. Less common coping strategies include exploiting forest resources, a household member engaging in long-term migration for work, or gaining various forms of external assistance. Economic migration is reported to be the third reason to move to another province, following family movement and marriage (CIPS, 2004). The proportion of economic migrants in search of employment is relatively high in some provinces (e.g. 14.9 percent in Kaoh Kong and Krong Preah Sihanouk, 9.6 percent in Phnom Penh and 8 percent in Bat Dambang). Concerning external assistance, it is noteworthy that only 11-20 percent of households are able to gain help from friends and relatives in coping with crises. Coping strategies related to asset disposal are less prevalent but are a more drastic means to cope. The distress sale of agricultural land is a classic example of a rural coping strategy. Between 2 and 6 percent of households sell land in response to crises per year, which contributes to the rapid escalation in rates of landlessness in rural communities. The sale of cattle or buffalo to meet consumption requirements increases the vulnerability of poor households by depleting their agricultural draught power and asset base.
Table 3.5. Prevalence of Coping Strategies Among Households During Preceding Year (% of HHs)
UNICEF
1998 WFP 1999
UNICEF 2000
Seila 2001
CDRI 2002
Sell any agricultural land? 6 3 6 4 2 Rent out any agricultural land? 6 2 - 5 - Use savings? - - - - 68 Reduce consumption? - - - - 68 Borrow money from a moneylender? 50 35 40 39 50 Borrow rice from non-family members? 48 53 35 14 - Sell any plough animals? 23 9 23 8 - Sell any other cattle or buffalo? 15 11 - 5 - Sell any mature pigs? - - - 32 - Sell any animals? - - - - 8 Sell transport, farm, or house equipment? 6 2 4 1 - Sell your house? 3 1 - <1 - Eat /sell products from forest/scrub areas? - 70 - 18 - Go fishing to get food or income? 61 60 - 40 - Go fishing in the dry season? 27 36 - 21 - Member migrated to work for >=6 months? - 8 19 7 9 Have help from relatives and friends? 16 20 11 16 12 Have help from an NGO? 11 42 9 7 16 Have help from the Government? 10 20 6 20 35 Have help from the Wat (pagoda) - - - <1 - Place children in labor service >=6 months? 4 2 3 <1 5 Give children to a guardian for >=6 months? 1 1 - <1 - Go begging >= 3 months or more? 1 <1 - <1 -
Source: Kent Helmers, John Gibson and Pia Wallgren (2004): Rural Sources of Income and Livelihood Strategies Study, Final Report, June.

29
Chapter 4. Food Market and Household Food Security
While market indicators are not referred to as outcome indicators, they are considered as supporting evidence or underlying factors in food availability and access in the IPC situation analysis30. Markets play an important role in addressing food insecurity, although the fact that hunger exists does not necessarily mean that markets are inefficient31. Factors limiting access to adequate quantities of food include: i) market imbalances between supply and demand, ii) difficulty in physical access to markets, iii) inadequate purchasing power or iv) price shocks. The aim of this chapter is to analyze the role of these factors in determining food availability and access in Cambodia. It focuses mainly on rice marketing and its implications for household food security. 4.1 Food Marketing Channels
There are various intermediaries in the chain from paddy production to rice consumption: farmer, paddy collector/trader, miller and consumer (domestic and export). Farmers sell their produce to paddy collectors/traders, millers or directly to consumers. The small scale household production system leads to low bargaining power when it comes to selling the un-milled paddy at the end of the harvest (December-February) and low farm-gate prices. Reportedly, financial needs (credit repayment, labor hiring for harvest, school fees, etc.) during the harvest season and lack of storage facilities lead farmers to sell their rice at harvest time at a low price32. Farmers represent the lowest link on the marketing chain, and, therefore do not capture high cash returns on their production. Meanwhile, the mark-up earned by intermediaries can reach 10 to 15 percent of the market price (UNDP, 2004).
The knowledge about the current structure and functioning of domestic food trade remains weak, despite recent efforts undertaken by the government with support of donors. The Ministry of Agriculture, Forestry and Fisheries (MAFF) has set up an agricultural market information system (MIS) to collect and publish wholesale prices of local food commodities on a monthly basis. However, both the MIS and the National Institute of Statistics (NIS) price collection systems have limited coverage as they concentrate on market prices collected in urban centers33. In cooperation with the Japan International Cooperation Agency (JICA), an open paddy market (OPM) has been established by MAFF to provide an advance payment system to paddy farmers aimed at reducing distress sales during the harvest season. Further partnership has been reached with the Canadian International Development Agency (CIDA) to improve agricultural marketing information in Cambodia. 4.2 Cross-Border Trade of Food and Trade Regime
Informal trade via Cambodia’s borders with neighboring Thailand and Vietnam has an influence on Cambodia’s food supply, but distortions in the formal trade regime keeps prices high on the domestic market. There are no quantitative restrictions on imports into Cambodia, such as import licenses or quotas, except on certain prohibited items, such as arms34. Tariffs on goods consist of Ad Valorem duties, based on the value of goods when they arrive at customs, including insurance, freight, and other duties and taxes. In addition, these goods are subjected to a ten
30 FSAU (2006): Integrated Food Security and Humanitarian Phase Classification: Technical Manual, Version 1, Technical Series, Report IV.11, May 2006, page 19. 31 WFP (2006): Cash in Emergencies and Transition, Technical Meeting Report, Addis Ababa 3-5 October. 32 UNDP (2004): The Macroeconomics of Poverty Reduction in Cambodia, 33 The marketing information system of the Ministry of Agriculture, Forestry and Fisheries (MAFF) collects wholesale prices while the National Institute of Statistics collects only urban prices in just six provinces, including Phnom Penh. These prices, however, may not reflect properly the price behavior in rural areas. Therefore, they cannot provide sufficient knowledge of market integration between surplus and deficit areas or urban and remote areas of the country. 34 Cambodia Development Resource Institute –CDRI (2005): The Cross-Border Economy of Cambodia, An Exploratory Study, Working Paper 32, Kingdom of Camodia.

30
percent value-added tax (VAT)35. Currently, food imports are subject to a 7 percent tariff, constituting the lowest category of a four-band import tariff system. Cambodia also restricts exports of rice, imposing a 10 percent tax on raw materials and 5 percent on processed products (including rice) (CDRI, 2005). The combination of tariffs and export taxes creates a higher effective rate of protection and a greater incentive to sell domestically because of the higher prices prevailing in the domestic market36.
Informal cross-border trade between Cambodia and Thailand is reported to be thriving (S. Leung, 2006). Imports consist of food products such as rice, fruits, vegetables and processed foods and equipment (kitchen utensils, bicycles, spare parts for water pumps, ploughs and hoes)37. Border provinces involved in cross-border trade are Bat Dambang, Bantey Mean Chey, Kaoh Kong and Pousat at the border with Thailand, Preah Veaeng, Takaev, Kracheh, Mondol Kiri and Svay Rieng at the border with Vietnam.
Reportedly, very few official exporters are involved in the rice marketing channel due to high entry costs and restrictions on rice exports. Storage, milling and transport costs are reported to account for 5-10 percent of the price. The level of resources needed to enter the export market is also increased by time-consuming procedures to get export licenses38. 4.3 Food Price Patterns
The national consumer price index (CPI) indicates an upward trend of food prices from 2000 to 2005. On average, food prices increased faster than the overall inflation rate since 2003. This can be explained as a result of production shortfalls in several provinces caused by drought in 2004 and 2005, as well as the inflationary effect of the distorted trade regime. As a result, market prices for rice have almost doubled, implying that informal and official imports have only a limited stabilizing effect on food prices.
Figure 4.1. Cambodia, Annual Average Inflation Rates (2000-2005, in %)
-4
-2
0
2
4
6
8
10
2000 2001 2002 2003 2004 2005
Total inflation Food Price Change
Source: National Institute of Statistics.
In a normal year, rice prices would generally increase from 600 to 900 Riel/kg during the dry season (April-May) and the lean season (August-November) and decrease from December to March (harvest and post-harvest seasons). However, in years of significant production shortfall, the rice price increase can fluctuate between 1,000 and 1,500 Riel/kg, especially during the lean season.
35 IMF (2006): Article IV, Selected Issues, Country Report No. 06/265, July
36 S. Leung (2006): Integration and Transition- Vietnam, Cambodia and Lao PDR, Paper prepared for the seminar “Accelerating Development in the Mekong Region–the Role of Economic Integration”, Siem Reab, Cambodia, June 26-27, 2006. 37 OXFAM (2007): Food security and Livelihoods Baseline Assessment Report Andoung Pou Commune, in Romeas Hek District, Svay Rieng Province - Cambodia 38 Economic Institute of Cambodia (EIC, 2006): Cambodia Competitiveness Report 2005-2006, page 19-23.

31
According to NIS data covering Bat Dambang, Kandal, Kampong Cham, Siem Reab, Sihanoukville and Phnom Penh, the food price increase is reflected by rice price increase (in real terms) at provincial level over the last five years (figure 4.2). The real price level of rice is low in Bat Dambang compared to other provinces because of its surplus production status. However, the increase of the real price (of both the second quality rice and the first quality rice) is one of the highest in Bat Dambang. As can be seen below, the price increase was higher in the drought years of 2004 and 2005. In 2006, the real price increase was maintained despite a relatively good rice harvest compared to the previous two years.
Key informant interviews held by the mission in Kampong Chhnang and Kampong Speu indicates that production shortfalls may have led to increased dependency of small farmers (net consumers with less than half a hectare) on markets. The poorest households are likely trapped in a vicious cycle of debt as they borrow rice from traders with a 100 percent interest rate pay back these loans, in cash or in-kind, after the next harvest season. Following consecutive years of drought and production shortfalls, such a practice increases vulnerability and reduces resilience to shocks.
Various reports indicate that rice production was negatively affected by drought in 2004 and 2005. A compilation of MAFF data suggests Kampong Spueu, Rotanak Kiri, Mondol Kiri and Kracheh provinces were the most adversely affected, with an average of 10 percent of rice cultivating areas destroyed by drought from 2004 to 2006. A drought assessment conducted by OXFAM in 200539 concluded that rice production was also severely affected by drought in Kampong Spueu, Svay Rieng, Prey Veng and Takeo. Reportedly, farmers with small plots of land only produced enough rice for 2 to 3 months in 2005, down from an average of 7 to 9 months in a normal year.
Figure 4.2. Real Retail Price of Rice (yearly average 2002-2006, in constant terms of 2000)
Second Quality Rice
0.0200.0400.0600.0
800.01000.01200.01400.0
Bat Damban
gKan
dal
Kampong Cham
Siem Reab
Sihanouk Ville
Phnom Penh
Pric
e (R
iel/K
g)
2002
2003
2004
2005
2006
First Quality Rice
0.0200.0400.0600.0800.0
1000.01200.01400.01600.0
Bat Dambang
Kandal
Kampong Cham
Siem Reab
Sihanouk V
ille
Phnom Penh
Pric
e (R
iel/K
g)
2002
2003
2004
2005
2006
Source: National Institute of Statistics (NIS) price data
Looking at prices of rice in Cambodia and comparing between spatial price differences and transport costs suggests inter-provincial trade is constrained by high transfer costs (table 4.1). Aside from agricultural productivity, the main costs explaining the difference between surplus production areas and deficit production areas, i.e. consumption markets, are transport costs, unloading costs, processing costs, interests to be paid on loans, margins and losses40. Transport costs are the main component of transfer costs. In the absence of other cost components, it is
39 Including OXFAM (2005): Food Security at the Household Level, Kompong Speu, Prey Veng, Svay Rieng and Takeo Provinces, drought assessment report, February. 40 RESAL Ethiopia (1999): An analysis of grain market integration in Ethiopia, August.

32
considered as a good proxy indicator of transfer costs. Considering Phnom Penh as a major distribution center to provincial markets, the spatial price difference (between Phnom Penh and the province) is compared with WFP transport costs of rice from Phnom Penh to other provinces. The table below indicates high price correlation, but higher transport costs are more significant than the spatial price differences between Phnom Penh and other provinces, especially for the lower quality rice consumed by poor households. This implies that the inter-provincial rice trade is constrained by high transfer costs. However, annual average price differences hide seasonal variations. Transfers between markets can be cost effective when the price gaps exceed transport costs, during some seasons of the year. However, addressing this seasonality issue would require an analysis of monthly transport costs. Furthermore, market integration analysis requires greater provincial coverage of price data and transport costs. Limitations in available data, both by season and by province, do not permit such analysis at this time.
Table 4.1. Spatial Price Differences Compared to Transport Cost (Riel/Kg)
2002 2003 2004 2005 2006 Avg. 2002 2003 2004 2005 2006 Avg.Bat Dambang 172.8 170.0 103.6 117.7 160.4 144.9 59.8 56.5 -5.8 19.0 63.3 38.6 157.5 0.98 0.97Kandal 114.9 145.1 189.3 74.8 96.3 124.1 13.4 22.0 56.7 -9.4 12.5 19.0 73.5 0.98 0.99Kampong Cham 64.6 69.8 51.2 72.2 93.7 70.3 7.0 4.4 -25.0 14.1 46.2 9.3 - 1.00 0.98Siem Reab 36.5 63.3 54.4 96.3 63.8 62.8 -48.6 -39.1 -45.3 7.1 -13.3 -27.9 168.5 0.99 0.99Sihanouk Ville -10.4 38.0 37.3 73.8 101.3 48.0 -16.0 -15.0 -38.3 -30.2 -10.0 -21.9 97.0 0.99 1.00Avg. of differences 75.7 97.2 87.2 87.0 103.1 90.0 3.1 5.8 -11.6 0.1 19.7 3.4
Corr. Coef. With
Phnom
Transport Cost from
Phnom PenhProvince First Quality Rice (1) Second Qality Rice (2) Corr. Coef.
With Phnom
Source: National Institute of Statistics price data and WFP transport costs, Author’s estimates.
4.4 Market Sources of Food
Physical Access to Market
Although considerable efforts are currently being made to rehabilitate and develop the national road network, the internal transport network is still a constraint for effective market functioning, especially in remote areas. Some provinces (e.g. Preah Vihear, Banteay Meanchey, Battambang, Pousat, Kaoh Kong, Kampong Thum and Kampong Chhnang, Rotanak Kiri, Mondul Kiri) have comparatively low road access from urban centers to rural areas, resulting in high marketing costs. Reportedly, this situation is compounded by unofficial road and waterway check-points which demand an “unrecorded tax” or payment to permit travel (EIC, 2006).
CSES 2004 data reveals that remoteness contributes to the incidence of poverty. In remote areas, lack of access to basic economic and social infrastructure limits overall development and exacerbates rural poverty. Disaggregated data show that provinces in Plateau zones and Siem Reab in Tonle Sap zone have the poorest access to infrastructure.
Household Dependency on Food Purchase and Sales
Households’ participation to markets is relatively high on the demand side. On the supply side, the majority of small farmers sell only very limited food surpluses due to the subsistence nature of the rice farming activities. Although subsistence farming is complemented by the cultivation of cash crops, livestock rearing, handicraft production and trade activities, poor household food needs are mainly met through domestic production and purchases from the market. As shown below (table 4.2), food purchased from markets accounts for at least 60 percent of household food consumption (CSES, 2004). Therefore, food price increases since 2003 would inevitably cause further difficulty for household food access among the poor.
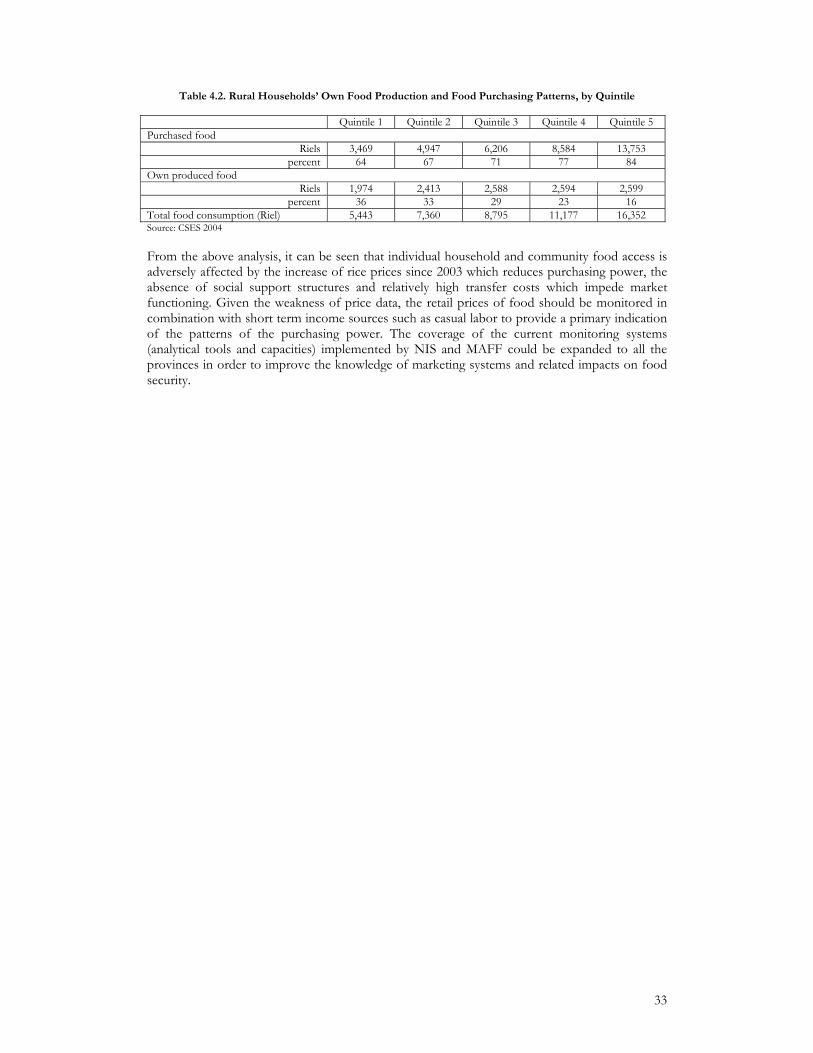
33
Table 4.2. Rural Households’ Own Food Production and Food Purchasing Patterns, by Quintile
Quintile 1 Quintile 2 Quintile 3 Quintile 4 Quintile 5 Purchased food
Riels 3,469 4,947 6,206 8,584 13,753 percent 64 67 71 77 84
Own produced food Riels 1,974 2,413 2,588 2,594 2,599
percent 36 33 29 23 16 Total food consumption (Riel) 5,443 7,360 8,795 11,177 16,352 Source: CSES 2004
From the above analysis, it can be seen that individual household and community food access is adversely affected by the increase of rice prices since 2003 which reduces purchasing power, the absence of social support structures and relatively high transfer costs which impede market functioning. Given the weakness of price data, the retail prices of food should be monitored in combination with short term income sources such as casual labor to provide a primary indication of the patterns of the purchasing power. The coverage of the current monitoring systems (analytical tools and capacities) implemented by NIS and MAFF could be expanded to all the provinces in order to improve the knowledge of marketing systems and related impacts on food security.

34
Chapter 5. Health, Nutrition and Food Utilization
The 2005 Cambodia Demographic and Health survey (CDHS)41 suggests remarkable improvement in the health and nutrition status of the population since the 2000 survey. Despite recent progress, the health status of the Cambodian people is still among the lowest in the region. Poor dietary diversity, with 65 percent of calories provided by cereals, results in micronutrient deficiencies. It is still a matter of concern and warrants continued multi-sector interventions, addressing nutrition and food security, access to safe water, adequate sanitation facilities as well as improved childcare and feeding practices.
The following chapter summarizes health, nutrition and utilization indicators that are primarily quoted from the recently published Cambodian Demographic Health Survey 2005 (CDHS 2005). It is structured according to outcomes crude mortality rate, malnutrition, and diseases both by direct and indirect evidence. In an attempt to differentiate low and high chronic food insecurity, indicator-specific thresholds were introduced or expanded building upon existing thresholds of the IPC. National and region-specific averages were used to describe the distribution of values between provinces, while the different color coding relates only to single indicators.
Table 5.1. Summary of Health and Nutrition Reference Indicators
Underweight (%)
Stunting (%)
Wasting (%)
U5 Anaemia
(%)
Measles coverage
(%)
Immunization
coverage (%)
IMR (#/1,000
live births)
U5MR (#/1,000
live births)
Iodized salt
intake (%)
Access to Safe
Drinking Water
HHs with
Toilet Facility
Tonle Sap Banteay Mean Chey LCFI 27.6 34.1 5.5 43.3 78.9 77.7 76.0 96.0 69.4 22.7 18.40 Tonle Sap Bat Dambang GFS 29.8 36.2 5.6 25.5 87.6 82.4 97.0 116.0 91.0 35.9 29.7Plains Kampong Cham LCFI 33.1 37.2 6.0 18.1 72.3 67.6 94 111.0 84.0 39.2 15.30 Tonle Sap Kampong Chhnang LCFI 34.0 37.3 4.6 31.8 84.5 71.9 87 101.0 82.0 26.0 7.70 Plateau Kampong Spueu HCFI 30.7 36.6 7.6 37.9 89.0 81.0 107 122.0 71.4 32.2 8.30 Tonle Sap Kampong Thum HCFI 37.4 41.1 3.4 46.5 67.1 54.6 87 106.0 79.8 18.5 24.1Coastal Kampot LCFI 31.0 28.2 5.0 20.0 57.8 40.7 67.0 83.0 36.8 17.5 14.2Plains Kandal LCFI 35.0 26.8 11.5 28.8 81.1 78.7 85.0 101.0 68.8 50.0 24.9Coastal Kaoh Kong LCFI 37.3 36.8 7.3 43.2 65.2 65.2 88 104.0 83.8 44.7 39.1Plateau Kracheh LCFI 35.5 37.1 4.2 33.9 63.6 53.1 84.0 116.0 90.4 40.2 20.3Coastal Krong Kaeb LCFI 31.0 28.2 5.0 20.0 57.8 40.7 67.0 83.0 36.8 17.5 14.2Plateau Krong Pailin LCFI 29.8 36.2 5.6 25.5 87.6 82.4 97.0 116.0 91.0 35.9 29.7Coastal Krong Preah Sihanouk LCFI 37.3 36.8 7.3 43.2 82.0 65.2 88 104.0 82.0 44.7 39.1Plateau Mondol Kiri HCFI 52.2 54.0 7.6 37.1 55.8 34.6 122.0 165.0 64.3 40.2 20.3Plateau Otdar Mean Chey HCFI 39.2 47.3 10.3 43.1 71.0 64.6 90 110.0 83.8 22.7 18.4Phnom Penh Phnom Penh GFS 21.2 22.3 5.5 20.0 85.6 80.9 42.0 52.0 91.0 93.3 87.1Tonle Sap Pousat HCFI 48.6 61.6 17.0 52.2 77.3 71.3 86 106.0 90.0 11.5 11.0Plateau Preah Vihear HCFI 48.1 42.0 9.7 35.4 68.2 46.4 111.0 146.0 83.8 40.2 20.3Plains Prey Veaeng HCFI 41.3 38.3 11.3 29.5 83.8 68.5 121.0 143.0 47.5 80.7 6.8Plateau Rotanak Kiri HCFI 52.2 54.0 7.6 37.1 55.8 34.6 122.0 165.0 64.3 40.2 20.3Tonle Sap Siem Reab HCFI 47.5 53.3 6.3 51.0 68.6 43.0 111.0 146.0 81.3 30.6 9.9Plateau Stueng Traeng HCFI 48.1 42.0 9.7 35.4 68.2 46.4 67.0 94.0 83.8 40.2 20.3Plains Svay Rieng LCFI 37.6 35.4 7.8 35.6 71.5 66.8 92.0 110.0 18.3 82.3 11.2Plains Takaev LCFI 37.8 38.5 7.6 25.9 86.0 76.8 96.0 102.0 74.0 30.7 14.9National Average 35.6 37.2 7.3 32.1 76.9 66.6 86.0 106.0 72.5 44.2 21
Maximum Value 52.2 61.6 17.0 52.2 89.0 82.4 122.0 165.0 91.0 93.3 87.1
Minimum Value 21.2 22.3 3.4 18.1 55.8 34.6 42.0 52.0 18.3 11.5 6.8
Legend Generally food secure GFS 0-9 0-19.9 0-2.9 <15 90-100 90-100 0-28.9 0-35.9 90-100 >=75 >=70Low chronically food insecure LCFI 10-29.9 20-39.9 3-5.9 15-32.8 80-89.9 80-89.9 29-59.9 36-79.9 72.5-89.9 44.2-74.9 21-69High chronically food insecure HCFI >30 >40 5-9.9 >32.8 <80 <80 60-85.9 80-105.9 <72.5 <44.2 <21Acute food and livelihood crisis AFLC 10-15 86-120 106-169.9Humanitarian emergency HE >15 121-150 170-215Famine/Humanitarian catastrophe FHC >150 >215
Health, Nutrition and Watsan Indicators
Ecological Zone
Province
Overall Phase Classification
of the Province
5.1 Crude Mortality Rate
Given the non-emergency context, statistics in Cambodia do not provide the Crude Mortality Rate (CMR) in number of deaths per ten thousand per day. The General Population Census of Cambodia, however, presents projected mortality figures per thousand per year for 2001-2006. These figures were transformed in equivalent of ten thousand per day. With the exception of Rotanak Kiri (0.62/10,000/day) all the provinces have figures between 0.l4 and 0.43, falling below the IPC threshold of 0.5/10,000/day for both chronic food insecure and generally food
41 CDHS 2005 Preliminary Draft Report, July 2006.

35
secure areas. While this fact corroborates the general picture of chronic food insecurity in Cambodia, the Cambodian CMR (as an emergency measure) does not provide meaningful information to differentiate health outcomes between provinces.
Two different indicators are therefore used as indirect evidence to help differentiate mortality: The infant mortality rate (IMR) and the under-five mortality rate (U5MR).
The CDHS (2005) report shows that IMR declined between 2000 and 2005 from 95 - 66 deaths for every 1,000 live births during the preceding 5 years. Rural areas have a much higher IMR than urban areas (92 against 65 deaths/1,000 live births). Pronounced differences also exist between provinces. Mondol Kiri, Rotanak Kiri and Prey Veng have rates above 120 deaths, while Phnom Penh, Siem Riep and Kampot/Krong Kep have only 42, 67 and 67 deaths respectively. Yet, Phnom Penh is the only province with figures lower, i.e. better, than the national average.
Under-five mortality rates (U5MR) declined significantly from 124 to 83 for every 1,000 live births. This represents a decrease of over 30 percent and a significant improvement. Still, one in every 12 Cambodian children dies before reaching the age of five. Again, rural areas are worse off with 111 compared to 76 deaths in urban areas. Similar to the IMR, Mondol Kiri and Rotanak Kiri show the highest rates with 165, followed by Prey Vihear and Steung Treng with 146, whereas Phnom Penh has a low of 52 deaths.
Figure 5.1. Infant and Under 5 Mortality Rates by Province in Cambodia with 95 percent CI. (# of deaths/1,000 life births; data source: CDHS 2005)
0 20 40 60 80 100 120 140 160 180 200 220
Banteay Mean Chey
Bat Dambang
Kampong Cham
Kampong Chhnang
Kampong Spueu
Kampong Thum
Kampot
Kandal
Kaoh Kong
Kracheh
Krong Kaeb
Krong Pailin
Krong Preah Sihanouk
Mondol Kiri
Otdar Mean Chey Phnom Penh
Pousat
Preah Vihear Prey Veaeng
Rotanak Kiri Siem Reab
Stueng Traeng
Svay Rieng
Takaev
U5MR IMR
Additionally, the 2005 CDHS reports a maternal mortality of 472 deaths per 100,000 live births, up from 437 deaths per 100,000 live births in 2000. However, the report indicates that this change is not statistically significant.
The findings of CDHS suggest that infant or under five deaths are closely linked to wealth and education, apart from residence (rural/urban) and other demographic factors.
Though it is difficult to establish a single cause of death, it is anticipated that the major causes are diarrhoea, respiratory infections and fever. Twenty-five percent of neonatal deaths were among low birth weight infants. Birth weight remains a major determinant of infant and child mortality.

36
5.2 Malnutrition
Overall, the nutritional status of children under 5 years in Cambodia has improved in the past five years when analyzing direct and indirect evidence.
5.2.1 Direct Evidence of Malnutrition
The prevalence of global stunting, wasting, and underweight are taken as direct evidence. In 2005, 37.2 percent of children were stunted, 35.6 percent underweight and 7.3 percent42 were wasted nationwide, compared with 45 percent stunting, 45 percent underweight and 15 percent wasting in 2000 (figure 5.2). In general, children with uneducated mothers and those living in the poorest households are most likely to be malnourished.
Figure 5.2. National Prevalence of Global Stunting, Wasting, Underweight of Children 6-59 Months, Comparison between 2000 and 2005, CDHS
Wasting: For comparison between provinces, confidence levels for prevalence rates are taken into account. Only few provinces differ significantly in their wasting levels. In fact, Kandal and Pousat have a significantly worse prevalence of wasting compared to Kampong Thum and Kracheh (figure 5.3). Other differences between provinces are not statistically significant. With regard to the estimated prevalence, only 8 provinces fall in the category of low chronic food insecurity, i.e. between 3-5.90 percent for weight for height. These are predominantly in the agro-ecological zone of Tonle Sap and urban areas. Ten provinces, half of which are in the Plateau region, are considered as high chronically food insecure, with wasting ranging between 6 to 9.9 percent. The highest prevalence estimates are in Kandal, Otdar Mean Chey, Prey Veaeng and Pousat. Thus, the former three provinces fall into the acute livelihood crises phase and Pousat into the humanitarian emergency. However, given the large confidence intervals, this indicator-specific classification requires some caution and suggests further nutritional assessment in concerned provinces.
42 These values refer to the proportion of children below -2 z-scores of each indicator. The 95 percent CI are as follows: W/H 6.2-8.4 percent; W/A 35.0-39.5 percent; H/A 33.6-37.6 percent.
45%
15%
45%
7.3%
35.6%
37.2%
0% 5%
10% 15% 20% 25% 30% 35% 40% 45% 50%
Stunting Wasting Underweight
2000 2005

37
Prevalence of Wasting (W/H zscore <-2 SD)
among Children 6-59 months with 95% CI by Province in Cambodia(Source of Data from CDHS 2005)
0%
5%
10%
15%
20%
25%
30%
Bantea
y Mea
n Chey
Bat Dam
bang
Kampong C
ham
Kampong C
hhnang
Kampong Spueu
Kampong Thum
Kampot
Kandal
Kaoh K
ong
Kracheh
Krong K
aeb
Krong Pail
in
Krong Prea
h Sihanouk
Mondol Kiri
Otdar Mea
n Chey
Phnom Penh
Pousat
Preah Vihea
r
Prey Vea
eng
Rotanak
Kiri
Siem R
eab
Stueng Trae
ng
Svay R
ieng
Takae
v
Stunting. As an indicator for retarded growth for a particular age, the level of global stunting is alarmingly high for some provinces. Prevalence below 20 percent is considered as generally food secure, which is not applicable for any province. Prevalence of global stunting between 20 and 39.9 percent is considered as low chronic food insecurity. Sixteen provinces fall into this category. Five out of eight provinces considered as high chronically food insecure are in the Plateau region, with prevalence levels from 53 percent in Rotanak Kiri, Mondul Kiri and Siem Reab, to 63 percent in Pousat (figure 5.4). Stunting increases with the age of the child while there is very little difference in the level of stunting by sex. The CDHS data also show that stunting is apparent even among children less than 6 months of age (6 percent).
Prevalence of Stunting (H/A z-score < -2 SD) Among Children 6-59 Months With 95% CI by Province in Cambodia
(Source of Data from CDHS 2005)
0%5%
10%15%20%25%30%35%40%45%50%55%60%65%70%75%80%
Bantea
y Mea
n Che
y
Bat Dam
bang
Kampo
ng C
ham
Kampo
ng C
hhna
ng
Kampo
ng S
pueu
Kampo
ng Th
um
Kampo
t
Kanda
l
Kaoh K
ong
Krach
eh
Krong
Kae
b
Krong
Pail
in
Krong
Pre
ah S
ihano
uk
Mondo
l Kiri
Otdar
Mea
n Che
y
Phnom
Pen
h
Pousa
t
Preah
Vihe
ar
Prey V
eaen
g
Rotan
ak K
iri
Siem R
eab
Stuen
g Tra
eng
Svay R
ieng
Taka
ev
Figure 5.3
Figure 5.4
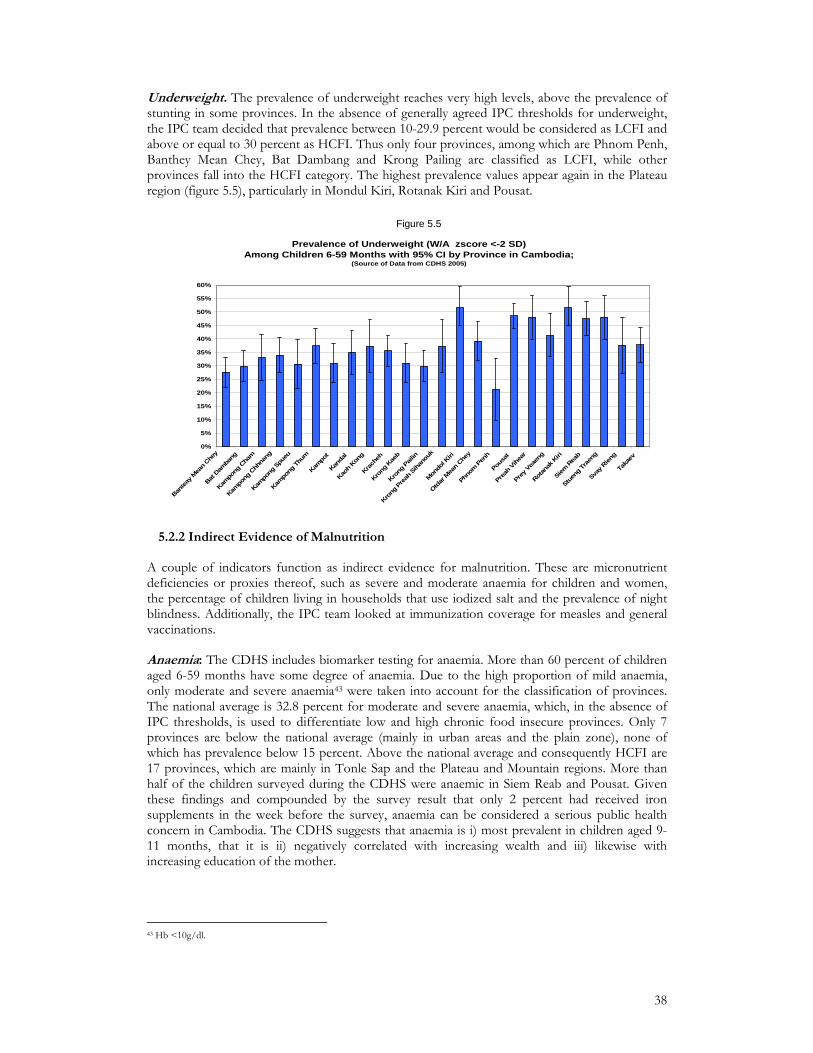
38
Underweight. The prevalence of underweight reaches very high levels, above the prevalence of stunting in some provinces. In the absence of generally agreed IPC thresholds for underweight, the IPC team decided that prevalence between 10-29.9 percent would be considered as LCFI and above or equal to 30 percent as HCFI. Thus only four provinces, among which are Phnom Penh, Banthey Mean Chey, Bat Dambang and Krong Pailing are classified as LCFI, while other provinces fall into the HCFI category. The highest prevalence values appear again in the Plateau region (figure 5.5), particularly in Mondul Kiri, Rotanak Kiri and Pousat.
Prevalence of Underweight (W/A zscore <-2 SD) Among Children 6-59 Months with 95% CI by Province in Cambodia;
(Source of Data from CDHS 2005)
0%
5%
10%
15%
20%
25%
30%
35%
40%
45%
50%
55%
60%
Bantea
y Mea
n Che
y
Bat Dam
bang
Kampo
ng C
ham
Kampo
ng C
hhna
ng
Kampo
ng S
pueu
Kampo
ng Th
um
Kampo
t
Kanda
l
Kaoh K
ong
Krach
eh
Krong
Kae
b
Krong
Pail
in
Krong
Pre
ah S
ihano
uk
Mondo
l Kiri
Otdar
Mea
n Che
y
Phno
m Pen
h
Pous
at
Prea
h Vihe
ar
Prey V
eaen
g
Rotan
ak K
iri
Siem R
eab
Stuen
g Tra
eng
Svay
Rien
g
Taka
ev
5.2.2 Indirect Evidence of Malnutrition
A couple of indicators function as indirect evidence for malnutrition. These are micronutrient deficiencies or proxies thereof, such as severe and moderate anaemia for children and women, the percentage of children living in households that use iodized salt and the prevalence of night blindness. Additionally, the IPC team looked at immunization coverage for measles and general vaccinations.
Anaemia: The CDHS includes biomarker testing for anaemia. More than 60 percent of children aged 6-59 months have some degree of anaemia. Due to the high proportion of mild anaemia, only moderate and severe anaemia43 were taken into account for the classification of provinces. The national average is 32.8 percent for moderate and severe anaemia, which, in the absence of IPC thresholds, is used to differentiate low and high chronic food insecure provinces. Only 7 provinces are below the national average (mainly in urban areas and the plain zone), none of which has prevalence below 15 percent. Above the national average and consequently HCFI are 17 provinces, which are mainly in Tonle Sap and the Plateau and Mountain regions. More than half of the children surveyed during the CDHS were anaemic in Siem Reab and Pousat. Given these findings and compounded by the survey result that only 2 percent had received iron supplements in the week before the survey, anaemia can be considered a serious public health concern in Cambodia. The CDHS suggests that anaemia is i) most prevalent in children aged 9-11 months, that it is ii) negatively correlated with increasing wealth and iii) likewise with increasing education of the mother.
43 Hb <10g/dl.
Figure 5.5

39
As another group of concern, 47 percent of women have some degree of anaemia44. The national average is 11.2 percent for moderate and severe anaemia, which again serves as means to differentiate low and high chronic food insecure provinces. The only province with prevalence below 5 percent, i.e. Phnom Penh, is considered as generally food secure. Ten provinces, predominantly in the plains region, fall in the LCFI category, while the rest is considered as HCFI. Preah Vihear and Stueng Traeng have the highest values with 20.6 percent.
According to the CDHS 2005, only 18 percent of women took iron tablets during the pregnancy.
Prevalence of Moderate plus Severe Anaemia Among Children (6-59 Months) and Women
(Source of Data from CDHS 2005)
0% 5% 10% 15% 20% 25% 30% 35% 40% 45% 50% 55% 60%
Banteay Mean Chey
Kampong Cham
Kampong Spueu
Kampot
Kaoh Kong
Krong Kaeb
Krong Preah Sihanouk
Otdar Mean Chey
Pousat
Prey Veaeng
Siem Reab
Svay Rieng
ChildrenWomen
Iodised salt. Actual intake of iodised salt or iodine deficiency disorders is not reported in the CDHS 2005. However, as a proxy indicator, almost three quarters of children live in households that consume iodised salt. In five provinces45 this indicator reaches values of 90 percent or more, a level, that seems to be adequate. In another 10 provinces, the range is still above national average (72.5 percent), while in 9 provinces it goes as low as 18.3 percent. Among this category, the lowest levels are reported for Svay Rieng, Kampot, Krong Keb and Prey Veaeng.
Night blindness. Approximate data for night blindness of children 18-59 months and women with children under 24 months only exists for nine provinces. In particular, in Rotanak Kiri, Preah Vihear, Otdar Mean Chey and Kampong Thum have prevalence rates among women that range between 3.5 and 6.8 percent. These rates constitute a public health problem. In the same provinces, 1-2.1 percent of children are night blind. Most women reported consuming vitamin A rich foods, only 27 percent received a vitamin A post-partum dose. Thirty-five percent of children had received vitamin A supplements in the 6 months before the survey.
44 Hb levels of <12.0g/dl for non-pregnant and <11.0g/dl for pregnant women, and which combines mild, moderate and severe anaemia. 45 Phnom Penh, Krong Pailin, Bat Dambang, Pousat and Kracheh
Figure 5.6

40
Table 5.2. Prevalence of Night Blindness Among Women and Children
Women with children < 24 months (%)
Children 18-59 months (%)
Tonle Sap Bat Dambang 2.7 0.3 Plains Kampong Cham 1.2 0.6 Tonle Sap Kampong Thum 3.0 1.1 Coastal Kampot 2.3 0.6 Plains Kandal 1.1 0.2 Plateau Otdar Mean Chey 3.5 1.8 Plateau Preah Vihear 3.8 1.0 Plateau Rotanak Kiri 6.8 2.1 Plains Svay Rieng 1.7 0.8 Source: HKI – 2002 An Overview of Nutrition Sector Activities in Cambodia
Immunization. Universal immunization of children against six vaccine-preventable diseases is crucial to reducing infant and child mortality. The following data of the CDHS reflect the coverage for children aged 12-23 months by 12 months of age in 2005. Sixty percent of these children have been fully vaccinated, which is twice 31 percent vaccinated in 2000. Nearly all children (91 percent) have received vaccination against tuberculosis (BCG), and 70 percent have been vaccinated against measles. While there is no significant difference between children in rural and urban areas, there are substantial differences in coverage across provinces. The percentage of children fully vaccinated is the lowest in the provinces of Mondol Kiri and Rotanak Kiri (35 percent), Kampot and Krong Kep (41 percent) and Siem Reab (43 percent). The provinces with the highest proportion of children fully vaccinated are Bat Dambang/Krong and Pailin (82 percent), Kampong Spueu (81 percent) and Phom Penh (81 percent). The percent of children fully vaccinated increases substantially with maternal education levels and the wealth status of the household.
With regard to measles vaccination by province, the coverage ranges between 55.5 and 89 percent. In Mondul Kiri, Rotanak Kiri, Kampot and Krong Keb, less than 60 percent of children received measles vaccination, while nine provinces have coverage of above 80 percent. These nine provinces would be classified as low chronic food insecure in terms of measles, whereas the rest would be considered as high chronic food insecure.
Breastfeeding and Nutrition: CDHS data reports that almost all Cambodian children are breastfed. Children are breastfed for an average of 21.6 months, but the exclusive breast feeding is only for 4.1 months46. 5.3 Diseases
None of the data available served as appropriate direct evidence. Hence, the incidence of diarrhea among children two weeks prior to the survey, tuberculosis detection rate, the risk for malaria, and the HIV/AIDS prevalence rates were used as indirect evidences.
Diarrhoea. The CDHS reports that dehydration caused by severe diarrhoea is a major cause of morbidity and mortality among young children, although the condition can be easily treated with oral rehydration therapy (ORT). Exposure to diarrhoea causing agents is frequently related to the use of contaminated water and to unhygienic practices in food preparation and disposal of excreta. Overall, 19.5 percent of all children under five had diarrhoea while three percent had severe diarrhoea with blood. The occurrence of diarrhoea varies with the age of the child. As with acute respiratory infection (ARI) and fever, young children are more prone to diarrhoea than older children. Diarrhoea is slightly more common among rural children (20 percent) than urban (16 percent). There are provincial variations in the prevalence of diarrhoea. Children living in Kampong Cham are more susceptible to episode of diarrhoea among children (30 percent) than
46 WHO recommends 6 months of exclusive breastfeeding.

41
children living elsewhere. Children surveyed in Krong Preah Sihanouk, Kaoh Kong and Svay Rieng have the lowest prevalence (9 to 10 percent). Comparable data from 2000 CDHS show higher percentages of children that had diarrhea, were taken to a health provider in 2005 than in 2000 (37 percent versus 22 percent).
Malaria. Malaria is a serious public health problem in Cambodia. In 2005, there were over 60,000 reported malaria cases. However, people are not at equal risk of contracting malaria. Some areas of the country are virtually malaria free, while others are malaria endemic. Thus, the country is divided into malaria risk zones, ranging from low to high risk (table 5.3) and some areas of the country not in the malaria zone at all.
Table 5.3 Level of Malaria Risk by Province
High Malaria Risk Medium Malaria Risk Plateau Otdar Mean Chey Tonle Sap Bat Dambang Plateau Preah Vihear Tonle Sap Kampong Thum Plateau Rotanak Kiri Tonle Sap Banteay Mean Chey Coastal Kaoh Kong Plateau Kracheh Plateau Mondol Kiri Urban Krong Pailin Plateau Stueng Traeng Tonle Sap Pousat Plateau Otdar Mean Chey Tonle Sap Siem Reab Tonle Sap Bat Dambang Source: National Institute of Public Health & Malaria Consortium, Cambodia. Cambodia National Malaria Baseline Survey 2004 Report.
Acute Respiratory Infection (ARI) and Fevers: ARI is a leading cause of childhood morbidity and mortality throughout the world. The prevalence of ARI is subject to seasonality. With the exception of those under six months of age, prevalence of ARI decreases with increasing age of the child. Children 6-23 months experience the symptoms of ARI (11 percent) in higher proportion than other age groups. There are significant provincial variations ranging from a low in Phnom Penh, Kampot and Krong Kep to a high in Otdar Mean Chey. Children of mothers with high level of education are more likely to receive treatment for symptoms than those of mothers with low or no schooling level.
Malaria and fevers can contribute to high levels of malnutrition and mortality. As with ARI, younger children are more commonly sick with fever than the older children. There is no significant variation by sex and little notable difference in urban and rural areas. Provincial variations, however, are significant: low prevalence in Krong Preah Shihanouk and Kaoh Kong, but high in Kampong Spueu.
HIV and TB. The HIV/AIDS prevalence among adults aged 15-49 has declined from 2.1 percent in 2002 to 1.9 percent in 2003, but new cases are estimated at 20 per day. This classifies Cambodia as the country with the highest adult prevalence in South-East Asia. An estimated 123,100 adults aged 15-49 years are living with HIV and AIDS, and about 57,500 of these are women. It is estimated that there are around 77,000 orphans and vulnerable children.47 Poverty and food insecurity fuel the epidemic by causing migration and hence greater exposure to HIV/AIDS infections.
Tuberculosis (TB) is a leading cause of death in the world and a major health problem in developing world. Cambodia ranks 22nd on the list of countries with a high prevalence of TB and has the highest TB prevalence in South East Asia. It was reported by National Health Strategic Plan for TB Control in the Kingdom of Cambodia 2006-2010, by National Center for TB & Leprosy Control that HIV among TB patients was over 10 percent in 2005. The increasing burden of the TB-HIV co-epidemic results in a tremendous burden on the existing health care system and overall human development. The demand for care and support is extremely high and
47 Report HIV Sentinel Surveillance in Cambodia

42
requires community-based interventions for those people living with HIV and AIDS (PLWHA) and TB.
Maternal Health. Antenatal care has almost doubled since 2000. Sixty-nine percent of women who had a live birth in the five years preceding the survey received antenatal care, compared with only 38 percent in 2000. Antenatal care is more common in urban areas (79 percent) than in rural areas (68 percent). As mentioned above, while most women reported consuming vitamin A rich foods, only 27 percent received a vitamin A post-partum dose. Only 18 percent took iron tablets during the pregnancy. 5.4 Access to Water and Sanitation
As above, for the outcome access to water, only indirect evidence is available.
The CDHS 2005 states that “the types of water and sanitation facilities are important determinants of the health and nutrition status of the population and in particular of young children.” Adequate hygiene and sanitation practices can reduce the risk of major childhood diseases, such as diarrhoea.
Access to Water. During the rainy season, drinking water for 75 percent of the households originates from an improved source. About one–third of the households use rainwater. During the dry season, about 56 percent of households consume drinking water from an improved source, of which tube wells or boreholes are most prominent. Twenty-three percent of households consume surface water which is considered a non-improved source. Arsenic was also reported to be present in some locations.
According to the CIPS 2004, only in three provinces were more than 75 percent of the households able to access to safe water. While in three other provinces (Kaoh Kong, Kracheh and Krong Preah Sihanouk), access to safe water is still above the national average (44.2 percent of all households), in other provinces these figures are below the average. These findings suggest that access to safe potable water is quite critical in Cambodia.
Access to Sanitation. A household’s toilet facility is considered as hygienic if it is used only by household members (is not shared by other households) and it effectively separates human waste from human contact (CDHS 2005). Households vary greatly in access to hygienic facilities from urban to rural areas. Most of the households in rural areas have no toilet facility and make use of field or bush areas. In urban areas, one of three households has no toilet facility. According to the CIPS 2004, 21 percent of households nationwide have a toilet facility. In some provinces (Siem Reab, Preah Veaeng, Kampong Chhnang and Kampong Spueu), less than 10 percent of households have access to toilets.

43
Chapter 6. Strategic Response Options
Previous chapters analyzed overarching components of the food security situation in Cambodia, combining various outcome indicators (both direct and indirect). The current chapter is an attempt to link the findings of the situation analysis with appropriate response options. It presents an IPC map summarizing the essential situation analysis information, discusses the response options and proposes an estimate of the number of beneficiaries that could be covered by these response options.
6.1 Cambodian IPC at-a-Glance
The IPC map below summarizes an integrated food security phase classification for Cambodia, showing provincial differences and possible early warning scenarios, based on perceptions of immediate shocks and their possible implications for IPC classification. This key output of the IPC results from a review of multiple secondary data sources and intensive consultation with various stakeholders through technical working group meetings.
As can be seen from the map, the majority of the country falls under ‘chronically food insecure’ phase, except for Bat Dambang and Phnom Penh, which are considered ‘generally food secure’. However, within the ‘chronically food insecure’ phase, ten provinces (Otdar Mean Chey, Siem Reab, Preah Vihear, Kampong Thum, Strueng Traeng, Rotanak Kiri, Mondol Kiri, Pousat, Kampong Spueu and Prey Veaeng) are classified as ‘high chronically food insecure’, suggesting that priority can be given to these provinces. The general ‘chronic food insecurity’ situation also suggests that the response options could combine short-term interventions to improve the status of ‘high chronically food insecure’ households, with medium and long-term response options to address structural issues that limit household economic opportunities.
Establishing the comparative importance of different factors that currently contribute to food insecurity in Cambodia is difficult, partly because it is hard to quantify most of these factors with any reliability. The callout boxes in the map show the major underlying causes of chronic food insecurity, as analyzed in previous chapters. Among others, the major constraints in household food security are poverty, climatic shocks (drought and floods), and weak asset bases (inadequate land holdings and poor quality land among food insecure households, availability of and access to water for irrigation, insufficient animal draught power and agricultural equipment, insufficient alternative employment opportunities, lack of social safety net support). This situation is compounded by poor nutrition, diseases and poor hygiene, causing further illness and weakening the income-earning potential. Household indebtedness, weak marketing systems and low purchasing power further limit household economic opportunities.
Given that the major part of the country falls under a ‘chronically food insecure’ phase, the classification map is expected to be valid for the next 3 years, unless a large scale disaster or a major shock affects a large part of the country or population. If necessary, the immediate hazards component of the map could be updated within six months to take account of seasonal changes, such as drought or flood.

44

45
6.2 Government Actions and Strategic Response Options
Cambodian government line ministries and other institutions work in close partnership with development agencies to address food security problems through its rural development strategy (NSDP 2006-2010). In emergency situations, such as natural disasters, the Cambodia Red Cross often distributes a limited amount of food on behalf of the government. The government regularly monitors the food security situation in the country through bi-annual meetings organized by the Council for Agricultural and Rural Development (CARD), before and after the agricultural season in June and December. The National Committee for Disaster Management (NCDM) is also involved in food security issues (e.g. disaster response mechanism) on behalf of the government. In general, government food security interventions (from food security assessment, strategy formulation to the design and implementation of programs/projects) depend on supports from NGOs, donors and UN Agencies.
Due to time limits, a thorough response analysis based on the IPC approach was not carried out. Therefore, the response options summarized below in table 6.1 should be considered as generic. It is understood that the government is making an effort to establish a food security working group. This development could offer an opportunity to conduct further discussions with stakeholders in Cambodia to validate the findings of the current report and work out an in-depth response analysis accompanied by a framework for actions. Furthermore, the Cambodian country office, in conjunction with the government and other key actors, will endeavor to further refine targeting for TB and HIV/AIDS-affected households based on the availability of resources and capable implementing partners.

46
Table 6.1: Indicative Strategic Response Options
Issues Range of Indicators (min.-max.) Strategic response Address health, nutrition and sanitation problems and inadequate nutrients intake for certain vulnerable groups (as presented in Cambodia Nutrition Investment Plan 2003-2007)
• Wasting (3.4 -17.0 percent) • Stunting (22.3 -61.6 percent) • Underweight (21.2 -52.2 percent) • Moderate Anemia U5 (18.1 -52.2 percent) • Anemia Women (3.9 -19.3 percent) • Iodized salt intake (18.3 percent-91.0 percent) • Measles immunization (55.8 percent-89.0 percent) • Diarrhea (8.8 – 30.0 percent) • All basic immunization (34.6 -82.4 percent) • IMR (42.0 -122.0 percent) • U5MR (52.0 - 165.0 percent) • Access to drinking water (11.5 -93.3 percent)
• Improve infant and young children feeding practices and diversification of diet (adequate complementary food)
• Provide micronutrients to supplement food (Vit.A, iodized salt, fortified food) • Provide services to health status of pregnant/lactating children U5 (ANC, MCH) • Provide health and nutrition education • Improve immunization and measles coverage in deficient provinces • Improve access to clean water and sanitation facilities (wells, ponds, water infrastructure, FFW
can be considered)
Address problems of inadequate food access/availability and risks to livelihoods
• Calorie intake of lowest income deciles • Average (2005-2006) rice self-sufficiency status (-134.7
– 328.8 Kg/capita) • Average cultivated destroyed by drought (0.1 -20.2
percent) • Average cultivated destroyed by flood (0.1 -5.8 percent) • Poverty rates (4.6 -57.2 percent) • Draught power (0.1 -1.9 head/ha) • Child labor ( 10.0 – 80.0 percent)
• Promote crop diversification (kitchen gardening, rural extension, inter-cropping, weather resistant crops)
• Set up water management systems for flood and drought mitigation (irrigation, canals and ponds). • Improve farming techniques (new-technologies on soil conservation and crop intensification) • Promote forest conservation and reforestation • Improve household food conservation and preservation techniques (small silos, solar drying
techniques) • Accelerate land allocations and titling to vulnerable/landless households, prioritizing areas with
high poverty rates • Provide debt relief schemes to indebted poor household and vulnerable groups • Provide micro-credit for sustainable livelihoods
Improve schooling conditions and address inadequate nutrients intake for students
• Net primary enrolment (67.5 -96.6 percent) • Completion rates (21.2 -63.9 percent) • Drop out rates (6.7 - 20.9 percent) • Female illiteracy rate (15.2 -45.5 percent)
• Provide take home ration or on-site feeding • Expand water and sanitation facilities in schools • Provide de-worming and health education to school children
Improve data and information collection systems
• Assess nutritional status in Pousat, Prey Veaeng, Mondul Kiri, Rotanak Kiri and Kandal. • Expand retail price data collection systems of NIS to all the provinces. • Expand the agriculture marketing system beyond wholesale prices to include retail prices and
complement NIS price collection system, especially in rural provinces. • Collect and report school attendance data at national level (e.g. WFP partners collect such data
for programs).

47
6.3 Targeted Population Estimates The population estimate is based on a combination of the proportion of households living below poverty line and living in extreme poverty (World Bank, 2006). Out of a total population of 13.1 million in 2004, an estimated 4.6 million live below the poverty line. About 2.6 million live in extreme poverty. Using the poverty line, population estimates indicate there are more chronically food insecure people in the plains region, but the degree of food insecurity is more intense in the plateau region, according to the IPC classification. The IPC methodology does not, in itself, offer guidance on how to estimate the number of people in a food security phase. Further refinement would therefore be necessary, during stakeholder discussions, as recommended above.
Table 6.2. Estimated Population by Province in Chronic Food Insecurity in Cambodia
% Poor Number
Coastal Kampot 602,379 30.0 180,473Coastal Kaoh Kong 123,803 23.2 28,698Plains Kampong Cham 1,673,000 37.0 619,679Plains Kandal 1,227,000 22.2 272,885Plains Prey Veaeng 1,025,000 37.2 381,300Plains Svay Rieng 518,000 35.9 186,117Plains Takaev 890,000 27.7 246,619Plateau Kampong Spueu 688,000 57.2 393,674Plateau Kracheh 335,058 46.1 154,495Plateau Mondol Kiri 37,681 46.1 17,375Plateau Preah Vihear 152,762 46.1 70,439Plateau Rotanak Kiri 101,841 46.1 46,959Plateau Stueng Traeng 91,657 46.1 42,263Plateau Otdar Mean Chey 132,410 46.1 61,054Tonle Sap Banteay Mean Chey 691,590 37.2 256,926Tonle Sap Bat Dambang 998,867 33.7 336,518Tonle Sap Kampong Chhnang 545,000 39.6 215,657Tonle Sap Kampong Thum 618,000 52.4 323,832Tonle Sap Pousat 469,000 39.6 185,583Tonle Sap Siem Reab 776,000 51.8 402,278Phnom Penh Phnom Penh 1,097,000 4.6 50,462Coastal Krong Preah Sihanouk 196,197 23.2 45,478Coastal Krong Kaeb 58,621 23.2 13,588Plateau Krong Pailin 42,133 46.1 19,428National Total 13,091,000 4,551,780
Total Population in
2004
Estimated Population Under Poverty Line
Ecological Zone Province
Source: Cambodia IPC 2007, Author's Estimate
6.4 Implications for WFP Interventions and Targeting
Of the population estimate above, it is recommended that WFP interventions target the population living in extreme poverty, prioritizing the most vulnerable section of the population living in the highly food insecure provinces. Notwithstanding resource and operational constraints, WFP response options can focus on the following:
Health, Nutrition and Utilization interventions:
Expand safety net activities, i.e. maternal child health (MCH) and supplementary feeding with priority for provinces with the poorest nutrition and health indicators;

48
Specific supports to other vulnerable populations. TB and HIV/AIDS safety net programs in conjunction with national treatment programmes;
In order to provide appropriate interventions, further nutrition assessment and monitoring is recommended for Kandal, Otdar Mean Chey, Pousat and Prey Veaeng where wasting rate are high;
Advocacy for increased wells and water filtering facilities to provide clean drinking water; and
Food-for-training programmes for nutrition, health and hygiene education.
Access, Availability, Markets and Livelihoods support activities:
Food-for-work and food-for-training activities to improve rural incomes, agricultural practices, reduce post-harvest losses and augment irrigation facilities in order to enhance resilience to and mitigate the adverse impact of drought, floods and other natural disasters.
Education interventions:
Expand safety net activities, i.e. food for education to provinces classified as high chronically food insecure and to those with the poorest education indicators; and
Continue monitoring and reporting primary school attendance and advocate an expansion of WFP project monitoring system to national level.
In order to prioritize WFP interventions by province, a combination of individual IPC key reference indicators and/or indirect evidence indicators are used as follows:
Mother and Child Health/Nutrition activities to improve health and nutrition status. Key indicators, such as underweight and stunting, depict a chronic food insecurity situation for all the provinces as shown in table 5.1 (chapter 5). In order to further differentiate between provinces, under-five anaemia and infant mortality rates were used. The prioritization is done from first priority to third priority, using the colour codification of the IPC. As shown below (table 6.3), the worse the combination of the two indicators, the higher is the priority given to the province for health and nutrition intervention.
Table 6.3. Criteria for Prioritizing Health and Nutrition Interventions at Province Level (after controlling for prevalence of underweight and stunting)
U5 Anaemia IMRyellow dark orangeyellow light redyellow dark redyellow dark yellow darkyellow light orangeyellow light yellow darkyellow light yellow light3
2
IPC color of the IndicatorOrder of Priority of the province
1
Food-for-work activities to support livelihoods. Given the rather weak confidence level of the energy intake indicator to measure food access, indirect indicators such as poverty rate and the average percentage of cultivated rice field affected by drought during the last three years (2004-2006), were used to prioritize WFP interventions. Prioritization criteria are drawn from the IPC classification of individual indicators summarized in table 3.1 (chapter 3). As shown in table 6.4 below, a high poverty rate (yellow dark) combined with a high impact of drought (yellow dark or light) confers a high priority for FFW activities in a province.

49
Table 6.4. Criteria for Prioritizing Livelihood Support Interventions at Province Level
Poverty Droughtyellow dark yellow darkyellow dark yellow lightyellow dark greenyellow light yellow dark
green yellow lightgreen yellow dark3
Order of Priority of the province
IPC color of the Indicator
1
2
Food-for-education activities to improve school attendance. The prioritization indicators (i.e. enrolment rate, primary attendance rate and primary completion rate) are drawn from the IPC individual indicator classification in table 3.4. A province is considered as a first priority for an education intervention if all three indicators are low or medium (yellow light or dark or a combination of the two colours). If the enrolment rate is considered high (green), but attendance and completion rates are low or medium (yellow dark or light), an intervention in those provinces is considered as a second priority. Finally, if the enrolment rate and/or the attendance rate are high (green) and the completion rate is low or medium (yellow dark or light), the province is considered as a third priority.
Table 6.5. Criteria for Prioritizing Education Activities at Province Level
Enrolment Attendance Completionyellow dark yellow dark yellow darkyellow light yellow light yellow light
yellow dark yellow darkyellow light yellow light
yellow darkyellow light
IPC color of the IndicatorOrder of Priority of the province
1
2
3 green green
green
Nutrition Assessments. This recommendation is based on the fact that reliability of data is in question for some provinces and the wasting level is seen as a concern for others. In the absence of sufficiently reliable evidence from the literature review, it is advised to conduct a nutrition assessment in these provinces. A province is chosen as a first priority if the percentage of wasting is higher than the national average of 7.3 percent, second priority if it is between 5 and 7.3 percent. Below 5 percent, conducting a nutrition assessment in the province is considered as a third priority. However, discussions with the IPC working group indicate clearly that the small sample size used in the CDHS survey does not allow any significant conclusion for Mondul Kiri and Rotanak Kiri provinces. They are therefore considered as a priority for further nutrition assessments.
Considering cost effectiveness of the operations, an integrated approach of FFW, FFE and MCH/MCN activities is proposed, combining the above criteria. To decide the order of priority, the following rules are suggested:
If at least two of the four interventions are prioritized as 1, the province is classified as first priority (1).
If at least two of the four interventions are classified as second priority, the province is classified as second priority (2).

50
If at least two of the four interventions are classified as third priority, the province is classified as third priority (3).
For the cases where one of the four interventions is not a priority (i.e. not ranked):
- The priority rank of the province is 1 when the remaining three interventions are prioritized as 1
- The priority rank of the province is 2 when at least two of the remaining three interventions are prioritized as 2 or a combination of 1 and 2, 1 and 3 or 1, 2 and 3
- The priority rank of the province is 3 when at least two of the remaining three interventions are prioritized as 3 or a combination of 2 and 3
Applying these rules, table 6.6 below indicates that all the high chronically food insecure provinces would be first priority provinces for WFP integrated interventions, except Siem Reab which is second priority. Depending on operational constraints, package interventions can be extended to second priority provinces. The generally food secure provinces of Phnom Penh and Bat Dambang are not considered as priority interventions areas for this package approach, unless further fine tuning of the selection criteria, specific indicators and arguments can be applied.
Table 6.6. Recommended Priority Intervention Provinces for WFP
FFW MCH/MCN FFENutrition
Assessment
Tonle Sap Banteay Mean Chey LCFI 2 2 2 3 2Tonle Sap Bat Dambang GFS - - - - -Plains Kampong Cham LCFI 1 2 1 2 1Tonle Sap Kampong Chhnang LCFI 2 2 2 3 2Plateau Kampong Spueu HCFI 1 1 1 2 1Tonle Sap Kampong Thum HCFI 1 1 2 3 1Coastal Kampot LCFI - 3 2 3 3Plains Kandal LCFI - 3 3 1 3Coastal Kaoh Kong LCFI - 1 1 1 1Plateau Kracheh LCFI 1 2 2 3 2Coastal Krong Kaeb LCFI - 2 2 3 2Plateau Krong Pailin LCFI 2 2 2 2 2Coastal Krong Preah Sihanouk LCFI - 1 2 1 2Plateau Mondol Kiri HCFI 1 1 1 1 1Plateau Otdar Mean Chey HCFI 2 1 1 1 1Phnom Penh Phnom Penh GFS - - - - -Tonle Sap Pousat HCFI 1 1 1 1 1Plateau Preah Vihear HCFI 2 1 1 1 1Plains Prey Veaeng HCFI 2 1 2 1 1Plateau Rotanak Kiri HCFI 1 1 1 1 1Tonle Sap Siem Reab HCFI 2 1 2 2 2Plateau Stueng Traeng HCFI 2 2 1 1 1Plains Svay Rieng LCFI - 1 3 1 2Plains Takaev LCFI - 2 3 1 2
Legend Generally food secure -GFS Low chronically food insecure - LCFIHigh chronically food insecure- HCFI Acute food and livelihood crisis - AFLCHumanitarian emergency - HE Famine/Humanitarian catastrophe - FHC
Note 1 = First priority (red); 2 = Second Priority (orange); 3 = Third Priority (yellow); - = Not a priority or GFS (green)
Underlying Indicators used for prioritizationFFW: Poverty rate and % of rice area destroyed by drought (2004-2006) FFE: Primary enrolment rate, Primary attendance rate and Primary completion rateMCH/MCN: Stunting and underweight are bad everywhere. Added U5 anemia and IMRNutrition assessment: 1st priority wherever wasting >7,3%; 2nd priority between 5-7.3%; 3rd priority <5%
Priority Province for integrated
interventions
Order of Priority of Interventions
Ecological Zone Province NameIPC
Classification

51
Selected List of References Asian Development Bank. 2001. Participatory Poverty Assessment: Cambodia.
Cambodia Development Resource Institute. 2002. Land, Rural Livelihoods and Food Security in Cambodia: A Perspective from Field Reconnaissance.
Cambodia Development Resource Institute. 2004. Focusing on Cambodia’s High Value Forests: Livelihoods and Management. Special report.
CDRI. 2005. The Cross-Border Economy of Cambodia, An Exploratory Study, Working Paper 32, Kingdom of Camodia.
Economic Institute of Cambodia. 2006. Cambodia Competitiveness Report 2005-2006, page 19-23.
Food Security Analysis Unit – FSAU, Somalia (2006): Integrated Food Security and Humanitarian Phase Classification: Technical Manual, Version 1, Technical Series, Report IV.11, May 2006
Helen Keller International-Cambodia. 2002. An Overview of Nutrition Sector Activities in Cambodia.
Helmers, Kent & Sanny Jegillos. 2004. Linkages between flood and drought disasters and Cambodian rural livelihoods and food security.
IFPRI. 2006. Global Hunger Index, a Basis for Cross-Country Comparisons.
IMF. 2006. Article IV Consultations, July, Country Report No 06/264
IMF. 2006. Cambodia, Selected Issues and Statistical Appendix, July, Country Report No 06/265.
International Labour Organization, United Nations Children’s Fund & World Bank Group. 2006. Children’s Work in Cambodia: A Challenge for Growth and Poverty Reduction.
Leung S. 2006. Integration and Transition- Vietnam, Cambodia and Lao PDR, Paper prepared for the seminar “Accelerating Development in the Mekong Region–the Role of Economic Integration”, Siem Reab, Cambodia, June 26-27, 2006.
Ministry of Agriculture, Forestry and Fisheries. 2006. Annual Conference on Agriculture, Forestry and Fisheries (29-31 March 2006). Phnom Penh.
Ministry of Agriculture, Forestry and Fisheries. 2006. Report on Agricultural Marketing System and Market Potential.
Ministry of Education, Youth and Sport. 2006. Education Statistics & Indicators 2005/2006.
Ministry of Health. 2005. Annual Progress Report of the National for Parasitology Entomology and Malaria Control Program 2005. Phnom Penh.
Ministry of Health. 2005. Tuberculosis Report 2005. Phnom Penh.
Ministry of Health. 2006. Report on HIV Sentinel Surveillance in Cambodia 2003.
Ministry of Planning. 2003. Cambodia Millennium Development Goals Report 2003.
Ministry of Planning. 2006. A Poverty Profile of Cambodia 2004. Phnom Penh.
National Institute of Public Health & Malaria Consortium, Cambodia. Cambodia National Malaria Baseline Survey 2004 Report.
National Institute of Public Health & National Institute of Statistics. 2006. Cambodia Demographic and Health Survey 2005. Phnom Penh.
National Institute of Statistics & Directorate General for Health. 2001. Cambodia Demographic and Health Survey 2000. Phnom Penh.
National Institute of Statistics. 2001-2005. Monthly Consumer Price Index, Phnom Penh.
National Institute of Statistics. 2002-2006. Quarterly Consumer Price Index, Cambodia.
National Institutes of Statistics. 2000. General Population Census of Cambodia 1998: Population Projection 2001-2021.
National Institutes of Statistics. 2004. Cambodia Inter-censal Population Survey 2004: General Report.

52
National Institutes of Statistics. 2005. Cambodia Inter-censal Population Survey 2004: Housing and Household Amenities.
National Institutes of Statistics. 2005. Cambodia Inter-censal Population Survey 2004: Literacy and Education.
National Institutes of Statistics. 2005. Cambodia Inter-censal Population Survey 2004: Spatial Distribution and Migratory Movements.
National Institutes of Statistics. 2005. Cambodia Inter-censal Population Survey 2004: Labour Force and Employment.
National Institutes of Statistics. 2005. Cambodia Inter-censal Population Survey 2004: General Report at Province Level for 24 Provinces.
National institutes of Statistics. 2005. Cambodian Statistical Yearbook 2005.
Oxfam. 2007. Food Security and Livelihood Baseline Assessment Report. Andoung Pou Commune, Romeas Hek District, Svay Rieng Province, Cambodia.
OXFAM. 2005. Food Security at the Household Level, Kompong Speu, Prey Veng, Svay Rieng and Takeo Provinces, drought assessment report, February
Royal Government of Cambodia. 2006. National Strategic Development Plan 2006-2010.
UNDP. 2004. The Macroeconomics of Poverty Reduction in Cambodia
UNDP. 2006. A SWOT Analysis of the Cambodian Economy.
UNDP. 2006. Human Development Report 2006
United Nations Development Programme & Food and Agriculture Organization. 2003. Cambodia Assessment and Localization of the Millennium Development Goal on Reducing Poverty and Hunger. Phnom Penh.
World Bank. 2005. Cambodia Rural Sector Strategy Note. Towards a Strategy for Rural Growth and Poverty Reduction.
World Bank. 2006. Cambodia: Halving poverty by 2015 – Poverty Assessment 2006. Phnom Penh.
World Bank. 2006. East Asia Update: Key Indicators
World Food Programme & M. S. Swaminathan Research Foundation. 2005. Food Security Atlas of Cambodia.
World Food Programme. 2003. Mapping Vulnerability to Natural Disasters in Cambodia.
World Food Programme. 2005. A Manual: Measuring and Interpreting Malnutrition and Mortality. Rome, Italy.
World Food Programme. 2006. Food Security Web Atlas of Cambodia.
World Food Programme. 2006. Cash in Emergencies and Transition, Technical Meeting Report, Addis Ababa 3-5 October.

53
Annex 1: Thematic Maps

54

55

56

57

58


![United Nations World Food Program (WFP) · WORLD FOOD PROGRAMME The World Food Programme[a] (WFP) is the food-assistance branch of the United Nations and the world's largest humanitarian](https://img.dokumen.tips/doc/110x75/5ff94d74123fcc5e865ee5ba/united-nations-world-food-program-wfp-world-food-programme-the-world-food-programmea.jpg)