Embed Size (px)
Citation preview
1 Proceedings: Global Research Forum on Sustainable Consumption and Production
Workshop, June 13-15, 2012, Rio de Janiero, Brazil.
Integrated Energy Conservation Policies from theGround Up: Lessons from the Eco-living Programof Singapore’s South West District
He H. Z. and Kua H. W.
Department of Building, School of Design & Environment, National University of Singapore
Abstract
This study documents a district-level energy intervention and conservation program designed
and implemented with the help of community stakeholders, which include students and staff
of an educational institution, the National University of Singapore, a local non-governmental
environmental group in Singapore and the district government. The program – known
formally as the ECO-Living Program – was funded by the district government. The Program
was implemented in the Hong Kah North Residential Council in the south western part of
Singapore. The research objectives are three-fold: 1) compare the effectiveness of different
interventions based on self-reported behavior scores as well as actual electricity reduction; 2)
investigate how behavior and electricity consumption are influenced by values, situational
and psychological factors; 3) examine the methods of intervention used according to
residents’ feedback and make recommendations for improvement. The key lesson is that
providing information about energy conservation in the right form is useful in interventions.
For the residents in our study, straightforward and easily implemented measures, emphasis on
the amount of money they can save with energy conservation and evoking environmental
concern in them are pivotal to effective intervention. Most importantly, this Program
exemplifies the important role that community, bottom-up initiatives can play in promoting
sustainable consumption with the resource support of the government. It provides a model
that other districts, or even countries, can adopt in engaging different stakeholders in
promoting energy conservation at the community level.

2 He & Kua
Proceedings: Global Research Forum on Sustainable Consumption and Production
Workshop, June 13-15, 2012, Rio de Janiero, Brazil.
1 The Need to Study Household Energy Consumption and Conservation
In the wake of climate change and escalating energy prices, studies on the effectiveness of
energy conservation efforts have become even more important than ever. The total energy
consumption of a geographical territory can be divided into three categories –industrial,
commercial and residential consumptions. Given that Singapore imports most of its energy
resources, household conservation has always been given high priorities in the national
environmental agenda. Ironically, systematic studies of household energy consumption
behavior have been lacking and this study aims to contribute to this cause, while contributing
to the worldwide knowledge database on how household energy usage behavior can be
modified. This study aims to address these questions through an intervention program that
was implemented in a local community situated in the south western part of Singapore.
2 Literature Review
2.1 Energy Consumption in Singapore
In our efforts to change energy consumption behavior to reduce our reliance on fossil
fuels, households are an important target group because they are responsible for
approximately 15% to 20% of total energy demands in OECD countries (OECD, 2001; Steg,
2008). Energy consumption of buildings (industrial, commercial as well as residential) took
up about 17% of Singapore’s total electricity production (Chua and Chou, 2010). Households
account for close to 10% of the electricity consumed (Ministry of Trade and Industry, 2007).
In a typical household, refrigeration and air-conditioning account for a large proportion
(about 60%) of electricity consumption.
Table 1. Singapore’s energy consumption by sectors in 2005
Percentage (%) Power generation
Industry Transport Buildings Households Others a
Fuel consumption 51 b 32 16 <1 <1 -
Electricity consumption
22 2 16 9 2
End-Use consumption
~54 ~18 ~17 ~10 ~2
a. Includes consumption for utilities, communication, construction, agriculture, etc. b. Electricity consumption is the part of power generation under the category of fuel consumption
Lessons from Eco-living Program
3
2.2 Role of tailored information and feedback in energy intervention programs
“Residential energy” can be broadly defined into direct and indirect consumptions. Energy
consumed in the house, either in the form of electricity, natural gas, or petroleum is defined
as “direct consumption”; energy embodied in goods and services which are purchased by
households is called “indirect consumption”. Most interventions are targeted at direct
consumption, whereas indirect consumption is seldom discussed. Even for those with
discussion on indirect consumption, no significant difference of indirect energy reductions
emerged (Benders, 2006; Abrahamse et al., 2007). This study focuses on examining direct
consumptions of respondents.
To reduce residential direct energy consumption, besides sustainable building design and
technology innovations leading to improved energy efficiency, intervention programs aimed
at modifying behavior are essential. Two types of strategies are identified to promote
residential energy conservation. Psychological strategies are aimed at changing people’s
knowledge, perceptions, motivation, cognitions and norms related to energy use and
conservation. An example is the provision of information. Structural strategies are aimed at
changing the context in which decisions are made so as to make energy conservation more
attractive. Examples are new or better products and services, changes in infrastructure,
pricing policies and legal measures (Steg, 2008).
In their review of the different intervention studies aimed at household energy
conservation, Abrahamse et al. (2005) divided intervention techniques into antecedent and
consequence interventions. Antecedent interventions are methods that influence one or more
determinants prior to the performance of pro-environmental actions. An example is providing
households with information on energy-saving that may result in energy reductions. On the
other hand, consequence interventions are actions taken after the occurrence of a pro-
environmental behavior, by means of providing a consequence that is contingent on the
outcome of the behavior. For example, giving households feedback on their energy
reductions may encourage them to further reduce energy due to their heightened level of self-
efficacy.
In fact, studies on effective antecedent interventions, in the form of tailored information,
dated back to the early 1980s. According to a study by the Oak Ridge National Laboratory,
an important characteristic of effective educational programs on conservation is the use of
personalized information (Sorenson, 1985). Similarly, Coltrane et al. (1986) independently
proposed that successful marketing in energy conservation must contain important
ingredients, include having vivid and personalized information (using individually tailored
recommendations), and personal appeal (by using face-to-face interactions). More recent
4 He & Kua
Proceedings: Global Research Forum on Sustainable Consumption and Production
Workshop, June 13-15, 2012, Rio de Janiero, Brazil.
studies, notably those by Abrahamse et al. (2005); Benders et al. (2006), EPRI (2009),
Schultz et al. (2007), and Carrico and Riemer (2011), found that antecedent interventions in
the form of home energy audits using tailored energy advice had positive effects on
household energy use reduction.
Pamphlets and stickers are widely used as outreach instruments in intervention programs.
McDougal et al. (1981) found evidence that incorporating pamphlets with utility bills can
help reduce residents’ energy consumption. However, Geller (1981) found that information
alone will not result in substantial change in behavior; pamphlets must be complemented with
other forms of outreach. This need for a “multi-pronged approach” was also supported by
Scott (1997) and Schipper and Hawk (1991). Similarly, studies on the use of stickers under
various circumstances to promote pro-environmental behavior had shown that they are most
effective when applied with other outreach instruments (for example, Wijarso, 1983;
Crossley, 1983; Hirst and Goeltz, 1982; Brechling and Smith, 1994). In particular, in
Crossley’s (1983) study, the conservation commitment of respondents who were given
stickers as reminders on energy conservation tips was one of the highest.
An important element of consequence interventions is the provisions of feedback, which
can be sub-divided into continuous feedback, daily feedback and weekly/monthly feedback.
Feedback through face-to-face means, pamphlets or website forms a majority of existing
studies. For example, Bittle et al. (1979) conducted a study in which a group of users received
daily feedback whereas the control group did not receive any. Results showed that the first
group saved more energy – an average of 4% of their consumption (compared to the
baseline). As part of a counselling session, Hayes and Cone (1981) examined the effect of
monthly feedback on electricity use, and found that households that received feedback
reduced electricity use by 4.7% on average, while the control households actually increased
electricity use by 2.3%. Van Houwelingen and Van Raaij (1989) conducted similar
experiments on household gas consumption, and found that household receiving continuous
feedback recorded more reductions in use than the group receiving monthly feedback. More
recently, studies conducted by EPRI (2009), Petersen et al. (2007) and Riemer and Bickman
(2010) had all shown that feedback is effective in reducing energy consumption by 5-15%.
However, studies using comparative feedback – in which households were verbally compared
with their neighbors – did not find it to be more effective than individual feedback (Midden et
al., 1983; Brandon and Lewis, 1999). A likely reason given by these authors is that many
subjects felt that their electrical and gas consumptions were unique and hence they perceived
comparisons of their consumptions with those of others’ with whom they were compared to

Lessons from Eco-living Program
5
be irrelevant; in other words, comparisons with others’ consumption had no effect on their
consumption levels.
With regards to providing feedback using electronic equipment, McClelland and Cook
(1980) gave households continuous feedback over a period of 11 months through an
electronic monitor display to show the costs of electricity used by them. They found that
these households used an average of 12% less electricity than a control group. More recent
studies by Mountain (2006), Anderson and White (2009a, 2009b), OFGEM (2009), Darby
(2001, 2006) and Hargreaves et al. (2010) had all shown that making energy consumptions
visible has the potential of effecting reductions of between 5% and 15%.
In comparison, assessments on the relative effectiveness of using pamphlets, stickers and
face-to-face interaction (also used as a mode for providing feedback on energy consumption)
in providing tailored information in a single study are not as common. Furthermore, there is a
lack of intervention studies in the existing literature on Asian householders. It is in these
respects that this work contributes to the literature. However, the study on using electronic
means of providing feedback was not included into the scope of this work.
2.3 Outcome assessment
Studies had found that self-reported actions do not necessarily lead to actual energy
reduction (after all, self-reported behavior may be influenced by social desirability, among
other factors). For example, Olsen and Cluett (1979) found no correlation between reported
household conservation actions and the amount of actual energy saved by them. These were
later supported by studies by Warriner et al. (1984) and Staats et al. (1996). Hence, a well-
designed study must take these two outcomes – self-reported actions and actual changes in
energy consumptions – into account.
In the literature, behavioral outcome is usually measured by means of comparing
responses to surveys on a set of conservation actions (for example, Staats et al. (1996)). There
is a need to ensure that the contexts within which the actions are taken, or not taken, are noted
because this can help explain any difference between actions and actual changes in energy
consumption. Measuring of actual consumptions can take the forms of referring to utility bills
or directly reading off meters. In Singapore, three types of meters are used for recording
water, gas and electricity consumptions respectively. They are physically checked by
inspectors from the utility companies on a regular basis and so the utility bills accurately
reflect the values actually measured by these meters. In this study, both reported actions and
actual consumptions were measured and compared.
6 He & Kua
Proceedings: Global Research Forum on Sustainable Consumption and Production
Workshop, June 13-15, 2012, Rio de Janiero, Brazil.
2.4 Consumer behavior aspect of energy conservation
Energy use is not only driven by the embodiment of knowledge and concerns for the
environment. Various social and environmental psychological studies related to household
energy use had been embarked; this line of inquiry is theory driven and aims to identify
underlying determinants of energy use, including attitudes (for example, Becker et al., 1981)
and socio-demographics. In other studies, both the effectiveness of an intervention and
changes in underlying determinants of energy use are monitored simultaneously (for
example, Staats et al. (1996)). Later studies looked into different social factors that play a role
in deciding consumption, such as comfort, effort, and status (Stern, 2000) play a role in
deciding behavioral changes. McKenzie-Mohr (2000) further highlighted the need to
understand these factors as barriers and opportunities for effecting longer lasting behavioral
changes. Gardner and Stern (2002) categorized energy conservation behavioral into
efficiency and curtailment behavior. The former is a one-shot behavior and may entail the
purchase of energy-saving equipment, whereas the latter is a repetitive effort to reduce energy
use. In our study, we assessed the curtailment behavior of respondents. In this sub-section, we
reviewed three streams of research that were applied in our research methodology. They are:
value-related, psychological and situational factors.
2.4.1 Values influencing behavior
Values are typically conceptualized as important life goals or standards that serve as
guiding principles in life (Rokreach, 1973) and thus can provide a basis for the formation of
attitudes and determine behavioral choices. Stern et al. (1995) proposed a hierarchical model
in relating values to behavior; this model comprises values (which are antecedents to
worldviews), beliefs, attitudes, and behavior. Values are situation-transcending beliefs about
what is important in life, whereas worldviews are general beliefs related to a specific domain
of life, such as environmental concern. In this model, it is proposed that values and
worldviews act as filters for new information received, after which congruent attitudes and
beliefs emerge. These attitudes and beliefs then determine environmental behavior.
In studying how values determine behavior, several notable models were introduced; an
example is the New Environmental Paradigm (NEP) (Dunlap et al., 2000), which measures
views on the human-environment relationship and general environmental concern. Kollmuss
and Agyeman (2002) highlighted a need for more exact measurements on the quality of life
(QOL) that consumers embrace and assess QOL indicators with other factors in designing
intervention programs. Poortinga et al. (2004) defined twenty-two QOL indicators that take

Lessons from Eco-living Program
7
into consideration a variety of values, including environmental values and self enhancement
values; the authors concluded that those who embraced environmental quality values were
more likely to undertake environmental action. Conversely, self-enhancement values were
negatively related to environmental concern. However, self-enhancement can be tapped on as
a potential solution to environmental problems; for example, economic self-interest to save
money can encourage pro-environmental action (which was in line with findings by
DeYoung (2000)). However, Tucker and Speirs (2003) argued that even if people value
environmental quality more than economic considerations, that environmental values must be
highly salient to the individual before they increase the motivation to behave. In fact, stronger
correlations are usually found between behaviors and the constraints and barriers to
accomplishing those behaviors. These are also known as “inconvenience” factors, which are
important reasons not to practice environmental action, such as the efforts and the time
required.
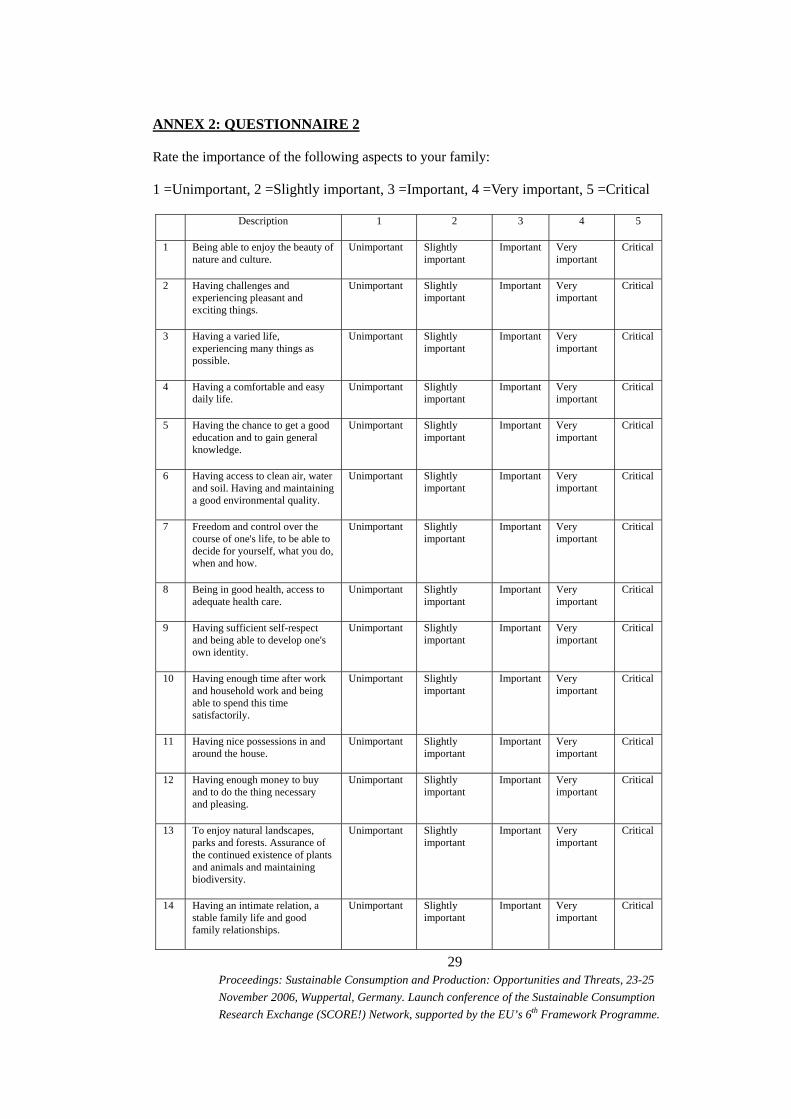
Due to its comprehensiveness, Poortinga et al.’s model on QOL was chosen and applied to
our study to characterize a respondent’s value. Questions related to these factors are
incorporated into questionnaire 2 (annex 2).
2.4.2 Psychological factors
These factors reflect the specific perceptions that people hold towards particular
behaviors, and consist of a diverse variables (Gilg and Barr, 2005). The key variables, studied
by various scholars, are summarized as follow:
a) Social influence and self-presentation: the role of friends, relatives and other
influential individuals play a part in formulating and encouraging environmental
behaviors (Barr, 2007). This is because behavior is likely to be modified when people
are aware of a given social norm, and are more willing to accept this norm when
others around them are practicing the social norm as well.
b) Intrinsic motivation and personal satisfaction: De Young (2000) argued that
participating in environmental action can allow one to gain a sense of satisfaction and
an inner sense of well-being, alongside a belief that society is benefiting from one’s
behavior. This “feel good” outcome was the intrinsic motivation driving one to have
environmental behavior.
c) Personalization of environmental issues: if a person internalizes environmental
concerns and perceives environmental problems as tangible threats to the well-being
and health of himself, his family and friends, he is more likely to practice
environmental measures (Baldassare and Katz, 1992).

8 He & Kua
Proceedings: Global Research Forum on Sustainable Consumption and Production
Workshop, June 13-15, 2012, Rio de Janiero, Brazil.
d) Outcome beliefs: environmental problems are often perceived as major global
problems, and some people feel that individual actions have little or no impact in
reducing the effects of environmental problems. However, if this perception can be
changed, and people realize and believe in their tangible impact on the environment
through environmental behavior, they are more willing to act (Hopper and Nielson,
1991).
e) Self-efficacy: this refers to the extent to which people believe they are able to carry out
the behavior and undertake action. Gilg and Barr (2005) and Ajzen (1991) termed this
as perceived behavioral control, which is defined as how easy or difficult performance
of the behavior is likely to be. If a person has a strong belief that he can carry out
environmental action, he is more likely to undertake it.
f) Trust and responsibility: as discussed earlier, the extent to which people trust
environmental information provided to them is crucial in eliciting positive behavioral
responses, in particular those provided by the government, non-governmental
organizations and commercial organizations. The higher the level of trust, the higher
will be the likelihood of environmental behavior.
In this paper, all these six factors were measured in an effort to relate respondents’
psychological traits with both their reported behavior changes and actual changes in
consumptions. Questions related to these factors are incorporated into questionnaire 3 (annex
3).
2.4.3 Situational factors
These define a given personal situation and consider the different contexts in which a
person resides and makes decision (Barr, 2007). The key situational factors that were
discussed in the literature can be categorized as below:
a) Socio-demographics: variables such as age group, household type, size and
composition, education level, income level all play a part in influencing
environmental behavior. For example, households with children and youth may have
more needs that determine energy use to a large extent, such as teenage use of lengthy
showers.
b) Environmental and behavioral knowledge: environmental knowledge is defined as
being a representation of general knowledge about the state of the environment and an
awareness of environmental problems such as climate change. Behavioral knowledge
is termed as concrete knowledge, which is knowledge needed for action, such as

Lessons from Eco-living Program
9
knowing how to save water in the kitchen (Schahn and Holzer, 1990). It is a
significant prerequisite for environmental behavior, and thus determines high or low
levels of environmental action. Environmental knowledge is important as it can
influence psychological factors like personalization of environmental issues.
Theoretically, it is only when people are highly aware of environmental issues that
they are more likely to feel that these problems are a tangible threat to personal well-
being.
c) Service availability: access to services catered for environmental action influences
environmental action. This is likely to have certain positive normative and behavioral
effects as people perceive access to service as convenient and time-saving, which
increases their level of self-efficacy (Barr, 2007).
d) Policy knowledge and intervention: government policies can influence environmental
behavior indirectly and directly. Four areas of policies that influence environmental
behavior indirectly are: demographics, socio-cultural developments, economics and
physical/spatial developments. An example of a policy with potential direct influences
on environmental behavior is high electricity tariff.
In this paper, all these four factors were measured in order to understand how
respondents’ situational traits can be related to both their reported behavior changes and
actual changes in consumptions. Questions related to these factors are also incorporated into
questionnaire 3 (annex 3).
3. Research Methodology
The objectives of this study are three-fold: 1) compare the effectiveness of different
intervention methods, based on self-reported behavior scores as well as actual reductions in
electricity consumptions; 2) investigate how behavior and electricity consumption are
influenced by values, situational and psychological factors; 3) critique the intervention
methods used according to residents’ feedback, and make recommendations for
improvement. Three types of intervention instruments – leaflets, stickers and face-to-face
interactions (or, counselling sessions) – are used to provide tailored information and feedback
to promote household energy conservation within an Asian context. Outcome measurements
were done by self-reported behavioral changes and changes in actual energy use. Any
correlations of these outcomes to behavioral determinants – values, psychological and
situational factors – were examined. The approach taken is new in the sense that it correlates
the effectiveness of the intervention instruments to, among other factors, the twenty-two
QOL factors within an Asian context.
10 He & Kua
Proceedings: Global Research Forum on Sustainable Consumption and Production
Workshop, June 13-15, 2012, Rio de Janiero, Brazil.
The target area of the study is a public housing estate known as Hong Kah North. Since
over 80% of Singapore residents live in public housing, focusing on public housing is
meaningful and representative. The local district governing units – the Southwest Community
Development Council of Singapore (SWCDC) and Hong Kah North Residential Council –
provide the endorsement and financial support for this intervention program, which is
officially named the “Eco-living program”. The National Environment Agency (NEA)
provides the leaflets and stickers. An educational institution – the Institute for Technical
Education (ITE) College West – registered its students as volunteers to assist in conducting
the experiments. ECO Singapore, a local non-government organization with the aim of
promoting eco-friendly events in Singapore, partners with the National University of
Singapore (NUS) to provide the necessary training and monitoring of the student volunteers.
In this study, the basic sample is a household, which entails all the residents living in the
same apartment. The program started in October 2010 and ended in July 2011. From October
through November 2010, visits were conducted to encourage the residents to participate in
the program; electricity consumption data (herein referred to as the baseline consumption
data) was collected and energy consumption behavior was survey (with parts A and B of
questionnaire 1, shown in annex 1). From December to January, households were visited
again and their energy consumption data and behavior were surveyed. The intervention
officially began in February 2011 and continued through July 2011.
The households under study were divided into 3 groups: leaflet group, counselled group
and control. The treatments of these three groups were as follow:
Leaflet group (also known as group 1)
o February 2011: households energy consumption behaviour was surveyed
(using only part B of questionnaire 1) and actual energy consumption data
was collected. Leaflets and stickers were also distributed.
o March through July 2011: energy-related behavior was surveyed and
analysed (using only part B of questionnaire 1).
Counselled group (group 2)
o February through July 2011: households energy consumption behaviour
was surveyed (using only part B of questionnaire 1) and actual energy
consumption data was collected. Counselling was provided monthly to
encourage residents to implement more energy-saving measures.

Lessons from Eco-living Program
11
Control (group 3)
o February through July 2011: households energy consumption behaviour
was surveyed (using only part B of questionnaire 1) and actual energy
consumption data was collected.
In July 2011, for all the three groups, other than surveying the energy consumption behaviour
and collecting actual consumption data, questionnaires 2 and 3 were answered by the
households.
The leaflets distributed to the leaflet group are designed by the NEA for the “Energy
Efficient Singapore – Fight Climate Change” Program. Reminder stickers were also
distributed to this group, and they include exactly the same information as the leaflets.
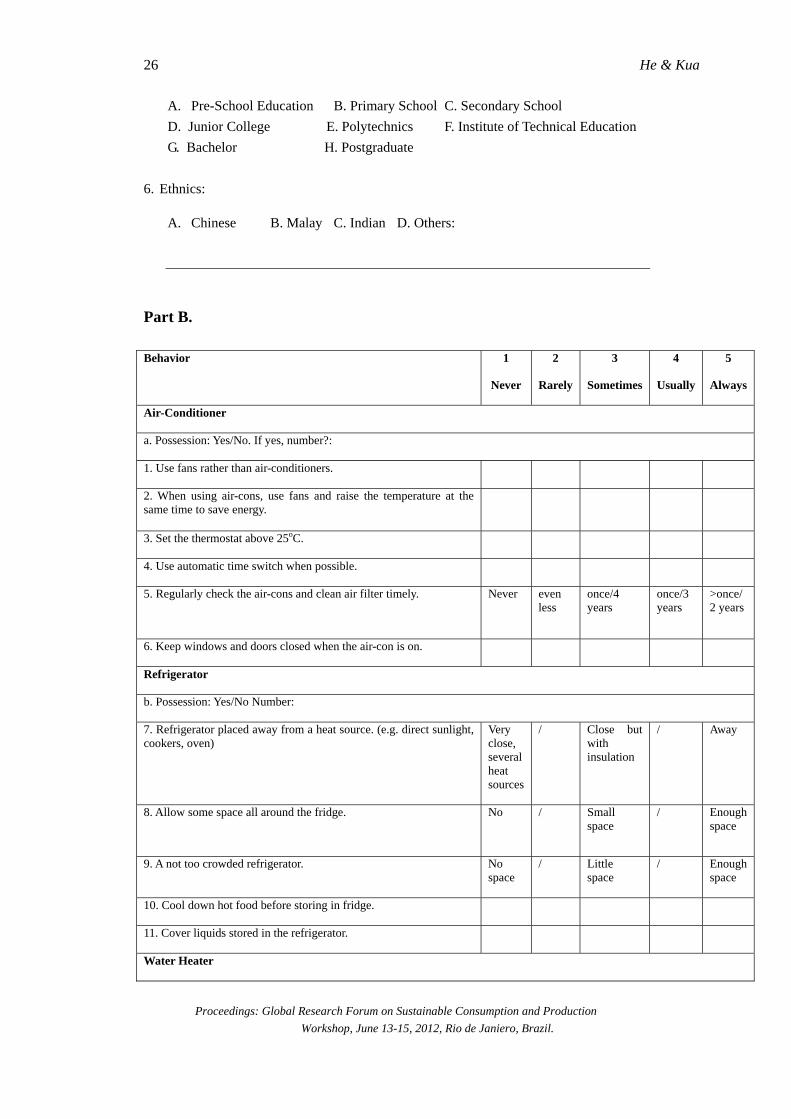
As shown in questionnaire 1 (annex 1), energy-related behavior is classified according to
types of home appliances, such as air-conditioner, refrigerator, water heater, light, home
electronics, and clothes dryer. Under each category, there are several questions on different
energy-related behavior. Explanations on the reasons and benefits of recommended energy-
saving behavior are given by the volunteer only to the counselled group. Specifically, if
volunteers noted that a “never” or “rarely” response is given to a particular question, they will
ask the residents for explanations for their decisions and offer advices for the residents to
implement these neglected actions in the following month. In other words, tailored
information is provided to the residents in the counselled group.
Questionnaire 2 aims to uncover any correlation between respondents’ value (QOL
factors) and their energy consumption behaviour. The questions in questionnaire 3are mainly
in two categories: first, questions on whether the program has worked as designed; and
second, questions to find out what people regard as important reasons for adopting the energy
reduction measures. These reasons include reduction money, environmental concern,
convenience of information, encouragement, trust in information source, satisfaction from
energy reduction behavior and easiness of behavior. These questions aim to correlate
residents’ energy consumption behavior to different psychological and situational factors, as
described in the sub-sections 2.4.2 and 2.4.3.
Besides via questionnaires, actual data on electricity consumptions was collected from
the monthly utility bills of the households and actual meter readings.
The Statistical Package for Social Sciences (SPSS) and Microsoft Excel 2011 was used for
data analyses. Since the 5-point Likert scale was used in all the questionnaires, non-
parametric methods were used to analyse the data. These methods included the Wilcoxon
sign-ranked Test and Mann-Whitney U Test. Furthermore, to identify any grouping of the
factors (independent variables), factor analysis was used. Finally, ordinary least square

12 He & Kua
Proceedings: Global Research Forum on Sustainable Consumption and Production
Workshop, June 13-15, 2012, Rio de Janiero, Brazil.
regression was employed to illustrate any linear correlation between any reductions in
electricity consumption and the different factors (value, situational and psychological
factors).
4. Results and Analyses
151 households participated in the entire experiment. Their profile is shown in tables 1 and
2.
Table 1. Sample sizes of the different treatment and control groups
Group Number of households
Leaflet Group (Group 1) 61
Counselled Group (Group 2) 41
Control Group (Group 3) 49
Total 151
Table 2. Ethnic distributions of all treatment and control groups
Ethnic group
Percentage of the
samples (%)
Percentage of Singapore residents in
the whole Singapore (%)
Chinese 59.8 74.1
Malay 16.2 13.4
Indian 19.7 9.2
Other 4.3 3.3
As mentioned earlier, all the households involved in the study live in public housing. To be as
representative as we can, all the categories of local public housing are included. The
distributions are shown in table 3.
Table 3. Distributions of different housing types in all treatment and control groups.
Housing type Percentage (%)
2-room flat (2RF) 2.2
3RF 28.5
4RF 59.1
5RF 0.7
Executive apartment
1.5
Executive maisonette
8.0
Lessons from Eco-living Program
13
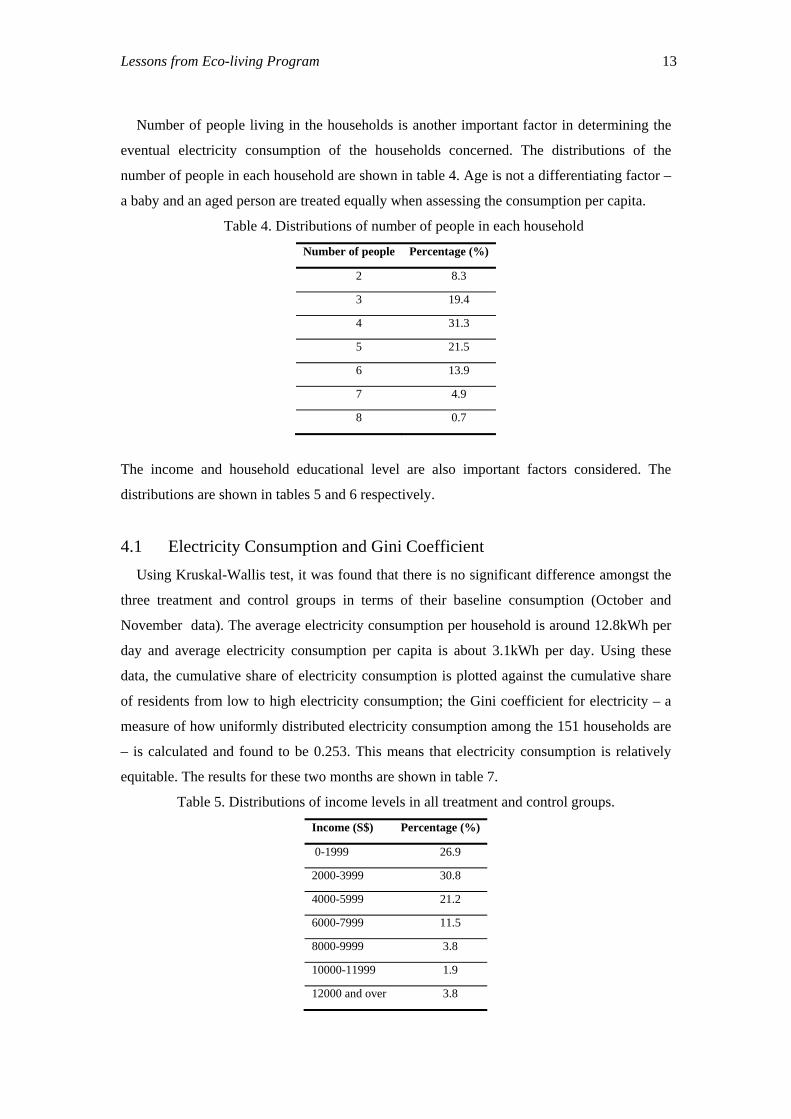
Number of people living in the households is another important factor in determining the
eventual electricity consumption of the households concerned. The distributions of the
number of people in each household are shown in table 4. Age is not a differentiating factor –
a baby and an aged person are treated equally when assessing the consumption per capita.
Table 4. Distributions of number of people in each household
Number of people Percentage (%)
2 8.3
3 19.4
4 31.3
5 21.5
6 13.9
7 4.9
8 0.7
The income and household educational level are also important factors considered. The
distributions are shown in tables 5 and 6 respectively.
4.1 Electricity Consumption and Gini Coefficient
Using Kruskal-Wallis test, it was found that there is no significant difference amongst the
three treatment and control groups in terms of their baseline consumption (October and
November data). The average electricity consumption per household is around 12.8kWh per
day and average electricity consumption per capita is about 3.1kWh per day. Using these
data, the cumulative share of electricity consumption is plotted against the cumulative share
of residents from low to high electricity consumption; the Gini coefficient for electricity – a
measure of how uniformly distributed electricity consumption among the 151 households are
– is calculated and found to be 0.253. This means that electricity consumption is relatively
equitable. The results for these two months are shown in table 7.
Table 5. Distributions of income levels in all treatment and control groups.
Income (S$) Percentage (%)
0-1999 26.9
2000-3999 30.8
4000-5999 21.2
6000-7999 11.5
8000-9999 3.8
10000-11999 1.9
12000 and over 3.8
14 He & Kua
Proceedings: Global Research Forum on Sustainable Consumption and Production
Workshop, June 13-15, 2012, Rio de Janiero, Brazil.
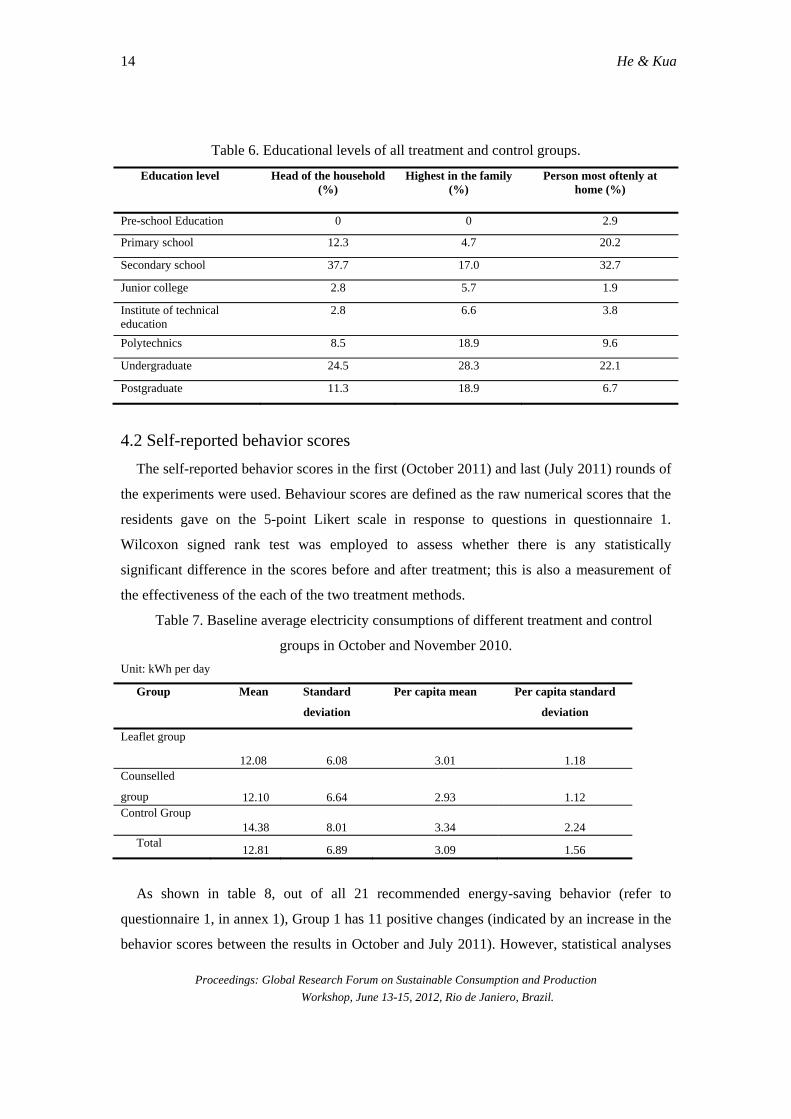
Table 6. Educational levels of all treatment and control groups.
Education level Head of the household (%)
Highest in the family (%)
Person most oftenly at home (%)
Pre-school Education 0 0 2.9
Primary school 12.3 4.7 20.2
Secondary school 37.7 17.0 32.7
Junior college 2.8 5.7 1.9
Institute of technical education
2.8 6.6 3.8
Polytechnics 8.5 18.9 9.6
Undergraduate 24.5 28.3 22.1
Postgraduate 11.3 18.9 6.7
4.2 Self-reported behavior scores
The self-reported behavior scores in the first (October 2011) and last (July 2011) rounds of
the experiments were used. Behaviour scores are defined as the raw numerical scores that the
residents gave on the 5-point Likert scale in response to questions in questionnaire 1.
Wilcoxon signed rank test was employed to assess whether there is any statistically
significant difference in the scores before and after treatment; this is also a measurement of
the effectiveness of the each of the two treatment methods.
Table 7. Baseline average electricity consumptions of different treatment and control
groups in October and November 2010.
Unit: kWh per day
Group
Mean Standard
deviation
Per capita mean Per capita standard
deviation
Leaflet group
12.08 6.08 3.01 1.18 Counselled
group 12.10 6.64 2.93 1.12 Control Group
14.38 8.01 3.34 2.24 Total
12.81 6.89 3.09 1.56
As shown in table 8, out of all 21 recommended energy-saving behavior (refer to
questionnaire 1, in annex 1), Group 1 has 11 positive changes (indicated by an increase in the
behavior scores between the results in October and July 2011). However, statistical analyses
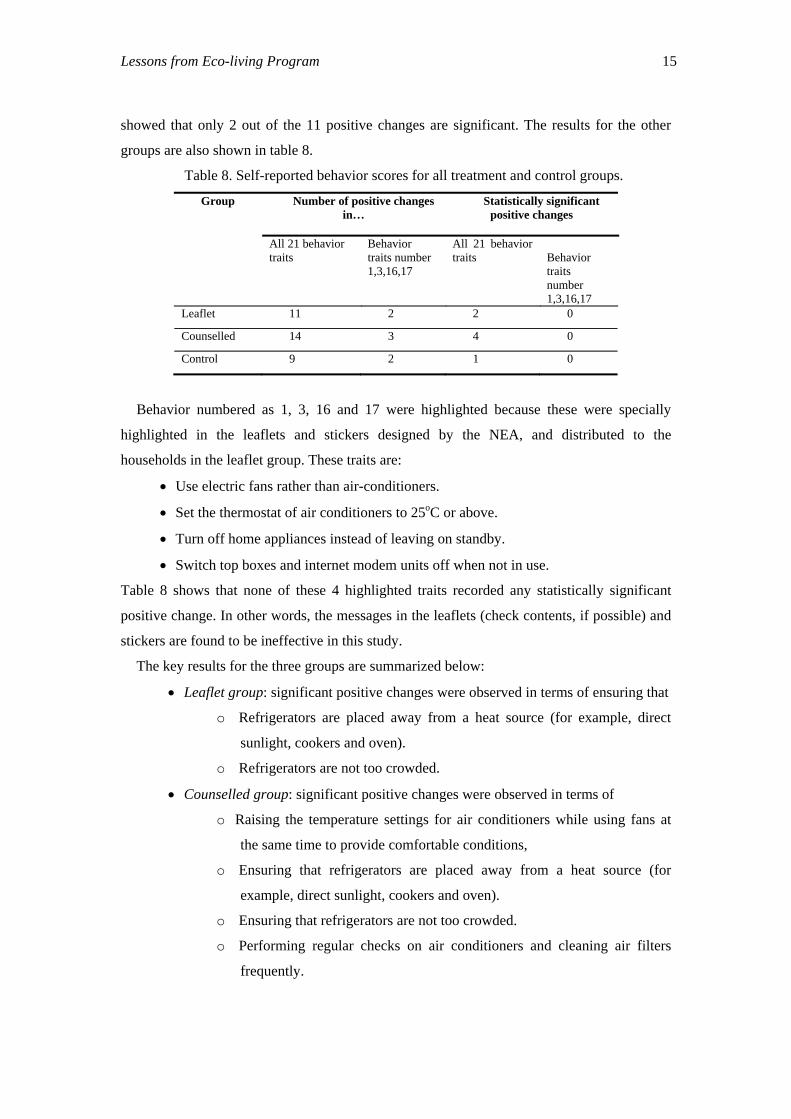
Lessons from Eco-living Program
15
showed that only 2 out of the 11 positive changes are significant. The results for the other
groups are also shown in table 8.
Table 8. Self-reported behavior scores for all treatment and control groups.
Group Number of positive changes in…
Statistically significant positive changes
All 21 behavior traits
Behavior traits number 1,3,16,17
All 21 behavior traits
Behavior traits number 1,3,16,17
Leaflet 11 2 2 0
Counselled 14 3 4 0
Control 9 2 1 0
Behavior numbered as 1, 3, 16 and 17 were highlighted because these were specially
highlighted in the leaflets and stickers designed by the NEA, and distributed to the
households in the leaflet group. These traits are:
Use electric fans rather than air-conditioners.
Set the thermostat of air conditioners to 25oC or above.
Turn off home appliances instead of leaving on standby.
Switch top boxes and internet modem units off when not in use.
Table 8 shows that none of these 4 highlighted traits recorded any statistically significant
positive change. In other words, the messages in the leaflets (check contents, if possible) and
stickers are found to be ineffective in this study.
The key results for the three groups are summarized below:
Leaflet group: significant positive changes were observed in terms of ensuring that
o Refrigerators are placed away from a heat source (for example, direct
sunlight, cookers and oven).
o Refrigerators are not too crowded.
Counselled group: significant positive changes were observed in terms of
o Raising the temperature settings for air conditioners while using fans at
the same time to provide comfortable conditions,
o Ensuring that refrigerators are placed away from a heat source (for
example, direct sunlight, cookers and oven).
o Ensuring that refrigerators are not too crowded.
o Performing regular checks on air conditioners and cleaning air filters
frequently.
16 He & Kua
Proceedings: Global Research Forum on Sustainable Consumption and Production
Workshop, June 13-15, 2012, Rio de Janiero, Brazil.
Control: significant positive change is found for
o Ensuring that refrigerators are placed away from a heat source (for
example, direct sunlight, cookers and oven).
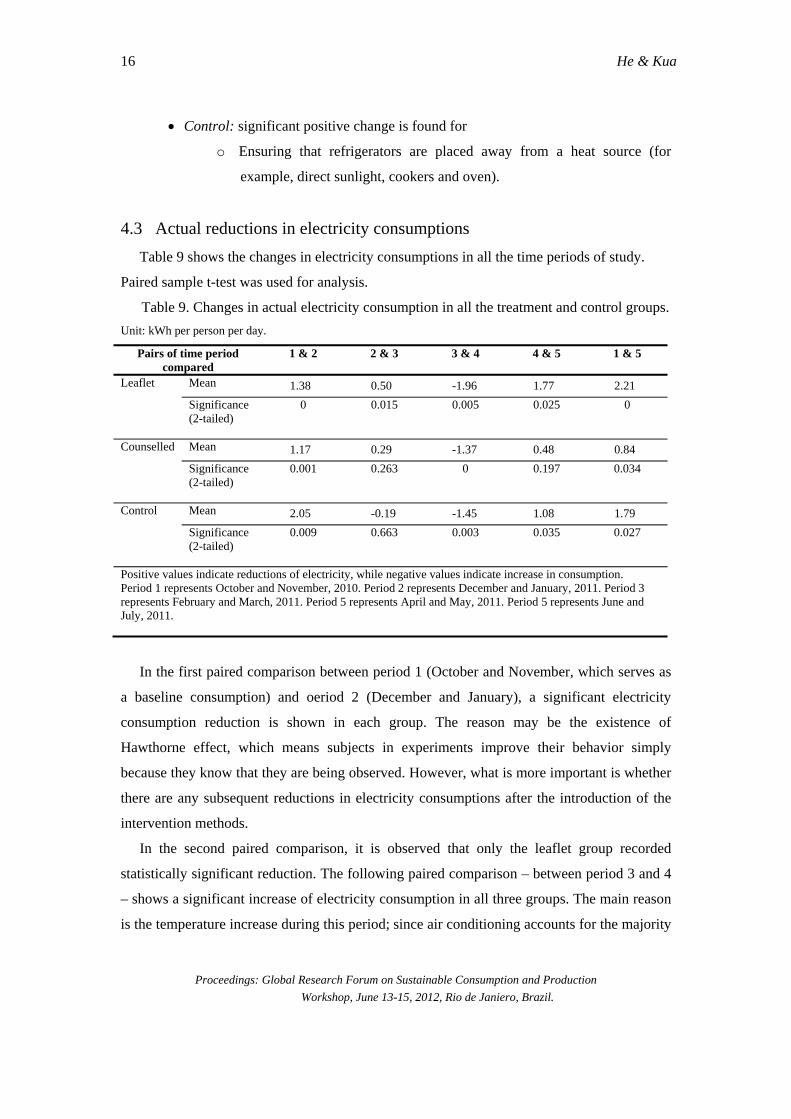
4.3 Actual reductions in electricity consumptions
Table 9 shows the changes in electricity consumptions in all the time periods of study.
Paired sample t-test was used for analysis.
Table 9. Changes in actual electricity consumption in all the treatment and control groups.
Unit: kWh per person per day.
Pairs of time period compared
1 & 2 2 & 3 3 & 4 4 & 5 1 & 5
Leaflet
Mean 1.38 0.50 -1.96 1.77 2.21
Significance (2-tailed)
0 0.015 0.005 0.025 0
Counselled
Mean 1.17 0.29 -1.37 0.48 0.84
Significance (2-tailed)
0.001 0.263 0 0.197 0.034
Control
Mean 2.05 -0.19 -1.45 1.08 1.79
Significance (2-tailed)
0.009 0.663 0.003 0.035 0.027
Positive values indicate reductions of electricity, while negative values indicate increase in consumption. Period 1 represents October and November, 2010. Period 2 represents December and January, 2011. Period 3 represents February and March, 2011. Period 5 represents April and May, 2011. Period 5 represents June and July, 2011.
In the first paired comparison between period 1 (October and November, which serves as
a baseline consumption) and oeriod 2 (December and January), a significant electricity
consumption reduction is shown in each group. The reason may be the existence of
Hawthorne effect, which means subjects in experiments improve their behavior simply
because they know that they are being observed. However, what is more important is whether
there are any subsequent reductions in electricity consumptions after the introduction of the
intervention methods.
In the second paired comparison, it is observed that only the leaflet group recorded
statistically significant reduction. The following paired comparison – between period 3 and 4
– shows a significant increase of electricity consumption in all three groups. The main reason
is the temperature increase during this period; since air conditioning accounts for the majority

Lessons from Eco-living Program
17
of household electricity consumption, it is expected that an increase in temperature results in
increase in electricity consumption.
Comparing the electricity consumption of the last round and the round before the program
started, it is found that all three groups show a significant reduction of electricity
consumption. On average, the leaflet group achieved a 15.8% reduction, the counselled group
reduced 7.1% and the control group reduced 2.7%.What is counter-intuitive is that even the
control group experienced a significant reduction. This may be because in the interactions
with the households, volunteers may inevitably have to share with the households their
knowledge on energy reduction measures, especially when the households asked them
questions related to these measures.
4.4 Factor Analyses of the QOL Variables
Cronbach’s alpha, a measure of internal consistency, is calculated for the set of 21
reported behavior scores as well as the set of 22 QOL variables. It was found that the
Cronbach’s alpha coefficients for both are greater than 0.7, which signified high internal
consistency of both. The data was further checked and found to pass the Kaiser-Meyer-Olkin
test of sampling adequacy and the Bartlett’s test of sphericity.
Then the 22 QOL variables were analysed using factor analysis (with respect to self-
reported behaviour and baseline consumptions) and after varimax rotation was conducted, a
six-factor solution was obtained. In summary, the six-factor solution accounts for an
acceptable 68.5% of the original variance in the data. These factors are described as follow:
Factor 1 contains 6 variables, which can be related to “environmental externality”.
Factor 2 contains 3 variables, which can be related to respondents’ “openness to
change” – meaning people with high scores in this value are open to changes and
value beauty and excitement.
Factor 3 contains items related to family, work, health and religion. This can be
related to “traditional family value”.
Factor 4 is related to “environment and freedom”.
Factor 5 covers money, comfort, leisure time and social justice, hence representing
“enjoyment”; and,
Factor 6 contains only one variable – “education”.
Next, the average self-reported behavior score and baseline electricity consumption before
the experiment were regressed to the six values (QOL) factors and the situational and
psychological variables.

18 He & Kua
Proceedings: Global Research Forum on Sustainable Consumption and Production
Workshop, June 13-15, 2012, Rio de Janiero, Brazil.
4.5 Regression analysis of self-reported behavior scores and baseline
consumptions with respect to situational, psychological and values (QOL)
factors
Annex 4 shows the results of our correlation of the self-reported scores and baseline
consumptions with the different factors considered in this study. In summary, about 14.3% of
the original variance of self-reported behavior scores can be explained by the model. Among
the values (QOL) factors, the strongest predictor is the “traditional family value” factor,
followed by the “openness to change” factor. Ethnics also play an important role in self-
reported behavior scores. Malay families have bigger correlation with self-reported
improvements in behavior scores.
Number of people in the household, housing type, and air-conditioner possession have
significant positive correlation with actual electricity consumption; none of the values (QOL)
variables have a significant correlation with actual electricity consumption. The households
in larger apartments with more people and using air-conditioners are consuming more
electricity. The variance explained in this regression model is 17.7%.
The finding that values (QOL) do not influence actual baseline consumptions is similar to
previous findings by scholars (for example, Gatersleben, Steg and Vlek (2002) and Poortinga,
Steg and Vlek, (2004)).
4.6 Regression analysis of reductions in consumption with respect to
situational, psychological and values (QOL) factors
Percentage of consumption reduction between the baseline consumption and the data taken
from July 2011 was regressed on demographics, values (QOL), self-reported behavior score,
and groupings (that is, whether the residents belong to any of the two treatment groups or the
control). Dummy variables are used to describe groupings – that is, the variable “leaflet” is
given the value of “1” if the household is from the leaflet group, and “0” if otherwise. The
results are shown in annex 5.
Housing type has a positive correlation and the dummy variable for the control group has a
negative correlation with percentage of consumption reduction. This implies that households
who live in larger units but are not in the control group are more likely to save more energy.
The fact that households not in the control group tend to save more implies that the
intervention methods have been successful.
Lessons from Eco-living Program
19
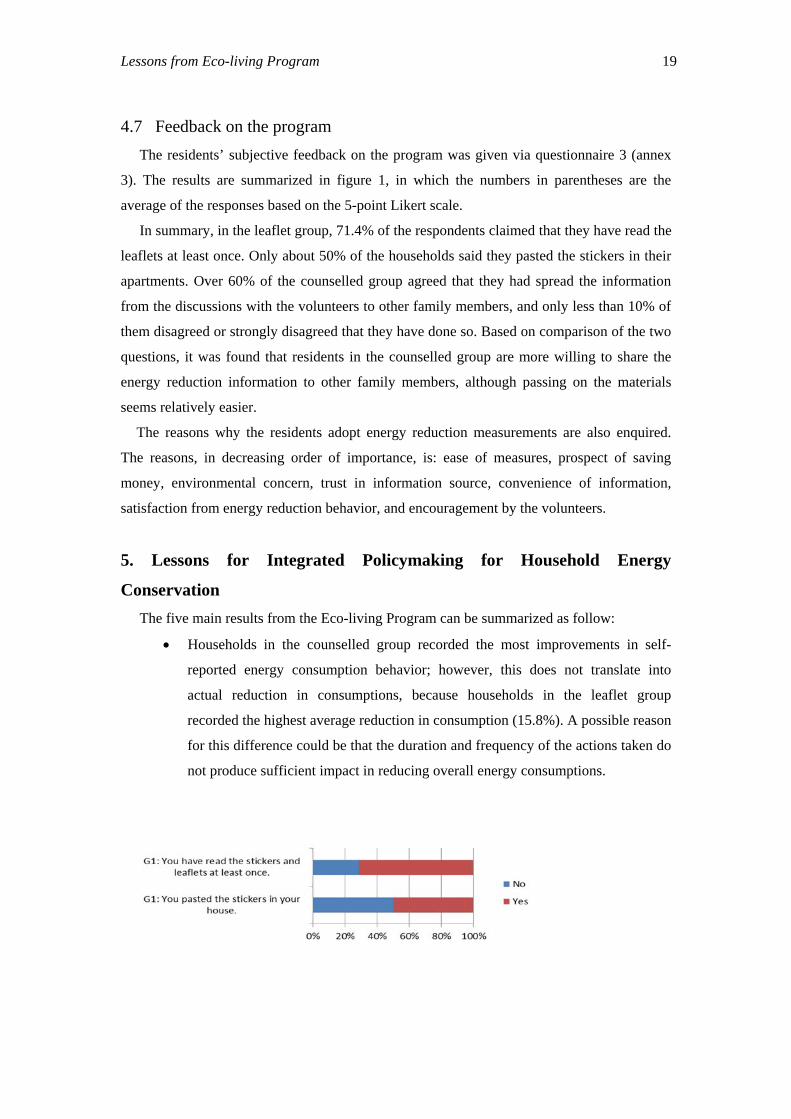
4.7 Feedback on the program
The residents’ subjective feedback on the program was given via questionnaire 3 (annex
3). The results are summarized in figure 1, in which the numbers in parentheses are the
average of the responses based on the 5-point Likert scale.
In summary, in the leaflet group, 71.4% of the respondents claimed that they have read the
leaflets at least once. Only about 50% of the households said they pasted the stickers in their
apartments. Over 60% of the counselled group agreed that they had spread the information
from the discussions with the volunteers to other family members, and only less than 10% of
them disagreed or strongly disagreed that they have done so. Based on comparison of the two
questions, it was found that residents in the counselled group are more willing to share the
energy reduction information to other family members, although passing on the materials
seems relatively easier.
The reasons why the residents adopt energy reduction measurements are also enquired.
The reasons, in decreasing order of importance, is: ease of measures, prospect of saving
money, environmental concern, trust in information source, convenience of information,
satisfaction from energy reduction behavior, and encouragement by the volunteers.
5. Lessons for Integrated Policymaking for Household Energy
Conservation
The five main results from the Eco-living Program can be summarized as follow:
Households in the counselled group recorded the most improvements in self-
reported energy consumption behavior; however, this does not translate into
actual reduction in consumptions, because households in the leaflet group
recorded the highest average reduction in consumption (15.8%). A possible reason
for this difference could be that the duration and frequency of the actions taken do
not produce sufficient impact in reducing overall energy consumptions.

20 He & Kua
Proceedings: Global Research Forum on Sustainable Consumption and Production
Workshop, June 13-15, 2012, Rio de Janiero, Brazil.
Figure 1. Responses to feedback. “G1” refers to the leaflet group; “G2” refers to the
counselled group and “G1” is the control group.
Self-reported results show that the information given in the leaflets and stickers on
four specific energy-saving measures are not effective in changing behavior.
However, since leaflets and stickers were found to be the most effective in
reducing general consumption, there is reason to believe that the information
given in the leaflet may have prompted households to adopt other measures that
are mentioned in the questionnaires but not explicitly highlighted in the leaflets
and stickers. In other words, these leaflets and stickers may have served the
purpose of reminding households to conserve energy in general.
Number of people in the household, housing type, and air-conditioner possession
have significant positive correlation with actual electricity consumption; none of
the values (QOL) variables have a significant correlation with actual electricity
consumption.
Lessons from Eco-living Program
21
The three most important reasons given for adoption of energy-saving measures
are the ease of implementing the measures, the prospect of reduction electricity
bills, and concern for the environment.
Only housing type of the households is a predictor of the actual reductions in
consumptions. Households from bigger apartments tend to record higher level of
reductions. An explanation is that these households have higher utility bills and so
they view energy conservation as an effective mean to save money.
How can these results help us in planning for future integrated energy intervention
program?
Firstly, a distinguishing element of the Eco-living Program is the engagement of the ITE
College West and the non-governmental environmental group in the execution of the project.
This is an element that contributes toward the integrated nature of this program. In order for
this element to be effective in supporting a country’s energy conservation policies, the
volunteers and social workers must be trained adequately so that they can effectively
communicate the essential information to the households. Such information must enable them
to explain the energy-saving measures to the household clearly and accurately, so that the
latter feel that these measures are easy to adopt. Furthermore, volunteers should also be
equipped with the knowledge to explain energy reductions in terms of potential cost
reductions for households and presenting information to them to evoke a sense of concern for
the environment. Doing so will require the SWCDC to collaborate well with the local
universities. A possible idea to consider for future programs is to engage university students
to train the volunteers, as well as engage interested university students to become volunteers.
Secondly, energy reduction actions should be further simplified as much as possible.
Furthermore, during the counselling sessions, volunteers may demonstrate some of these
actions to ensure that households correctly understand the execution of these actions. For
example, instead of saying “Do not leave the fridge door open for too long”, a more concrete
action such as “should not leave the refrigerator door open for more than 10 seconds or
counts” can be prescribed. This will require the questionnaires to be improved.
Thirdly, the content of the leaflets and stickers should be improved. A possible way of
improvement is to have the volunteers or their coaches from the university design the
contents of the leaflets and stickers, so that they are congruent with the key messages that the
volunteers aim to bring across to the households.
Finally, in relationship to the previous point, volunteers may try supplementing their
verbal messages with short clips that can be shown to the households via multi-media
electronic gadgets such as portable computers.
22 He & Kua
Proceedings: Global Research Forum on Sustainable Consumption and Production
Workshop, June 13-15, 2012, Rio de Janiero, Brazil.
The “Eco-living” program has the potential to be an exemplar of bottom-up approach to
promote energy conservation in households. If designed and executed correctly, such a
program can become an important component of any country’s holistic policy approach
toward energy conservation. An attractive aspect of this program is its integrated nature,
which involves student volunteerism and establishing a multi-agency collaborative platform
that engages different governmental and non-governmental stakeholders.
References
Abrahamse, W. et al.. (2005). A review of intervention studies aimed at household energy conservation, Journal
of Environmental Psychology 25, 273–291 Abrahamse, W. et al. (2007). The effect of tailored information, goal setting, and tailored feedback on household
energy use, energy-related behaviors, and behavioral antecedents. Journal of Environmental Psychology, 27(4), 265-276.
Ajzen, I. (1991). The theory of planned behavior, Organizational Behavior and Human Decision Processes, 50, 179-211 Anderson, W., White, V., (2009a). Exploring consumer preferences for home energy display functionality: report
to the Energy Saving Trust. Bristol, Centre for Sustainable Energy. Anderson, W., White, V., (2009b). The smart way to display. Full report: exploring consumer preferences for
home energy display functionality. A report for the Energy Saving Trust by the Centre for Sustainable Energy. London, Energy Saving Trust.
Baldassare, M., Katz, C. (1992). The personal threat of environmental problems as predictor of environmental practices, Environment and Behavior, 24(5), 602-616
Barr, S. (2007). Factors influencing environmental attitudes and behaviors: a UK case study of household waste management, Environment and Behavior, 39(4), 435-473
Becker L. J., Seligman C., Fazio R. H., Darley J. M. (1981). Relating attitudes to residential energy use. Environment and Behavior, 13(5), 590-609
Benders, R. M. T., Kok, R., Moll, H. C., Wiersma, G., & Noorman, K. J. (2006). New approaches for household energy conservation e in search of personal household energy budgets and energy reduction options. Energy Policy, 34(18), 3612-3622.
Bittle, R. G., Valesano, R., Thaler, G. (1979). The effects of daily cost feedback on residential electricity consumption. Behavior Modification, 3(2), 187–202.
Brandon, G., Lewis, A. (1999). Reducing household energy consumption: a qualitative and quantitative field study. Journal of Environmental Psychology, 19, 75–85.
Brechling, V., Smith, S. (1994). Household energy efficiency in the UK. Fiscal Studies 15, 44–56. Carrico, A., and Riemer, M. (2011). Motivating energy conservation in the workplace: An evaluation of the use of
group-level feedback and peer education, Journal of Environmental Psychology 31, 1-13 Chua, K. J. and Chou, S. K. (2010). Energy performance of residential buildings in Singapore. Energy, 35(2),
667-678. Coltrane S., Archer D., Aronson E. (1986). The social-psychological foundations of successful energy
conservation program, Energy Policy, 131-148 Crossley, D. (1983). Identifying barriers to the success of consumer energy conservation policies, Energy, Vol. 8,
No. 7, 533-546 Darby, S. (2001). Making it obvious: designing feedback into energy consumption. In: Proceedings of the Second
International Conference on Energy Efficiency in Household Appliances and Lighting. Italian Association of Energy Economists/EC-SAVE Programme.
Darby, S. (2006). The Effectiveness of Feedback on Energy Consumption: A Review for Defra of the Literature on Metering, Billing and Direct Displays. Environmental Change Institute, University of Oxford.
Lessons from Eco-living Program
23
De Young, R. (2000). Expanding and evaluating motives for environmentally responsible behavior, Journal of Social Issues, 56(3), 509-526
Dunlap, R.E., Liere, K.D.V., Mertig, A.G., Jones, R.E. (2000). Measuring endorsement of the new ecological paradigm: a revised NEP scale, Journal of Social Issues, 56(5), 425-442
EPRI (2009). Residential electricity use feedback: A research synthesis and economic framework. Palo Alto, CA. Gardner, G. T., Stern, P. C. (2002). Environmental Problems and Human Behavior. Boston, Pearson. Gatersleben, B., Steg, L. and Vlek, C. (2002). Measurement and Determinants of Environmentally Significant
Consumer Behavior. Environment and Behavior, 34(3), 335-362. Geller, E. S. (1981).Evaluating energy conservation programs: is verbal report enough? Journal of Consumer
Research, 8, 331–335. Gilg, A., Barr, S. (2005). Encouraging “environmental action” by exhortation: evidence from a Hargreaves, T., Nye, M., Burgess, J. (2010). Making energy visible: A qualitative field study of how householders
interact with feedback from smart energy monitors, Energy Policy 38, 6111–6119 Hayes, S. C., Cone, J. D. (1981). Reduction of residential consumption of electricity through simple monthly
feedback. Journal of Applied Behavior Analysis, 14, 81–88. Hirst, E., Goeltz, R. (1982). Residential energy conservation actions: analysis of disaggregated data. Energy
Systems and Policy, 6, 135–150. Hopper, J.R., Nielson, J.M. (1991). Recycling as altruistic behavior: normative and behavioral strategies to explain
participation in a community recycling program, Environment and Behavior, 23(2), 195-220. Kollmuss, A., and Agyeman, J. (2002). Mind the gap: Why do people act environmentally and what are the
barriers to pro-environmental behaviour?, Environmental Education Research, 8 (3): 239-260. McClelland, L., Cook, S. W. (1980). Promoting energy conservation in master-metered apartments through
group financial incentives. Journal of Applied Psychology, 10(1), 20–31. McDougal, G., Claxton, J., Ritchie, J., Anderson, D. (1981). Consumer energy research: a review. Journal of
Consumer Research 8 (2), 343–354. McKenzie-Mohr, D. (2000). New ways to promote pro-environmental behavior: an introduction to community-
based social marketing, Journal of Social Issues. 56: 543-554 Midden, C. J. H., Meter, J. E., Weenig, M. H., Zieverink, H. J. A. (1983). Using feedback, reinforcement and
information to reduce energy consumption in households: A field- experiment. Journal of Economic Psychology, 3(1), 65–86.
Ministry of Trade and Industry (2007). Energy for growth: national energy policy report. Singapore: Ministry of Trade and Industry.
Mountain, D (2006). The impact of real-time feedback on residential electricity consumption: the Hydro One pilot.
Ontario, Mountain Economic Consulting and Associates Inc.
OECD (2001). Environmental Outlook. Organization for Economic Cooperation and Development, Paris.
OFGEM (2009). Energy demand research project: review of progress for period, September 2008–March 2009
(Ref:115/09). OFGEM, London.
Olsen, M., Cluett, C. (1979). Evaluation of the Seattle City Light neighborhood energy conservation program,
Batelle Human Affairs Research Centers, Seattle, WA.
Petersen, J. E., Shunturov, V., Janda, K., Platt, G., and Weinberger, K. (2007). Dormitory residents reduce
electricity consumption when exposed to real-time visual feedback and incentives. International Journal of
Sustainability, 8, 16-33
Poortinga, W., Steg, L., Vlek C. (2004). Values, environmental concern and environmental behavior: a study into
household energy use, Environment and Behavior, 36(1), 70-93
Riemer, M., and Bickman, L. (2010). Using program theory to link social psychology and program evaluation. In
M. M. Mark, S. I. Donaldson, & B. Campbell (Eds.), Social psychology and program/policy evaluation.
New York: Guilford.
Rokreach, M. (1973). The nature of human values. New York: Free Press.
Schahn, J., Holzer, E. (1990). Studies of environmental concern: the role of knowledge, gender and background
variables, Environment and Behavior, 22(5), 767-786
Schipper, L., Hawk, D. (1991). More efficient household electricity use. Energy Policy 19 (3), 244–265.
Schultz, P. W., Nolan, J. M., Cialdini, R. B., Goldstein, N. J., & Griskevicius, V. (2007). The constructive,
destructive and reconstructive power of social norms, Psychological Science, 18(5), 429-434.
Scott, S. (1997). Household energy efficiency in Ireland: a replication study of owner of energy saving items.
Energy Economics 19 (2), 187–208.
Sorensen, J. (1985). Information and energy-conserving behavior, in Collins N., ed., Past Efforts and Future
Directions for Evaluating State Energy Conservation Programs (ORNL-6113), Oak Ridge National
Laboratory for the US Department of Energy, Oak Ridge, TN, USA.
24 He & Kua
Proceedings: Global Research Forum on Sustainable Consumption and Production
Workshop, June 13-15, 2012, Rio de Janiero, Brazil.
Staats, H. J., Wit, A. P., Midden, C. Y. H. (1996). Communicating the greenhouse effect to the public: Evaluation
of a mass media campaign from a social dilemma perspective. Journal of Environmental Management, 45,
189–203.
Steg, L. (2008). Promoting household energy conservation, Energy Policy, 36, 4449-4453
Stern, P.C., Dietz, T., Kalof, L., Guagnano, G. A. (1995). Values, beliefs and pro-environmental action: attitude
formation toward emergent objects, Journal of Applied Social Psychology, 25 (18), 1611-1636.
Stern, P. C. (2000). Toward a coherent theory of environmentally significant behavior, Journal of Social Issues,
56(3), 407-424
Tucker, P., Speirs, D. (2003). Attitudes and behavioral change in household waste management behaviors, Journal
of Environmental Planning and Management, 46(2), 289-307
Van Houwelingen, J. H., Van Raaij, F. W. (1989). The effect of goal-setting and daily electronic feedback on in-
home energy use. Journal of Consumer Research, 16, 98–105.
Warriner, G. K., McDougall, G. H., Claxton, J. D. (1984). Any data or none at all? Living with inaccuracies in
self-reports of residential energy consumption. Environment and Behavior, 16, 503–526.
Wijarso (1983). Energy conservation measures in Indonesia, Energy, Vol. 8., No. 1, 93-96.

25 Proceedings: Global Research Forum on Sustainable Consumption and Production
Workshop, June 13-15, 2012, Rio de Janiero, Brazil.
ANNEX 1: QUESTIONNAIRE 1
Part A. Basic information
House Type(delete accordingly): 1 room flat / 2 room flat / 3 room flat / 4 room flat / 5
room flat / Executive Apartment / Executive Maisonette
Floor area: ____________m2
1. Ages and genders of all family members: ______________________________
E.g. if there are 3 people in a house of age and gender as follow: 33 year-old, male;
33 year-old, female; and 5 year-old, male. Fill in as “33(M), 33(F), 5(M)”.
2. Monthly income of the whole family: (Make a choice.)
A. 0-1999
B. 2000-3999
C. 4000-5999
D. 6000-7999
E. 8000-9999
F. 10000-11999
G. 12000-13999
H. 14000-15999
I. 16000-17999
J. above 18000
Notes: If the resident is reluctant to tell about it, let him know that we are only asking for
a range and we will keep the information confidential. The information is for research
only.
3. Education level of the householder:
A. Pre-School Education B. Primary School C. Secondary School
D. Junior College E. Polytechnics F. Institute of Technical Education
G. Bachelor H. Postgraduate
4. Education level of the person who is at home most often: (Make a choice from
below.)
A. Pre-School Education B. Primary School C. Secondary School
D. Junior College E. Polytechnics F. Institute of Technical Education
G. Bachelor H. Postgraduate
5. Highest education level in the family: (Make a choice from below.)
26 He & Kua
Proceedings: Global Research Forum on Sustainable Consumption and Production
Workshop, June 13-15, 2012, Rio de Janiero, Brazil.
A. Pre-School Education B. Primary School C. Secondary School
D. Junior College E. Polytechnics F. Institute of Technical Education
G. Bachelor H. Postgraduate
6. Ethnics:
A. Chinese B. Malay C. Indian D. Others:
Part B.
Behavior 1
Never
2
Rarely
3
Sometimes
4
Usually
5
Always
Air-Conditioner
a. Possession: Yes/No. If yes, number?:
1. Use fans rather than air-conditioners.
2. When using air-cons, use fans and raise the temperature at the same time to save energy.
3. Set the thermostat above 25oC.
4. Use automatic time switch when possible.
5. Regularly check the air-cons and clean air filter timely. Never even less
once/4 years
once/3 years
>once/ 2 years
6. Keep windows and doors closed when the air-con is on.
Refrigerator
b. Possession: Yes/No Number:
7. Refrigerator placed away from a heat source. (e.g. direct sunlight, cookers, oven)
Very close, several heat sources
/ Close but with insulation
/ Away
8. Allow some space all around the fridge. No / Small space
/ Enough space
9. A not too crowded refrigerator. No space
/ Little space
/ Enough space
10. Cool down hot food before storing in fridge.
11. Cover liquids stored in the refrigerator.
Water Heater

Lessons from Eco-living Program
27
c. Possession: Yes/No
12. Heat enough water without too much unused. (For an instantaneous one, switch it on before shower and turn off after use. For a storage type, switch it on about 20 minutes before shower, and turn it off after use. )
Lighting
13. Make full use of daylight during the daytime.
14. Turn lights off when nobody is in.
15. Use task lighting for activities requiring small amount of focus light. (e.g. reading lamps).
Home Electronics
16. Turn off home appliances instead of leaving on standby.
17. Switch top boxes, modems off when not in use. (e.g. overnight)
18. Allow computer to be on hibernation mode after 10- 15 min. Switch off the computer completely when not in use for more than 30 minutes.
19. Unplug chargers after use.
Electric Air-Pot
d. Possession: Yes/No
20. Turn it on only necessary. Turn it off if not in use overnight.
Clothes Dryer
e. Possession: Yes/No
21. Dry laundry under natural sunlight whenever possible.

29 Proceedings: Sustainable Consumption and Production: Opportunities and Threats, 23-25
November 2006, Wuppertal, Germany. Launch conference of the Sustainable Consumption
Research Exchange (SCORE!) Network, supported by the EU’s 6th Framework Programme.
ANNEX 2: QUESTIONNAIRE 2
Rate the importance of the following aspects to your family: 1 =Unimportant, 2 =Slightly important, 3 =Important, 4 =Very important, 5 =Critical
Description 1 2 3 4 5
1 Being able to enjoy the beauty of nature and culture.
Unimportant Slightly important
Important Very important
Critical
2 Having challenges and experiencing pleasant and exciting things.
Unimportant Slightly important
Important Very important
Critical
3 Having a varied life, experiencing many things as possible.
Unimportant Slightly important
Important Very important
Critical
4 Having a comfortable and easy daily life.
Unimportant Slightly important
Important Very important
Critical
5 Having the chance to get a good education and to gain general knowledge.
Unimportant Slightly important
Important Very important
Critical
6 Having access to clean air, water and soil. Having and maintaining a good environmental quality.
Unimportant Slightly important
Important Very important
Critical
7 Freedom and control over the course of one's life, to be able to decide for yourself, what you do, when and how.
Unimportant Slightly important
Important Very important
Critical
8 Being in good health, access to adequate health care.
Unimportant Slightly important
Important Very important
Critical
9 Having sufficient self-respect and being able to develop one's own identity.
Unimportant Slightly important
Important Very important
Critical
10 Having enough time after work and household work and being able to spend this time satisfactorily.
Unimportant Slightly important
Important Very important
Critical
11 Having nice possessions in and around the house.
Unimportant Slightly important
Important Very important
Critical
12 Having enough money to buy and to do the thing necessary and pleasing.
Unimportant Slightly important
Important Very important
Critical
13 To enjoy natural landscapes, parks and forests. Assurance of the continued existence of plants and animals and maintaining biodiversity.
Unimportant Slightly important
Important Very important
Critical
14 Having an intimate relation, a stable family life and good family relationships.
Unimportant Slightly important
Important Very important
Critical

30 He H. Z and Kua H. W.
15 Having opportunities to be yourself, do your own things, a place of your own.
Unimportant Slightly important
Important Very important
Critical
16 Being safe at home and in the streets. Being able to avoid accidents and being protected against criminality.
Unimportant Slightly important
Important Very important
Critical
17 Feeling attended to and cared for by others.
Unimportant Slightly important
Important Very important
Critical
18 Having equal chances and rights as others, being treated righteously.。
Unimportant Slightly important
Important Very important
Critical
19 Having good relationships with friends, colleagues, neighbors.
Unimportant Slightly important
Important Very important
Critical
20 Being able to live a life with an emphasis on spirituality and/or with your own religious persuasion.
Unimportant Slightly important
Important Very important
Critical
21 Being appreciated and respected by others.
Unimportant Slightly important
Important Very important
Critical
22 Having or being able to find a job and being able to fulfill it as pleasantly as possible.
Unimportant Slightly important
Important Very important
Critical
Lessons from Eco-living Program 31
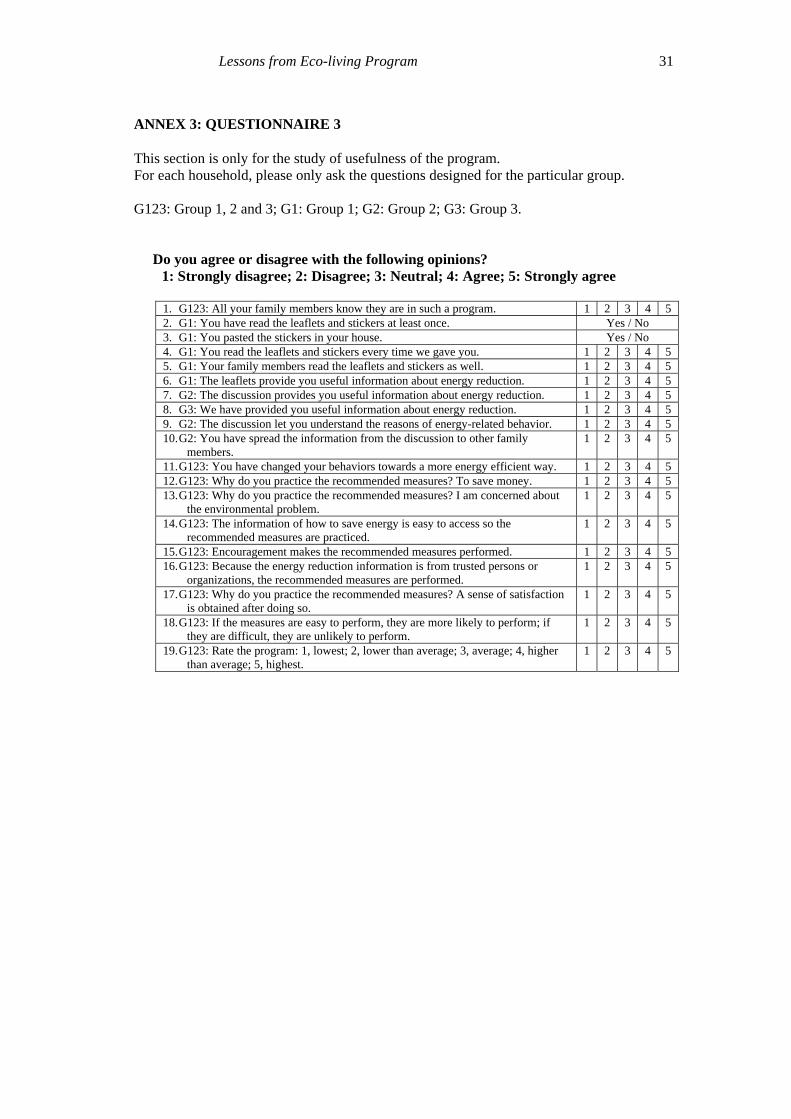
ANNEX 3: QUESTIONNAIRE 3
This section is only for the study of usefulness of the program. For each household, please only ask the questions designed for the particular group. G123: Group 1, 2 and 3; G1: Group 1; G2: Group 2; G3: Group 3.
Do you agree or disagree with the following opinions? 1: Strongly disagree; 2: Disagree; 3: Neutral; 4: Agree; 5: Strongly agree 1. G123: All your family members know they are in such a program. 1 2 3 4 5 2. G1: You have read the leaflets and stickers at least once. Yes / No 3. G1: You pasted the stickers in your house. Yes / No 4. G1: You read the leaflets and stickers every time we gave you. 1 2 3 4 5 5. G1: Your family members read the leaflets and stickers as well. 1 2 3 4 5 6. G1: The leaflets provide you useful information about energy reduction. 1 2 3 4 5 7. G2: The discussion provides you useful information about energy reduction. 1 2 3 4 5 8. G3: We have provided you useful information about energy reduction. 1 2 3 4 5 9. G2: The discussion let you understand the reasons of energy-related behavior. 1 2 3 4 5 10. G2: You have spread the information from the discussion to other family
members. 1 2 3 4 5
11. G123: You have changed your behaviors towards a more energy efficient way. 1 2 3 4 5 12. G123: Why do you practice the recommended measures? To save money. 1 2 3 4 5 13. G123: Why do you practice the recommended measures? I am concerned about
the environmental problem. 1 2 3 4 5
14. G123: The information of how to save energy is easy to access so the recommended measures are practiced.
1 2 3 4 5
15. G123: Encouragement makes the recommended measures performed. 1 2 3 4 5 16. G123: Because the energy reduction information is from trusted persons or
organizations, the recommended measures are performed. 1 2 3 4 5
17. G123: Why do you practice the recommended measures? A sense of satisfaction is obtained after doing so.
1 2 3 4 5
18. G123: If the measures are easy to perform, they are more likely to perform; if they are difficult, they are unlikely to perform.
1 2 3 4 5
19. G123: Rate the program: 1, lowest; 2, lower than average; 3, average; 4, higher than average; 5, highest.
1 2 3 4 5
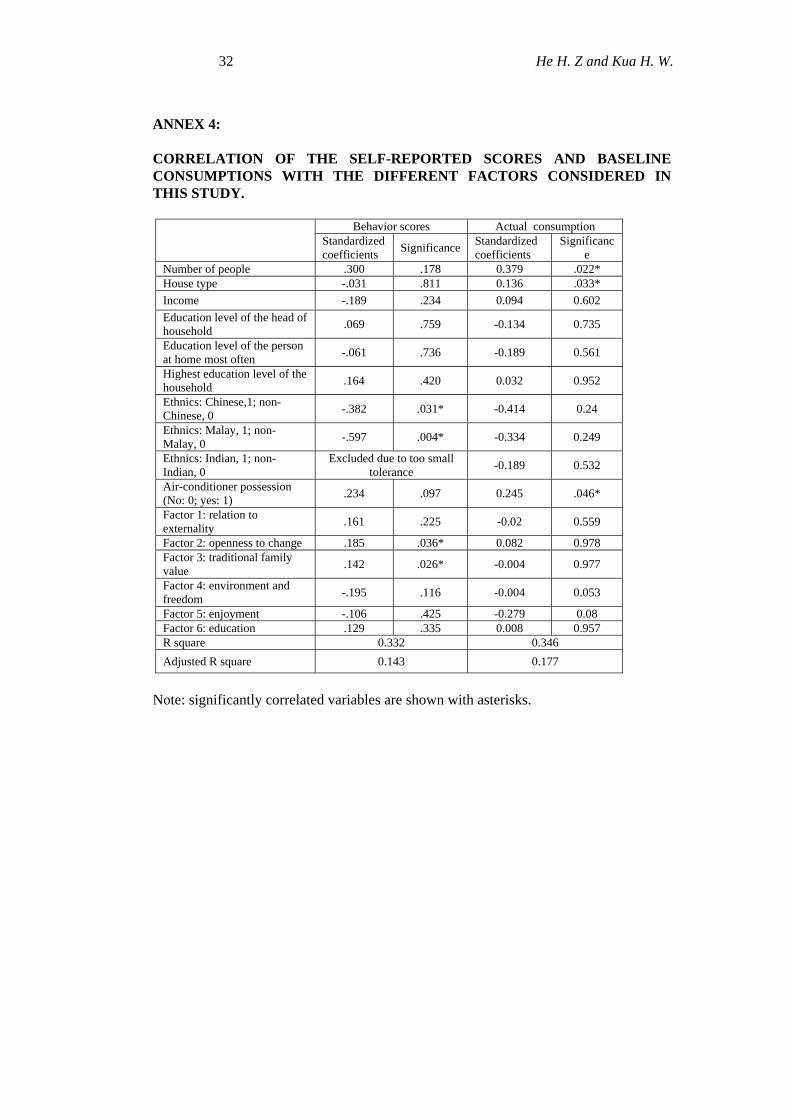
32 He H. Z and Kua H. W.
ANNEX 4:
CORRELATION OF THE SELF-REPORTED SCORES AND BASELINE CONSUMPTIONS WITH THE DIFFERENT FACTORS CONSIDERED IN THIS STUDY.
Behavior scores Actual consumption
Standardized coefficients
Significance Standardized coefficients
Significance
Number of people .300 .178 0.379 .022* House type -.031 .811 0.136 .033*
Income -.189 .234 0.094 0.602
Education level of the head of household
.069 .759 -0.134 0.735
Education level of the person at home most often
-.061 .736 -0.189 0.561
Highest education level of the household
.164 .420 0.032 0.952
Ethnics: Chinese,1; non-Chinese, 0
-.382 .031* -0.414 0.24
Ethnics: Malay, 1; non-Malay, 0
-.597 .004* -0.334 0.249
Ethnics: Indian, 1; non-Indian, 0
Excluded due to too small tolerance
-0.189 0.532
Air-conditioner possession (No: 0; yes: 1)
.234 .097 0.245 .046*
Factor 1: relation to externality
.161 .225 -0.02 0.559
Factor 2: openness to change .185 .036* 0.082 0.978 Factor 3: traditional family value
.142 .026* -0.004 0.977
Factor 4: environment and freedom
-.195 .116 -0.004 0.053
Factor 5: enjoyment -.106 .425 -0.279 0.08 Factor 6: education .129 .335 0.008 0.957 R square 0.332 0.346
Adjusted R square 0.143 0.177
Note: significantly correlated variables are shown with asterisks.

Lessons from Eco-living Program 33
ANNEX 5
R square=0.683, adjusted R square=0.332 Note: variables that are significantly correlated with energy reductions are shown with asterisks.
Standardized coefficients
Significance
Number of people .262 .277
House type .605 .003*
Income .035 .872
Education level of the head of household -.393 .236
Education level of the person who is most oftenly at home .293 .221
Highest education level of the household -.083 .819
Ethnics: Chinese,1; non-Chinese, 0 -1.008 .081
Ethnics: Malay, 1; non-Malay, 0 -.737 .121
Ethnics: Indian, 1; non-Indian, 0 -.241 .615
Air-conditioner possession (No: 0; yes: 1) -.008 .964
Factor 1: relation to externality -.015 .933
Factor 2: openness to change .015 .939
Factor 3: traditional family value .191 .392
Factor 4: environment and freedom .291 .183
Factor 5: enjoyment .266 .188
Factor 6: education .171 .376
Group 1: if yes, 1; else, 0 Excluded due to too small tolerance
Group 2: if yes, 1; else, 0 -.241 .176
Group 3: if yes, 1; else, 0 -.550 .007*
Energy consumption before intervention -.058 .770
Behavior score before intervention -.172 .371
Change of behavior score -.376 .085