Embed Size (px)
Citation preview
i | P a g e : D R A F T I D P 2 0 1 7 - 2 0 2 2
Year: 2017-2022
Integrated Development Plan
Gamagara Local Municipality

ii | P a g e : D R A F T I D P 2 0 1 7 - 2 0 2 2
Table of Contents
Foreword by the Mayor ......................................................................................................... v
Foreword by the Municipal Manager ................................................................................ v ii
Executive summary ................................................................................................................ ix
Acronyms .................................................................................................................................xii
Chapter 1.................................................................................................................................. 1
1. Legislative Framework…….…………………………………………………………………….1
1.1 Introduction ........................................................................................................................ 1
1.2. Legislative Frameworks..……………………………………………………………………...1
1.2.1 Constitution of Republic Of South Africa (1996) ........................................................ 1
1.2.2 White Paper on Local Government (1998) ................................................................. 2
1.2.3 Municipal Systems Act ................................................................................................... 2
1.2.4. National Development Plan..……………………………………………………………..2
1.2.5 National Outcomes…………………………………………………………...…………….3
1.2.6 Provincial Spatial Development plan…………………………………………………...3
1.2.7 Gamagara Spatial Development Framework…………………………………………3
1.3. Process Followed .............................................................................................................. 4
1.3.1. IDP Process Plan…………………………………………………..………………………….5
1.3.2. Public Participation………………………………………………………………………….6
1.3.2.1. Table of Public Participation…………………..………………………………………7
1.4. Community Needs indicated...………..……………………………………………………7
1.5. Powers and function of the municipality .................................................................... 11
Chapter 2: Situational Analysis ........................................................................................... 11
2. Introduction ........................................................................................................................ 11
2.1 Geographical Location .................................................................................................. 11
2.2 Spatial rational ................................................................................................................. 13
2.2.1 Spatial Efficiency……………………………………………………………………………14
2.3 Env ironment................................................................................................................. 15
2.3.1 Climate ................................................................................................................. 15
2.3.2 Topography and geology.................................................................................. 17
2.3.3 Water sources ...................................................................................................... 17
2.3.4 Biodiversity ............................................................................................................ 17
iii | P a g e : D R A F T I D P 2 0 1 7 - 2 0 2 2
2.3.5 Heritage and assets ............................................................................................ 18
2.3.6 Env ironmental threats ......................................................................................... 19
2.4 Demographic profile of the municipality ................................................................ 19
2.4.1 Population Distribution ........................................................................................ 20
2.4.2 Age Distribution ................................................................................................... 20
2.5 Basic services............................................................................................................... 21
2.5.1 Housing ................................................................................................................. 22
2.6 Municipal institutional development and transformation .................................... 24
2.6.1 Municipal management and operational systems........................................ 24
2.6.1.1 Political composition ....................................................................................... 24
2.6.1.2 Administration .................................................................................................. 24
2.6.1.3 Complaints management systems ............................................................... 30
2.6.1.4 Fraud prevention plan .................................................................................... 30
2.6.1.5 Stakeholders mobilisation ............................................................................... 30
2.6.2 Institutional development and transformation ............................................... 30
2.6.2.1 Human Capital ................................................................................................ 30
2.6.2.2 Skills development ........................................................................................... 31
2.6.2.3 Performance Management System ............................................................. 32
2.6.2.4 Information technology .................................................................................. 32
2.6.2.5 Human resources policies............................................................................... 32
2.7 Local economic development ................................................................................ 34
2.7.1 Socio-economic indicators ................................................................................ 34
2.7.1.1 Official employment status ............................................................................ 34
2.7.1.2 Education levels............................................................................................... 35
2.7.1.3 Income levels ................................................................................................... 36
2.7.2 Economic indicators ........................................................................................... 37
2.7.2.1 Sectors ............................................................................................................... 38
2.7.2.2 Tourism and SMMEs ......................................................................................... 38
2.7.2.3 Job creation initiatives ................................................................................... 39
2.7.2.4 LED Friendly ...................................................................................................... 39
2.8 Financial Plan………………………………………………………………………………..…39
2.8.1 Municipal financial viability ....................................................................................... 39

iv | P a g e : D R A F T I D P 2 0 1 7 - 2 0 2 2
2.8.1.1 Auditor General’s finding ................................................................................... 40
2.8.2 Financial management system ......................................................................... 40
2.8.3 Operating Revenue Framework ....................................................................... 41
2.8.4 Operating Expenditure Framework .................................................................. 41
2.8.5 Capital expenditure............................................................................................ 44
2.9 Good governance and public participation ......................................................... 44
2.9.1 Democratic governance ................................................................................... 44
2.9.2 Communication .................................................................................................. 44
2.9.3 Governance structure ........................................................................................ 44
Chapter 3................................................................................................................................ 45
3.1. Political Environment ...................................................................................................... 45
3.2. Economic Environment.................................................................................................. 47
3.3. Local Situation………………………………………………………………………………...48
3.4. Social Env ironment…………………………………………………………………………..49
3.5. Technology and Environment……………………………………………………………..49
4. Risk Analysis……………………………………………………………………………………50
5. Swot Analysis………………………………………………………………………………….54
6. Vision……………………………………………………………………………………………55
7. Mission…………………………………………………………………………………………..55
8. Values…………………………………………………………………………………………..56
9. Strategic Goals………………………………………………………………………………..56
10. Strategic Implementation Plan…………………………………………………………….74
11. Back to Basics…………………………………………………………………………………76
Chapter 4................................................................................................................................ 77
Integration - Sector Plans...................................................................................................... 77
Chapter 5................................................................................................................................ 80
Projects list............................................................................................................................... 80
I ssue 1: Basic Infrastructure Development……………...…………………………………….80
I ssue 2: Water and Sanitation……..…………………………………………………………….87
I ssue 3: Roads and Streets.……………………………………………………………………….93
Issue 4: Housing and Landuse Management………….…………………………………….96
I ssue 6: Local Economic Development……………………………………………………….98

v | P a g e : D R A F T I D P 2 0 1 7 - 2 0 2 2
I ssue 7: Youth Development and Special Programmes..………………………………….99
Issue 8: Env ironmental Management and Cleansing..…………………………………...100
SDBIP(To be completed)

vi | P a g e : D R A F T I D P 2 0 1 7 - 2 0 2 2
FOREWORD BY THE MAYOR:
MAYOR OF GAMAGARA LOCAL MUNICIPALITY
COUNCILLOR: DINEO MOYO
The prev ious cycle of the IDP ended on an unprecedented tone of economic
depression. 2015/16 was a turbulent year for Gamagara Local Municipality as it was
for the first time that the municipality had to adjust its budget 48% downward. The
prolonged valuation dispute took its toll on our development, which ended with a
loss of the case to Kumba resulted in our budget be cut by almost R350 million. It was
a very challenging term again in that it was an election brought more diversity into
the municipal leadership.
The Municipality experience a loss when Councillor J. Johnson passed on and
Councillor Johannes Kaars resigned from Council. This meant introduction of new
Councillors when the financial year was on the brink of ending. These, however, made
us strong as team and it strengthened the spirit of community development and
improved service delivery.
This is ev idenced by the municipal response to the unexpected rapid growth by
starting and completing the following projects planning for the upgrade of bulk
electricity in Kathu, Olifantshoek and Dibeng, phase 2 and 3 of the sewerage network
in Dibeng, two parks were upgraded, completion of the 70 RDP houses in Mapoteng
amongst others.
The Dingleton Resettlement process progressed well and only few households were
not relocated to the new area called Siyathemba in Kathu. Some of the few
households refused to be relocated as they want their dispute with Kumba to be
resolved before they can move out of Dingleton. The process encouraged the
municipality to transfer the exchange houses that belonged to the Municipality to the
people who have rented these houses for extended period of time. The project is at
the point of issuing people with title deeds. This demonstrated commitment of the
municipality to promoting and implementing better life for all.

vii | P a g e : D R A F T I D P 2 0 1 7 - 2 0 2 2
We managed to deliver the basic serv ices to the people as required and also
implemented most of the infrastructure projects through the assistance of our social
partners as well as the mines. On behalf of the Council I also wish to applaud all ward
committee members for the commitment they’ve shown and outstanding
performance throughout despite the challenges in the community.
In conclusion we want to also appreciate the work done by the Gamagara
administration, led by the Municipal Manager. We urge you to continue working
tirelessly to make Gamagara a better place for all its residents and potential investors.
There is a lot that still need to be done, the war on poverty, unemployment, inequality,
and underdevelopment is still far, and it has begun in earnest. We dare not give up
until the finish line.
KEY POLICY DEVELOPMENTS FOR THE CURRENT IDP CYCLE:
In v iew of the challenges preceding cycle, a turnaround approach to development
is required. I t is required of the municipality to take advantage of the national
development trajectory and leverage on national government economic
development agenda. The municipality should embark on industrialisation of the
municipality through government programmes like Mining Towns Regeneration, Small
Town Regeneration, Strategic Industrial Plans, Industrial Policy Action Plan,
Manufacturing Development Act, Industrial Development Zone and the National
Industrial Policy Framework.
The municipality should express itself explicitly on how it is going to leverage on these
programmes in order to leave the mine dependency shackles. In its endeavour to
develop, our development systems should not leave behind skills development, local
SMME development and promotion of local economies. Our involvement in the
education sector has been of just a supporting role even though the EFT College has
being producing qualifications that were not supporting the economic development
in the municipality, this IDP cycle should see serious interventions through discussions
with various stakeholders so to ensure synergy between the education sector and the
markets.
Spatial settings in our municipality is displeasing as it is still perpetuating the apartheid
set-up, i.e. prev iously disadvantaged areas are planned as RDP areas where
amenities are not aligned to facilitate integration. Moving forward spatial impressions
should integrate our communities and create equal access to economic activ ities.
Our LED should move away from project based initiatives rather create conducive
environment for economy to strive. LED should filter in all the development projects of
the municipality and Supply Chain Management should be a key stakeholder to
economic transformation.

viii | P a g e : D R A F T I D P 2 0 1 7 - 2 0 2 2
Back to basics formed cornerstone of our serv ice delivery. This meant Batho Pele
became the fundamental principle to service delivery. Customer Care and
improvement on turn- around time to customer queries and improved maintenance
planning. These included provision of basic service, water, waste water management,
sanitation, establishment of customer care serv ice, replacement of broken
streetlights, management of solid waste, etc.
On the other front the municipality tried to improve provision of serv ices and had to
focus on maintenance of the existing infrastructure. This will assist to increase interest
of investors as the establishment of the Kathu Industrial Park and the development of
the 1600 mixed human settlement development which included 300 houses for
Transnet was kick-started. The growth of the town necessitates partnerships to ensure
we deliver on our mandate and thus a shift to engaging private partners is needed.
PUBLIC PARTICIPATION:
This has been a biggest challenge to our planning process, stakeholders are not
participating and do not attend meetings when called to meetings. New strategies
need to be developed to encourage sectoral participation in our planning process.
FUTURE DEVELOPMENTS:
Due to the expansion of mining activ ities in the Gamagara municipal jurisdiction, there
is a high need for basic and bulk infrastructure. Population grew despite the mines
retrenching workers, the increase was observed mostly on the informal settlement
areas as compared to the formal towns. This has led to a growth in backyard dwelling
thus putting a strain on the infrastructure which was not built to accommodate high
numbers.
This situation calls upon the municipality, prov incial and national government to plan
appropriately together to guard against any unintended consequences from this
growth. Key among the most pressing need is the upgrading of the existing
infrastructure, especially, sewerage system, water network, electrical capacity and
roads. The municipality applied to the Human Settlement Department for a
restructuring zone, which will aloe for mixed development and integration of society.
There is also a high need for affordable housing, rental stock and low cost housing.
Government has also launched the Sishen to Saldanah railway project (SIP 5- Strategic
Infrastructure Project 5) this project will also change the town of Kathu and Gamagara
Municipality in general forever. The Municipality’s Planning should thus take into
account this sudden growth.
The municipality need to fast-track the establishment of the Kathu Supplier Park. The
aim of this initiative is to diversify the economy of the area, so that the town can still

ix | P a g e : D R A F T I D P 2 0 1 7 - 2 0 2 2
be sustainable when mining downscales. These prospects of growth should be
harnessed for the benefit of all and should be used as tools for a modern human
settlement development. Considering that we need to increase our pace on the
building of human settlements, industrialisation of Gamagara should facilitate the
establishment of a clothing company in Olifantshoek, establishment of a brickmaking
factory in Kathu, window making, furniture making, tannery and recycling project in
Dibeng and establishment of a shopping centre and a warehouse in Mapoteng.
These are just a few that need to pursued to diversify our economy, decentralise
economic opportunities and take them to where people are.
Amidst of all these developments, improved service delivery is the core mandate from
me to all citizens of Gamagara.
__________________
CLLR D. P MOYO 30th MARCH 2017
MAYOR DATE

x | P a g e : D R A F T I D P 2 0 1 7 - 2 0 2 2
FOREWORD BY THE MUNICIPAL MANAGER:
MUNICIPAL MANAGER
MR T.C. ITUMELENG
The economic depression did not only affect the municipality by loss of revenue due
to retrenchment in the mining industry, the loss of the property valuation case against
Kumba did not only come as loss of the case but also as a loss of revenue. On the
other hand the municipality did not stop to grow faster statistically but also grew in
serv ice demand. Gamagara is still seen as a strategic mining town nationally and
internationally as it is at the centre of the biggest iron ore and manganese ore belt in
the country.
The municipality is not only growing into a mining mega-town but also as a solar
energy centre, this does not only pressure the municipality with infrastructure provision
but also attract people to come and settle around these developments. Considering
the impact of these projects on the state of environment and in the planning process
within available resources this is means a need for change of strategy going forward.
The 2016 Community Survey has revealed that despite the economic depression and
massive retrenchments at Sishen Mine and Khumani which was more than 4000
employees, population continue to grow by 28,4% from 2011 to 2016. According to
Statssa (2011) the unemployment rate was 17,7% and the dependency rate of 39 and
youth unemployment was 22,4%, female headed households was 27,7% and the
economic growth was at -1,13% this tells a story of a town that needs an unorthodox
planning which will have to capture this development and steer them. As these
industries grow, housing become a challenge over and above the job creation.
People migrating into town especially in Kathu are the youth, who constitute the
highest sector of unemployed. This poses a serious challenge of creating conducive
environment for youth development and employment, which calls for different
stakeholder to contribute.
Housing need is another challenge as migration progresses into town, sprawling of
informal settlement is imminent and inevitable. Housing is much more dependent on
availability of infrastructure and serv ices like water, sanitation and electricity.

xi | P a g e : D R A F T I D P 2 0 1 7 - 2 0 2 2
Considering that Gamagara is a water scarce area, planning for water is very huge
challenge because all the services bulk infrastructure is operating at full capacity and
do not for any further developments. Water sources are another challenges
especially for Dibeng which entirely dependent of borehole water. The borehole
water is a finite resource and depends on the recharge rate to provide constant water
supply and increased demand could lead to serious strain on these water resources.
The Vaal Gamagara water pipeline brings hope to a limited extend as it does not
reach Dibeng, which is the most water stressed area. Vaal Gamagara is part of the
Strategic Infrastructure Plan (SIP) 3& 5 and Industrial Policy Action Plan (IPAP) 2&3
projects.
In as far as electricity is a challenge, Gamagara host one of the biggest electricity
distribution network at Ferrum just outside Kathu. The entire Gamagara Development
Corridor is supplied from this network. The recently 400kV powerline that go across
Gamagara is a boost in electricity supply. The electricity is part of the SIP 3 & 5 and
IPAP 2 &3. Gamagara has an opportunity to take advantage of the national and
provincial development plans to turn around its developmental challenges. The
municipality is currently in the process of upgrading electricity bulk supply in Kathu
and Olifantshoek so as to unlock development in these areas.
In pursuing the municipal v ision: BUILDING PROSPEROUS AND SUSTAINABLE
COMMUNITIES and considering all these challenges mentioned above, it is still my
v ision to build a city of Gamagara by 2060 which will be preceded by upgrading of
Gamagara into an industrial and manufacturing city which does not only rely on
mining. By the end of 2030 Gamagara should have developed into an industrial town
and developing towards a manufacturing town. I t is in this 5 year IDP cycle that our
plans will move towards industrialisation of the municipality in line with the National
Development Plan 2030 which has identified different development vehicles like SIP’s,
IPAPs, National Industrial Policy Framework and the Industrial Development zones. The
turnaround of the municipal planning should leverage on this national plans in order
to break its development and mine dependency shackles.
In leveraging on these development instruments prov ided by national government,
the municipality will facilitate and fast-track the development of the Kathu Supplier
Park which is envisaged to trigger other subsidiary economic development around
the municipality, establish a clothes manufacturing factory in Olifantshoek which it is
envisaged that it will trigger a shopping mall and other developments around
Olifantshoek, establish a brick making factory in Kathu which will support the inherent
human settlement development and other infrastructure development in the area,
furniture factory, aluminium and window making factory, tannery, recycling project
in Dibeng and a warehouse in Mapoteng which will ignite development and job
creation in the Gamagara.
Still being driven by the municipal mantra: KHUMO E MO LEFATSHENG, development
of the Spatial Development Framework (SDF) will assist the municipality to drive the
municipal growth trajectory. This will assist to determine the direction of development

xii | P a g e : D R A F T I D P 2 0 1 7 - 2 0 2 2
spatially, direct land use and encourage stakeholders to be part of the development.
I t will facilitate spatial integration. This will supported by the 2030 infrastructure
development plan which will support the implementation of the SDF and the
Gamagara 2030 Development Plan which currently being developed.
In line with the municipal mission: TO PROVIDE UNIVERSAL, SUSTAINABLE SERVICES TO
THE COMMUNITY IN ORDER TO ATTAIN A SAFE AND HEALTHY ENVIRONMENT, AS WELL
AS SOCIO-ECONOMIC DEVELOPMENT BY EXPLOITING ECONOMIC BENEFITS AND
STRENGTHENING STAKEHOLDER RELATIONS, the municipality is on a journey to
enhance its revenue, through the assistance of Anglo American the municipality has
embarked on the revenue enhancement plan, where all the areas of loss were
identified and plans were designed to rectify them. This term of the IDP cycle,
implementation of such plans should be translated into action plans.
Considering the growth of the municipality, in terms of serv ice delivery, we shall review
the organogram to ensure that the municipality reach its mandate. The municipality
has put in place an employee bursary scheme over and above the Skills Development
Programme to upskill and develop careers for the employees. The municipality has a
well-functioning skills development programme which has produced Technicians and
other professionals.
This Integrated Development Plan will provide the integrated and systematic plan to
achieve all the plans stated above as it was informed by all relevant stakeholders and
communities through extensive consultation processes and fora.
This presents the municipal developmental plans for growth
_______________________________
T. C. ITUMELENG 30TH MARCH 2017
MUNICIPAL MANAGER DATE

xiii | P a g e : D R A F T I D P 2 0 1 7 - 2 0 2 2
EXECUTIVE SUMMARY
Gamagara Local Municipality forms part of the John Taolo Gaetsewe district
area. The municipality is part of the region now commonly referred to as the
Gamagara Mining Corridor which is experiencing a boom in mining activities.
The populat ion of Gamagara municipal area increased from 41 617 (2011) to
53 656 (2011). The populat ion grew by 28%. Two factors attributed to this
exponential increase is the increase in mining activities and the solar parks. The
populat ion has almost doubled in the last 10 years. This can be attributed to
the high numbers of people coming to the municipal area, in search for
employment or better living condit ions, due to the booming mining activities
and solar energy plants.
With the growth in mining activities, the town of Kathu and adjacent towns
have seen a growth in accommodation need. Due to the high demand, rental
prices have gone up leading to unaffordability and mushrooming of illegal
second dwellings (log homes in Kathu) and backyard shanties in these areas.
To address this problem, the municipality will need to have a strong building
inspectorate division and stringent law enforcement. There is also a need to
develop affordable rental houses both in Kathu and Sesheng.
Municipality experience two major challenges during the past financial year,
i.e. illegal land grab and two major contributors to the municipal budget in
terms of assessment rates, failed to pay according to the valuation roll. These
affected the implementation of the IDP to a certain extent. The illegal land
grab was unfortunate because the municipality had planned to install bulk
infrastructure for water and sewer in the illegally occupied land and that has
delayed the project. The area concerned was surveyed and may need re-
surveying. Two mining houses in the municipal area, did not object on the
valuation roll but they did not pay assessment rates as billed to them. That has
affected the municipal cash flow and thus the implementation of the budget
The above-mentioned scenario has led to a huge strain on the available
infrastructure. The Kathu Waste Water Treatment Works (KWWTW) has brought
relief to sewer challenges in both Kathu and Sesheng (KWWTW). In Dibeng the
upgrade of the sewer system is also at phase two and this will relief the
sewerage challenges. The building of Water Reservoir at Olifantshoek which is
mult i-year project will assist to alleviate the water problem. However, the
current electricity provisions are below the demand which will stall major
development unt il the electricity upgrade towards the end of 2017 as Eskom
promised. This will delay developments in the municipality.

xiv | P a g e : D R A F T I D P 2 0 1 7 - 2 0 2 2
The Kathu Village Mall and the Heritage Square Shopping Centre are amongst
the developments sett ing Gamagara and Kathu on the path to be the main
commercial centre on the district with all other towns st ill lagging behind in
terms of modern shopping facilit ies. As part of commercialising Kathu, the
Village Mall is extending to add more shopping outlets which will enhance the
town as commercial hub of the district. The development of the Kathu
Industrial Supplier Park is at the advance stage, this will Kathu as an Industrial
town according to the vision of Council. This set the pace for sound
development towards devloping Kathu a City.
Another factor to highlight is the refuse removal service which is proving to be
a challenge for the municipality. Waste removal from Kathu, Dingleton and
Dibeng is disposed of at the Dibeng landfill site (unlicensed landfill) which is
27km away from Kathu. This situation has led to this service being expensive to
deliver. Plans are however underway to establish a registered landfill site,
(Environmental consultants have been appointed). The preliminary feasibility
report recommends that Dibeng is the only suitable site for the provision of this
service and will provide relieve to the municipality as the service had become
expensive to deliver.
Last ly, emphasis should also be made of the need for a well-developed
Disaster Centre. The municipality experiences an increase in the number of
vehicles or t rucks transporting harmful materials and have no plans in place
should something go extremely wrong. Council has agreed to establish a
Disaster Management Centre a service provider be appointed to build
capacity (inst itutional and resource based) to ensure that Gamagara become
a world class city with all the necessary resources to deal with issues of disaster.
Despite all these challenges, the municipality prides itself in doing its utmost
best to deliver on its mandate. We believe that if all stakeholders (Provincial
government, Private sector, etc) can come together and join hands with the
municipality, the road to building the “City of Kathu” can be a smooth one.
The municipality has in line with chapter 4 of the MSA (2000), consulted the
communit ies and other stakeholders to determine their needs or priorit ies for
the 2014/15 financial year. The IDP will be advert ised in the local newspapers
for public comments. Subsequent to that, community meetings will be held in
every ward for community and other stakeholders to comment on the draft
budget and draft IDP for 2014/2015 financial year.
After the various engagements with the community, the following were
indicated as priorit ies for the 2014/15 financial year as in order of their priority:
xv | P a g e : D R A F T I D P 2 0 1 7 - 2 0 2 2
• Basic Service Delivery and Infrastructure Investment
• Financial Sustainability
• Good Governance & Public Part icipation
• Inst itutional Transformation
• Community Safety, Development & Sustainable Environment
• Economic Development

xvi | P a g e : D R A F T I D P 2 0 1 7 - 2 0 2 2
Acronyms
CDW COMMUNITY DEVELOPMENT WORKERS
COGHSTA CO-OPERATIVE GOVERNANCE, HUMAN SETTLEMENTS AND
TRADITIONAL AFFAIRS
DBSA DEVELOPMENT BANK OF SOUTH AFRICA
DGDS DISTRICT GROWTH AND DEVELOMENT STRATEGY
DORA DIVISION OF REVENUE ACT
DRDLR DEPARTMENT RURAL DEVELOPMENT AND LAND REFORM
EIA ENVIRON MENTAL IMPACT ASSESSMENT
EIMP ENVIRONMENTAL INTEGRATED MANAGEMENT PLAN
EPWP EXPANDED PUBLIC WORKS PROGRAMME
GLM GAMAGARA LOCAL MUNICIPALITY
IDP INTEGRATED DEVELOPMENT PLAN
INEP INTEGRATED NATIONAL ELECTRIFICATION PROGRAMME
ITP INTEGRATED TRANSPORT PLAN
JTGDM JOHN TAOLO GAETSEWE DISTRICT MUNICIPALITY
KPA KEY PERFORMANCE AREA
KPI KEY PERFORMANCE INDICATOR
LED LOCAL ECONOMIC DEVELOPMENT
MFMA MUNICIPAL FINANCE MANAGEMENT ACT
MIG MUNICIPAL INFRASTRUCTURE GRANT
MSA MUNICIPAL SYSTEMS ACT
MTEF MEDIUM TERM EXPENDITURE FRAMEWORK
NCPGDS NORTHERN CAPE GROWTH AND DEVELOPMENT STRATEGY
NC PSDF NORTHERN CAPE PROVINCIAL SPATIAL DEVELOPMENT FRAMEWORK
NDP NATIONAL DEVELOPMENT PLAN
NEMA NATIONAL ENVIRONMENTAL MANAGEMENT ACT
NGO’s NONE GOVERNMENTAL ORGANISATIONS
PMS PERFORMANCE MANAGEMENT SYSTEM
PMS PERFORMANCE MANAGEMENT SYSTEM
SDBIP SERVCIE DELIVERY BUDGET IMPLEMENTATION PLAN
SLP SOCIAL AND LABOUR PLAN
SMME SMALL MICRO AND MACRO ENTERPRISES

ii | P a g e : D R A F T I D P 2 0 1 7 - 2 0 2 2
WMP WASTE MANAGEMENT PLAN
SHRA SOCIAL HOUSING REGULATORY AUTHORITY
1 | P a g e : D R A F T I D P 2 0 1 7 - 2 0 2 2
Chapter 1
1.1 Introduction
The Constitution, 1996 (Act, no. 108 of 1996) conferred Gamagara Local Municipality
the executive and admmistrative powers. These powers include planning,
implementing and monitoring initiatives, programmes and projects to better the lives
of its inhibitants. The Constitution further requires Gamagara Locoal Municipality to be
developmental in nature, prov ide basic services to its inhabitants in a sustainable
manner and within its financial and human resources capabilities. I t further confers
the power to collect revenue so as to sustain the basic needs infrastructure. It is in that
light that, Municipal Systems Act, 2000(Act, no 32 of 2000) prescribe the manner in
which Gamagara Local Municipality should prov ide the basic serv ices. The Act
prescribe the planning process for prioritising services as be available resources. These
include participatory planning. The Act prov ides that Gamagara Local Municipality
should develop an Integrated Development Plan, to guide municipal operation for
the 5 year period.
Gamagara Local Municipality engaged communities and different stakeholders
interested in the development of Gamagara. Community consultations and
engagements were conducted in all the wards, IDP Steering Committee Meetings,
IDP Representative Forum Meetings, SLP deliberations with different mines were held
to map out the developmental agenda of Gamagara over the next 5 years and
beyond. A Strategic planning session was held and the following v ision was
determined “Building prosperous and sustainable communities”
1.2 Legislative framework
➢ Constitution of the Republic of South Africa (1996)
The Constitution, 1996 (Act, no. 108 of 1996) conferred Gamagara Local Municipality
the executive and admmistrative powers. These powers include planning,
implementing and monitoring initiatives, programmes and projects to better the lives
of its inhibitants. The Constitution further requires Gamagara Locoal Municipality to be
developmental in nature, prov ide basic services to its inhabitants in a sustainable
manner and within its financial and human resources capabilities. The Constitution
prescribes the object of Local Government as:
• To prov ide democratic and accountable government for local communities;
• To ensure the provision of services to communities in a sustainable manner;
• To promote social and economic development;
• To promote a safe and healthy environment; and
2 | P a g e : D R A F T I D P 2 0 1 7 - 2 0 2 2
• To encourage the involvement of communities and community organisations
in the matters of local government.
➢ White Paper on Local Government (1998)
The White Paper goes further to explain what a development local government would
be; it indicates that it would be a government that works with the communities to find
sustainable ways to meet the community’s needs as well as finding ways to improving
the quality of life of the residents; through meeting their social and economic needs.
“Developmental local government requires that Municipalities become more
strategic, v isionary and ultimately influential in the way they operate”(White Paper,
1998: 52). That a developmental government would be concerned about where
people live, if they have access to serv ices and economic opportunities, access to
social and recreational facilities.
➢ Municipal Systems Act (2000)
The MSA (2000) indicate that the Municipality must undertake developmentally-
oriented planning, so as to give effect to the provisions of section 152 of the
Constitution. Chapter 5 further spells out, the process to be followed when compiling
an IDP as well as core components of the IDP; so as to ensure that the IDP is the
principal strategic document of the Municipality.
The MSA further highlights the need to engage communities on matters related to
local government. During the public participation process the community have been
engaged on what they their needs are and what they want the Municipality to do.
➢ National Development Plan (2030)
The main aims of the NDP is to eliminate poverty and reduce inequality by 2030. This
can be achieved through the role played by various stakeholders, enhancing the
capacity of the state and responsive leadership.
The 2011 Diagnostic Overview Report alluded to the following challenges:
1. Too few people work
2. The quality of school education for black people is poor
3. Infrastructure is poorly located, inadequate and under-maintained
4. Spatial div ides hobble inclusive development
5. The economy is unsustainably resource intensive
6. The public health system cannot meet demand or sustain quality

3 | P a g e : D R A F T I D P 2 0 1 7 - 2 0 2 2
7. Public serv ices are uneven and often of poor quality
8. Corruption levels are high
9. South Africa remains a div ided society.
➢ National Government Outcomes
The outcomes for 2014 to 2019 is published as annexures to the Medium Term Strategic
Framework, the outcomes are indicated below:
Outcome 1: Improve the quality of basic education
Outcome 2: Improve health and life expectancy
Outcome 3: All people in South Africa protected and feel safe
Outcome 4: Decent employment through inclusive growth.
Outcome 5: A skilled and capable workforce to support inclusive growth
Outcome 6: An efficient, competitive and responsive economic infrastructure
network.
Outcome 7: Vibrant, equitable and sustainable rural communities and food security.
Outcome 8: Sustainable human settlements and improved quality of household life.
Outcome 9: A responsive and accountable, effective and efficient local government
system.
Outcome 10: Protection and enhancement of environmental assets and natural
resources.
Outcome 11: A better South Africa and safer Africa and world.
Outcome 12: A developmental-oriented public service and inclusive citizenship.
➢ Provincial Spatial Development Framework
The PSDF allude to the mining development corridor, which stretches from John Taolo
Gaetsewe DM to ZF Mgcawu DM. The mining corridor has resulted in a lot of inward
migration and pressure on the various municipality to prov ide bulk services,
necessitating an increase in bulk service capacity.
➢ Gamagara Spatial Development Framework (2010)
The Spatial Development Framework (SDF) for Gamagara Municipality was prepared
and adopted by Council in 2010. The SDF was prepared in compliance with the
provisions of section 26(e) of the Municipal Systems Act (2000) and the Northern Cape

4 | P a g e : D R A F T I D P 2 0 1 7 - 2 0 2 2
Planning and Development Act. The Municipality has budgeted for Gamagara
Municipality SDF that complies with the provisions of the Spatial Planning and Land
Use Management Act 2013 and SDF Guidelines.
The SDF intended to guide the orderly and desirable spatial development of the
Municipality by inter-alia developing, development strategies/guidelines. The SDF will
prov ide general direction to guide decision-making on an on-going basis, aiming at
the creation of integrated, sustainable and habitable areas/towns for Gamagara
Municipal area.
➢ Broad-based Socio-economic Empowerment Charter or Mining Charter,
2002
As part of its objective, the Act aims to expand the skills base of Historically
Disadvantaged South Africans in order to serve the community, it further aims to
promote employment and advance the social and economic welfare of mining
communities and the major labour distribution areas and promote beneficiation of
South Africa’ s minerals With respect to mine community and rural development, it commits stakeholders in
partnership with all spheres of government to undertake to “co-operate in the
formulation of integrated development plans for communities where mining takes
place and for major labour sending areas, with special emphasis on development of
infrastructure.
➢ Industrial Development Act,
➢ Manufacturing Development Act, 1993 (Act, no. 197 of 1993)
➢ Special Economic Zones Act, 2014 (Act, no 16 of 2014)
➢ Minerals and Petroleum Resources Development Act, 2002 (Act,no. 28 of
2002)
1.3 Process followed
The IDP Process Plan indicated a written process that the Council adopted as a way
of undertaking the compilation of the IDP. A ward based participatory consultative
processes were undertaking to get communities’ priority for each particular ward.

5 | P a g e : D R A F T I D P 2 0 1 7 - 2 0 2 2
I tem
no.
Deliverable Legislative
requirements
Timeframes
1 Project plan
Tabling the draft IDP and budget process plan (time table)
to Council
MSA 32 of 2000
& MFMA No. 56
of 2003
August
2 Public Engagement:
Advertisement of time‐schedule on website, local
newspapers and notice boards
Acknowledgement of inputs received
MSA CH5 S29
MSA S28 October/
November
3 Annual Report:
Tabling of Annual report to Council
Annual report made public and submitted to MPAC
Council
Public making of oversight report
MFMA
January
February
March
April
4 Prov isional approval of Draft IDP and Budget:
Table draft IDP and Budget Report to Council
Advertise and publish final draft of IDP and Budget for
public comment and submit to National and Prov incial
Treasury and others as prescribed
MSA & MFMA
s16(2) March
April
5 IDP and Budget Hearings:
Conduct IDP/Corporate Scorecard / Budget Public
Hearings to obtain public comment and inputs from
communities, prov incial government and other relevant
stakeholders
Acknowledgement of comments received
Response to public comment i.t.o. Budget, tariffs and
policies
MSA s 74, 75 /
MFMA s23
April
May
June
6 Approval of the Budget and IDP: MFMA s23 April
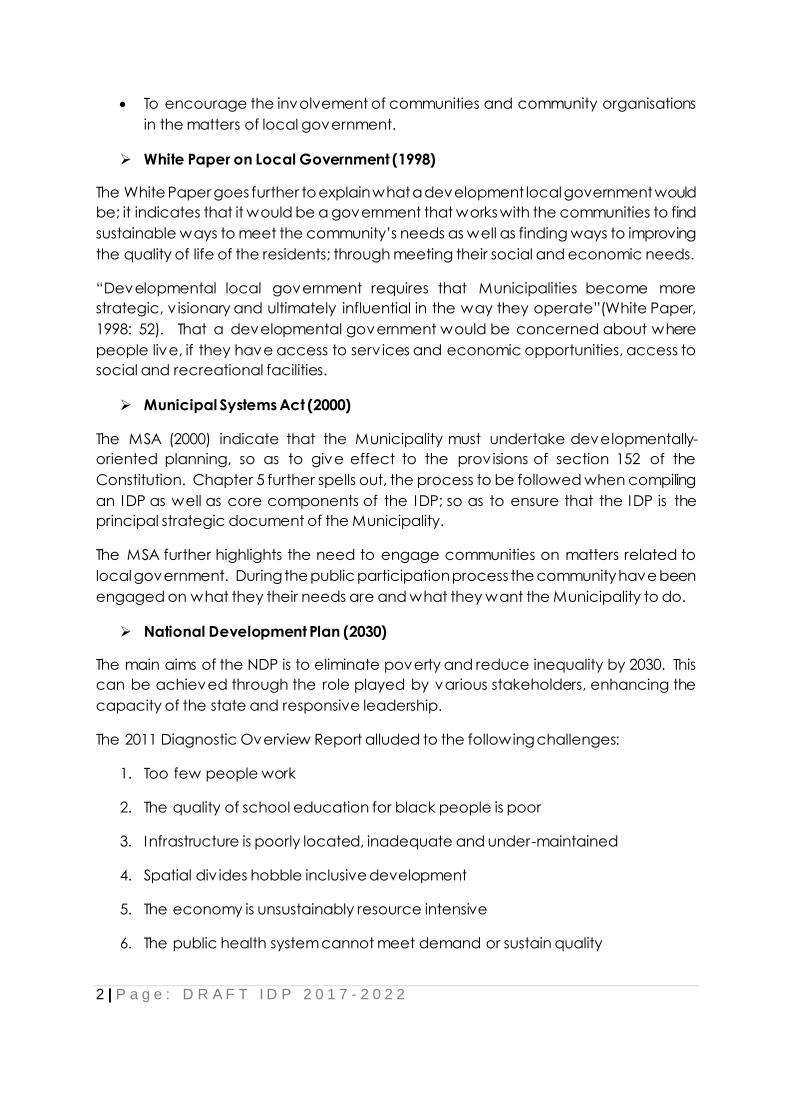
6 | P a g e : D R A F T I D P 2 0 1 7 - 2 0 2 2
Draft IDP and Budget consultation feedback to Portfolio
Committees.
Council must give final approval of the IDP/Corporate
Scorecard and Budget document by resolution, setting
taxes and tariffs, approving changes to the IDP and
budget related policies, approve measurable
performance objectives for revenue by source and
expenditure by vote before the start of the financial year
MSA s 25 &
MFMA 24
May
7 Public Communication of Budget and IDP MSA and
MFMA
June
8 Section 57 (MSA) Performance Agreements:
Submit performance agreements to the Executive Mayor
within 10 days after approval of the IDP and Budget.
Council to note New Section 57 Scorecards
Notification of approved S57 (top management
performance agreements) to the public
MFMA s 16, 24,
26, 53 MFMA s
53
May
June
August/
September
9 Approval of SDBIP’s:
Executive Mayor to approve Municipal SDBIP within 28
days after approval of the budget
Place all Directorate Executive Summaries and SDBIPs and
Department Business Plans and SDBIPs on website
MFMA
June
Table1: Approved process plan
1.4 Public participation
Section 16 of the MSA (2000) indicate that “a Municipality must develop a culture of
municipal governance that complements formal representative government with a
system of participatory governance, and must for this purpose encourage, and
create conditions for, the local community to participate in the affairs of the
Municipality”.
7 | P a g e : D R A F T I D P 2 0 1 7 - 2 0 2 2
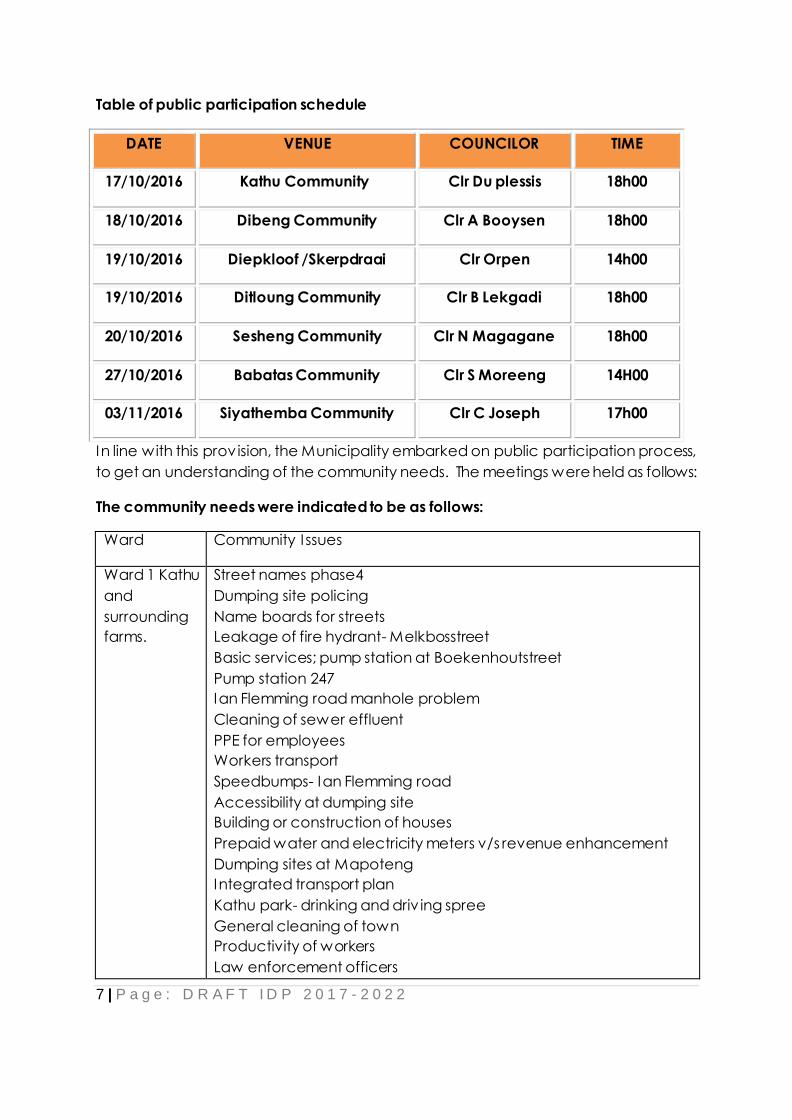
Table of public participation schedule
DATE VENUE COUNCILOR TIME
17/10/2016 Kathu Community Clr Du plessis 18h00
18/10/2016 Dibeng Community Clr A Booysen 18h00
19/10/2016 Diepkloof /Skerpdraai Clr Orpen 14h00
19/10/2016 Ditloung Community Clr B Lekgadi 18h00
20/10/2016 Sesheng Community Clr N Magagane 18h00
27/10/2016 Babatas Community Clr S Moreeng 14H00
03/11/2016 Siyathemba Community Clr C Joseph 17h00
In line with this prov ision, the Municipality embarked on public participation process,
to get an understanding of the community needs. The meetings were held as follows:
The community needs were indicated to be as follows:
Ward Community I ssues
Ward 1 Kathu
and
surrounding
farms.
Street names phase4
Dumping site policing
Name boards for streets
Leakage of fire hydrant- Melkbosstreet
Basic services; pump station at Boekenhoutstreet
Pump station 247
Ian Flemming road manhole problem
Cleaning of sewer effluent
PPE for employees
Workers transport
Speedbumps- Ian Flemming road
Accessibility at dumping site
Building or construction of houses
Prepaid water and electricity meters v/s revenue enhancement
Dumping sites at Mapoteng
Integrated transport plan
Kathu park- drinking and driv ing spree
General cleaning of town
Productivity of workers
Law enforcement officers

8 | P a g e : D R A F T I D P 2 0 1 7 - 2 0 2 2
Informal traders – Shoprite
Effluent of sewer
Cutting of camelthorn trees- protected specie
Prov ision of sanitation facilities at all new stands
Speedbumps
Water leakages
Availability of land v/s emerging entrepreneurs
Thorough consultations on renaming and street names
Resuscitation of Khai- appel
Ward 2 Prov ision of basic serv ices (Electricity, water and sanitation) other
part of Riemvasmaak
Unemployment
Refuse Removal
Sewer network extension for 478- 483
Taxi Rank v/s Shebeen
Extension of clinic hours, ambulance serv ices
Mushrooming of tuckshops
Overflowing of water at the reservoir
Visiting of shops by health inspector
Drugs and alcohol abuse and school dropouts
IElectricity provision in last year’s budget
Lack of development in dibeng
Allocation of church v/s Bussiness sites- criteria
Recreational and training facilities for young people
Library construction- WBHO
Social ills-(Drugs and substance abuse, School drop outs)
Application for business stands
Grading of roads at Riemvasmaak
Opening of pre-paid meters
Youth development
Completion of Plot numbers
Permanent doctor for Dibeng community
People with more than one erf
Ward 3
Skerpdraai,
Diepkloof
and
Dingleton.
Speed bumps for Main road
Water shortages (Diepkloof and Skerpdraai)
Street lights from Welgelee to Diepkloof off
Supply chain issues provision of materials
Closing of water taps – main pipeline for all
Broken water meters- repair
Road signs and cleaning of roads
Unemployment
Condition of parks

9 | P a g e : D R A F T I D P 2 0 1 7 - 2 0 2 2
Skills development
Storm water I ssue- Diepkloof and Skerpdraai
Prepaid water meters installation
I ssue at house 324
Ward Committee members airtime paid
Stray animals
Rape cases
Electricity and lights for new plots
Spray lights not working
Ward 4
Welgelee,
Ditloung,
Plakkerskam
p, Makalanie
Youth centre v/s Youth development
Health related issues
Completion of hospital
Repair lights; plugs and toilets at Ditloung Community Hall
Speedbumps and pedestrian lights on roads
Handling finances of municipality
Outsourcing v/s appointment of own municipal mechanical
department
Appointment of Technical staff
Overtime v/s shift workers
Toll free number for call centre
Rooiwal rezoning of plots
Prepaid water meters for indigent people
Write- off bad debts
Safety and health risk
Upgrading of swimming pools- welgelee and town
Paving road for Ditloung
Electricity connections at new stands
Basic service delivery
Asbestos roofing project- starting
Street names verification
Street lights- Welgelee
Ward 5
Sesheng and
Mapoteng
Sewerage effluent in streets in mapoteng
RDP Applications
Cutting of electricity for unemployed
Mosikhati contract to be terminated
Installation of pre-paid water meters
Allocation of sites to be prioritized
Instruments used to determine debts owed
Financial crisis at municipality
Outsourcing of services to costly
Sports and creation facilities
Criteria used to apply for sites
Incomplete tarr road
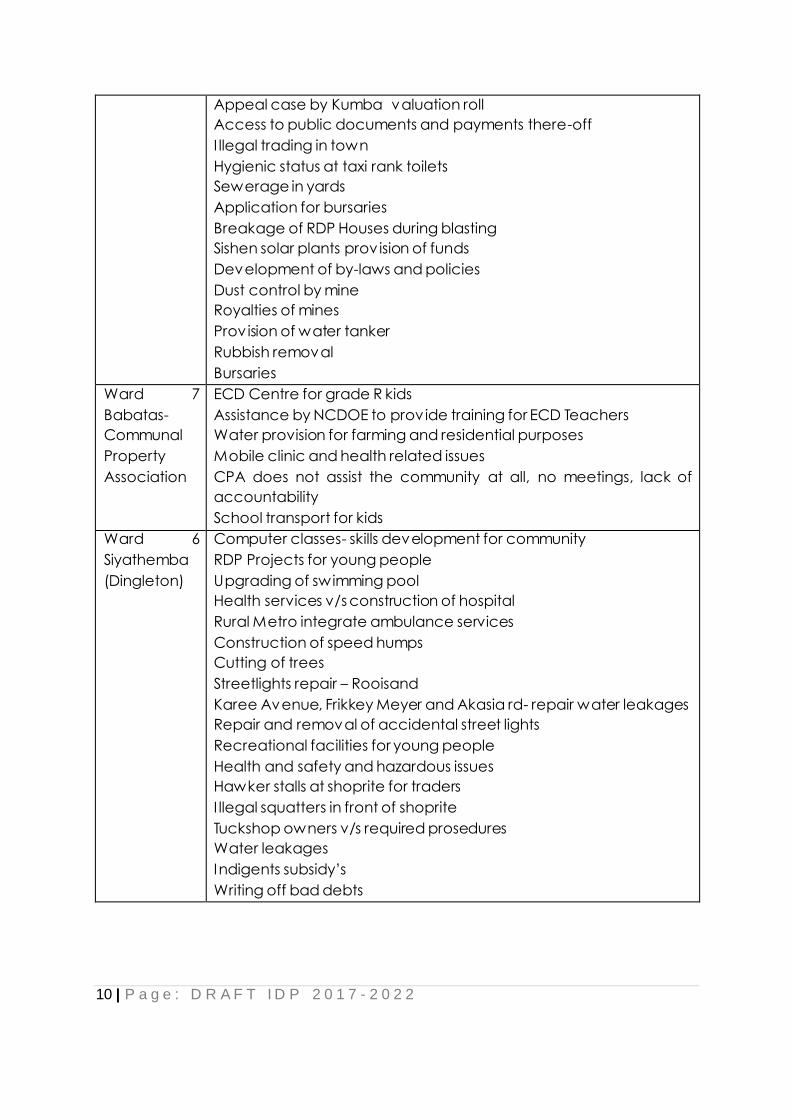
10 | P a g e : D R A F T I D P 2 0 1 7 - 2 0 2 2
Appeal case by Kumba valuation roll
Access to public documents and payments there-off
I llegal trading in town
Hygienic status at taxi rank toilets
Sewerage in yards
Application for bursaries
Breakage of RDP Houses during blasting
Sishen solar plants prov ision of funds
Development of by-laws and policies
Dust control by mine
Royalties of mines
Prov ision of water tanker
Rubbish removal
Bursaries
Ward 7
Babatas-
Communal
Property
Association
ECD Centre for grade R kids
Assistance by NCDOE to prov ide training for ECD Teachers
Water provision for farming and residential purposes
Mobile clinic and health related issues
CPA does not assist the community at all, no meetings, lack of
accountability
School transport for kids
Ward 6
Siyathemba
(Dingleton)
Computer classes- skills development for community
RDP Projects for young people
Upgrading of swimming pool
Health services v/s construction of hospital
Rural Metro integrate ambulance services
Construction of speed humps
Cutting of trees
Streetlights repair – Rooisand
Karee Avenue, Frikkey Meyer and Akasia rd- repair water leakages
Repair and removal of accidental street lights
Recreational facilities for young people
Health and safety and hazardous issues
Hawker stalls at shoprite for traders
I llegal squatters in front of shoprite
Tuckshop owners v/s required prosedures
Water leakages
Indigents subsidy’s
Writing off bad debts

11 | P a g e : D R A F T I D P 2 0 1 7 - 2 0 2 2
1.5 Powers and functions
The Constitution confers the municpality with both executive and administrative
functions. to matters that local government has executive authority over; schedule 4,
part B and schedule 5 part B. Which includes amongst others: air pollution, building
regulations, child care facilities, fire-fighting serv ices, local tourism, municipal
planning, storm ware management systems in built-up areas, trading regulations,
billboards and the display of advertisements in public places, local amenities, control
of public nuisances, street lighting, street trading, traffic and parking, etc.
The Municipality is performing all the functions assigned to it, except for the high
voltage electricity, which is done by Sishen I ron Ore Company Ltd on an agency basis
through serv ice level agreements. Additionally, Rural Metro does fire fighting and
emergency services on an agency basis through service level agreements.
Chapter 2: Situational Analysis
2.1 Introduction
This chapter in accordance with the requirements of the municipal System Act
prov ides a situational analysis of the existing trends and conditions in the Gamagara
local municipality.
2.2 Geographical Location
The Gamagara Local municipality is covering approximately 261 942 hectors, is one
of three local municipalities situated within the John Taolo Gaetsewe District in
Northern Cape Province. Gamagara local municipality is category B-municipality as
defined in the Municipal Structure Act. The administrative head office of the
municipality is located in Kathu.
12 | P a g e : D R A F T I D P 2 0 1 7 - 2 0 2 2
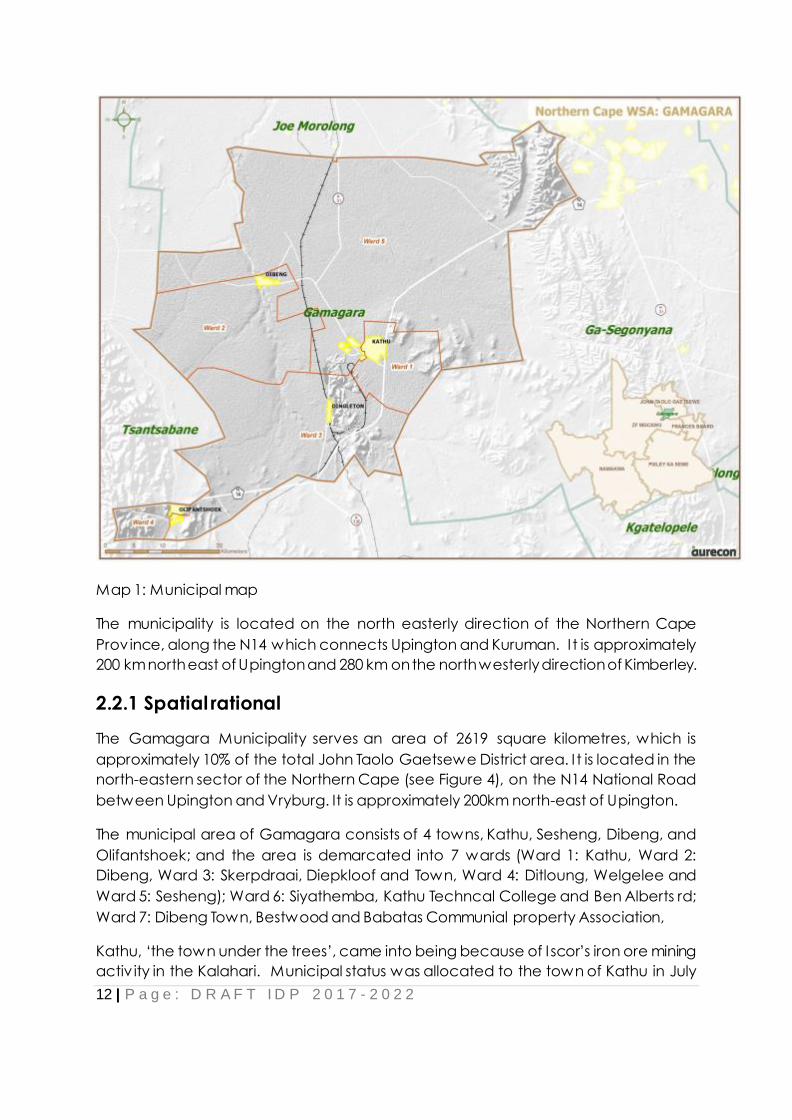
Map 1: Municipal map
The municipality is located on the north easterly direction of the Northern Cape
Prov ince, along the N14 which connects Upington and Kuruman. I t is approximately
200 km north east of Upington and 280 km on the north westerly direction of Kimberley.
2.2.1 Spatial rational
The Gamagara Municipality serves an area of 2619 square kilometres, which is
approximately 10% of the total John Taolo Gaetsewe District area. I t is located in the
north-eastern sector of the Northern Cape (see Figure 4), on the N14 National Road
between Upington and Vryburg. It is approximately 200km north-east of Upington.
The municipal area of Gamagara consists of 4 towns, Kathu, Sesheng, Dibeng, and
Olifantshoek; and the area is demarcated into 7 wards (Ward 1: Kathu, Ward 2:
Dibeng, Ward 3: Skerpdraai, Diepkloof and Town, Ward 4: Ditloung, Welgelee and
Ward 5: Sesheng); Ward 6: Siyathemba, Kathu Techncal College and Ben Alberts rd;
Ward 7: Dibeng Town, Bestwood and Babatas Communial property Association,
Kathu, ‘the town under the trees’, came into being because of I scor’s iron ore mining
activ ity in the Kalahari. Municipal status was allocated to the town of Kathu in July

13 | P a g e : D R A F T I D P 2 0 1 7 - 2 0 2 2
1979. Kathu is connected by rail (Dingleton Station) v ia Kimberley, as well as by road
to all the main centres namely Johannesburg, Bloemfontein, Windhoek and Cape
Town, and has an airport with a tarmac runway. The municipality originally consisted
of 2 towns, namely Sesheng and Kathu.
Sesheng is located to the west of Kathu and was initially planned as a high density
residential area for mine workers, without families of any social structure. I t consists of
group housing units that belong to the mine to the west, with small pockets of other
houses to the west thereof. Due to pressure from labour unions and Government
policy on hostels, group homes are to be changed to single flat units for employees
of the mine. The larger residential housing component of Sesheng is located nearer to
Kathu in the form of single residential houses (Ext. 5).
Dibeng is located approximately 28km north west of Kathu alongside the R380 road
in the Northern Cape Province. The settlement consists of two suburbs, namely Deben
and Haakbosdraai. Dibeng started off as a small settlement on the banks of the
Gamagara River, which provided water for the small town. The locations of the
residential areas are characterized by the river in the centre of town and the rocky
lime stone outcrops directly east and west of the river. Dibeng consists entirely of single
residential houses, but can be split into a low density area to the west and higher
density houses to the east. Dibeng was given its name by the Tswana and means "first
drinking place".
Dingleton developed in a linear form along the one side of the then main road
between Upington and Kuruman. Dingleton was consisted of almost total of low
density single residential houses. The tow n is surrounded by large mine activ ities and
the resettlement of Dingleton residents is eminent due to expansions of mining
activ ities in this direction. The town is currently left with few residents who are awaiting
to move to siyathemba were other residents are residing.
Olifantshoek is south-west of Kathu, south-west of Kuruman and north-east of
Upington. With the amalgamation of municipalities in 2000 Olifantshoek Municipality
became part of the Tsantsabane Local Municipality, until 2006 when it was
amalgamated with the Gamagara Local Municipality. The town is a low/medium
density residential area, but due to new developments which are underway it will in
future become a high density residential area.
14 | P a g e : D R A F T I D P 2 0 1 7 - 2 0 2 2
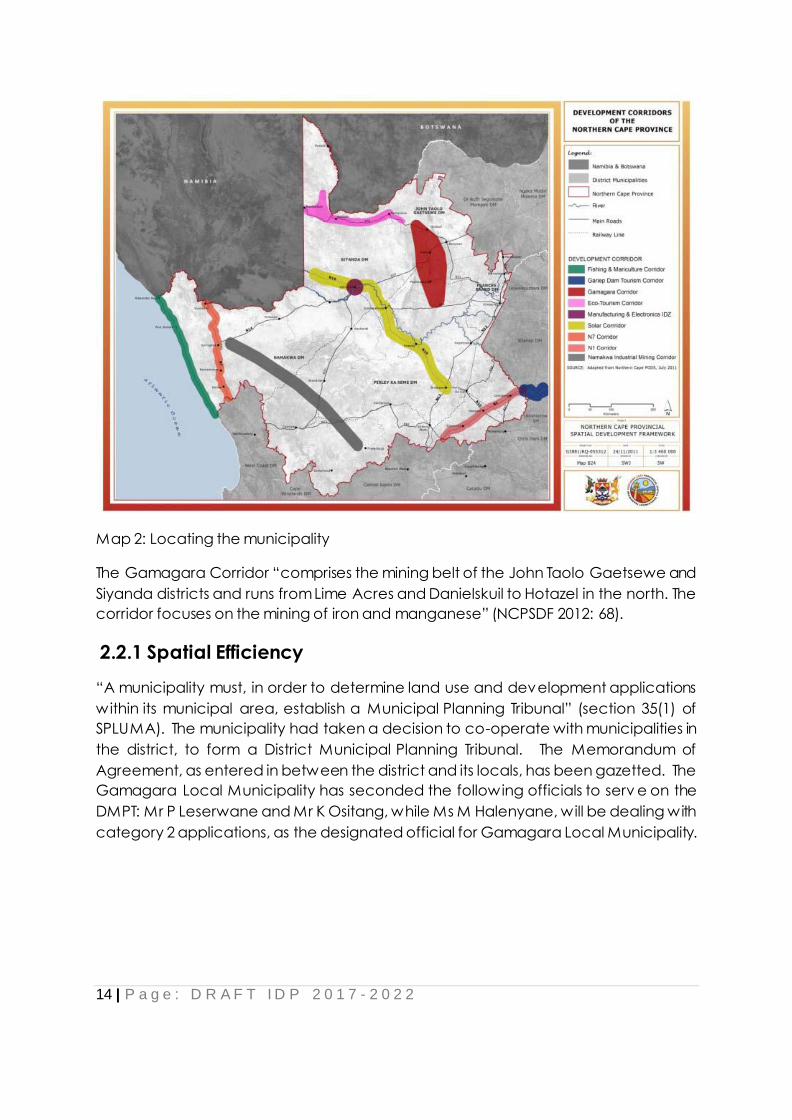
Map 2: Locating the municipality
The Gamagara Corridor “comprises the mining belt of the John Taolo Gaetsewe and
Siyanda districts and runs from Lime Acres and Danielskuil to Hotazel in the north. The
corridor focuses on the mining of iron and manganese” (NCPSDF 2012: 68).
2.2.1 Spatial Efficiency
“A municipality must, in order to determine land use and development applications
within its municipal area, establish a Municipal Planning Tribunal” (section 35(1) of
SPLUMA). The municipality had taken a decision to co-operate with municipalities in
the district, to form a District Municipal Planning Tribunal. The Memorandum of
Agreement, as entered in between the district and its locals, has been gazetted. The
Gamagara Local Municipality has seconded the following officials to serv e on the
DMPT: Mr P Leserwane and Mr K Ositang, while Ms M Halenyane, will be dealing with
category 2 applications, as the designated official for Gamagara Local Municipality.

15 | P a g e : D R A F T I D P 2 0 1 7 - 2 0 2 2
2.3 Environment
2.3.1 Climate
The municipality has “typical arid climatic circumstances generally found in the
Kalahari region, with temperatures ranging between 80C and 280C. The rainfall varies
between 350 mm and 500 mm per annum, which is below the generally accepted
average needed for dry land cropping” (Gamagara SDF, 2010: 9).
2.3.1.1 Climate Change
The United Nations Framework Convention on Climate Change (UNFCCC) defines it
as “a change of climate which is attributed directly or indirectly to human activ ity that
alters the composition of the global atmosphere and which is in addition to natural
climate variability observed over comparable time periods.”
• Climate change threatens food security, poverty alleviation and sustainable
socio-economic growth.
• The Northern Cape specifically will be affected very adversely by climate
change. Already the effects are ev ident in the provision of water due to
depletion or dewatering.
• Not only does the risk of climate change lie predictably in increased intensity
of drought leading to complete desertification and further water scarcity, there
is also a real risk of extreme flooding in some areas and potential damage to
infrastructure due to water-level rise and associated increased damage
capacity of storm surges.
• Fire will be a constant risk due to hot winds and dead or dry vegetation – fire
risk projections for the western parts of South Africa indicate an increase in risk
approximately 300%.

16 | P a g e : D R A F T I D P 2 0 1 7 - 2 0 2 2
▪ Climate Change will impact persons and groups that are already vulnerable to
food insecurity. Higher prices for agricultural inputs, water and food imports must
be expected.
▪ The productivity of livestock, farming and game farming will be affected, as well
as potential income from tourism. Subsistence farmers will suffer the most – they
are one of the social spectrum: poor, barely literate and quite likely to lose their
livelihood to the encroaching desert.
▪ Policy decisions taken in the next decade will largely determine the dimension of
the impact of climate change.
▪ Local government is on the front line of implementation and service delivery, and
thus local government need to pursue adequate mitigation and adaptation
strategies, which should include participation from the public sector, the private
sector and NGOs.
▪ The climate change challenge is complex and requires a collective action. A
sectoral approach is not advisable, as the challenge requires multi-sectoral
strategies. There is a need for collaboration amongst all stakeholders. Therefore,
the Northern Cape government needs to:
▪ Develop climate change scenarios and models that look at such parameters
as temperature, precipitation, extreme weather events, winds and humidity.
▪ Recognize regional (including cross-border) impact of climate change.
▪ Implement institutional arrangements that support integration of climate
change across sectors.
▪ Set goals and targets to address climate change, which are measurable,
verifiable and reportable.
▪ Develop mechanisms for adaption to climate change.
▪ Ensure that IDPs give recognition to aspects of climate change and consider
mainstreaming the issues.
▪ Ensure that social cohesion strategies are promoted and incorporated in the
IDPs.
▪ Ensure that planning process should include established communities and
migrant communities.
▪ Enhance public participation systems to strengthen the interface between
municipal representatives and migrants.
▪ Enhance early warning systems and emergency services to deal with climate
change issues.
▪ Enhance capacity building at local and regional government level.
▪ Enhance capacity building in communities – information on climate change
must be disseminated to the public.
▪ Farming techniques require changes – Farmers, including small-scale and
subsistence farmers, should be trained in desertification-prevention techniques
to stop their loss of soil and soil quality as they continue ploughing and farming
in an increasingly dry environment.

17 | P a g e : D R A F T I D P 2 0 1 7 - 2 0 2 2
▪ A strategy to deal with displaces farmers and farm workers.
▪ Ensure that buildings, whether private or public, are designed better, not only
to cope with climate change, but also as mitigation for reduction greenhouse
gases.
▪ Infrastructure investment, such as bridges, roads and railways need to be able
to withstand floods and other extreme climate conditions.
2.3.2 Topography and Geology
“The landscape of the Gamagara Local Municipality may be seen as relatively flat,
with a series of dry bedded rivers crossing the area. Mountainous areas do however
occur in some parts of the municipal area” (Gamagara SDF 2010: 9). The geologically
groups found in the municipal area are the Griquatown, Kalahari and Olifantshoek
group.
2.3.3 Water sources
The Gamagara Local Municipality, “being situated in an arid area, has extremely
limited water resources. Settlements in the area are therefore extremely dependent
on the extraction of groundwater for various uses. Although water resources in the
area are supplemented by Sedibeng Water, the exponential growth in the area,
especially around Kathu, has necessitated the close monitoring and protection of
underground water resources” (SDF 2010, 11).
The municipality has various acquiters such as the Khai Appel, Sishen and Kathu
aquifers. Sedibeng water prov ides clean/drinkable water to the residents of
Gamagara Local Municipality.
Water quality: Water quality is tested monthly. Chemical and bacteriological tests are
conducted and the results indicated an average healthy drinking water. The status of
our water quality is 40% blue drop and 83% green drop.
2.3.4 Biodiversity
96.9% of the area remains natural, while the remaining 3.1% covers an area where no
natural habitat remains.
2.3.4.1. Biomes
There is one biome covering the whole Gamagara municipal area, which is the
Savannah biome. The Savannah biome is famous for its wild animals hence the large
game reserves like the Kgalagadi Transfronteir Park. The Savanna biome is the centre
of wildlife tourism and meat production (game, cattle and goats) in South Africa,
which can be utilised to grow the local economy.

18 | P a g e : D R A F T I D P 2 0 1 7 - 2 0 2 2
2.3.4.2. Vegetation type
The municipal area is covered by seven vegetation types namely;
Vegetation type Size
Gordonia Duneveld 0.12% of municipality
Kathu Bushveld 60.18% of municipality
Koranna-Langeberg Mountain Bushveld 1.66% of municipality
Kuruman Mountain Bushveld 6.09% of municipality
Kuruman Thornveld 17.2% of municipality
Olifantshoek Plains Thornveld 14.66% of municipality
Southern Kalahari Salt Pans 0.09% of municipality
Threatened terrestrial ecosystems
Critically endangered None
Endangered None
Vulnerable None
2.3.5 Heritage and assets
Camel-thorn tree/ Kathu forest
The Gamagara municipal area owns an endemic camel-thorn tree forest, which
enjoys a National Heritage status. The tree gave Kathu its name; the “town under the
trees”. The Kathu forest situated north of the town of Kathu has been declared a
protected woodland in terms of section 12(1) (c) of the National Forests Act (1998) by
the Minister of Agriculture, Forestry and Fisheries. This was confirmed in the
Government gazette dated 10 July 2009. The Kathu Forest is a unique woodland of
exceptionally large camel thorn trees (Acacia erioloba). The woodland of
approximately 4000 hectares is one of only two such woodlands in the world. The
Kathu forest was registered as a national heritage site in 1995. The farms and portions
that make up the forest are currently privately owned.

19 | P a g e : D R A F T I D P 2 0 1 7 - 2 0 2 2
2.3.6 Environmental threats
The natural environment is confronted by various challenges. I t is important for these
challenges to be known, avoided or mitigated, so that the future generations can
also enjoy what nature has given the residents of Gamagara municipal area. The
environmental challenges are:
• unsustainable consumption and use of natural environment,
• uncontrolled development and expansion of the town of Kathu
• negative impact of mining on the ground water (either contamination or
depletion due to dewatering)
• diminishing ecological footprint in the area
• The state of air quality in the area which may diminish due continuous emissions
from both mining machinery and processes to the atmosphere.
2.4 Demographic Profile
2.4.1 Population
Statistics of South Africa Community survey 2016 indicates that Gamagara
Municipality has a total population of 53 656 as compared to 41,617 in 2011. Thus
translating to a population increase of 33.4% (12,039 indiv iduals) from 2011 to 2016.
Population is growing at a rate of 6.68% per year. Population density (people per
square kilometre) increased from 8.9 to 15.9. The Gamagara Municipality has a high
urbanisation rate of 97.6%, which is significantly higher than that of the District (24.9%).
Gamagara Municipality composition is characterised by African, Coloured, Whites
and Indian or Asian people. Population is comprised of 48, 6% African, 32, 6%
Coloured, 18% Whites and 0, 82 % Indian/Asian. Gender ratio was recorded at
120,1:100 male to females and mean age was 27 years as captured in census
2011(Statssa, 2011). The literacy level is low and only 24, 9 % have gone through matric
and 3, 6% has through higher education.
The most significant portion of Gamagara’s population is resident in Kathu (27.7% or
11,511 indiv iduals), followed by Sesheng (26.5% or 11,033 indiv iduals), Olifantshoek
(24.6% or 10,235 indiv iduals), and Dibeng (18.9% or 7,848 indiv iduals). Another 2.4%
(991 indiv iduals) of the Municipality’s population is resident in the Gamagara Non-
Urban (NU)8 area.
In terms of population growth, all the main places experienced a positive growth from
2001 to 2011 except the Gamagara NU mail place. Sesheng and Dibeng experienced
the most significant growth rate of 125.7% and 95.9% respectively. In terms of numbers,

20 | P a g e : D R A F T I D P 2 0 1 7 - 2 0 2 2
the main place that experienced the most significant growth is Sishen (6,144
indiv iduals) and Kathu (5,232 indiv iduals). The Gamagara NU area covers 89.6% of the
Gamagara Municipality’s total geographical area. The second largest geographical
area and largest urban area is Sishen, which covers 6.9% of the Municipality.
Graph 1: Population by race
Dependency ratio was 50.9% in 2001 and has now decreased to 39% in 2011. This can
be attributed to more people being economically active.
2.4.2 Age Distribution
Graph 2: Population pyramid
26062
17510
439
9644
0
5000
10000
15000
20000
25000
30000
African Coloured Indian or
Asian
White
Population by race
Population by race
4000 3000 2000 1000 0 1000 2000 3000
0-14
35-64
20 - 24
30 - 34
40 - 44
50 - 54
60 - 64
70 - 74
80 - 84
Population pyramid
Female
Male
21 | P a g e : D R A F T I D P 2 0 1 7 - 2 0 2 2
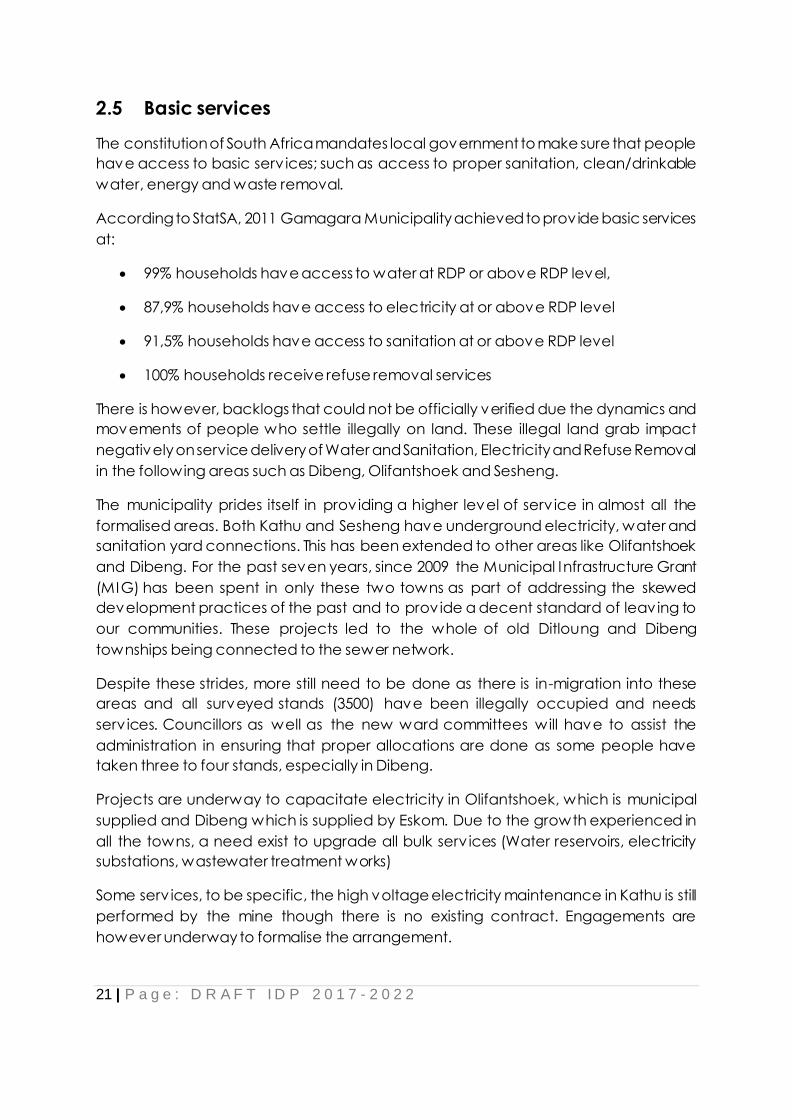
2.5 Basic services
The constitution of South Africa mandates local government to make sure that people
have access to basic serv ices; such as access to proper sanitation, clean/drinkable
water, energy and waste removal.
According to StatSA, 2011 Gamagara Municipality achieved to prov ide basic services
at:
• 99% households have access to water at RDP or above RDP level,
• 87,9% households have access to electricity at or above RDP level
• 91,5% households have access to sanitation at or above RDP level
• 100% households receive refuse removal services
There is however, backlogs that could not be officially verified due the dynamics and
movements of people who settle illegally on land. These illegal land grab impact
negatively on service delivery of Water and Sanitation, Electricity and Refuse Removal
in the following areas such as Dibeng, Olifantshoek and Sesheng.
The municipality prides itself in prov iding a higher level of serv ice in almost all the
formalised areas. Both Kathu and Sesheng have underground electricity, water and
sanitation yard connections. This has been extended to other areas like Olifantshoek
and Dibeng. For the past seven years, since 2009 the Municipal Infrastructure Grant
(MIG) has been spent in only these two towns as part of addressing the skewed
development practices of the past and to prov ide a decent standard of leaving to
our communities. These projects led to the whole of old Ditloung and Dibeng
townships being connected to the sewer network.
Despite these strides, more still need to be done as there is in-migration into these
areas and all surveyed stands (3500) have been illegally occupied and needs
serv ices. Councillors as well as the new ward committees will have to assist the
administration in ensuring that proper allocations are done as some people have
taken three to four stands, especially in Dibeng.
Projects are underway to capacitate electricity in Olifantshoek, which is municipal
supplied and Dibeng which is supplied by Eskom. Due to the growth experienced in
all the towns, a need exist to upgrade all bulk serv ices (Water reservoirs, electricity
substations, wastewater treatment works)
Some serv ices, to be specific, the high voltage electricity maintenance in Kathu is still
performed by the mine though there is no existing contract. Engagements are
however underway to formalise the arrangement.

22 | P a g e : D R A F T I D P 2 0 1 7 - 2 0 2 2
2.5.1 Land
The municipality does not have serviced land available currently due to illegal land
grab but the municipality is in a process of negotiating with the mine for small piece
of land. The only land that was available was recently sold on tender. Some land in
Babatas, Dibeng town, Bestwood and Kathu farm owned by CPA and private
developers.
2.5.2 Housing
The Municipality has an approved Revised Integrated Human Settlement Sector Plan.
The Plan indicates that housing needs in Gamagara has grown exponentially in a
period of ten years (in between 2001 and 2011 census years). The in-migration has
prompted a growth 211% of in number of households. There were 833 informal
households in Gamagara which constituted 15,7% of the total number of households
and the 2011 census found that there was an increase of 1757 households leading to
the total number of the informal households to 2 590 which constitute 24,4% of the
total households in Gamagara. The Gamagara Integrated Human Settlement Sector
Plan (GIHSSP) indicates that 98% of the informal settlements were found to be in the
urban areas. Farm land housing need was recorded as 24 households (Gamagara
Integrated Human Settlement Sector Plan: 2014).
The GIHSSP indicates further that 9,5% of the total households are backyard shacks
which grew by 797% in the past ten years and 13,9% of the total households are stand-
alone shacks which depicts 124% growth in the past ten years. I t further reveals that
there are households that stays in caravans or tents which constitute 0,6% of the total
households and indicates a growth of 136% during the past ten years.
Approximately 76% of households resident in the Gamagara Municipality are resident
in adequate housing. Although the number of households resident in adequate
housing increased 80% from 2001 to 2011 (translating to 3,568 households), the portion
of households resident in adequate housing decreased from 84% to 76% of
Gamagara’s total households. In 2001 16% of Gamagara’s households were resident
in inadequate housing which increased to 24% in 2011. Although informal dwellings in
in an informal/squatter settlement represent the most significant portion of the
inadequate housing (14% of Gamagara’s households), informal backyard dwellings
(representing 9% of Gamagara’s households) grew from 112 in 2001 to 1,005 in 2011
(797%).
The Integrated Human Settlement Sector Plan has identified a housing backlog to be
at 2 590 houses. The municipality has planned to fast track the institutional housing
development in all areas of the municipality to deal with the housing backlog.

23 | P a g e : D R A F T I D P 2 0 1 7 - 2 0 2 2
Graph 3: Main dwelling type
The majority of people residing in the municipal area are renting those properties,
followed by those that have fully paid their properties. The opportunity is characterised
by the migrant labour system and few industrial development around Kathu. Also
considering the property prices which are very high due to high economic boom in
the area, most people cannot afford to buy houses in Kathu. There appears to be a
huge market for rental properties in the Gamagara Local Municipality
Graph 4: Tenure status
0
1000
2000
3000
4000
5000
6000
Rented Owned but not
yet paid offOccupied rent-
freeOwned and
fully paid offOther
Tenure status
Tenure status
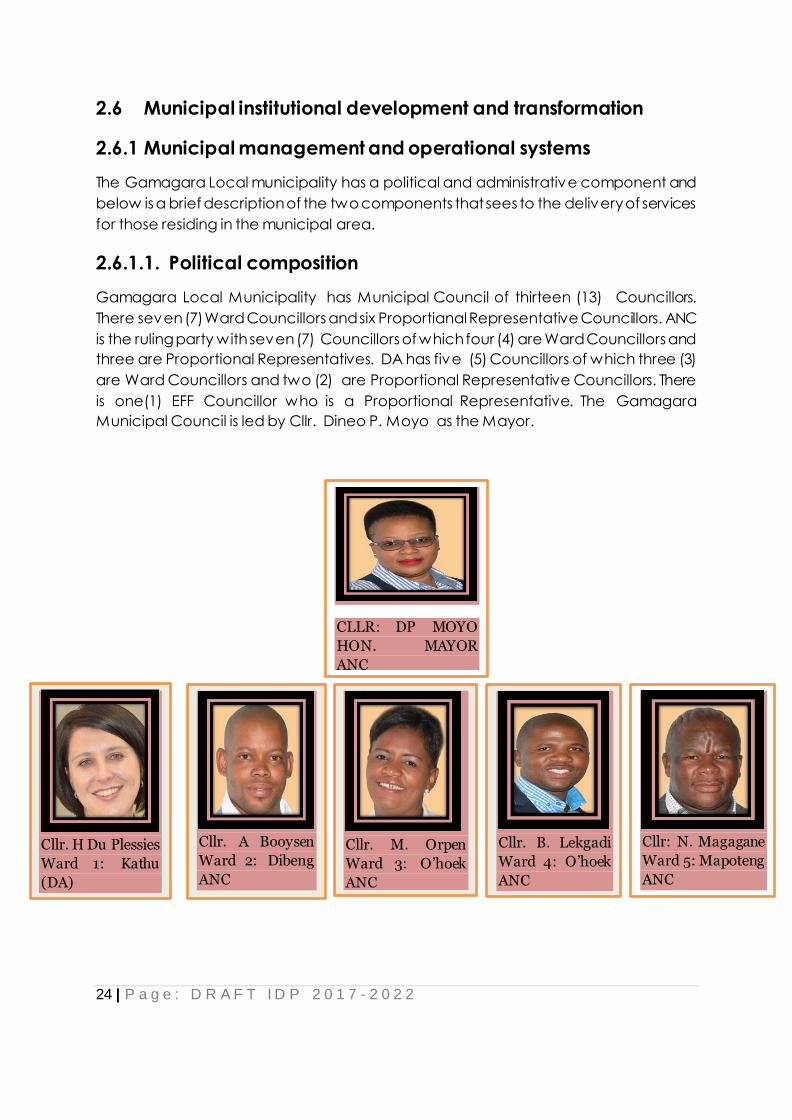
24 | P a g e : D R A F T I D P 2 0 1 7 - 2 0 2 2
2.6 Municipal institutional development and transformation
2.6.1 Municipal management and operational systems
The Gamagara Local municipality has a political and administrative component and
below is a brief description of the two components that sees to the delivery of services
for those residing in the municipal area.
2.6.1.1. Political composition
Gamagara Local Municipality has Municipal Council of thirteen (13) Councillors.
There seven (7) Ward Councillors and six Proportianal Representative Councillors. ANC
is the ruling party with seven (7) Councillors of which four (4) are Ward Councillors and
three are Proportional Representatives. DA has five (5) Councillors of which three (3)
are Ward Councillors and two (2) are Proportional Representative Councillors. There
is one(1) EFF Councillor who is a Proportional Representative. The Gamagara
Municipal Council is led by Cllr. Dineo P. Moyo as the Mayor.
CLLR: DP MOYO
HON. MAYOR
ANC
Cllr. A Booysen
Ward 2: Dibeng
ANC
Cllr. B. Lekgadi
Ward 4: O’hoek
ANC
ANC
Cllr. H Du Plessies
Ward 1: Kathu
(DA)
DA
Cllr. M. Orpen
Ward 3: O’hoek
ANC
Cllr: N. Magagane
Ward 5: Mapoteng
ANC

25 | P a g e : D R A F T I D P 2 0 1 7 - 2 0 2 2
Ward Councillors
Ward Councillor Portfolio Political party Gender
1 Cllr. H. du Plesis Ward 1 Councilor and Member
of Technical Serv ices Committee
DA Female
2 Cllr. A. Booysen Ward 2 Councilor and
Chairperson of MPAC
ANC Male
3 Cllr. M. Orpen Ward 3 Councilor and
Chairperson of Development
and Planning Committee
ANC Female
4 Cllr. B. Lekgadi Ward 4 Councilor and
Chairperson of Finance
Committee
ANC Male
Cllr. S Moreeng
Ward 7: Babatas
DA
Cllr. J Esau
PR Cllr
DA
Cllr. C Joseph
Ward 6: Kathu
DA Cllr. E Hantise
PR Cllr
ANC
Cllr. F Nqume
PR Cllr.
ANC
Cllr. A Morwe
PR Cllr.
DA
Cllr. M Skeman
PR. Cllr
EFF

26 | P a g e : D R A F T I D P 2 0 1 7 - 2 0 2 2
5 Cllr. N. Magagane Ward 5 Councilor and
Chairperson of Corporate
Serv ices Committee
ANC Male
6 Cllr. C. Joseph Ward 6 Councilor and Member
of Technical Serv ices Committee
DA Female
7 Cllr. S. Moreeng Ward 7 Councilor and Member
of Corporate Serv ices
Committee
DA Male
Proportional Representation Councillors
Councillor Portfolio Political party Gender
Cllr. F. Nqume Chairperson of Technical
Serv ices Committee
ANC Male
Cllr. D.P Moyo Mayor and member of Finance
Committee
ANC Female
Cllr. O.E Hantise Member of Corporate Serv ices
Committee
ANC Male
Cllr. J. Esau Member of Development and
Planning Committee
DA Male
Cllr. A. Morwe Chairperson of Corporate
Serv ices Committee
DA Female
Cllr. M. Skeiman Member of Community Serv ices
Committee
EFF Female
The core mandate of the Council is focused on the five themes listed below:
• Accountability, Oversight and Scrutiny
• Strengthen Capacity of the Council
• Public Participation to safeguard the local democratic processes
• Monitoring and Evaluation
• Sound Financial Management

27 | P a g e : D R A F T I D P 2 0 1 7 - 2 0 2 2
• Legislative functions also include the approval of By-laws, policies, budget, the
Integrated Development Plan, tariffs, rates, taxes and service charges. Council
further considers reports received from the Mayor, focuses on public
participation related to Council matters through discussions, stimulates debate
in multi-party portfolio committees, ensures community and stakeholder
participation as well as playing an oversight role of the on the Executive.
The system of delegations guides committees in terms of the role of oversight they play
within the Legislature. Councilors also physically v isit sites where projects, especially
serv ice delivery projects are implemented, so as to fulfil the oversight role that they
play.
Section 79 Portfolio Committees perform an oversight role by monitoring the delivery
and outputs of the Executive. These committees do not have any delegated decision-
making powers.
Functions include:
• Reviewing, monitoring and evaluating departmental policies;
• Reviewing and monitoring of plans and budgets;
• Considering quarterly and annual departmental reports;
• Examining the link between the strategy, plans and budgets of the
Municipality; and
• Holding the political Executive accountable for performance against policies
and the Municipality’s priorities.
Standing Committees have been established to deal with Council related matters.
These committees have decision-making powers and are chaired by Councilors, with
the exception of the Audit Committee which is chaired by an independent person.
This is in line with the prescriptions of the Municipal Finance Management Act
(MFMA).This chapter prov ides the situational analysis of the current trends and
conditions found in the municipality.
2.6.1.3 Administration
In terms of part 7 section 82 of the Municipal Structures Act 117 of 1998 as amended
the Municipality must appoint the Municipal Manager who shall be the head of
administration and therefore the Accounting Officer. The Municipal Manager shall be
required to uphold the prescripts of section 55 of the Municipal Systems Act, 32 of 2000
as amended. Some of which includes Municipal Council’s policy directives to form
and develop an efficient, economical, effective and accountable administration
within the confines of all legislation and policies pertaining to Local Government.

28 | P a g e : D R A F T I D P 2 0 1 7 - 2 0 2 2
Considering the size and intense nature of certain functions of the municipality, some
of the functions may be provided on a shared based arrangements. Serv ices like the
Internal Audit, Risk Management and appointment and management of the Audit
Committe may be renderd as shared serv ices with the John Taolo Gaetsewe District
Municipality.
All Directors are required to sign an annual performance contract linked to the IDP
and SDBIP as approved by Council and the Mayor respectively. Currently there is no
vacancy at the management level.
The municipality has appointed all senior managers or managers reporting to the
Municipal Manager. The munnicipality is composed of five (5) functional departments
to assist the municipal manager to achieve the object of Local Government as
prescribed in the Constitution.
Senior Management
The top organisational structure of the municipality is as follows:
Office of the Municipal Manager
Ensures the effective and efficient functionality of the municipality.
Technical Services
This department’s core function is to ensure that basic services are delivered to the
communities of Gamagara and to ensure infrastructure investment, development
and maintenance in the municipal area.
Corporate Services Department
I t is however important to highlight a few of the factors influencing the situation. The
municipality implemented its Task Job Evaluation System in March 2015. This situation
resulted in a re-evaluation of posts and had a negative impact in the financials of the
municipality as employees had to be back paid and a number of posts were
Municipal Manager
Mr. T.C. Itumeleng
Director :Technical Services
Mr. K. Ositang
Director: Financial Services
Mr.M. Grond
Director: Corporate Services
Mr. L. Seetile
Director: Community Services
Mrs. R. Sebogodi
Director: Strategic Services
Mr. K. Leserwane

29 | P a g e : D R A F T I D P 2 0 1 7 - 2 0 2 2
upgraded based on the T-Scale adjustment leading to high salaries. The salary budget
is now standing at R143 million. Due to revenue collection not being fully effective,
most of the posts, especially at junior levels are vacant and this impact negatively on
serv ice delivery in general.
Community Services
Despite challenges of understaffing, especially at the traffic section, the department
is doing its best to deliver on all its functions. Most of our towns are kept clean, using
mostly EPWP workers and other projects. Past projects to clean the townships of
rubbish dumps were successful, however residents have redone them thus undoing
the good work done by the department to prov ide a healthy and clean environment,
which is a mandate of local government as per the constitution of the Republic of
South Africa.
The department’s two main challenges are the landfill site in Dibeng, which
accommodates refuse from Kathu, Sesheng, Dingleton and Dibeng itself.
With increased volume of waste due to the population growth in the municipality, and
given that refuse has to be transported to a site 28 km away, this service has become
extremely expensive to the municipality.
This situation calls for a need for a comprehensive and affordable plan for waste
management in the municipality.
Strategic Services
This department was established late by the municipality and as such is still in its
insipient stage. The department has however been empowered with the filling of its
critical posts, e.g. town planning which was previously outsourced.
The department has been doing its best to resuscitate collapsed Local Economic
Development (LED) projects.
The Spatial Planning and Land Use Management Act (SPLUMA) which came into
operation in the beginning of July 2015 requires a lot of resources to be channelled
into the department for its proper implementation, however this has not been the
case due to the financial situation of the municipality.
The department is expected to start mobilizing all available sources of funds to
improve the local economy focusing especially on the support of SMME’s.
Financial Service Department
The department is responsible for ensuring sound financial management and making
sure that the municipality complies with the Municipal Finance Management Act.

30 | P a g e : D R A F T I D P 2 0 1 7 - 2 0 2 2
2.6.1.4 Complaints management systems
Municipality has two systems of managing complaints. There is a call centre and
customer care services. The call centre uses the remote complaint management
system where residents can phone in to complain or raise matters of concern to them.
The customer care services is for residents who came to the municipality to complaints
or raise concerns.
2.6.1.5 Fraud prevention plan
The whole management team is responsible for ensure that Fraud is curbed. Customer
Care Centre is been installed to assist the municipality with reporting any instances of
corruption or fraud.
2.6.1.6 Stakeholders mobilisation
The municipality has through its IDP/Budget Process Plan, illustrates how it intends to
engage with the different stakeholders. The municipality has been able to mobilise its
stakeholders in the compilation of the IDP, though it should be recorded that sector
departments are not active enough.
The municipality has a plan to increase the stakeholder participation by establishing
strategic sector stakeholder forums .e.g. Developer’s Forum, LED Forum, Chamber of
Commerce. The municipality has approved the communication strategy at a council
meeting held on 26th February 2015.
2.6.2 Institutional development and transformation
2.6.2.1 Human Capital
Gamagara, is guided by the recruitment and Selection Policy to fill the positions. The
Development of Human Resource Development Strategy has been considered as a
comprehensive plan that will ensure that human resources are aligned to
organizational plans and operational needs.
GRAPHICAL ILLUSTRATION OF THE STAFF ESTABLISHMENT AND VACANCIES
The municipality has a staff component of 359 people.
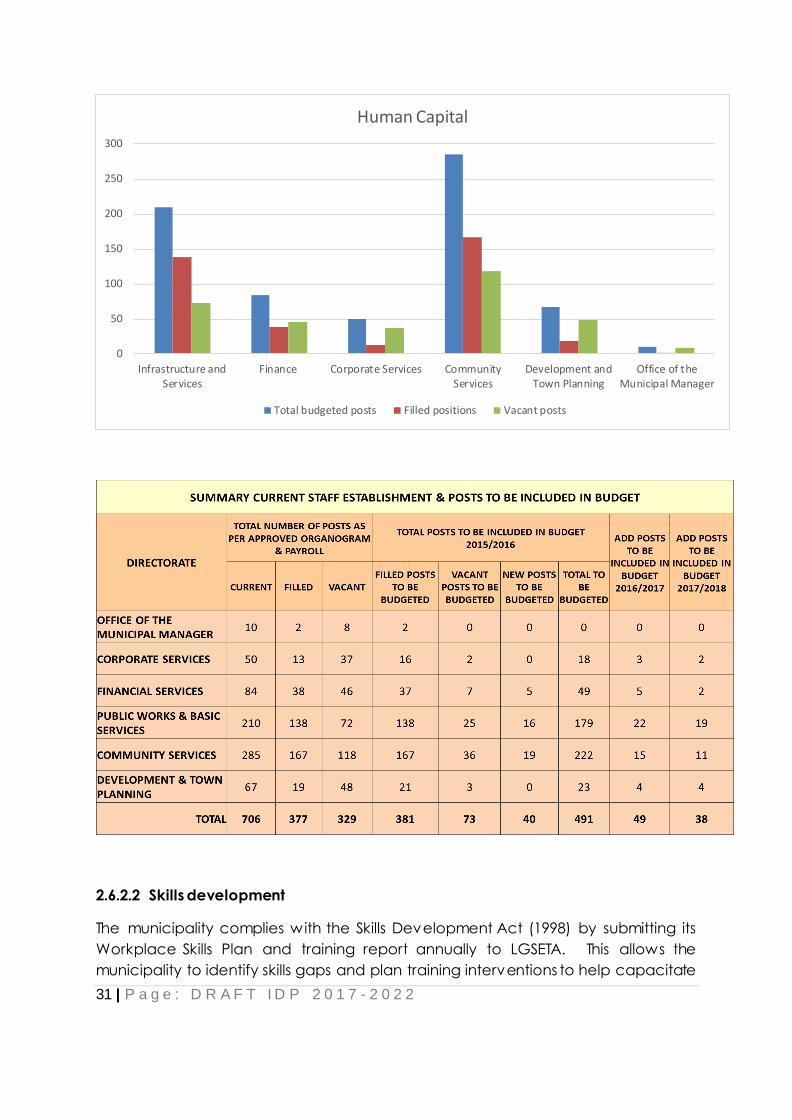
31 | P a g e : D R A F T I D P 2 0 1 7 - 2 0 2 2
2.6.2.2 Skills development
The municipality complies with the Skills Development Act (1998) by submitting its
Workplace Skills Plan and training report annually to LGSETA. This allows the
municipality to identify skills gaps and plan training interventions to help capacitate
0
50
100
150
200
250
300
Infrastructure andServices
Finance Corporate Services CommunityServices
Development andTown Planning
Office of theMunicipal Manager
Human Capital
Total budgeted posts Filled positions Vacant posts

32 | P a g e : D R A F T I D P 2 0 1 7 - 2 0 2 2
its workforce. The skills development plan is been rev iewed annually and each
employee must submit its personal development plan to be incorporated in the WSP.
2.6.2.3 Performance Management System
The MSA (2000) section 38 states that “a municipality must establish a performance
management system that is: commensurate with its resources, best suited to its
circumstances and in line with the priorities, objectives, indicators and targets
contained in its integrated development plan”. Performance management system
is important, as it allows the municipality to measure its performance and identifies its
performance shortcomings. When performance management system is properly and
fully implemented it can improve the overall performance of the municipality.
The municipality has only been able to implement performance management system
for the municipal manager and the directors. They have signed performance
agreements and scorecards. The municipality has appointed a Performance
Management System Officer to make sure that PMS is executed in a more effective
and satisfactory manner. The municipality will cascade the performance
management system to lower level employees and to give effect to the approval of
the Performance Management Plan.
2.6.2.4 Information technology
Currently there is no internal capacity to do ICT work; the municipality is using an
external serv ice provider, to do this function on behalf of the municipality. The
municipality has appointed an ICT person, but it is still not sufficient and intends to fill
other critical posts in the new financial year as reflected in the reviewed
organizational structure.
2.6.2.5 Human resources policies
The municipality has developed the following human resources policies to create the
necessary environment for fair and sound labour practices. Below is a list of the
policies and plans (and its current status) that the municipality has approved to guide
it in treating its workforce fair and consistently. All the policies below were reviewed
and workshop on 13th – 15th March 2017.
Policy name
Training and Development
Leave policy
Employment Equity
Sexual Harassment

33 | P a g e : D R A F T I D P 2 0 1 7 - 2 0 2 2
Substance and Traveling
Essential Serv ices
Disciplinary codes and Procedures
Human Resource and development
Grievance procedures
Job evaluation
Code of conduct for employees
Affirmative action
Delegations authorization
HIV/AIDS Policy
Employment Equity
Skills development
Remuneration Scales and allowances
Smoking policy
Uniforms and protective clothing
Resettlement
Payroll deductions
Information technology
Occupational health and safety
Exit Management policy
Official transport to attend funerals
Organizational rights Agreements
Special skills
Employee assistance and wellness
Official working hours and overtime
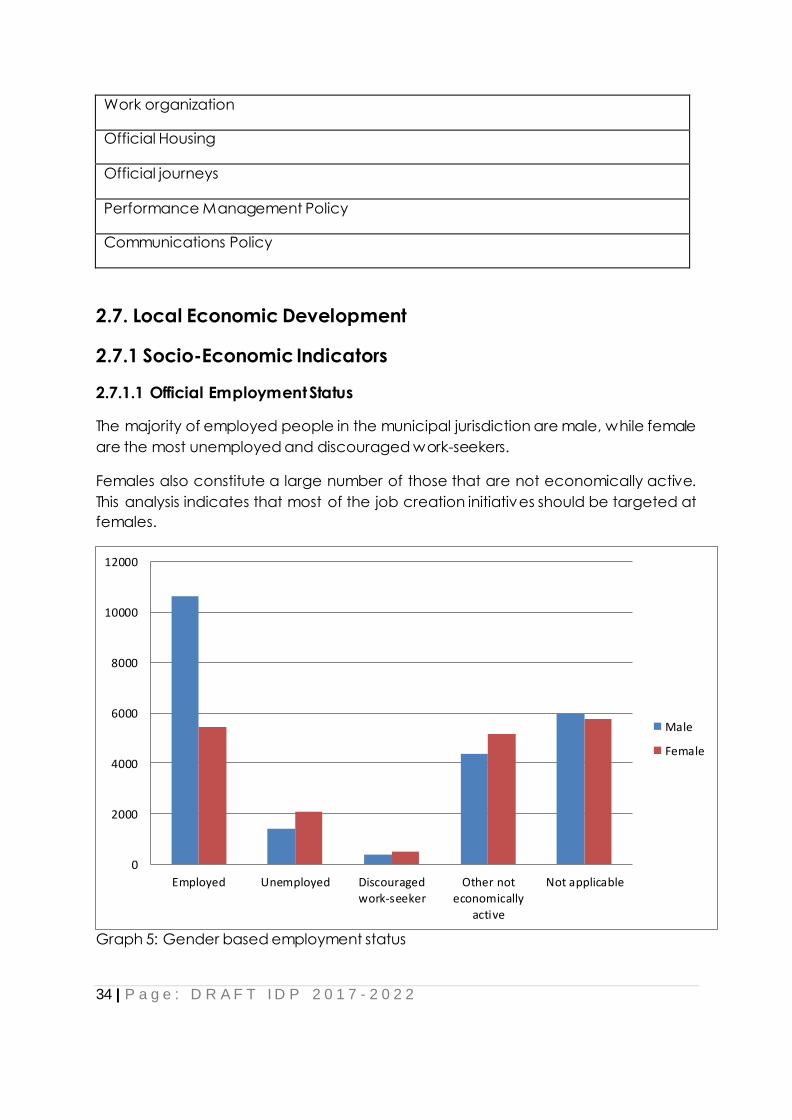
34 | P a g e : D R A F T I D P 2 0 1 7 - 2 0 2 2
Work organization
Official Housing
Official journeys
Performance Management Policy
Communications Policy
2.7. Local Economic Development
2.7.1 Socio-Economic Indicators
2.7.1.1 Official Employment Status
The majority of employed people in the municipal jurisdiction are male, while female
are the most unemployed and discouraged work-seekers.
Females also constitute a large number of those that are not economically active.
This analysis indicates that most of the job creation initiatives should be targeted at
females.
Graph 5: Gender based employment status
0
2000
4000
6000
8000
10000
12000
Employed Unemployed Discouraged
work-seekerOther not
economically
active
Not applicable
Male
Female

35 | P a g e : D R A F T I D P 2 0 1 7 - 2 0 2 2
Statssa (2011) indicates that 17,7% of the population of Gamagara were not
employed and 65% of those constitute youth.
Graph 6: Employment status
2.7.1.2 Education levels
Education is often a means to expand the range of career options a person may
choose from and influence a person’s income and ability to meet their basic needs.
Education levels and income levels thus become important indicators of human
development. From the table below it is clear that there is a high number of people
who has a secondary school education, followed by those who have matric. The
number of those with no schooling has increased from the 2007 survey to 2011. The
implication of the level of education indicate the the type of job opportunities that
can be accessed by the local communities.

36 | P a g e : D R A F T I D P 2 0 1 7 - 2 0 2 2
Graph 7: Highest education level
2.7.1.3 Income levels
“Income variable is one of the variables that measure indiv idual and household
welfare. I t is an important variable that assists in generating indicators relating to
poverty and development. Statistics on income levels also facilitate planning and
resources allocation” (Stats SA, Roambi).
The majority of people in the Gamagara municipal area have no monthly income, so
the developmental initiatives should try and improve these people’s lives.
0 2000 4000 6000 8000 10000 12000 14000 16000
No schooling
primary
secondary
Grade 12 /matric
Higher Education
Highest education level
Highest education level

37 | P a g e : D R A F T I D P 2 0 1 7 - 2 0 2 2
Graph 8: Individual monthly income
2.7.2 Economic indicators
Gamagara Local Municipality has become a significant player in the Northern Cape
Province and an important contributor to South Africa’s mining sector, and
international mining value chain. Thus making it a centre of concentration on the
development for providing relevant and up to date infrastructure to accommodate
such development. The municipality will benefit from infrastructure investments which
will drive and initiatives that have to characterize the town’s economic development
trajectory. The municipality has identify the economic pull and push factors, such as
education and training, research, entrepreneurship, community image and the arts.
Gamagara has planned to develop into a commercial and industrial town over and
above the mining economic spin-offs. I t has a potential to develop into an industrial
city by 2030 and a manufacturing city by 2060. The Northern Cape-Saldanah Bay
railway line as a national development corridor also present the municipaliy with the
opportunity to economically growth. Exploiting the benefits and spinoffs that could
be derived from the N14 road to Namibia could also contribute to the growth of the
municipal economy.
0 4000 8000 12000 16000
No income
R 1 - R 400
R 401 - R 800
R 801 - R 1 600
R 1 601 - R 3 200
R 3 201 - R 6 400
R 6 401 - R 12 800
R 12 801 - R 25 600
R 25 601 - R 51 200
R 51 201 - R 102 400
R 102 401 - R 204 800
R 204 801 or more
Unspecified
Not applicable
Individual monthly income
Individual monthly income

38 | P a g e : D R A F T I D P 2 0 1 7 - 2 0 2 2
2.7.2.1 Sectors
43% of the employed people are employed in the formal sector while 5% are those in
the informal sector. The importance of the informal sector in the local economy is
recognised, as it gives those who are not skilled an opportunity to create livelihoods
for themselves and their families. 5% are employed in private house, which means,
they work as gardeners, as housekeepers or child minders.
Graph 9: Sectors of employment
2.7.2.2 Tourism and SMMEs:
The following tourist attraction points exist namely, the mines, Kathu archeologically
complex consist of three heritage sites in and around the town of Kathu, which
includes the Kathu town lands, Kathu pan and the Best wood pan. The municipality
identified the need to draw on its heritage resources to generate jobs and alternate
economic streams for the socio- economic development of the communities it serves
and aligning it with other tourism opportunities. Focus has also been put on indigenous
knowledge as a possible tourist attracting activity. The Langeberg Hills has a potential
of being a tourist attraction based on its rich history. With assistance from the Mines
SLP programmes, SMME development programmes are derived over and above the
municipal initiative of SMME integration programme which consider the importance
of government and the mines procurement processes.

39 | P a g e : D R A F T I D P 2 0 1 7 - 2 0 2 2
2.7.2.3 Job creation initiatives
Prospects for economic growth and development within our Municipal area for the
short term and long term will focus on Textile Manufacturing, retail, solar energy
initiatives, the Kathu Supplier Park, Heritage & Tourism. In the development of the LED
value chain programme, which aims at developing a system that will promote
creating value in the production, distribution, after use of a service or a product.
The Kathu pan which is a heritage site and have attracted archaeologist from abroad
who are busy doing research on the artefacts found in this Municipal area – these
heritage site will make the Tourism sector to grow and also the upgrading of the Khai-
appel Resort will make an impact. Wholesale is expanding at a very high speed in
the area which will also create jobs, including the two Solar parks, namely Reisa and
Sishen Solar currently in operations and have already created significant amount of
jobs. Newly establsihed Solar plant named Kathu solar are currently under
construction and also contribute in the creation of jobs. The municipality aims to
diversify the job market. The municipality aims to increase job opportunities through
municipal procurement system including infrastructure development programme.
2.7.2.4 LED
Local Economic Development will include all the initiatives of job creation, tourism
and development of SMMEs. The main aim of LED in Gamagara is to play crucial role
in the planning of the town, so as to influence promotion of LED in the areas of
development. I t is thus seen as the major stakeholder in the town development
planning. I t startegically aims to influence policy and infrasturcture planning and
implementation. I t identifies development linkages in the town planning and
infrastucture planning and implementation. I t also intends to develop econommic
value chain in the municipal procurement system and influence the mines
procurement system to consider local economic transformation. I t has thus moved
away from the normative project based planning to strategic planning initiatives
which will identify bottlenecks in the development of local economic transformation
and devise means to unlock and untie such bottlenecks and to identify economic
developemtn potentials in and around the munnicipality especially regional
integration of Gamagara into the provincial and national economic systems.
2.8 Financial Plan
2.8.1 Municipal financial viability
Financial planning and v iability is determined mostly ability of the municipality to
identify sources of revenue and development of effective and efficient revenue
collection mechanism. This mechanism should be rev iewed every quarter of the year
to determine its effectiveness. The revenue collection and the expenditure patterns

40 | P a g e : D R A F T I D P 2 0 1 7 - 2 0 2 2
would then determine the financial v iability of the municipality. By 2016/17 mid-year
budget and performance rev iew, it was estimated that revenue collection was at
50%, which is cause for concern. The expenditure patterns were also spiking from
expectation form time to time due to rising needs from the community. Our
expenditure drivers over the years has been salaries, development of new
infrastructure and maintenance of old infrastructure. I t was also discovered that the
municipal tariffs were not cost based.
Reliance on property rates from the mines caused a dip in revenue as it was
discovered that valuation of the mines were not correctly done thus affected
municipal revenue. This has called the municipality to shift its planning from its previous
approaches to a new planning trajectory of risk and need based planning. The
municipality aims to source development funding from different stakeholders like
government grants, development agencies, mines and look for investment to
enhance the financial situation. The municipality further aims to establish Public-
Private Partnerships to promote development which will in turn generate funds for the
municipalities.
2.8.1.1 Auditor General’s finding
As required by section 188 of the Constitution of the Republic of South Africa, 1996
(Act No. 108 of 1996) and, section 4 of the Public Audit Act of South Africa, 2004 (Act
No. 25 of 2004) (PAA), the responsibility of the Auditor General is to express an opinion
on the municipality`s financial statements based on conducting an audit in
accordance with International Standards on Auditing.
The municipality received an unqualified audit opinion for the 2015/16 financial year.
The reason for the unqualified audit opinion was because of the execution of the
action plan by addressing all issues and queries raised by the Auditor General the
prev ious financial year.
The AG’s audit opinion for the last 3 years has been as follows:
2013/14 2014/15 2015/16
Qualified Qualified Unqualified
2.8.2 Financial management system
The municipality has set up a sound financial management system by drafting and
ensuring that Council approved financial management policies and procedures to
ensure uniformity and compliance to sound financial management. The following
table indicate the policies and procedure in place at the municipality. The following
policies was reviewed during the 2017/2018 financial year:

41 | P a g e : D R A F T I D P 2 0 1 7 - 2 0 2 2
Policy name
Review of Credit Control and Debt Collection Policy
Asset Management , Infrastructure Investment and Funding Policy
Budget Adjustment Policy
Supply Chain Management Policy
Budget and Virement policy
Cash Management and Investment Policy
Tarrif Policy
Financial Modeling and Scenario Planning policy
Property Rates Policy
Internal Audit and Risk Management function are prov ided as shared serv ices and
are overseen by the Audit and Performance Committee which sits regularly.
2.8.3 Operating Revenue Framework
For Gamagara Local Municipality to continue improving the quality of services provided to its
citizens it needs to generate the required revenue. In these tough economic times strong
revenue management is fundamental to the financial sustainabi lity of every municipality. The
reality is that we are faced with development backlogs and poverty. The expenditure required
to address these challenges will inevitably always exceed available funding; hence difficult
choices have to be made in relation to tariff increases and balancing expenditures against
realistically anticipated revenues.
The municipality’s revenue strategy is built around the following key components:
• National Treasury’s guidelines and macroeconomic policy;
• Growth in the municipality and continued economic development;
• Efficient revenue management, which aims to ensure a 95 per cent annual collection
rate for property rates and other key service charges;
• Electricity tariff increases as approved by the National Electricity Regulator of South
Africa (NERSA);
• Achievement of full cost recovery of specific user charges especially in relation to
trading services;
• Determining the tariff escalation rate by establishing/calculating the revenue
requirement of each service;
• The municipality’s Property Rates Policy approved in terms of the Municipal Property
Rates Act, 2004 (Act 6 of 2004) (MPRA) as amended;
• Increase ability to extend new services and recover costs;
• The municipality’s Indigent Policy and rendering of free basic services ; and
• Tariff policies of the municipality.
The following table is a summary of the 2017/18 MTREF (classified by main revenue source):
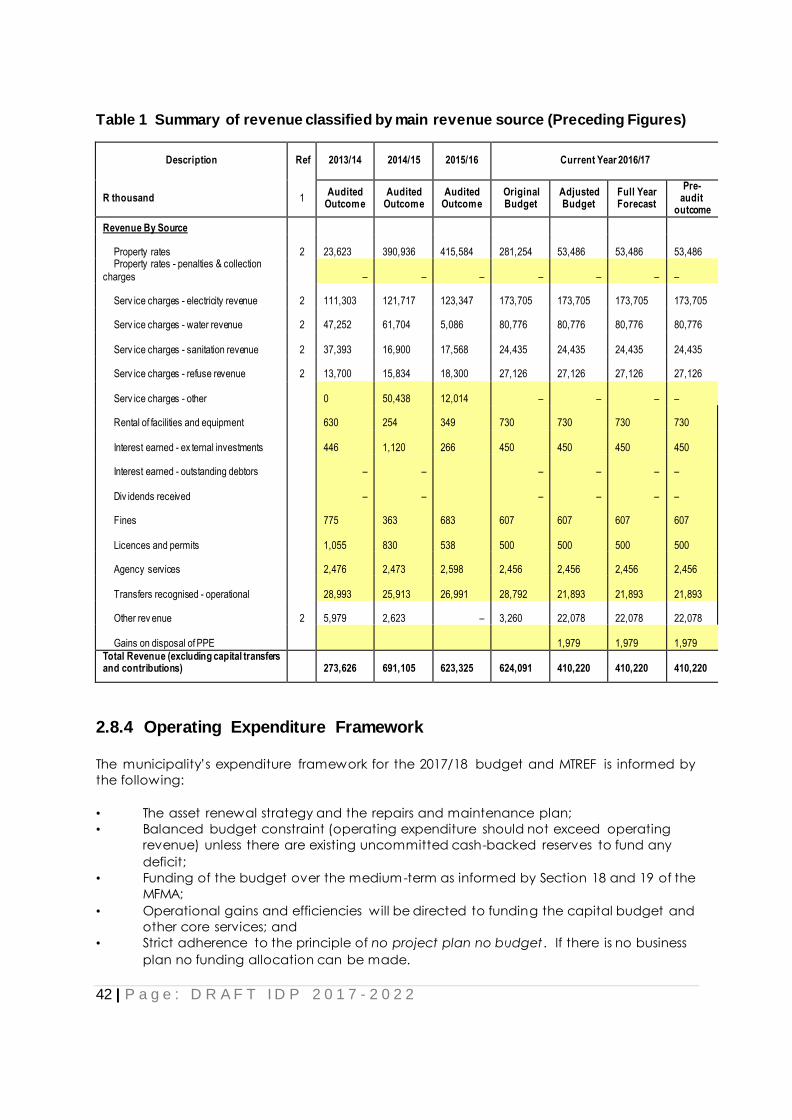
42 | P a g e : D R A F T I D P 2 0 1 7 - 2 0 2 2
Table 1 Summary of revenue classified by main revenue source (Preceding Figures)
Description Ref 2013/14 2014/15 2015/16 Current Year 2016/17
R thousand 1 Audited
Outcome Audited
Outcome Audited
Outcome Original Budget
Adjusted Budget
Full Year Forecast
Pre-audit
outcome
Revenue By Source
Property rates 2 23,623
390,936
415,584
281,254
53,486
53,486
53,486
Property rates - penalties & collection
charges – – – – – –
–
Serv ice charges - electricity revenue 2 111,303
121,717
123,347
173,705
173,705
173,705
173,705
Serv ice charges - water revenue 2 47,252
61,704
5,086
80,776
80,776
80,776
80,776
Serv ice charges - sanitation revenue 2 37,393
16,900
17,568
24,435
24,435
24,435
24,435
Serv ice charges - refuse revenue 2 13,700
15,834
18,300
27,126
27,126
27,126
27,126
Serv ice charges - other 0
50,438
12,014 – – –
–
Rental of facilities and equipment 630
254
349
730
730
730
730
Interest earned - ex ternal investments 446
1,120
266
450
450
450
450
Interest earned - outstanding debtors – – – – – –
Div idends received – – – – – –
Fines 775
363
683
607
607
607
607
Licences and permits 1,055
830
538
500
500
500
500
Agency services 2,476
2,473
2,598
2,456
2,456
2,456
2,456
Transfers recognised - operational
28,993
25,913
26,991
28,792
21,893
21,893
21,893
Other rev enue 2 5,979
2,623 –
3,260
22,078
22,078
22,078
Gains on disposal of PPE
1,979
1,979
1,979
Total Revenue (excluding capital transfers and contributions)
273,626
691,105
623,325
624,091
410,220
410,220
410,220
2.8.4 Operating Expenditure Framework
The municipality’s expenditure framework for the 2017/18 budget and MTREF is informed by
the following:
• The asset renewal strategy and the repairs and maintenance plan;
• Balanced budget constraint (operating expenditure should not exceed operating
revenue) unless there are existing uncommitted cash-backed reserves to fund any
deficit;
• Funding of the budget over the medium-term as informed by Section 18 and 19 of the
MFMA;
• Operational gains and efficiencies will be directed to funding the capital budget and
other core services; and
• Strict adherence to the principle of no project plan no budget . If there is no business
plan no funding allocation can be made.

43 | P a g e : D R A F T I D P 2 0 1 7 - 2 0 2 2
Table 2 Summary of operating expenditure by type (MTREF figures)
The budgeted allocation for employee related costs for the 2017/18 financial year totals R136
million, which equals 29 per cent of the total operating expenditure.
SALGA and Trade Unions (IMATU and SAMWU) in implementing The Salary and Wage
Collective Agreement for the period 1 July 2017 agreed to a 6,6 percent increase, which has
been factored in the increase of salaries.
The gazette for 2015 on the Remuneration of Public Office Bearers Act, 1998 (Act 20 of 1998)
which will indicate the actual costs to budget for the remuneration of councilors is still to be
released. The most recent proclamation of 5 percent in this regard has been taken into
account in compiling the Municipality’s final budget.
The provision of debt impairment was determined based on an annual collection rate of 95
per cent and the Debt Write-off Policy of the Municipality. For the 2017/18 financial year this
amount equates to R13 million. While this expenditure is considered to be a non-cash flow
item, it informed the total cost associated with rendering the services of the municipality, as
well as the municipality’s realistically anticipated revenues.
Provision for depreciation and asset impairment has been informed by the Municipality’s Asset
Management Policy. Depreciation is widely considered a proxy for the measurement of the
rate asset consumption. Budget appropriations in this regard total R61 million for the 2017/18
financial year and equates to 31 per cent of the total operating expenditure.
Finance charges consist primarily of the repayment of interest on long-term borrowing (cost of
capital). Finance charges make up 0.65 per cent or (R3 million) of operating expenditure
excluding annual redemption for 2016/17.
Bulk purchases amounts to 120 million or 26 per cent of the total operating expenditure and
are directly informed by the purchase of Electricity from Eskom and water from Sedibeng
Water. The annual price increases have been factored into the budget appropriations and
directly inform the revenue provisions. The expenditures include distribution losses.
Other materials and expenditure comprises of amongst others the purchase of fuel, diesel,
materials for maintenance, cleaning materials and chemicals. Other expenditure comprises
of various line items relating to the daily operations of the municipality. In line with the
Municipality’s repairs and maintenance plan this group of expenditure has been prioritized to
ensure sustainability of the Municipality’s infrastructure.
Figure 1 Main operational expenditure categories for the 2017/18 financial year
Description Ref 2013/14 2014/15 2015/16
R thousand 1Audited
Outcome
Audited
Outcome
Audited
Outcome
Original
Budget
Adjusted
Budget
Full Year
Forecast
Pre-audit
outcome
Budget Year
2017/18
Budget Year
+1 2018/19
Budget Year
+2 2019/20
2017/18 Medium Term Revenue &
Expenditure FrameworkCurrent Year 2016/17
Expenditure By Type
Employ ee related costs 2 – – – – – – – 136,477 152,297 169,818
Remuneration of councillors 4,449 4,747 5,061
Debt impairment 3 13,000 13,741 14,510
Depreciation & asset impairment 2 – – – – – – – 61,503 65,008 68,649
Finance charges 3,055 3,229 3,409
Bulk purchases 2 – – – – – – – 120,105 126,951 134,060
Other materials 8 10,839 11,454 12,099
Contracted serv ices – – – – – – – 42,304 44,795 47,295
Transfers and subsidies – – – – – – – – – –
Other ex penditure 4, 5 – – – – – – – 75,505 81,550 86,008
Loss on disposal of PPE
Total Expenditure – – – – – – – 467,237 503,774 540,909

44 | P a g e : D R A F T I D P 2 0 1 7 - 2 0 2 2
2.8.5 Capital expenditure
For 2017/18 an amount of R168 million has been appropriated for the development of
infrastructure which represents 81 per cent of the total capital budget. Community Services is
the second biggest capital appropriation with an allocation of R23 million followed by
Strategic Services with an allocation of R8 million. Please refer to table A5 and supporting table
SA36 on the detail of the capital budget.
2.9 Good governance and public participation
2.9.1 Democratic governance
In order to make sure that the IDP becomes a principal strategic document of the
municipality, the IDP Steering Committee and IDP Representative Forum also exists
and sits on a quarterly basis. IDP Imbizos are called regularly to ensure that community
needs are captured and prioritised in the IDP.
2.9.2 Communication
The municipality has an approved communication policy which guides and informs
how the municipality informs its residents on all municipal related issues. The strategy
seeks to encourage community members to actively participate in the affairs of the
municipality.
2.9.3 Governance structures
Audit Committees
Municipal Financial Management Act (MFMA) section 166 requires each municipality
to have an audit committee. The municipality does not have its own audit committee
and is thus sharing the serv ice with the John Taolo Gaetsewe District Municipality. The
audit committee is an independent advisory body which advises the municipal
council, the political office-bearers, the accounting officer and the management
staff of the municipality, on various matters.
Oversight Committees
The main purpose of the Municipal Public Accounts Committee (MPAC) is to exercise
oversight over the executive functionaries of council and to ensure good governance
in the municipality. This will include oversight over municipal entities. The MPAC has
been established and it is functional. MPAC is functional at the municipality ev en it
has challenges of sitting regularly as required.
Ward committee system
Five ward committees were establishment and are all in operation. There is, however,
a challenge regarding proper functioning of some ward committees due some

45 | P a g e : D R A F T I D P 2 0 1 7 - 2 0 2 2
members of some ward committees are not active, but the municipality intends to fill
vacant posts as soon as possible. The remaining members in these committees
continue with their normal functions.
Council Committees
The Gamagara Local Municipal Council was made up of 13 elected Councillors who
are sitting and chairing different Council Committees, namely:- Corporate Services
Portfolio Committee, Public Participation Infrastructure and Serv ice Delivery Portfolio
Committee, Community Serv ices Portfolio Committee, Technical Serv ices Portfolio
Committee, Finance Serv ices Portfolio Committee
The Gamagara Local Municipality is a plenary type of council consisting of 13
councillors, of which 7 Councillors were Ward Councillors and the other 6 Councillors
were Proportional Representatives. There is a good working relationship between
Mayor, Councillors’ and the Administration.
The main role of the municipal Council is to exercise legislative and executive authority
and to play an oversight role and make sure that public participation occurs. The
municipal Council consists of ten councillors. The Councillors chairs various
committees within the municipality such as: Corporate Services, Community Services
and Financial Serv ices, Public participation and Infrastructure services and Technical
Serv ices.
Chapter 3
ENVIRONMENTAL SCANNING
3.1 POLITICAL ENVIRONMENT
POLITICAL DYNAMICS
The 3rd August 2016 local government election brought a change in Gamagara Local
Municipality, in form and also in geo-political structures. Gamagara local municipality
used be comprised of 5 wards and has grown to a 7 ward municipality. The change
increased the number of Councillors generally from 10 to 13. The representation has
increased as political parties also diversity grew as political ideologies and
approaches contrasted more. Before Local Government Elections, the ANC was
represented by six (6) Councillors, DA was represented by three (3) Councillors and
COPE was represented by one (1) Councillors and there were 5 wards. The current set
up of Council is comprised for seven (7) Councillors from ANC, five (5) Councillors from
DA and one (1) Councillor from EFF. The Municipality is still ANC led. This politically
dynamics signalled some political change from the community expression during the
elections. I t is anticipated that it will breed more stability from the part of the
community.

46 | P a g e : D R A F T I D P 2 0 1 7 - 2 0 2 2
Understanding that the municipality is ANC-led, the provincial, regional and national
conference of the ANC leading to the ANC policy conference and then the ANC
national leadership election, these political developments could bring instability to its
structures which could affect the municipality and the rest of the country. Other
political parties might be going through the same process in preparation for the
national election in 2019, the build-up could affect the posture of the municipality and
also the country. Presence of the EFF and its strategies, which proved to be different
from the usual political approaches to development in the country and their coalition
with the DA could also turn the political arena in another direction that it would have
taken. The general relationship between and amongst political parties could sway the
manner in which this municipality has been doing its business which could be positive
or negative.
National legislations, Policies and Strategies
Strategic route that national government took to liberalise markets in an endeavour
to attract foreign investment, had culminated in introducing stiff competition
between the local emerging and the international markets. This has seen lot of local
businesses perishing and sprawling of conglomerations of business by foreign
businesses (e.g. Mass Mart). These led to in formalisation of businesses into tuck shops
and unregistered small businesses that causes a challenge to control. Most of these
tuckshop, are foreign owned and foodstuff they are selling cannot be authenticated
all the times as there is a shortage of Env ironmental Health Practitioners. Tuck shops
are not registered as businesses, which lead to loss tax revenue to the country.
Some legislations in the country like the Refugee Act, 1998 (Act, no 130 of 1998)
confers refugees rights similar to those of all South Africans as in section 27. Not
reasoning against the rights but control of influx is tasked to the Home Affairs
Department. Considering that the uncontrolled influx affects planning and distribution
of resources at Gamagara Local Municipality. There is a sprawl of tuck shops which
pose a challenge to control. From the public health point of v iew, the owners of the
tuck shops are not hygienic as they do not understand South African health
regulations and it is not easy to control them.
The International treaties like an American law called African Growth and Opportunity
Act, 2000 as amended in 2016, which fostered trade between SADC and America.
This agreement brought a tough time to the South African Chicken market which led
to closure of many chicken breeding companies and massive retrenchments. This
phenomenon was also observed with textile trade with China which brought cheap
fabric material which made it difficult for the local markets to compete, thus killing the
textile industry in the country.
Serv ice planning and provision at the local community level is not coordinated thus
pushing for more disintegrated approach. Prov incial, district and local departments’
set-up are not congruent and is difficult to coordinate as each plan indiv idually and

47 | P a g e : D R A F T I D P 2 0 1 7 - 2 0 2 2
implement their plan separately e.g. Public Works will determine their delivery plan
and implement to meet their mandate, similarly Agriculture Department will do so
separately, etc. and most cases their plans are not in line with the IDP. Integration of
serv ices from these institutions is very difficult in that their priorities are determined
differently.
3.2 ECONOMIC ENVIRONMENT
National Economic Policy
The space of national economic policy is facilitated from the macro, micro economic
policies and the economic modelling. There are about nine (9) Strategic Integrated
Projects (SIPs). The only registered SIP relevant to our district and municipality is the
Saldanah-Northern Cape Development Corridor.
Inflation
The March 2017 core inflation rate was 5, 50% with consumer price increase of 6.1%
year on year comparisons. Factors of inflation discussed below took cognisance that
the municipality is experiencing unemployment rate of 33, 7% and dependency rate
of 58, 1%.
Effects of inflation on distribution: Inflation has the effect of redistributing income
because prices of all factors do not in the same proportion. Change in the value of
money also result in the redistribution of wealth, partly because during inflation there
is no uniform rise in prices and partly because debts are expressed in terms of
money. Rural areas are mostly affected by inflation because income is largely
dependent on wage earners and the most hit will be the unemployed which
constitute 33, 7% of the productive section of the populace of Gamagara. The poor
tends to spend more when buying commodities thus decreasing access to basic
serv ices and commodities. Inflation is a kind of hidden tad, highly harmful to the
poorer sections of society. Thus, poor become poorer
Effects of inflation on wage earners: Wage earners generally suffer during inflation,
despite the fact that they obtain a wage rise to counter the rise in the cost of
liv ing. However, wages do not rise as much as the rise in price of those commodities
which the workers consume. Further, wages are allowed to rise much later than the
rise in prices. Thus, there is a lag between the two, which works to the disadvantage
of the worker. Considering that Gamagara has dependency rate of 58, 1%, most
sector of the population will be negatively by inflation.
Effects of inflation on middle class and salaried persons: The hardest hit are the
persons who receive fixed income, usually called the middle class. Persons who live
on past sav ings, fixed interest or rent, pensions, salaries etc., suffer during periods or
rising price as their incomes remain fixed. The middle class who by hard work take care of children's education, livelihood in the times of sickness and old age and
accommodate day to day expenses find it difficult to surv ive the times of serious
inflation. This translates to 58,1 % of the populace depend on them one way or the
other.

48 | P a g e : D R A F T I D P 2 0 1 7 - 2 0 2 2
Effects of inflation on Farmers: The price of farm products goes up faster than
costs. Costs lag behind prices of product received by the farmers. Considering that
agricultural activ ities in Gamagara is stock farming which means maintenance of
stock ranging from water, medicines and fodder purchases will affect these farmers,
transporting of stock to stock auctions usually travelling more than 40km to the
auction.
Effects of inflation on the entrepreneurs: When prices rise, producers, traders,
speculators and entrepreneurs gain on account of windfall profits because prices rise
at a faster rate than the cost of production. Besides, there is time-lag between the
price rise and the increase in cost. Moreover producers gain because the prices of
their stock go up due to inflation. Also they generally being borrowers of money for
business purpose, stand to gain.
Effects of inflation on Investors: Different kinds of investors are affected differently by
inflation. Investors may withdraw their investing and thus causing more job losses and
increasing the rate of unemployment.
Effects of inflation on public morale: inflation result in arbitrary redistribution of wealth
favouring businessmen and debts, and hurting consumers, creditors, petty shop-
keepers, small investors and fixed income earners. This lowers the public morale. The
ethical standards and the public morale falls to miserably low levels during the period
of hyper-inflation.
Effects of inflation on Gamagara: South Africa adopted a mixed economy system; the
public sector is affected by fluctuations in price level. As prices rise, the municipality
has to spend more on goods and serv ices, including raw materials, for carrying
through their projects. Estimates are revised and taxes are raised during the period of
inflation. This hamper serv ice delivery as the money budgeted for serv ices and
projects experience budgetary variance and fail to prov ide some of the services
especially the infrastructure projects.
Global business climate also contribute towards economic situation at Gamagara.
I ssues like global recession affect the economy of the municipality in that most of the
minerals produced in the region are sold to international markets e.g. China, Russia,
India, America, etc. and uncertainty on their economic v iability, determines flow of
the market.
3.3 LOCAL SITUATION
The drop in the commodity demand and prices affect most Manganese Ore and Iron
Ore mines. These mines are the surrounding Gamagara and they contribute largely
to the economy of the town. The contribution come in a form of rates and taxes from
employees that they build houses for in the municipal area, bulk serv ices charges for
development in the area, they support the growth of local business. When the mines
are not performing well, that has ripple effect on the municipal economy. When they
retrench, the municipality become a loser in the whole equation. The mines around
the municipality retrenched more than 4 000 people which create a burden of
people who cannot pay for services and closure of some key businesses in the area.

49 | P a g e : D R A F T I D P 2 0 1 7 - 2 0 2 2
3.4 Social Environment
Perception of the communities about the municipality determines their participation
in municipal activ ities. Paying of services is one fundamental matter that relates more
to community perception and attitudes. Demographic changes affect the societal
environment in that they bring new societal culture which will remain dynamic and in
constant change. Societal ownership of municipal activ ities and assets is very critical
in proper functioning of the municipality.
Level of literacy and employment rate also affect the functioning of the municipality.
The employment rate will only grow once the skills level improves. Currently the neighbouring mines require a minimum of grade 10 to be employed. This create a
barrier to the employment of those that do not have grade 10 to be absorbed in the
labour market thus increase the unemployment rate and the dependency rate in the
municipality and ultimately payment of services will also suffer. The situation will affect
the confidence level of the community if the municipality cannot afford to provide
some of the serv ices that communities are used to.
Literacy level also determines the general improvement of lifestyle of people.
Understanding that 63% of the Gamagara population are in production age group,
and only 8,4% are skilled and only 20% have completed matric, the situation affect
the municipal financial situation as 58,1% of these people are depending on 21,29%
employed and government grants, this means that the number of indigents increases
and less generation of revenue for the municipality. Further to the dependency is the
ratio is the 42, 7% households are headed by females and 0, 8 households are headed
by children.
Health status of the population also contributes a burden to the municipal functioning
as most of the time families lose bread winners and increase the level of poverty
amongst these families.
3.5 Technological Environment
Rapid development of technology affects the functioning of the municipality. The
advent of mobile communication and other communication technology brings
positive spin off if used and regulated properly. The use of social networks brings both
negative and positive development in the municipal functioning. Key factor with
technology in the municipality is communication and census 2011 indicates that 25,
63% of the population owns cell phones, 21, 57% owns television, 19, 38% own radio,
3, 85% own computer and 6, 33% have access to the internet. An average of 12, 75%
of the populace have access to communication in the municipality.
Access refers to availability of communication infrastructure, however usage of such
infrastructure is hampered by the cost of enabling tools like expensive data and high
cost of airtime. Availability of selling points of these tools i.e. airtime and data, poses
another challenge in areas that are less developed like the newly established
community of Babatas. The introduction of the pay TV channel multichoice has
improved access of information to those who can afford. In all instances the poor are
left lagging behind.
50 | P a g e : D R A F T I D P 2 0 1 7 - 2 0 2 2
4 RISK ANALYSIS AND MANAGEMENT
Considering that Gamagara Local Municipality operates in risk laden environment, it
has from time to time, assess the risks that may affects its operations to obtain its set
objectives. The following risk factors were identified during the strategic planning
session.
LIMITED WATER SOURCES AND RESOURCES
Gamagara Local Municipality is reliant on Sedibeng Water and Kumba Mine for water
supply. Sedibeng Water has been having some challenges in prov iding water
consistently to areas that are 100% reliant to its supply like in Olifantshoek. When
Sedibeng Water fails to supply, community of Olifantshoek stay without water until
such time that Sedibeng Water is capable of supplying water again. This is due to lack
of secondary water sources in the Olifantshoek area. At the same failure of Sedibeng
water to supply water, Kathu suffers low pressure water provision and a drop in water
levels in the dams. In Kathu, however, Kumba mine is augmenting water supply. The
challenge with Kumba supply is that Kumba cannot be drawn into a contract for
consistent water supply as they can guarantee consistent supply. This put the
municipality at bigger risk of consistent provision of water should Sedibeng Water and
Kumba fail to supply.
Mapoteng and Dibeng Communities are supplied from boreholes. Mapoteng is
however supplied from Sedibeng Water, Kumba Mine and Khai Appel boreholes. The
water from the Khai Appel sources has limited capacity as it only prov ide a certain
section of Mapoteng. Dibeng community is solely reliant on ground water supply. The
growth of the community threatens the potential and capacity of the aquifers. The
yield capacity of the aquifers has reached capacity as the recharge amount has
decreased. Lack of alternative source of water may hamper the growth and
development of the town.
All areas in Gamagara has limited water storage facilities to cater for the growth of
the towns. The minimum requirements for water storage should at least be able to
supply water after 48hours (to the community) of any breakdown or maintenance of
water source or water supply infrastructure. The Olifantshoek reservoir is not complaint
to the norm due to the rapid growth of the population in the area. The municipality is
currently building a second reservoir to ensure that water supply could be at least 72
hours to cater for future growth of the town. Kathu reservoirs are currently at 48hours
supply, however due to sharing with Mapoteng, the capacity is under immense
pressure. The supply from Khai Appel is not stored as it supplied directly into the
network due to lack of storage facilities. Dibeng water storage is not complaint to the
48 hours supply norm, the rapid growth in the area has also put pressure on the storage
facilities.

51 | P a g e : D R A F T I D P 2 0 1 7 - 2 0 2 2
• CONTROLS IN PLACE
There are three water sources in Gamagara. Sedibeng Water supply water to
Olifantshoek and Kathu and Dibeng and portion of Mapoteng are supplied from
boreholes.
There is a water reservoir being built in Olifantshoek to address the storage issue.
• MITIGATING MEASURES
Investigate the aquifers ability to supply more water in Khai Appel and develop more
boreholes to increase supply to Mapoteng
Construct the two reservoirs and elevated towers as planned in Kathu during the 5
year IDP programme.
Negotiate with Department of Water and Sanitation to divert the Sedibeng Water
pipeline to reach Dibeng Community so as to prov ide secondary source of water to
the Dibeng community.
INADEQUATE REVENUE COLLECTION MEASURES
The municipality was using an external financial management system which
presented the municipality with myriad of problems. These were revealed in the mid-
year budget assessment report. These include faulty billing and slow production of bills
due to regular attack by malware. This resulted in late billing and also billing R4 million
short, by billing R15 million instead of R19 million. The system led to serious revenue loss
to the municipality and dissatisfaction of the community.
Inconsistent and inefficient implementation of Council approved policies i.e. Credit
Control Policy led to failing revenue collection measures. It was also realised that there
is no by-laws that deals with credit control, and that coupled with community
education programmes that will raise awareness on the obligation to pay for services
consumed. Poor contract management is at the centre of inability to collect revenue,
the municipality fails to recognise that relationship between the consumers of services
and the municipality is a legal contract that binds the municipality to prov ide services
and the consumer to pay for such serv ices thus the municipality has the right to cut
prov ision of services that are not paid for.
• CONTROLS IN PLACE
The municipality has Council approved Credit Control and Debt Collection Policies.
The municipality has the revenue enhancement strategy in place.
• MITIGATION MEASURES
Develop and implement by-laws on revenue collection and debt collection. Develop
public awareness programme that will raise awareness to the community on the
importance, the right of the municipality to collect revenue for services provided etc.
Induct all employees on the policies and how to implement these policies especially
to those entrusted with revenue collection and debt collection. Manage contracts
related to financial management system to ensure efficiency, skill transfer from service
providers and ensure effectiveness of the system in meeting municipal objectives.
Develop and monitor performance management system for service providers.

52 | P a g e : D R A F T I D P 2 0 1 7 - 2 0 2 2
LIMITED SERVICES INFRASTRUCTURE
Section 4 (2) (d) (f) and (g) of the Municipal Systems Act, 2000 (Act, no.32 of 2000)
bind the municipality to prov ide services in an equitable manner. I t is further
understood that these services should be provided within the financial capability of
the municipality. Prov ision of services is directly linked to infrastructure both bulk and
reticulation infrastructure. An infrastructure assessment revealed that water,
electricity, waste water and solid waste bulk (storage) infrastructures were running at
maximum capacity. The state of infrastructure dictates that no further development
can take place as there will be no provision of services for such development.
• CONTROLS IN PLACE
The designs for infrastructure is in place, money to construct is not available.
• MITIGATION MEASURES
Source funds to construct infrastructure. Establish a committee to identify funding
agencies and apply for funds for development.
NO OF MATERIAL STORES
Most of the serv ices infrastructure is old and need constant repairs. The turn-around
time to repair of infrastructure in need of repair is too long due to lack of material
stores. I t also affect the response to community complaints that take too long to be
responded to. This tend to affect the integrity and reputation of the municipality.
Materials are acquired through the lengthy process of SCM and on the need basis
which is Adhoc.
• CONTROLS IN PLACE
There is a building at Technical Serv ices Workshop that can be revamped into material
stores.
• MITIGATION MEASURES
Revamp the building at Technical Workshop and turn it into Material Stores.
POOR COMPLAINT MANAGEMENT SYSTEM
There are two systems of dealing with complaints from the community. There is a call
centre and customer care serv ices. The two systems are not integrated nor working
together, thus allowing incoherent approach to complaint management. This lead to
matters taking too long to be resolved or attended to.
• CONTROLS IN PLACE
There is a call centre and customer care unit.

53 | P a g e : D R A F T I D P 2 0 1 7 - 2 0 2 2
• MITIGATION MEASURES
Integrate the two available services and ensure that they are managed from the
department
INADEQUATE IT SECURITY SYSTEM Municipality does not have any on-site and off-site IT back-up system. Should the
building burn or the server be affected by malware, the municipality might lose the
most valuable information.
• CONTROLS IN PLACE There are no controls in place
• MITIGATION MEASURES
Install the on-site back up system and acquire the services of off-site back-up system
A CULTURE OF NON-REPORTING The municipality is experiencing a culture of not reporting at all levels of the
municipality. Employees and management are keen to do the work but fails to report,
as such funds have been withheld or suspended because of this culture. The
municipality is rated low by stakeholders due to critical information of the
achievement of the municipality not being recorded. This is a reputational risk to the
municipality and may affect future funding to the municipality by funding institutions.
• CONTROLS IN PLACE
There are policies in place that could be used to ensure that the culture is eradicated
• MITIGATION MEASURES
Improve staff morale by implementing the Employee Wellness Programme
Improve institutional responsiveness to service delivery
Implement the organisational policies
UNAVAILABILITY OF LAND FOR DEVELOPMENT
Most land parcels belong to private persons and companies
Unaffordable land parcels for business development especially for the prev iously
disadvantaged individuals
Land disposal policy does not promote SMME development
• CONTROLS IN PLACE
There are no controls
• MITIGATION MEASURES
Allocate land for SMME development and make it available through various means,
i.e. lease or rental;
Make special provisions for SMME development in the land disposal policy;

54 | P a g e : D R A F T I D P 2 0 1 7 - 2 0 2 2
5 SWOT ANALYSIS
Strengths
High potential for economic growth:
• The municipality is at the centre of all economic activ ities around the mining
industry in the region. The industrial area growth and development is very
phenomenal as many small industries and big industry come to the area so as
to serve the mining needs in the area.
• Small businesses have the potential to grow and serve the improving
commercial and mining economic set-up. These businesses they either
prov ide mines with equipment or the sub-contract to big contractors in the
mine.
High tourism potential:
• Gamagara has a vast number of heritage sites that still need to be exploited.
These include religious monuments and heritage site, the oasis of the Kalahari,
the caves, etc.
Political maturity and stability
• Co-operation between political parties in delivering services is a progressive
one
• Ward Committees are functional and meeting their obligations as required
• There is strong political leadership and support to the municipal functioning
Weaknesses
Infrastructure:
• Inadequate infrastructure to cater for the rapid development in the
municipality
• Ageing infrastructure
Ineffective internal systems and controls:
• Communicating available systems and controls to junior officials is lacking
and leading to some of the crucial tasks not being performed accordingly
e.g. delegation of power
• Culture of non-payment is prevalent in the municipality because credit
control policy is not fully implemented.
• The municipality does not have a culture of retaining skilled personnel due to
inconsistent implementation of policies or lack of induction of new
employees;
• Lack of by-laws to guide and enforce compliance e.g. credit control

55 | P a g e : D R A F T I D P 2 0 1 7 - 2 0 2 2
Threats
• National and international economic trends may destabilise the municipality
to achieve its goals
• Retrenchments from the mines may affect the municipal revenue
• Influx of job seekers in the area is causing infrastructure system failure as they
overload the system
Opportunities
Developmental potential
• Integration of stakeholder contribution to the development of the
municipality is possible e.g. sector departments, mining industry, commercial
industry, agricultural industry and tourism industry.
• There is a potential to acquire more land for development
• Improve infrastructure and create jobs
Internal systems could be improved
• Can improve on the credit control system to encourage culture of payment
for services and increase municipal revenue.
• Improve customer care and uphold to the Batho Pele Principle
• Enhance the LED and Tourism markets by disseminating the LED and Tourism
strategy to members of the community using various methods of awareness.
6 VISION
BUILD PROSPEROUS AND SUSTAINABLE COMMUNITIES
7 MISSION
▪ Providing universal access to basic services
▪ Attain safe and healthy environment
▪ Strengthening stakeholders relations
▪ Promoting active citizenry in Local Government affairs
▪ Providing sustainable services to our communities
▪ Being developmental focus institution
▪ Promote social and economic development.

56 | P a g e : D R A F T I D P 2 0 1 7 - 2 0 2 2
8 VALUES
As stipulated in section 195 of the Constitution:
▪ Transparency
▪ Accountability
▪ Integrity
▪ Responsiveness
▪ Accessibility
▪ Professionalism
▪ Ethical
9 Strategic Goals
9.1 Objectives
Six overarching objectives were identified as aligned to the six KPA’s. The municipality
was still operating within its mandate and its strategic direction but there were some
areas that were impeding it from functioning optimally and those were lack of
integrated approach to serv ice planning, delivery and evaluation. Sector
departments and other stakeholders did not know the better procedure to work with
the municipality and they contributed to activ ities that were not part of the IDP thus
raising discontent from other sectors of the community and causing incoherent
approach to service delivery. Municipality’s internal systems were also found to be
inadequate to facilitate coordination of serv ices and general internal management
systems were not adequate.
In addressing the challenges noted above, the municipality has developed different
intervention strategies, which include increasing the capacity of the services
infrastructure in the entire municipal area, spatial integration, strengthening principles
of good governance, and establishment of a development committee that will focus
on developing funding models for different IDP projects and find funds for such
projects. The committee will be established from the management echelons of the
municipality. The committee shall also advice management on projects readiness
and prepare systems for implementation.
Considering the Kathu do not have distinguishable CBD and what is considered to be
the CBD is undergoing a state of decay, the municipal want to embark on the urban
renewal project of the Kameeldoring and Shoprite area. This will include identification
of urban spaces that are badly utilised and change them into useable spaces. This
will include restructuring some of the town set-up.

57 | P a g e : D R A F T I D P 2 0 1 7 - 2 0 2 2
Municipality intends to facilitate the establishment of the Kathu Supplier Park, which
will bring diversity into the municipal economy. The park is intended to bring in non-
mining manufacturing activ ities and other activities.
The Olifantshoek CBD is not attractive in terms of its state of decay and the general
use of space. The town is the prime spot of development and attraction of investors,
however that is hampered by the arrangement and use of space. Municipality aims
to do an urban renewal project of the Olifantshoek CBD to restructure the
arrangement and use of space, greening of the CBD and positioning of commercial
buildings. The purpose of the project is to ignite the investor confidence and job
creation in the area. As an extension of the project, municipality aims to facilitate the
building of a textile factory which will produce Personal Protective Equipments,
Uniform for different sectors of the economy and schools to designer clothing for retail
shops. I t is envisaged that this will stimulate other development opportunities like
shopping mall, etc.
The following strategic objectives were identified as the main vehicles towards
“building prosperous and sustainable communities”. Strategic objectives are
programmatised into Key Focus Areas which will direct actions/activities and projects
towards achieving the strategic objectives and ultimately the v ision.
STRATEGIC OBJECTIVE 1:
Improve life for all through sustainable infrastructure investment and development:
o KEY FOCUS AREA :Provision of Planning and Development Services
This Key Focus Area aims at improving the spatial dimension of the municipality. I t is
envisaged that through progressive land use planning, economic development could
be unlocked and stimulated through spatial locations of activ ities and amenities.
Spatial planning and land use planning build a resounding relationship between
human settlement, transportation, environmental resilience, economic development
and human development, poverty alleviation and reduction of unemployment rate.
Gamagara is spatially disintegrated and dislodged the poor from economic
development due to poor spatial planning. Communities of Dibeng, Olifantshoek and
Mapoteng are not connected to any v iable economic environment, further to that
there public transport in the municipal area. This Key Focus Area aims to bring spatial
change through the development of Integrated Urban Development Framework
which would guide the Urban Regeneration programme of Kathu and Olifantshoek
as key programmes of integration and development. Infrastructure was found to be
main source of development arrest in Gamagara. Disintegrated approach to
infrastructure planning led to poor planning, implementation and serv ice delivery.

58 | P a g e : D R A F T I D P 2 0 1 7 - 2 0 2 2
Kathu as the main economic centre, is alienating the poor by its land prices w hich are
so steep that only the rich can afford to purchase land in the area. Due to rapid
growth in the municipality, flaunting of the Scheme Regulations and the National
Building Regulation and Building Standards Act, 1977 (Act, no.103 of 1997).
OPERATIONAL OBJECTIVE START DATE END DATE PROPOSED
BUDGET
FUNDING
SOURCE
Human Settlement Planning and
Development
July 2017 January 2018 R0 Internal
serv ices
Conducting Land Audit and
Development of the Spatial
Development Framework
October 2017 September 2018 R 3 000 000 Internal funds
Development of the
Environmental Management
Framework
October 2017 September 2018 R 1 500 000 Internal Funds
Development of the
Environmental Resources
Management Plan
October 2017 September 2018 R
1 500 000.
00
Donor to be
established
Development of the Integrated
Urban Development Strategy
(Urban Renewal Plan, Small Town
Regeneration Strategy, etc.)
July 2018 June 2019 R 3 000 000.
00
Donor to be
established
Development of Integrated
Transport Plan
July 2017 June 2018 R0
Development of Public Transport
Plan
July 2018 June 2019 R0
Industrial Development Strategy October 2018 June 2019 R 1 500 000.
00
Donor to be
established
Development of the Integrated
Infrastructure Development and
Management Plan
July 2018 June 2019 R 3 500 000.
00
Donor to be
established
Urban regeneration of
Olifantshoek and Kathu
October 2019 June 2022 Budget to
be
established
by
integrated
Donor to be
established

59 | P a g e : D R A F T I D P 2 0 1 7 - 2 0 2 2
Urban
Developm
ent
Strategy
Land Use Management and
Building Control
Continuous Continuous
o KEY FOCUS AREA : Provision of Basic Services
▪ Water Provision Services
Gamagara Local Municipality is known for service excellence as most of the area are
prov ided with high level of services. Communities are prov ided with household
connections instead of RDP standard of communal taps. The major challenge is that
there is no bulk water supply for future development, all the bulk water storage
facilities at full capacity. Water sources were found not be enough as the municipality
is relying mostly on Sedibeng Water and Sishen Mine. Sishen Mine has not committed
to consistent water supply as they can guarantee such supply. Dibeng is entirely
dependent on underground water, which is finite and has recorded reduced yielding
capacity over the years.
OPERATIONAL OBJECTIVE START DATE END DATE PROPOSED
BUDGET
FUNDING
SOURCE
Identify and develop new water
sources to increase water
sources and capacity
July 2017 January 2018 R 1 200 000.
00
Internal funds
Divert Sedibeng Water Pipeline
to go through Dibeng
July 2017
Increase the bulk facilities to
cater for future development in
the municipal area (storage and
supply)
October 2018 September
2022
To be
informed by
the
Infrastructure
Development
Plan
Donor (s) to be
established
Improve water prov ision
infrastructure by consistent
maintenance (Water
On going On going To be
determined
by the
Infrastructure
Internal Funds
60 | P a g e : D R A F T I D P 2 0 1 7 - 2 0 2 2
infrastructure maintenance
plan)
Development
Plan
Reduce access to water
backlog by 90% in the 5 year
period
April 2018 June 2022 To be
informed by
the
Infrastructure
Development
plan
Donor (s) to be
established
Meet the Department of Water
and Sanitation requirements for
resources and staff compliments
in the Water Serv ices Division
July 2018 On-going Internal funds
Reach the blue drop status On-going June 2020 To be
informed by
the
Infrastructure
Development
plan
Combination of
funds i.e.
internal and
grants
▪ Sewerage Management Services
Gamagara Local Municipality is known for service excellence as most of the area are
prov ided with high level of services. The major challenge is that there is no bulk waste
water treatment facilities for future development.
OPERATIONAL OBJECTIVE START DATE END DATE PROPOSED
BUDGET
FUNDING
SOURCE
Upgrade all the sewage
treatment plant
On-going On-going To be
informed by
the
Infrastructure
Development
Plan
Internal funds
Increase the bulk sewerage
facilities to cater for future
development in the municipal
area (pipeline and treatment
works)
October 2018 September
2022
To be
informed by
the
Infrastructure
Donor (s) to be
established

61 | P a g e : D R A F T I D P 2 0 1 7 - 2 0 2 2
Development
Plan
Improve sewerage
infrastructure by consistent
maintenance (Sewerage
Infrastructure maintenance
plan)
On going On going To be
determined
by the
Infrastructure
Development
Plan
Internal Funds
Reduce access to sanitation
backlog by 90% in the 5 year
period
April 2018 June 2022 To be
informed by
the
Infrastructure
Development
plan
Donor (s) to be
established
Meet the Department of Water
and Sanitation requirements for
resources and staff
compliments in the Sanitation
Serv ices Division
July 2018 On-going Internal funds
Reach the green drop status On-going June 2020 To be
informed by
the
Infrastructure
Development
plan
Combination
of funds i.e.
internal and
grants
▪ Electricity Provision Services
The major challenge is that there is no enough bulk electricity supply for future
development.
OPERATIONAL OBJECTIVE START DATE END DATE PROPOSED
BUDGET
FUNDING
SOURCE
Upgrade all the electricity
facilities
On-going On-going To be
informed by
the
Infrastructure
Development
Plan
Internal funds

62 | P a g e : D R A F T I D P 2 0 1 7 - 2 0 2 2
Increase the bulk Infrastructure
to cater for future development
in the municipal area
October 2018 September
2022
To be
informed by
the
Infrastructure
Development
Plan
Donor (s) to be
established
Improve electrification
infrastructure by consistent
maintenance
(Electricity infrastructure
maintenance plan)
On going On going To be
determined
by the
Infrastructure
Development
Plan
Internal Funds
Reduce access to sanitation
backlog by 90% in the 5 year
period
April 2018 June 2022 To be
informed by
the
Infrastructure
Development
plan
Donor (s) to be
established
STRATEGIC OBJECTIVE 2:
To ensure the financial sustainability of the municipality is in order and to adhere
to statutory requirements
▪ KEY FOCUS AREA: Budgeting and Funding
Budgeting is fundamental planning tool which assist the municipality to understand its
development funding capabilties. I t is thus essential to prioritise budget in the
planning, implementation, monitoring and control phases of development in the
municipality. Compliance to MSCOA relies much on correct budgeting, i.e.
projectising of votes and activities. Propoer funding of development acitivities.
OPERATIONAL OBJECTIVE START DATE END DATE PROPOSED
BUDGET
FUNDING
SOURCE
Effective and efficent
management of the budget to
comply with MSCOA
July 2017 On-going Opex
Implement project based
budgeting and funding
July 2017 On-going Opex

63 | P a g e : D R A F T I D P 2 0 1 7 - 2 0 2 2
Distribute monthly budget
figures to all the Director for their
expenditure planning and
control
On going On going Opex
▪ KEY FOCUS AREA: Capital Expenditure
The municipality relies on its capital expenditure for development and building
serv ices infrastructure. Properly managed infrastructure expenditure will lead to
improved service delivery.
OPERATIONAL
OBJECTIVE
START DATE END DATE PROPOSED
BUDGET
FUNDING
SOURCE
Improve capital
expenditure processes
July 2017 On-going Opex
▪ KEY FOCUS AREA: Operational Expenditure and Cost Management
Municipality requires efficient use of resources and cost implications should be based
on sensible to their cost implications to the municipality and serv ice delivery.
OPERATIONAL
OBJECTIVE
START DATE END DATE PROPOSED
BUDGET
FUNDING
SOURCE
Improve management
systems and processes of
expenditure and cost
management
July 2017 On-going Opex
▪ KEY FOCUS AREA: Revenue Management
Revenue is the cornerstone of development of the municipality. Revenue collection
was found to be a challenge at Gamagara Local Municipality, which is also linked to
faulty billing system. Strenghthening of revenue collection will assist the municipality to
plan and provide quality services to the communnity.
OPERATIONAL
OBJECTIVE
START DATE END DATE PROPOSED
BUDGET
FUNDING
SOURCE
Improve the billing system On-going On-going

64 | P a g e : D R A F T I D P 2 0 1 7 - 2 0 2 2
Improve the revenue
collection methods
July 2017 On-going Opex
Implement the revenue
collection and credit
control policy
July 2017 On-going Opex
Improve the indigent
register
On going On going Opex
▪ KEY FOCUS AREA: Supply Chain Management
Supply chain management is the at the core of development in the municipality.
Efficient and effective supply chain management forms a strategic tool for economic
transformation of the municipality and its residents. I t is the main tool to facilitate
enterprise development. Timeous processing of procurement development
infrastructure become fundamental in improved service delivery.
OPERATIONAL
OBJECTIVE
START DATE END DATE PROPOSED
BUDGET
FUNDING
SOURCE
Improve the SCM
processes
July 2017 On-going Opex
Fast-track enterprise
development through
SCM processes
July 2017 On-going Opex
Review the SCM policies
to integrate LED aspects
in it.
July 2017 January 2018 Opex
▪ KEY FOCUS AREA: Asset Management
There has been an improvement on the management of assets, however lack of
proper system of recording and managing asset create a challenge. Lack of
integrative sytem that links activ ities at Infrastructure and serv ices department,
compromises proper management of assets.
OPERATIONAL
OBJECTIVE
START DATE END DATE PROPOSED
BUDGET
FUNDING
SOURCE
Improve management of
assets
July 2017 On-going Opex

65 | P a g e : D R A F T I D P 2 0 1 7 - 2 0 2 2
▪ KEY FOCUS AREA: Financial Reporting
Financial reporting is not only a legislative requirement but also a measure to financial
performance of the municipality. Reporting in general was found to be a challenge,
improving on it, will assit the municipality to be complaint.
OPERATIONAL
OBJECTIVE
START DATE END DATE PROPOSED
BUDGET
FUNDING
SOURCE
Improve financial
reporting
July 2017 On-going Opex
STRATEGIC OBJECTIVE 3:
To promote good governance through enhanced stakeholder participation
▪ KEY FOCUS AREA: Institutional Development (Governance Systems,
Policies, By-Laws and Procedures)
At the core of municipal functions, is good governance is fundamental in creating a
conducive environment for systematic approach to serv ice delivery. Good
Governance prov ide clarity on the relationship between different spheres of
government and between the municipality and the community. These provide for
structured engagement within the municipality and with the community.
OPERATIONAL OBJECTIVE START DATE END DATE PROPOSED
BUDGET
FUNDING
SOURCE
Develop governance
systems:
Improve the Document
Management System
On-going On-going Internal funds
Coordinate and manage
processes for the
development of
organisational policies
On-going On-going Opex
Coordinate and manage
processes for the
development of municipal
by-laws
On going On going R 1 200 000.
00
Opex

66 | P a g e : D R A F T I D P 2 0 1 7 - 2 0 2 2
Coordinate and manage
processes for the
development of municipal
standard operating
procedures
On-going On-going Opex
▪ KEY FOCUS AREA: Strengthened Stakeholder Participation
Community participation is the cornerstone of development. It is a prescribed activity
that will assist inclusive planning. Participation of different stakeholders has been a
challenge throughout the planning stage of the municipal development agenda. The
purpose is to improve the municipal stakeholder engagement strategies.
OPERATIONAL OBJECTIVE START DATE END DATE PROPOSED
BUDGET
FUNDING
SOURCE
Develop stakeholder
database
On-going On-going
Establish sector
committees
On-going On-going
Build ward committee
capacity
On going On going R 1 200 000.
00
Opex
Improve Councillor
Community feedback
mechanisms
On-going On-going Opex
Improve the Mayoral
Imbizos
Improve the Mayoral
Outreach Programmes
▪ KEY FOCUS AREA: Risk Management and Internal Auditing
Internal Auditing and risk management are mandatory fuctions of local government.
They play a fumndamental role in the strategic planning as they inform the planning
of the municipality. The municipality was prov iding these serv ices through shared
serv ices, which did not yield the expected results due to the remoteness of the
serv ices. The audit committee did not sit in the last financial year, which compromised
the risk status of the municipality.

67 | P a g e : D R A F T I D P 2 0 1 7 - 2 0 2 2
OPERATIONAL OBJECTIVE START DATE END DATE PROPOSED
BUDGET
FUNDING
SOURCE
Appoint the Risk
Management Committee
July 2017 September
2017
Internal funds
Appoint the Audit
Committee
July 2017 September
2017
Internal funds
Establish the Internal Audit
Unit
July 2017 June 2018 Internal funds
Establish the Risk
Management Unit
July 2017 June 2018 Internal funds
Review the Risk
Management Strategy
January 2019 May 2019 Opex
Review the Risk
Management Framework
January 2019 May 2019 Opex
Review the Risk
Management Policy
January 2019 May 2019 Opex
▪ KEY FOCUS AREA: Performance Management
OPERATIONAL OBJECTIVE START DATE END DATE PROPOSED
BUDGET
FUNDING
SOURCE
Establish a Performance
Management Committee
July 2017 September
2017
Internal funds
Build capacity in the
Performance
Management Unit
July 2017 June 2018
Develop performance
contracts for all staff
member from Task 10 to
HOD’s
July 2017 On-going
Review the Performance
Management Strategy
July 2017 September
2017
Review the Performance
Management Framework
January 2019 May 2019

68 | P a g e : D R A F T I D P 2 0 1 7 - 2 0 2 2
Review the Performance
Management Policy
January 2019 May 2019
▪ KEY FOCUS AREA: Intergovernmental Relations
OPERATIONAL OBJECTIVE START DATE END DATE PROPOSED
BUDGET
FUNDING
SOURCE
Compile IGR reports On-going On-going
Establish framework for IGR July 2017 June 2018
Participate in IGR
meetings aand related
engagements
July 2017 On-going
▪ KEY FOCUS AREA: IT and Communication
OPERATIONAL OBJECTIVE START DATE END DATE PROPOSED
BUDGET
FUNDING
SOURCE
Re-establish the IT Steering
Committee
July 2017 September
2017
Build capacity in the IT
Management Unit
July 2017 June 2018 Internal
Funds
Develop an intranet
system
July 2017 June 2018 Internal
Funds
Develop a municipal
controlled website
July 2017 June 2018 Internal
Funds
Establish off-site and on-
site IT back-up facility
July 2017 June 2018 Internal
Funds
Review the IT Security and
Management Policies
January 2019 May 2019

69 | P a g e : D R A F T I D P 2 0 1 7 - 2 0 2 2
STRATEGIC OBJECTIVE 4:
To prov ide for an effective and efficient resources by aligning our institutional
arrangements to our overall strategy in order to deliver quality services
▪ KEY FOCUS AREA: Organisational Structure
OPERATIONAL OBJECTIVE START DATE END DATE PROPOSED
BUDGET
FUNDING
SOURCE
Develop organisational
structure that is aligned to
the IDP
July 2017 June 2018
Fund the organisational
structure
July 2017 June 2018 Internal
Funds
Develop and distribute
Job description to all
employees
July 2017 June 2018 Internal
Funds
▪ KEY FOCUS AREA: Human Capital and Skills Development
OPERATIONAL OBJECTIVE START DATE END DATE PROPOSED
BUDGET
FUNDING
SOURCE
Conduct employee age
analysis to determine the
number of employees
going on pension, to
prepare for financial
planning
July 2017 On-going
Conduct job-task analysis
to determine proper
placement of employees
July 2017 Update
annually
Internal
Funds
Conduct skill analysis to
determine training needs
of employees
July 2017 Annually
Review the employee
wellness programme
On-going Review
annually

70 | P a g e : D R A F T I D P 2 0 1 7 - 2 0 2 2
Develop employee
development programme
July 2017 Review
annually
Internal funds
▪ KEY FOCUS AREA: Customer Care
OPERATIONAL OBJECTIVE START DATE END DATE PROPOSED
BUDGET
FUNDING
SOURCE
Develop and distribute a
Customer Charter to all
employees
July 2017 January 2018
Integrate the Customer
Care Centre and the Call
Centre to prov ide a
seamless compliant
management system
July 2017 June 2018 Internal
Funds
Capacitate the Customer
Care serv ices
July 2017 June 2018 Internal
Funds
▪ KEY FOCUS AREA: Programme and Project Management
OPERATIONAL OBJECTIVE START DATE END DATE PROPOSED
BUDGET
FUNDING
SOURCE
Improve the Contract
Management system
July 2017 September
2017
▪ KEY FOCUS AREA: Municipal Facilities and Equipments
OPERATIONAL OBJECTIVE START DATE END DATE PROPOSED
BUDGET
FUNDING
SOURCE
Consolidate management
of municipal facilities
July 2017 September
2017
Capacitate the unit July 2017 June 2018 Internal
Funds

71 | P a g e : D R A F T I D P 2 0 1 7 - 2 0 2 2
Develop facilities
management system that
accessible for community
use
July 2017 June 2018 Internal
Funds
STRATEGIC OBJECTIVE 5:
To facilitate the development of the community pro‐active identification,
prevention, mitigation and management of environmental health, fire and
disaster risks.
▪ KEY FOCUS AREA: Environmental control (development of green
areas, waste management, etc.)
OPERATIONAL OBJECTIVE START DATE END DATE PROPOSED
BUDGET
FUNDING
SOURCE
Improve Waste
Management Services
(fleet, trenches, etc)
On-going On-going
Establish a new landfill site July 2017 June 2022 R6 000 000 Khumani SLP
(Planning)
Develop and manage
green areas
On-going On-going Internal
Funds
Management of
cemetries
On-going June 2018 Internal
Funds
▪ KEY FOCUS AREA: Libraries
OPERATIONAL OBJECTIVE START DATE END DATE PROPOSED
BUDGET
FUNDING
SOURCE
Promote access to
information
On-going On-going
Promote culture of
learning
July 2017 June 2022 R6 000 000 Khumani SLP
(Planning)

72 | P a g e : D R A F T I D P 2 0 1 7 - 2 0 2 2
▪ KEY FOCUS AREA: Public safety
OPERATIONAL OBJECTIVE START DATE END DATE PROPOSED
BUDGET
FUNDING
SOURCE
Capacitate the Public
Safety office
July 2017 June 2022
Improve road safety July 2017 June 2022
Improve the public safety
infrastructure
July 2017 June 2018 R1 500 000.
00
Kumba SLP
▪ KEY FOCUS AREA: Disaster management and fire-fighting
OPERATIONAL OBJECTIVE START DATE END DATE PROPOSED
BUDGET
FUNDING
SOURCE
Capacitate the Disaster
Management Office
July 2017 June 2018
Promote fire safety On-going On-going
▪ KEY FOCUS AREA: Special programmes focusing on the vulnerable groups
OPERATIONAL OBJECTIVE START DATE END DATE PROPOSED
BUDGET
FUNDING
SOURCE
Improve project
management processes
on the programme
July 2017 June 2022

73 | P a g e : D R A F T I D P 2 0 1 7 - 2 0 2 2
STRATEGIC OBJECTIVE 6:
Create a conducive environment for economic development in the municipality
▪ KEY FOCUS AREA: Economic Development
OPERATIONAL OBJECTIVE START DATE END DATE PROPOSED
BUDGET
FUNDING
SOURCE
Develop LED strategy On-going June 2018
Establish econmic nodes July 2017 June 2018
Establish a regional airport July 2017 June 2022
Upgrade Khai Appel July 2017 June 2022 R6 000 000.
00
Khumani SLP
Develop a policy on LED
(Investor incentive policy)
July 2017
▪ KEY FOCUS AREA: Enterprise Development
OPERATIONAL OBJECTIVE START DATE END DATE PROPOSED
BUDGET
FUNDING
SOURCE
SCM process to be trump-
card to enterprise
development
July 2017 On-going
Develop and impplement
SMME incubator
programme
July 2017 June 2022 Internal
Funds
▪ KEY FOCUS AREA: Capacity building
OPERATIONAL OBJECTIVE START DATE END DATE PROPOSED
BUDGET
FUNDING
SOURCE
Soft skills training for
SMME’s
July 2017 September
2017

74 | P a g e : D R A F T I D P 2 0 1 7 - 2 0 2 2
Develop and maintain
SMME database
July 2017 June 2018 Internal
Funds
10 STRATEGY IMPLEMENTATION PLAN
INSTITUTIONAL DRIVERS
These are strategy implementation drivers that need to be institutionalised as they are
more human oriented and can be learned. They depict the values of an organisation
and what it stands for. These would include the type of culture that the organisation
develop and portrayed in its internal systems and ultimately perceived externally by
the community it serves or by other stakeholders like: mines, Development Trusts,
sector departments and other external observers.
The type of policies and implementation thereof w ould also depict the effectiveness
of the institution’s management system and ultimately the values of Gamagara Local
Municipality. In order for the strategy to be implemented successfully, internal systems
have to reflect the values of the municipality.
DEVELOP SOUND AND EFFECTIVE MANAGEMENT SYSTEMS:
Management System: Organisational Communicative Strategy Implementation:-
Develop a stakeholder forum for planning, implementation and monitoring of
serv ice delivery
Identify all the stakeholders, including all the sector departments,
mines, NGO’s, CBO’s, community stakeholders and leaders in the IDP
planning, implementation and monitoring phases.
Develop memorandum of understanding with all the stakeholders:
Agree on roles and responsibilities of all stakeholders as indiv idual
organisation or group
Agree on joint responsibilities ( for the collective)
Agree on the operational protocols and frequencies of meetings and
the type of meetings you will engage on
Determine meeting frequencies
Agree on assessment criteria of the programme implementation
Have regular planning, progress and evaluation reporting sessions
Have a schedule for activities which shall have timeframes and
expected outputs and outcomes as per IDP.
The purpose is to strengthen the participatory and integrated planning,
implementation and monitoring of serv ices and to ensure integrated quality,
affordable and sustainable serv ices and accountable governance to the Gamagara
Community.
Management System: Organisational Culture Development Strategy Implementation:

75 | P a g e : D R A F T I D P 2 0 1 7 - 2 0 2 2
Develop policy development, implementation and monitoring committee
Develop policies, procedures and by-laws and review them regularly
Ensure that all policies developed by municipality are representative to the
values of the municipality and are implemented accordingly by developing
evaluation programme and adhering to such programme
Fill up all the strategic and critical positions, this does only refers to top
management positions but refers also to positions that enhance service
delivery.
LEADERSHIP
Hitt, I reland& Hoskisson (2003) in Ehlers and Lazenby define leadership as the ability to
anticipate, envision, maintain flexibility and empower others to create strategic
change as necessary (Ehlers & Lazenby, 2009:217). In the endeavour to implement this
strategy, leaders should be chosen on the basis of being adequately knowledgeable
on the work ahead and should have good human relation skills. I t is therefore
imperative that Gamagara Local Municipality fill up all the strategic and critical
position with appropriately skilled personnel to be able to implement this strategy.
ORGANISATIONAL CULTURE
Ehlers & Lazenby define organisational culture as a “set of important, often unstated,
assumptions, beliefs, behavioural norms and values that members of an organisation
share” (Ehlers & Lazenby, 2009:223). Organisational culture represents the image and
what the organisation stands for. I t brands the organisation as it determines the
perception of the customers. I t is therefore imperative that Gamagara develops a
culture that would encourage people to recognise it as their institution of service
delivery and help. This could be derived from the values that the organisation has
chosen as relevant and representative to the municipality.
Ehlers & Lazenby identify different types of organisational cultures that affect the
performance of organisations towards achiev ing their v ision. Gamagara Local
Municipality should choose an Adaptive organisational culture in which employees
share a feeling of confidence that the organisation can neutralise threats and exploit
opportunities that it can come across. Employees should be allowed to take
reasonable risk and bring in innovation at the organisation. The Role organisational
culture is very critical in that it does not focus much on people in positions but in what
are supposed to do. I t is more reliant on the job-description of a person and the
performance of the person occupying that position rather than person himself or
herself. The Task organisational culture is very important for Gamagara because
serv ice delivery is a very complex and results driven process which needs multi-
disciplinary approach and multi-disciplinary teams. This is necessary for co-ordination
of sector department and other stakeholders to plan, implement and monitor services
prov ided to the community.
It is suggested that the following organisational cultures should be avoided:
76 | P a g e : D R A F T I D P 2 0 1 7 - 2 0 2 2
The Person organisational culture is when an indiv idual become a central point and
the organisation exists to serve only certain indiv iduals within it. The Power
organisational culture whereby every aspect raised to assist the organisation is
politicised.
11. “BACK TO BASICS”
The President in his State of the Nation Address on 12th February 2015; “Local
government is everybody’s business. We have to make it work. We have launched
the “Back to Basics” programme to promote good governance and effective
administration through cutting wastage, spending public funds prudently, and hiring
competent staff and ensure transparency and accountability in municipalities”.
Therefore it is imperative that this IDP is aligned to the “Back to Basics” strategy with
emphasis on:-
PILLARS HIGHLIGHTS OF KEY ON EACH AREAS OF IMPROVEMENT ON EACH
PILLAR
Basic Serv ices Dibeng and Olifanshoek has been move from basic to higher
level of services. E.g Sanitation
Good Governance Municipality has regular council meetings
Public participation:
Putting People First
Some councillors have improvement on their community
engagements and report back.
Building Capable
Institutions and
Administrations
Critical vacancies in the municipality have been filled. CPMD
Training is been extended to all senior officials including those
outside finance department.
Sound Financial
Management
Revenue enhancement strategy developed in collaboration
with DBSA. Electronic meter reading systems introduce.

77 | P a g e : D R A F T I D P 2 0 1 7 - 2 0 2 2
Chapter 4
4.1. Integration- Sector Plans
Integration takes place in both vertical and horizontal fashion. The vertical integration
will relate to integrating local plans of the municipality with the national policy,
programmes and plans to ensure synergy as South Africa is unitary state through with
three autonomous spheres.

78 | P a g e : D R A F T I D P 2 0 1 7 - 2 0 2 2
Horizontal integration would relate to local planning tools as may be deoicted below:
This document was informed by integration of the different planning tools of the
municipality. These planning tools are specific to delivery module in the municipality
which are structured into municipal departments. These tools together with the
national and provincial developmental imperatives directed planning particularly the
prioritising of projects to meet the municipal objectives. These planning tools over and
above the municipal developmental needs as determine by the community through
the IDP consultative meetings, IDP Representative Forum, the Community Feedback
Meetings by Councillors and the Ward Committee engagements with the community,
assist to give indications on the feasibility of achieving these needs on time and within
budget.
Planning tools that were considered during the planning phase of the IDP are listed
below. However, some of these tools are out dated but presented a picture of where
the municipality is and thus their use were still partially relevant even though there is a
need to rev iew. Some of the tools are still to be initiated due to the realisation of the
new needs as informed by the growing speed of the town.
The following planning tools were considered during planning of the IDP.

79 | P a g e : D R A F T I D P 2 0 1 7 - 2 0 2 2
Sector Plan Current status
Spatial Development Framework Will be rev iewed in the 2017/18 financial year
Land Use Management System Will be rev iewed in the 2017/18 financial year
LED Strategy Will be rev iewed in the 2017/18 financial year
Performance Management Policy Approved by Council
HIV/AIDS policy To be rev iewed
Water Services Development Strategy To be rev iewed
Integrated Waste Management Plan Approved by Council
Env ironmental Management Framework Reviewed
Integrated Environmental Management Plan Will be conducted in the 2017/18 financial year
Integrated Human Settlement Sector Plan Approved by Council
Integrated Transport Plan Currently under review
Gamagara 2030 Development Plan Serv ice provider to be appointed
Placement Policy implemented
Olifantshoek Electricity Master Plan Approved by Council
Dibeng Electricity Master Plan Approved by Council
Kathu Electricity Master Plan Approved by Council
Kathu Water Services Master Plan Approved by Council
Olifantshoek Water Services Master Plan Approved by Council
Kathu Waste Water Master Plan Approved by Council
Dibeng Waste Water Master Plan Approved by Council
Open Space Management Plan Approved by Council

80 | P a g e : D R A F T I D P 2 0 1 7 - 2 0 2 2
Chapter 5:
Project list -Service Delivery and Budget Implementation Plan (SDBIP)
ISSUE 1: Basic Infrastructure Development
Project Nr. Project Description Project
Outcome
Project output Location Financial Year (Project Input) Funding
Source
2017/18 2018/19 2019/20 2020/21 2021/22
PBID 001 Construction of
40MVA Substation
Upgrade
electrical
capacity
40 MVA
substation for
Kathu West
Kathu West
R 45,000,000 R0 R0 R0 R0 Internal
funds
PBID 002
Refurbish electrical
network
Upgrade
electrical
network.
Number of old
cables
replaced.
Kathu R0 R15,000,000 R 15,000,000 R 15,000,000 R15,000,000 Internal
funds
PBID 003 Upgrade of the Bulk
electricity supply
(Planning)
Provide
electricity
Electricity
upgrade plan
for Kathu
Kathu R 18,000,000 R10,000,000 R0 R0 R15,000,000 Internal
funds
PBID 004 Electrification of 300
stands
Provide
Electricity
300 electrified
stands in
Kathu
Kathu R 20,000,000 R0 R0 R0 R0 Transnet
PBID 005 Upgrade of the
Traffic station
Improve
customer
care
services
Upgraded
traffic station
in Kathu
Kathu
R 1,500,000
R 3,500,000 R 6,000,000 R 3,500,000 R 3,500,000 Internal
Funds
Kumba
SLP
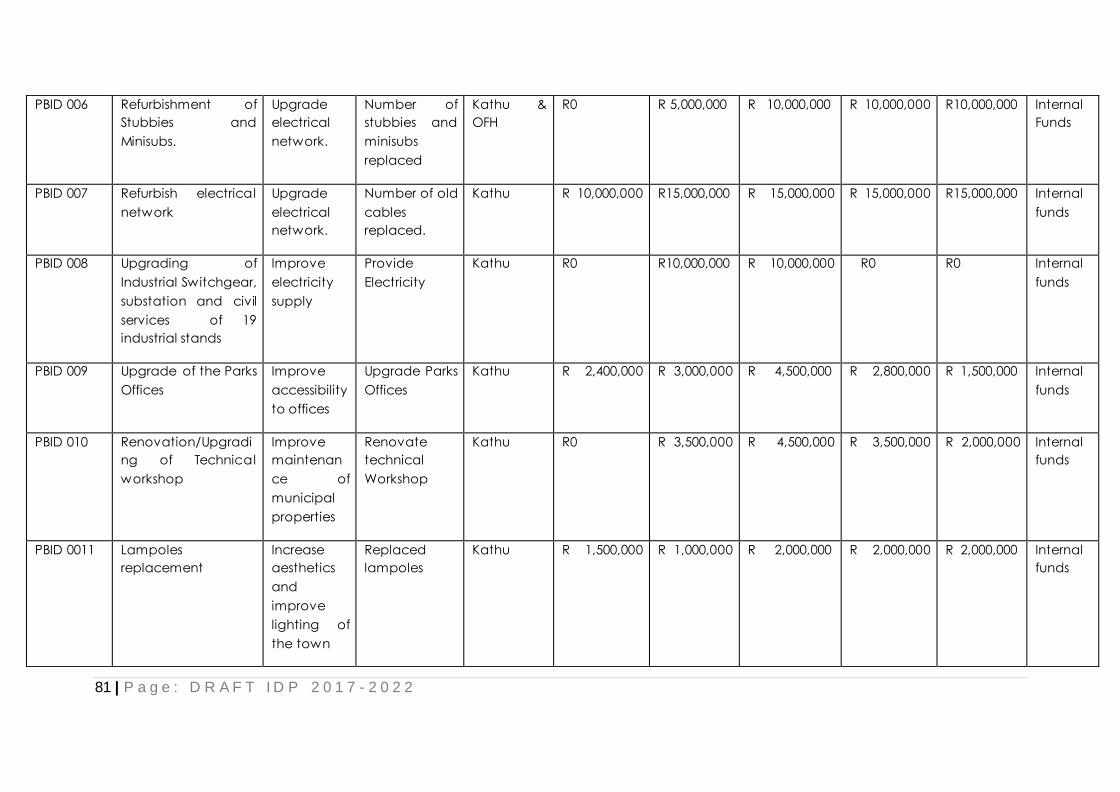
81 | P a g e : D R A F T I D P 2 0 1 7 - 2 0 2 2
PBID 006 Refurbishment of
Stubbies and
Minisubs.
Upgrade
electrical
network.
Number of
stubbies and
minisubs
replaced
Kathu &
OFH
R0 R 5,000,000 R 10,000,000 R 10,000,000 R10,000,000 Internal
Funds
PBID 007 Refurbish electrical
network
Upgrade
electrical
network.
Number of old
cables
replaced.
Kathu R 10,000,000 R15,000,000 R 15,000,000 R 15,000,000 R15,000,000 Internal
funds
PBID 008 Upgrading of
Industrial Switchgear,
substation and civil
services of 19
industrial stands
Improve
electricity
supply
Provide
Electricity
Kathu R0 R10,000,000 R 10,000,000 R0 R0 Internal
funds
PBID 009 Upgrade of the Parks
Offices
Improve
accessibility
to offices
Upgrade Parks
Offices
Kathu R 2,400,000 R 3,000,000 R 4,500,000 R 2,800,000 R 1,500,000 Internal
funds
PBID 010 Renovation/Upgradi
ng of Technical
workshop
Improve
maintenan
ce of
municipal
properties
Renovate
technical
Workshop
Kathu R0 R 3,500,000 R 4,500,000 R 3,500,000 R 2,000,000 Internal
funds
PBID 0011 Lampoles
replacement
Increase
aesthetics
and
improve
lighting of
the town
Replaced
lampoles
Kathu R 1,500,000 R 1,000,000 R 2,000,000 R 2,000,000 R 2,000,000 Internal
funds

82 | P a g e : D R A F T I D P 2 0 1 7 - 2 0 2 2
PBID 0012 New Street lights Improved
lighting of
areas
New street
lights installed
Kathu R0 R 2,000,000 R 1,000,000 R3,000,000 R 3,000,000 Internal
funds
PBID 0013 Upgrade electrical
Master plan and
New Embedded
Generation Policy
Upgraded
policies.
Reviewed
policy and
New
Embedded
Generation
Policy
Gamagara R 500,000 R 200,000 R0 R0 R 300,000 Internal
funds
PBID 0014 Review of Bulk
Service Contribution
Policy
Updated
policy
Reviewed
policy
Gamagara R 200,000 R0 R0 R0 R 300,000 Internal
funds
PBID 0015 Replacement of old
electrical kwH Meters
More
accurate
metering.
Number of
meters
replaced
Gamagara
area –
(Kathu &
OFH)
R 2,000,000 R 2,000,000 R 1,000,000 R 1,000,000 R 1,000,000 Internal
funds
PBID 0016 Energy Efficiency
(Demand Side
Management)
Reduction
on internal
electricity
consumptio
n
Amount of
electricity
reduced.
Gamagara
area –
(Kathu &
OFH)
R 5,000,000 R 5,000,000 R 5,000,000 R 5,000,000 R 5,000,000 Internal
funds /
DOE
PBID 0017 Erection of high mass
lights
Improved
town
lighting
Erect high
mass lights
Dibeng R 3,000,000 R 2,000,000 R 3,000,000 R 3,000,000 R 3,000,000 Internal
funds

83 | P a g e : D R A F T I D P 2 0 1 7 - 2 0 2 2
PBID 0018 Upgrading of
workshop
Improved
service
delivery
and safe
keeping
municipal
property
Upgrade
Workshop
Dibeng R 250,000 R 150,000 R0,00 R0,00 R0,00 Internal
funds
PBID 0019
(**)
Construction of 5
classrooms
Improve
literacy
level
Construct 5
new
classrooms
Dibeng P/S R2,250,000 R0 R0 R0 R0 NCDOE
PBID 0020 Major repairs and
Renovations to hostel
Repairs and
Renovations
Dibeng P/S R 4,602,000 R 1,416,000 R 4,000,000
PHASE 2
NCDOE
TBD
PBID 0021 Construction of new
school
Building of
new school
building
Dibeng P/S R 5,916,808 R29,584,038 NCDOE
PSP
PBID 0021
(**)
Planning &
Construction of New
School building
Improve
literacy
level
Construct new
School
Dibeng R 15,000,000 NCDOE
PBID 0022 Upgrading of Library Upgrade
library
Encourage
culture of
reading and
improve level
of literacy
Dibeng R 300,000 R 180,000 R0,00 R0,00 R 100,000 Internal
funds

84 | P a g e : D R A F T I D P 2 0 1 7 - 2 0 2 2
PBID 0023 Construction of
Swimming pool
Promote
social
wellbeing
Construct
swimmingpool
Dibeng R0,00 R0,00 R0,00 R0,00 R0,00 Internal
funds
PBID 0024 Upgrading &
Renovation of
Municipal Buildings
Improve
service
delivery
and safe
keeping of
municipal
property
Renovated
municipal
buildings
GLM R 2,500,000 R 2,300,000 R 3,000,000 R 2,300,000 R 2,500,000 Internal
funds
PBID 0025 Bulk supply upgrade Provide
electricity
Upgrade bulk
electricity
O’hoek R0
R25,000,000 R 65,000,000 R0 R0 INEP
PBID 0026 Future electrification
of stands
Stands to
be
electrified.
Number of
stand
electrified.
O’hoek R0 R10,000,000 R 10,000,000 R 10,000,000 R10,000,000 Internal
funds
PBID 0027 New high mass lights Improved
town
lighting
New high
mass lights
O’hoek R0 R 3,000,000 R 3,000,000 R 3,000,000 R 3,000,000 Internal
Funds
PBID 0028 Refurbish electrical
network
Upgrade
electrical
network.
Number of
lines and
cables
replaced.
O’hoek R0,00 R0,00 R0,00 R0,00 R0,00 Internal
funds
PBID 0029 Furnishing of library Encourage
the culture
of reading
Furnished
Welgelee
Library
Welgelee R0,00 R0,00 R0,00 R0,00 R0,00 Internal
funds

85 | P a g e : D R A F T I D P 2 0 1 7 - 2 0 2 2
and
improve
level of
literacy
PBID 0030 Repairs and
renovations to Hostel
Langberg
High
O’hoek R 4,000,000 NCDOE
GDM
PBID 0031 Planning and
construction of new
community hall
Build access
of
community
services to
Welgelee
community
Construction
plan of the
new Welgelee
Community
Hall
Welgelee R0,00 R0,00 R0,00 R0,00 R0,00 Internal
funds
PBID 0032 Upgrade of the
Traffic station
Improve
customer
care
services
Upgraded
Olifantshoek
traffic station
O’hoek R0,00 R0,00 R0,00 R0,00 R0,00 Internal
funds
PBID 0033 Upgrading of library Encourage
the culture
of reading
and
improve
level of
literacy
Upgraded
Olifantshoek
Library
O’hoek R0,00 R0,00 R0,00 R0,00 R0,00 Internal
funds

86 | P a g e : D R A F T I D P 2 0 1 7 - 2 0 2 2
PBID 0034 Construction of
ablution facilities -
cemeteries
Access to
sanitation
facilities
Ditloung/
Skerpdraai
R0,00 R0,00 R0,00 R0,00 R0,00 Internal
funds
PBID 0035 Fencing of the Mini-
Substation
Secured
municipal
property
and
improved
community
safety.
Fenced mini-
substation in
Olifantshoek
O’hoek R0 R0,000 R0,00 R0 R0 Internal
funds
PBID 0036 Replacement of
Electricity meters
Improved
provision of
electricity
and
efficient
revenue
collection
Installed
electricity
meters in
Gamagara
GLM R0 R0 R 4,000,000 R 4,000,000 R0 Internal
funds
PBID 0037 Electrification of 1265
stands: Residential
development
Improve
Electricity
Capacity
1265
electrified
residential
stands in
Sesheng
Sesheng R 20,000,000
R15,000,000
R 20,000,000 R0 R0
Internal
funds
Khumani
SLP

87 | P a g e : D R A F T I D P 2 0 1 7 - 2 0 2 2
ISSUE 2: Water & Sanitation Project List
Project Nr. Project Description Project
Outcome
Project Output Location Financial Year (Project Input) Funding
Source
2017/18 2018/19 2019/20 2020/21 2021/22
PWS 001 Bulk Water supply Develop water
management
plan
Bulk water
supply
improvement
plan
Kathu R0 R0
R0 R0 R0 RBIG
PWS 002 Construction of
water link line
Water link-line
in Kathu West
Kathu -
West
R0 R0 R0 R0 R0 Internal
funds
PWS 003
(GU2)
Construction of
new water
treatment works
Improve the
quality of water
Water
Treatment
works
construction
plan
Kathu R0 R0 R0 R0 R0 Internal
funds
PWS 004
(KW.2)
Construct new 18
ML reservoir and
3ML elevated
tower
Improve water
supply
Construction
plan for the
new 8ML
reservoir and
3ML elevated
tower in Kathu
Kathu R0 R 13, 000,000 R 10,000,000 R0 R0
Internal
funds
PWS 005 Construction of
water link line from
export pipeline to
Water link
pipeline from
the water
Kathu R0 R0 R0 R0 R0 Internal
funds

88 | P a g e : D R A F T I D P 2 0 1 7 - 2 0 2 2
waste water
treatment works
treatment
works
PWS 006 Refurbishment and
upgrade of existing
pumps at WWTW
Refurbished
waste water
treatment
plant
Kathu R0 R 3,500,000 R0 R0 R0 Internal
funds
PWS 007 Research and
condition of
200mm water pipe
line from Eastern
Reservoir to Eastern
site of extension 3
Report on the
condition of
the 200mm
water pipeline
from Eastern
Reservoir to
Kathu
Extension 3
Kathu
West
R0 R0 R0 R0 R0 Internal
funds
PWS 008 Replace 2x garden
water pumps
Replaced 2
garden water
pumps
Kathu R0 R0 R0 R0 R0 Internal
funds
PWS 009 Construction of
water link line to
Kathu West
Reservoir
Improve water
supply
Water link line
to Kathu West
Reservoir
Kathu R0 R0 R0 R0 R0 Internal
funds
PWS 0010 Removal of part
supply from Kathu
Central to Kathu
West Reservoir
Improve water
supply
Removed
water supply
pipeline from
Kathu Central
to Kathu West
Kathu R0 R0 R0 R0 R0 Internal
funds

89 | P a g e : D R A F T I D P 2 0 1 7 - 2 0 2 2
PWS 0011 Fencing of
Water/Sewer
Works
Fenced
water/sewer
works
Kathu R 500,000 R0 R0 R0 R0 Internal
funds
PWS 0012 Construction of
sewer
pumpstation-
Dibeng crossing
New sewer
pumpstation
at Dibeng
Crossing
Kathu R 500,000 R 6,000,000 R 1,500,000 R0,00 R0,00 Khumani
SLP
PWS 0013 Refurbishing of
pumpstations
buildings
Kathu R 300,000 R0,00 R0,00 R0,00 R0,00 Internal
funds
PWS 0014 Upgrading of
Chlorination
storages
Health and
Safety
Dibeng R0,00 R0,00 R0,00
R0,00 R0,00 Internal
funds
PWS0015 A Upgrading of
WWTW
Improve sewer
infrastructure
Upgraded
Dibeng
WWTW
Dibeng R11,982,000
R 3,500,000
R 12,415,000
R 2,500,000
R 12,871,000 R0 R0 MIG
Khumani
SLP
PWS0015 B Construction of
internal Sewer
network- 797
Households
Improve sewer
infrastructure
797
households
connected to
the sewer
network
R0 R0 R0 R0 R0 MIG
Internal
funds
PWS0015 C Construction of
internal Sewer
network- 529
Households
Improve sewer
infrastructure
529
households
connected to
Dibeng R0 R0 R0 R0 R0 MIG
Internal
funds

90 | P a g e : D R A F T I D P 2 0 1 7 - 2 0 2 2
the sewer
network
PWS 0016 Water Reticulation Improve Basic
services
provision
1 300 stands
in Dibeng
provided with
RDP standard
water services
Dibeng
1300
stands
R 5,643,000 R0 R0 R0 R0 WSIG
PWS 0017 Provision of
temporary water
supply to 1300 plots
Improve water
supply
Dibeng R0 R0 R0 R0 R0 Internal
funds
PWS 0018 Augmentation of
Bulk Water Supply
Improve water
supply
Bulk water
distribution
plan for
Dibeng
Dibeng R14,357,000 R 20,000,000 R 25,000,000 R0 R0 WSIG
PWS 0019 Provision of water
services
Improve basic
services
provision
1 200 stands in
Olifantshoek
provided with
RDP standard
water services
O’hoek
1200
stands
R0 R0 R0 R 13,000,000
R 8,725,200
R13,000,000 Internal
funds
PWS 0020 Up grading of
chlorination
storages
Water
purification
Chlorination
Storage
O’hoek R0 R0 R0 R0 R0 Internal
funds
PWS 0021 Fencing of reservoir Improve water
supply
Fenced-Off
Olifantshoek
reservoir
O’hoek R0 R0 R0 R0 R0 Internal
funds

91 | P a g e : D R A F T I D P 2 0 1 7 - 2 0 2 2
PWS 0022 Sealing of Reservoir
and Tower
Sealed
Olifantshoek
reservoir
O’hoek R0 R0 R0 R0 R0 Internal
funds
PWS 0023 Feasibility Study for
provision of
portable water
Underground
water supply
Feasibility
report on
provision of
portable
water from
boreholes in
Olifantshoek
O’hoek R0 R0 R0
R0 R 3,200,000 OPEX
PWS 0024 Bulk Water Supply Improve water
supply
O’hoek R 0 R0 R0 R0 R0 Internal
funds
PWS 0025 Bulk sewer supply Improve
sanitation
O’hoek R0 R0 R0 R0 R10,000,000
Internal
funds
PWS0026 Upgrading of
WWTW
Improve
sanitation
Upgraded
WWTW in
Olifantshoek
O’hoek R0 R0 R0 R0 R 2,000,000 Internal
funds
PWS 0027
Provision of water
Reticulation to
1265
Provide water
for 500 stands (
Phase 1) : RDP
standard
500 stands
provided with
RDP standard
water supply
Sesheng -
1265
R0 R4,000,000 R14,000,000 R3,000,000 R0 Khumani
SLP
PWS 0028 Construction of
Sesheng 7ML east
and 1.7ML
Elevated Tower
Improve water
storage
capacity
Construction
plan for the
Sesheng East
reservoir (7ML
Sesheng
East
R0 R0 R0 R0 R0
Internal
funds

92 | P a g e : D R A F T I D P 2 0 1 7 - 2 0 2 2
and 1,7ML
elevated
tower)
PWS 0029 Construction of
water supply
pipeline from
Water treatment
works to Sesheng
new reservoir
Improve water
provision
Water supply
pipeline from
WTW to
Sesheng new
reservoir plan
Sesheng R0 R0 R0 R0 R0 Internal
funds
PWS 0030 Development of 8
boreholes- Khai -
Apple
Improve water
sources and
provision
Developed 3
boreholes
Sesheng/
Kathu
R 6,000,000 R0 R0 R0 R0 Khumani
SLP
PWS 0031 Upgrading of
sewer pump
station
Improve
sanitation
Upgrade plan
for the
Sesheng
sewer
pumpstation
Sesheng R 0 R0 R0 R0 R0
PWS 0032 Conversion of
water meters to
prepaid/smart
meters
Improve
revenue
collection and
monitoring
Converted
water meters
from
conventional
to pre-paid
meter
GLM R31,855,893 R0 R0 R0 R0 Internal
funds

93 | P a g e : D R A F T I D P 2 0 1 7 - 2 0 2 2
ISSUE 3: Roads & Streets Project List
Project
Nr.
Project Description Project
Outcome
Project
Output
Location Financial Year (Input) Funding
Source
2017/18 2018/19 2019/20 2020/21 2021/22
PRS 001
Construction of Hans
Coetzee Rd (1 km)
(Planning)
Improved
road linkage
infrastructure
Constructed
access road
between
joining
Rooisand
and main
road
Kathu
R0 R0 R0 R0 R0
Internal
funds
PRS 002
Resealing and new
storm water
drainage
Improved
road linkage
infrastructure
Reseal and
construct
storm water
drainage
system
Kathu
R0 R0 R0 R0 R0
Internal
funds
PRS 003
Raods and
Stormwater
masterplan
R0 R0 R0 R0 R0 Internal
funds
PRS 004
Resealing of 2,6 km
of Hendrick v. Eck
RD
R0 R 3,500,000 Internal
funds
PRS 005
Construction of new
2,6km Storm water
channel
Hendrick
v. Eck RD
R0 R 5,000,000 Internal
funds

94 | P a g e : D R A F T I D P 2 0 1 7 - 2 0 2 2
PRS 006 Resealing of 1,6 km
of road
Ben
Alberts
str.
R0 R 2,500,000 R 2,500,000 Internal
funds
PRS 007
Construction of new
1,6km Storm water
channel
Ben
Alberts
str.
R0 R 2,500,000 R 2,500,000 Internal
funds
PRS 008
Construct new 3,6
km storm water
channel
Frikkey
Meyer rd
R0 R 5,000,000 R0 Internal
funds
PRS 009 Resealing 3,6 km of
Road
Frikkey
Meyer rd
R0 R 5,000,000 R 4,000,000 Internal
funds
PRS 0010 Resealing of 1,9km
road
Ian
Flemming
rd
R0 R 2,500,000 R 2,500,000 Internal
funds
PRS 0011
Construction of new
1,9km storm water
channel
Ian
Flemming
rd
R0 R 2,500,000 R 2,500,000 Internal
funds
PRS 0012 Resealing of 1,4km
road
Mopanie
Avenue
R0 R 2,500,000 R 2,500,000 Internal
funds
PRS 0013
Construction of new
1,4km storm water
channel
Mopanie
Avenue
R0 R 5,000,000 R0 Internal
funds
PRS 0014 Upgrading of all
gravel Roads Dibeng
R0 R0 Internal
funds

95 | P a g e : D R A F T I D P 2 0 1 7 - 2 0 2 2
PRS 0015 Resealing of Internal
Roads Dibeng
R0 R 10,000,000 R10,000,000 Internal
funds
PRS 0016 Roads and Storm
water master plan Dibeng
R0 R 500,000 Internal
funds
PRS 0017 Resealing and new
Storm water project Dibeng
R0 R 500,000 Internal
funds
PRS 0018 Roads & storm water
Masterplan
Better living
condition of
the
community of
Olifantshoek.
O’hoek R0 R 500,000 R0 R0 R0 Internal
funds
PRS 0019 Upgrade storm
water retention
pond
Better living
condition of
the
community of
Sesheng
Roads
construction
O’hoek R0 R 10,000,000 R 10,000,000 R0 R0 Internal
funds
PRS 0020 Resealing of 2,4km
internal roads
Access to
public
amenities
O’hoek R0 R 5,000,000 R 5,000,000 R0 R0 Internal
funds
PRS 0021 Upgrade 1,4km
internal road
Paving
Road
O,hoek R0 R 5,000,000 R 5,000,000 Internal
funds
PRS 0022 Construction of new
canal
O’hoek R0 R 10,000,000 R 10,000,000 Internal
funds
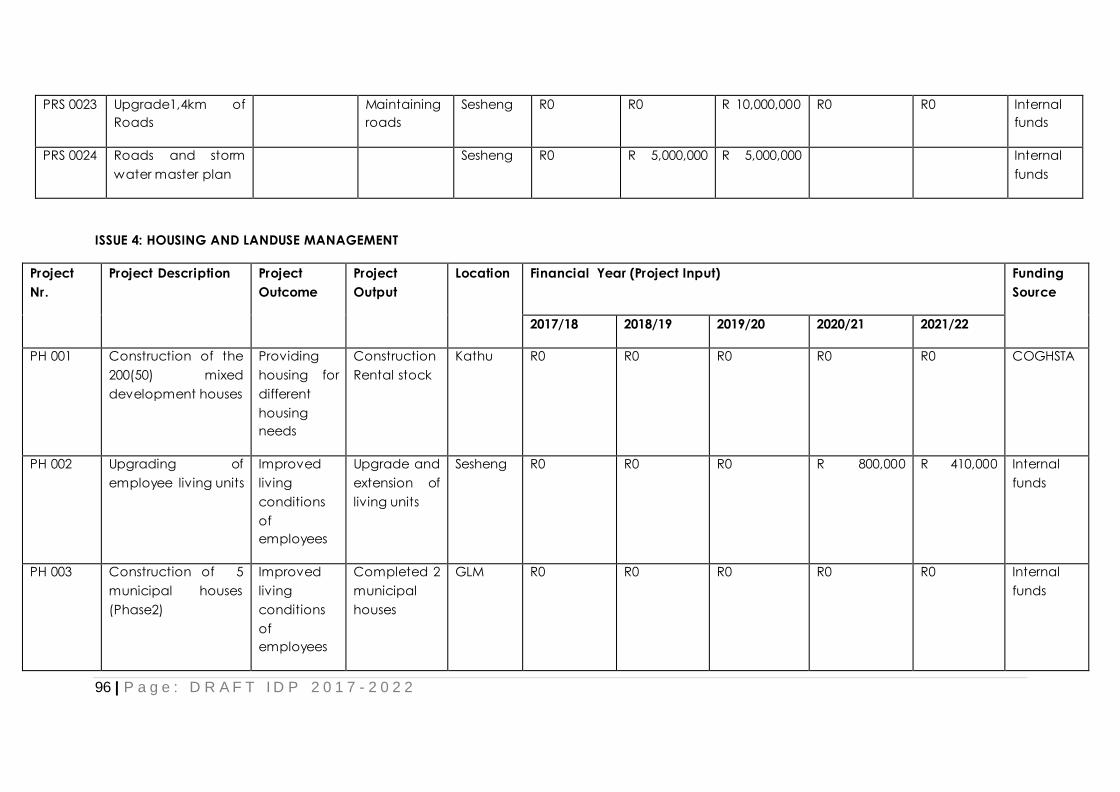
96 | P a g e : D R A F T I D P 2 0 1 7 - 2 0 2 2
PRS 0023 Upgrade1,4km of
Roads
Maintaining
roads
Sesheng R0 R0 R 10,000,000 R0 R0 Internal
funds
PRS 0024 Roads and storm
water master plan
Sesheng R0 R 5,000,000 R 5,000,000 Internal
funds
ISSUE 4: HOUSING AND LANDUSE MANAGEMENT
Project
Nr.
Project Description Project
Outcome
Project
Output
Location Financial Year (Project Input) Funding
Source
2017/18 2018/19 2019/20 2020/21 2021/22
PH 001 Construction of the
200(50) mixed
development houses
Providing
housing for
different
housing
needs
Construction
Rental stock
Kathu R0 R0 R0 R0 R0 COGHSTA
PH 002 Upgrading of
employee living units
Improved
living
conditions
of
employees
Upgrade and
extension of
living units
Sesheng R0 R0 R0 R 800,000 R 410,000 Internal
funds
PH 003 Construction of 5
municipal houses
(Phase2)
Improved
living
conditions
of
employees
Completed 2
municipal
houses
GLM R0 R0 R0 R0 R0 Internal
funds

97 | P a g e : D R A F T I D P 2 0 1 7 - 2 0 2 2
PH 004 Moving of electrical
meter box from
shacks to RDP House
Improve
access to
electricity of
communitie
s
Moved
electrical
meter boxes
from shacks
to RDP
houses
GLM R0 R0 R 500,000 R0 R0 OPEX
PH 005 Upgrading of 3
municipal houses
Secure and
maintain
municipal
properties
and assets.
Maintain
municipal
property
GLM R0,00 R0,00 R0,00 R 150,000 R0,00 Internal
funds
PH 006 Feasibility study for
employee
accommodation
Improve
living
conditions
of municipal
employees
Feasibility
report on the
accommoda
tion plan for
employees
GLM R0,00 R0,00 R0,00 R0,00 R0,00 Internal
funds
PH 007 Planning & Surveying
and registration of
stands
Access to
land for the
poor
Planning of
Residential
stands
GLM R0,00 R0,00 R0,00 R 2,000,000 R 1,000,000 Internal
funds
PH 008 Development of
Environmental
Framework
Enhanced
planning for
the
municipality
Approved
EMF
GLM R 1,500,000 R 1,500,000
R0,00 R0,00 OPEX
PH 009 Development of SDF Enhanced
planning for
Approved
SDF
GLM R 1,500,000 R 1,500,000
R0,00 R0,00 OPEX

98 | P a g e : D R A F T I D P 2 0 1 7 - 2 0 2 2
the
municipality
PH 010 Development of
LUMS
Enhanced
planning for
the
municipality
Approved
LUMS
GLM R 1,500,000 R 1,500,000 R0,00 R0,00 R0,00 OPEX
ISSUE 6: Local Economic Development Project List
Project
Nr.
Project Description Project
Outcome
Project
Ouput
Location Financial Year (Project Input) Funding
Source
2017/18 2018/19 2019/20 2020/21 2021/22
PLED 001
(**)
Upgrading of Khai –
apple
Secured
amenity and
property of the
municipality
and safety of
the customers
at the resort
Fencing of
Khai-Appel
Kathu R 500,000 R 5,500,000 R0,00 R0,00 R0,00 Khumani
SLP
PLED 002 LED Enterprise
development
Promotion of
access to the
economy
4 enterprises
developed
GLM R 800,000 R0,00 R0,00 R0,00 R0,00 Internal
funds
PLED 003 Tourism Strategy Well branded
Gamagara
Local
Municipality
Approved
Tourism
strategy
GLM R 1,500,000 R0,00 R0,00 R0,00 R0,00 Internal
funds

99 | P a g e : D R A F T I D P 2 0 1 7 - 2 0 2 2
PLED 004 Kathu Furniture
making project
Incubation
and Training
GLM R 1,000,000 R 1,000,000 R 1,000,000 Khumani
SLP
PLED 005 Portable Skills
Training
Incubation
and Training
GLM R 2,000,000 R 1,500,000 R 1,500,000 R 1,000,000 R 1,000,000 Khumani
SLP
PLED006 Water and Fencing
of commonage
GLM R 500,000 Internal
funds
ISSUE 7: Youth Development Programme and Special Programmes
Project
Nr
Project
Description
Project
Outcome
Project
Output
Location Financial Year (Project Input) Funding
Source
2017/18 2018/19 2019/20 2020/21 2021/22
PYD 001
(**)
Bursaries for
Gamagara
students
Educational
empowerment
R1,000, 000
spent on
bursaries
Gamagara R 1,000,000 R 0,00 R 0,00 R 0,00 R0,00 Khumani
SLP
PYD 002 Youth
Development
Programme
Empowerment
and
Development
GLM R0,00 R0,00 R0,00 R0,00 R0,00 OPEX
PYD 003 Special
programmes
Health; elderly;
disabilities;
Women
GLM R0,00 R0,00 R0,00 R 0,00 R 0,00 OPEX
PYD 004 ABET Programme GLM R0,00 R0,00 R0,00 R 500,000 R 500,000 Khumani
SLP

100 | P a g e : D R A F T I D P 2 0 1 7 - 2 0 2 2
ISSUE 8: ENVIRONMENTAL MANAGEMENT AND CLEANSING
Project Nr. Project
Description
Project
Outcome
Project
Output
Location Financial Year (Project Input) Funding
Source
2017-18 2018-19 2019-20 2020 - 2021 2021-22
PEC 001 Upgrading of
park
Improved
public
amenities
Upgraded
park in
Kathu
Kathu R0,00 R0,00 R0,00 R0,00 R0,00 Internal
funds
PEC 002 Palisade
Fencing- Park
Improved
public
amenities
Fencing of
the Park
Kathu R0,00 R0,00 R0,00 R0,00 R0,00 Internal
funds
PEC 003 Installation of
lights at park
Improved
public
amenities
Installation
of lights in
park
Kathu R0,00 R0,00 R0,00 R0,00 R0,00 Internal
funds
PEC004A Upgrading of
transfer station
Environmental
Control and
Safe
Environment
Upgraded
Kathu waste
transfer
stations
Kathu R0,00 R 550,000 R0,00 R0,00 R0,00 Internal
funds
PEC004B Renovation of
existing wood
chipping site
Recycling Waste
disposal
Kathu R0,00 R0,00 R0,00 R0,00 R0,00 Internal
funds
PEC 005
Landscaping of
isle’s and traffic
circles
Beautification
of town
Landscape
d isle’s and
traffic circles
in Kathu
Kathu R0,00 R0,00 R0,00 R0,00 R0,00 Internal
funds

101 | P a g e : D R A F T I D P 2 0 1 7 - 2 0 2 2
PEC 006 Upgrading of
landfill site
(Trenches)
Environmental
Control and
Safe
Environment
Creating of
new cells to
ensure safe
environment
Dibeng
R 1,175,000
R0,00 R0,00 R0,00 R0,00 Internal
funds
PEC 007 Completion of
cemetery
boundary wall
Improved
social amenity
Completed
boundary
walls of the
Dibeng
cemetery
Dibeng R 558,000 R0,00 R0,00 R0,00 R0,00 Internal
funds
PEC 008 Fencing of
Landfill site
Dibeng R 250,000 R0,00 R0,00 R0,00 R0,00 Internal
funds
PEC 009 Establishment of
new landfill site
Community
Security and
pollution
control
Dibeng R 10,000,000
R 15,000,000 R0,00
R2,500,000
R2,500,000
MIG
Khumani
SLP
PEC 009A Construction of
control room at
landfill sites
Improve
community
service, safety
and illegal
dumping
Dibeng
R0,00 R0,00 R0,00 R0,00 R0,00 Internal
funds
PEC009B Improve
community
service, safety
and illegal
dumping
O’hoek R0,00 R0,00 R0,00 R0,00 R0,00 Internal
funds

102 | P a g e : D R A F T I D P 2 0 1 7 - 2 0 2 2
PEC 0010A Formalization &
licensing of
landfill site
Application
and licensing
of landfill and
to ensure
environmental
compliance
Licensed
landfill site
Dibeng R0,00 R0,00 R0,00 R0,00 R0,00 Internal
funds
PEC 0010B Formalization &
licensing of
landfill site
Application
and licensing
of landfill and
to ensure
environmental
compliance
Licensed
landfill site
O’hoek R0,00 R0,00 R0,00 R0,00 R0,00 Internal
funds
PEC 0015 BMX Skateboard
park
Recreational
Facilities
Completed
BMX,
Skateboard
park
O’Hoek R0,00 R0,00 R0,00 R0,00 R0,00 Internal
funds
PEC 0016 Establishment of
recycling and
Buyback facility
O’hoek R0,00 R0,00 R0,00 R0,00 R0,00
PEC 0017 Upgrading of
park and
palisade
fencing
Beautification
of town/
improve social
lives of the
residents
Construction
of ablution
facilities
Sesheng R 600,000 R0,00 R0,00 R0,00 R0,00 Internal
funds

103 | P a g e : D R A F T I D P 2 0 1 7 - 2 0 2 2
PEC 0018 Construction of
sports complex
Recreation &
sports
development
Construct
sports
ground
Sesheng R0 R0,00 R 500,000 R 2,000,000 R0,00 R 250,000 Internal
funds
PEC 0019 Construction of
Sports Complex
Recreation
and sports
development
Constructed
sports
ground
Kathu R10,000,000 R0,00 R0,00 R0,00 R0,00 Sports and
Recreatio
n
PEC 0020 Greening of
Municipal
Properties
Beautification Completed
greening
project
GLM R0,00 R0,00 R0,00 R 300,000 R0 R0,00 Internal
funds
Footnote: All Projects indicated by an astrich (**) will not reflect in the Annual budget due to:
The procurement and implementation executed similarly, by the donor.
The funding of these projects/programmes as reflected in the IDP will not be received into our coffers, but delivered in conj unction with the
municipality through service level agreements and memorandum of understanding and to be handed over at completion thereof.

ANNEXURE A

ANNEXURE B

ANNEXURE C

Gamagara Local Municipality
c/o Hendrik van Eck and Frikkie Meyer Road
KATHU
8446
Tel: 053 723 6000
Fax: 053 723 2021
Mr Hendry Horniet, [email protected] or
Mr. Protea Leserwane at [email protected]


![MHLONTLO LOCAL MUNICIPALITY IDP 2017 – 2022 · Population pyramid - Mhlontlo Local Municipality, 2015 vs. 2020 [Percentage].....42 CHART 3. Population pyramid - Mhlontlo Local Municipality](https://img.dokumen.tips/doc/110x75/600f3d43b0eb4d0d3872c6bf/mhlontlo-local-municipality-idp-2017-a-2022-population-pyramid-mhlontlo-local.jpg)