Embed Size (px)
Citation preview

Wireless Sensor Networks for On-ield Agricultural Management Process 1
Wireless Sensor Networks for On-ield Agricultural Management Process
Luca Bencini, Davide Di Palma, Giovanni Collodi, Gianfranco Manes and Antonio Manes
0
Wireless Sensor Networks for On-fieldAgricultural Management Process
Luca Bencini, Davide Di Palma, Giovanni Collodi and Gianfranco ManesDepartment of Electronics and Telecommunications - University of Florence
Italy
Antonio ManesNetsens S.r.l.
Italy
1. Introduction
Agriculture is one of the most ancient activities of man in which innovation and technologyare usually accepted with difficulty, unless real and immediate solutions are found for specificproblems or for improving production and quality. Nevertheless, a new approach of gatheringinformation from the environment could represent an important step towards high qualityand eco-sustainable agriculture.Nowadays, irrigation, fertilization and pesticides management are often left to the farmer’sand agronomist’s discretion: common criteria used to guarantee safe culture and plant growthare often giving a greater amount of chemicals and water than necessary. There is no directfeedback between the decision of treating or irrigating plants and the real effects in the field.Plant conditions are usually committed to sporadic and faraway weather stations that cannotprovide accurate and local measurements of the fundamental parameters in each zone of thefield. Also, agronomic models, based on these monitored data, cannot provide reliable infor-mation. On the contrary, agriculture needs detailed monitoring in order to obtain real timefeedback between plants, local climate conditions and man’s decisions.The concept of precision agriculture has been around for some time now. Blackmore et al.,in 1994 (Blackmore, 1994) defined it as a comprehensive system designed to optimize agricul-tural production by carefully tailoring soil and crop management to correspond to the uniquecondition found in each field while maintaining environmental quality. The early adoptersduring that time found precision agriculture to be unprofitable and the instances in which itwas implemented were few and far between. Further, the high initial investment in the formof electronic equipment for sensing and communication meant that only large farms could af-ford it. The technologies proposed at this point comprised three aspects: Remote Sensing (RS),Global Positioning System (GPS) and Geographical Information System (GIS). RS coupled withGPS coordinates produced accurate maps and models of the agricultural fields. The samplingwas typically through electronic sensors such as soil probes and remote optical scanners fromsatellites. The collection of such data in the form of electronic computer databases gave birthto the GIS. Statistical analyses were then conducted on the data and the variability of agri-cultural land was charted with respect to its properties. The technology, apart from being
1
www.intechopen.com

non-real-time, involved the use of expensive technologies like satellite sensing and was laborintensive where the maps charting the agricultural fields were mostly manually done.Over the last seven years, the advancement in sensing and communication technologies hassignificantly brought down the cost of deployment and running of a feasible precision agri-culture framework. Emerging wireless technologies with low power needs and low data ratecapabilities have been developed which perfectly suit precision agriculture (Wang et al., 2006).The sensing and communication can now be done on a real-time basis leading to better re-sponse times. The wireless sensors are cheap enough for wide spread deployment and of-fer robust communication through redundant propagation paths (Akyildiz & Xudong, 2005).Thanks to these features, the Wireless Sensor Networks (WSNs) (Akyildiz & Xudong, 2005) havebecome the most suitable technology to fit an invasive method of monitoring the agriculturalenvironment.In this chapter, an end-to-end monitoring WSN technology-based solution is presented, join-ing hardware optimization with communications protocols design and a suitable interface.In particular Section 2 discusses the system requirements and illustrates the overall systemcharacterization in conjunction with related work. Sections 3, 4 and 5 deal respectively withthe system in terms of hardware, protocol and software design. Section 6 describes the actualexperiences, focusing on several case study analyses for highlighting the effectiveness andaccurateness of the developed system. Sections 7 and 8 describe respectively the commercialsystem ”VineSense”, born from the experimental solution, and some agronomic results. Fi-nally, in Section 9 some conclusions are drawn in order to explain the future direction of thecurrent research study.
2. System Requirement and Architecture
The requirements that adopting a WSN are expected to satisfy in effective agricultural mon-itoring concern both system level issues (i.e., unattended operation, maximum network lifetime, adaptability or even functionality and protocol self-reconfigurability) and final userneeds (i.e., communication reliability and robustness, user friendliness, versatile and pow-erful graphical user interfaces). The most relevant mainly concerns the supply of stand-aloneoperations. To this end, the system must be able to run unattended for a long period, as nodesare expected to be deployed in zones that are difficult to maintain. This calls for optimal en-ergy management ensuring that the energy spent is directly related to the amount of traffichandled and not to the overall working time. In fact, energy is nevertheless a limited resourceand the failure of a node may compromise WSN connectivity as the network gets partitioned.Other issues to be addressed are the capabilities of quickly setting-up an end-to-end com-munication infrastructure, supporting both synchronous and asynchronous queries, and ofdynamically reconfiguring it. An additional requirement is robust operative conditions, whichneed fault management since a node may fail for several reasons. Other important propertiesare scalability and adaptability of the network’s topology, in terms of the number of nodes andtheir density in unexpected events with a higher degree of responsiveness and reconfigurabil-ity. This also implies the development of a plug and play sensor interface and the provisioningof remote connectivity. Finally, several user-oriented attributes, including fairness, latency,throughput and enhanced data querying schemes (i.e., time-driven (Al-Karaki & Kamal, 2004)or query-driven) need to be taken into account even if they could be considered secondary withrespect to our application purposes because the WSN’s cost/performance trade-off (Langen-doen & Halkes, 2004).
NODE 1
NODE 2
NODE 3
NODE 4
GPRS GATEWAY
REMOTE SERVER
TCP-IPover
GPRS
WEB INTERFACE
www.intechopen.com

Wireless Sensor Networks for On-ield Agricultural Management Process 3
A WSN system was developed according to the afore mentioned requirements. The system,shown in Fig. 1, comprises a self-organizing mesh WSN endowed with sensing capabilities, aGPRS Gateway, which gathers data and provides a TCP-IP based connection toward a RemoteServer, and a Web Application, which manages information and makes the final user capableof monitoring and interacting with the instrumented environment.
NODE 1
NODE 2
NODE 3
NODE 4
GPRS GATEWAY
REMOTE SERVER
TCP-IPover
GPRS
WEB INTERFACE
Fig. 1. Wireless Sensor Network System
3. Hardware Design
Focusing on an end-to-end system architecture, every constitutive element has to be selectedaccording to application requirements and scenario issues, especially regarding the hardwareplatform. Many details have to be considered, involving the energetic consumption of the sen-sor readings, the power-on and power-save status management and a good trade-off betweenthe maximum radio coverage and the transmitted power. After an accurate investigationof the out-of-the-shelf solutions, 868 MHz Mica2 motes (Mica2 Series, 2002) were adopted ac-cording to these constraints and to the reference scenarios. The Tiny Operative System (TinyOS)running on this platform ensures full control of mote communication capabilities to attain op-timized power management and provides necessary system portability towards future hard-ware advancements or changes. Nevertheless, Mica2 motes are far from perfection, especiallyin the RF section, since the power provided by the transceiver (Chipcon CC1000) is not com-pletely available for transmission. However, it is lost to imperfect coupling with the antenna,thus reducing the radio coverage area. An improvement of this section was performed, usingmore suitable antennas and coupling circuits and increasing the transmitting power with apower amplifier, thus increasing the output power up to 15 dBm while respecting interna-tional restrictions and standards. These optimizations allow for greater radio coverage (about
www.intechopen.com

200 m) and better power management. In order to manage different kinds of sensors, a compli-ant sensor board was adopted, allowing up to 16 sensor plugs on the same node;, this makes asingle mote capable of sensing many environmental parameters at a time (Mattoli et al., 2005).Sensor boards recognize the sensors and send Transducer Electronic Datasheets (TEDS) throughthe network up to the server, making it possible for the system to recognize an automaticsensor. The overall node stack architecture is shown in Fig. 2.
Communication Board
Power Board
Sensor Board
Overall size: 58x32x25 mm
Fig. 2. Node Stack Architecture
The GPRS embedded Gateway, shown in Fig. 3, is a stand-alone communication platformdesigned to provide transparent, bi-directional wireless TCP-IP connectivity for remote mon-itoring. In conjunction with Remote Data Acquisition (RDA) equipment, such as WSN, it actswhen connected with a Master node or when directly connected to sensors and transducers(i.e., Stand-Alone weather station, Stand-Alone monitoring camera).
Fig. 3. GPRS Gateway
The main hardware components that characterize the gateway are:
• a miniaturized GSM/GPRS modem, with embedded TCP/IP stack (Sveda et al.,2005), (Jain et al., 1990);
• a powerful 50 MHz clock microcontroller responsible for coordinating the bidirectionaldata exchange between the modem and the master node to handle communication withthe Remote Server;
www.intechopen.com

Wireless Sensor Networks for On-ield Agricultural Management Process 5
Communication Board
Power Board
Sensor Board
Overall size: 58x32x25 mm
• an additional 128 KB SRAM memory added in order to allow for data buffering, evenif the wide area link is lost;
• several A/D channels available for connecting additional analog sensors and a batteryvoltage monitor.
Since there is usually no access to a power supply infrastructure, the hardware design hasalso been oriented to implement low power operating modalities, using a 12 V rechargeablebattery and a 20 W solar panel.Data between the Gateway and Protocol Handler are carried out over TCP-IP communica-tion and encapsulated in a custom protocol; from both local and remote interfaces it is alsopossible to access part of the Gateway’s configuration settings. The low-level firmware im-plementation of communication protocol also focuses on facing wide area link failures. Sincethe gateway is always connected with the Remote Server, preliminary connectivity experi-ments demonstrated a number of possible inconveniences, most of them involving the ServiceProvider Access Point Name (APN) and Gateway GPRS Support Node (GGSN) subsystems. Inorder to deal with these drawbacks, custom procedures called Dynamic Session Re-negotiation(DSR) and Forced Session Re-negotiation (FSR), were implemented both on the gateway and onthe CMS server. This led to a significant improvement in terms of disconnection periods andpacket loss rates.The DSR procedure consists in a periodical bi-directional control packet exchange, aimedat verifying the status of uplink and downlink channels on both sides (gateway and CMS).This approach makes facing potential deadlocks possible if there is asymmetric socket failure,which is when one device (acting as client or server) can correctly deliver data packets on theTCP/IP connection but is unable to receive any. Once this event occurs (it has been observedduring long GPRS client connections, and is probably due to Service Provider Access Pointfailures), the DSR procedure makes the client unit to restart the TCP socket connection withthe CMS.Instead, the FSR procedure is operated on the server side when no data or service packets arereceived from a gateway unit and a fixed timeout elapses: in this case, the CMS closes theTCP socket with that unit and waits for a new reconnection. On the other side, the gatewayunit should catch the close event exception and start a recovery procedure, after which anew connection is re-established. If the close event should not be signaled to the gateway(for example, the FSR procedure is started during an asymmetric socket failure), the gatewaywould anyway enter the DSR recovery procedure.In any case, once the link is lost, the gateway unit tries to reconnect with the CMS until aconnection is re-established.
4. Protocol Design
The most relevant system requirements, which lead the design of an efficient Medium AccessControl (MAC) and routing protocol for an environmental monitoring WSN, mainly concernpower consumption issues and the possiblity of a quick set-up and end-to-end communicationinfrastructure that supports both synchronous and asynchronous queries. The most relevantchallenge is to make a system capable of running unattended for a long period, as nodes areexpected to be deployed in zones that are difficult to maintain. This calls for optimal energymanagement since a limited resource and node failure may compromise WSN connectivity.Therefore, the MAC and the network layer must be perfected ensuring that the energy usedis directly related to the amount of handled traffic and not to the overall working time.
www.intechopen.com

Other important properties are scalability and adaptability of network topology, in terms ofnumber of nodes and their density. As a matter of fact, some nodes may either be turned offmay join the network afterward.Taking these requirements into account, a MAC protocol and a routing protocol were imple-mented.
4.1 MAC Layer Protocol
Taking the IEEE 802.11 Distributed Coordination Function (DCF) (IEEE St. 802.11, 1999) asa starting point, several more energy efficient techniques have been proposed in literature toavoid excessive power waste due to so called idle listening. They are based on periodicalpreamble sampling performed at the receiver side in order to leave a low power state andreceive the incoming messages, as in the WiseMAC protocol (El-Hoiydi et al., 2003). Derivingfrom the classical contention-based scheme, several protocols (S-MAC (Ye et al., 2002), TMAC(Dam & Langendoen, 2003) and DMAC (Lu et al., 2004)) have been proposed to address theoverhead idle listening by synchronizing the nodes and implementing a duty cycle withineach slot.Resorting to the above considerations, a class of MAC protocols was derived, named Syn-chronous Transmission Asynchronous Reception (STAR) which is particularly suited for a flat net-work topology and benefits from both WiseMAC and S-MAC schemes. More specifically, dueto the introduction of a duty-cycle, it joins the power saving capability together with the ad-vantages provided by the offset scheduling, without excessive overhead signaling. Accordingto the STAR MAC protocol, each node might be either in an idle mode, in which it remains fora time interval Tl (listening time), or in an energy saving sleeping state for a Ts (sleeping time).The transitions between states are synchronous with a period frame equal to Tf = Tl + Ts par-titioned in two sub-intervals; as a consequence, a duty-cycle function can also be introduced:
d =Tl
Tl + Ts(1)
To provide the network with full communication capabilities, all the nodes need to be weaklysynchronized, meaning that they are aware at least of the awaking time of all their neighbors.To this end, as Fig. 4 shows, a node sends a synchronization message (SYNC) frame by frameto each of its neighbor nodes known to be in the listening mode (Synchronous Transmission),whereas, during the set-up phase in which each node discovers the network topology, the con-trol messages are asynchronously broadcasted. On the other hand, its neighbors periodicallyawake and enter the listening state independently (Asynchronous Reception). The header ofthe synchronization message contains the following fields: a unique node identifier, the mes-sage sequence number and the phase, or the time interval after which the sender claims to bein the listening status waiting for both synchronization and data messages from its neighbors.If the node is in the sleeping status, the phase φ is evaluated according to the following rule:
φ1 = τ − Tl (2)
where τ is the time remaining to the next frame beginning. Conversely, if the mote is in thelistening status, φ is computed as:
φ2 = τ + Ts (3)
In order to fully characterize the STAR MAC approach, the related energy cost normalizedcan be evaluated as it follows:
www.intechopen.com

Wireless Sensor Networks for On-ield Agricultural Management Process 7
NODE 1
NODE 3
NODE 2
t
t
t
lT
sT
fTlT
sT
sT
lTfT
fT
SYNCYNYN
SYNCYNYN
SYNCYNYN SYNCYNYN
SYNCYNYN
SYNCYNYN
SYNCSSYNYN
SYNCYNYN
SYNCYNYN
Fig. 4. STAR MAC Protocol Synchronization Messages Exchange
C = crxdTf + csleep[Tf (1 − d)− NTpkt] + NCtx [mAh] (4)
where csleep and crx represent the sleeping and the receiving costs [mA] and Ctx is the singlepacket transmission costs [mAh], Tf is the frame interval [s], d is the duty cycle, Tpkt is thesynchronization packet time length [s] and finally N is the number of neighbors. When thefollowing inequality is hold:
NTpkt ≪ Tf (5)
then:C ≃ crxdTf + csleepTf (1 − d) + NCtx [mAh] (6)
The protocol cost normalized to the synchronization time is finally:
C
Tf= crxd + csleep(1 − d) +
NCtx
T f[mA] (7)
As highlighted in Table 1, it usually happens that ctx ≪ csleep ≪ crx , where ctx = Ctx/Tpkt andTpkt is the packet transmission time [s] assumed equal to 100 ms as worst case. This meansthat the major contribution to the overall cost is represented by the listening period that theSTAR MAC protocol tries to suitably minimize.
crx 12 mA
csleep 0.01 mA
Ctx 30 mAh
ctx 0.001 mA
Table 1. Power Consumption Parameters for the Considered Platform.
In Fig. 5(a) the normalized cost versus the number of neighbor nodes is shown for the S-MACand STAR MAC schemes. It is worth noticing that the performance of the proposed protocolis better with respect to the existing approach for a number of neighbor nodes greater than 7.In Fig. 5(b) the normalized costs of S-MAC and STAR MAC approaches are compared with
www.intechopen.com

1 2 3 4 5 6 7 8 9 10 110
0.1
0.2
0.3
0.4
0.5
0.6
0.7
Neighbour Nodes
Nor
mal
ized
Cos
t [m
A]
STAR MACS−MAC
(a) Normalized Cost vs. Neighbor Nodes
1 2 3 4 5 60
0.1
0.2
0.3
0.4
0.5
0.6
0.7
Duty Cycle [%]
Nor
mal
ized
Cos
t [m
A]
S−MACSTAR MAC
(b) Normalized Cost vs. Duty Cycle Duration
Fig. 5. STAR MAC Performance
respect to the duty cycle duration for a number of neighbor nodes equal to 8. It is possible tonotice that for d < 3.5% the proposed protocol provide a significant gain.Nevertheless, for densely deployed or high traffic loaded WSN, STAR MAC approach mightsuffers the shortcoming of cost increasing due to the large number of unicasted messages. Tolimit this effect, an enhanced approach, named STAR+, was introduced, aiming at minimizingalso the packet transmission cost. According to it, only one synchronization packet is multi-casted to all the neigh- bor nodes belonging to a subset, i.e., such that they are jointly awakefor a time interval greater than Tl . This leads to an additional advantage, as the numberof neighbors increases allowing better performance with respect to scalability and a powersaving too. Besides, the synchronization overhead is reduced with a consequent collisionslowering. Under this hypothesis the normalized cost might be expressed as:
C
Tf= crxd + csleep(1 − d) +
KCtx
T f[mA] (8)
where K is the number of subsets. Since K ≤ N, the normalized cost results to be remarkablylowered, especially if number of nodes and duty-cycle get higher, even if the latter case isinherently power consuming.
4.2 Network Layer Protocol
In order to evaluate the capability of the proposed MAC scheme in establishing effective end-to-end communications within a WSN, a routing protocol was introduced and integrated ac-cording to the cross layer design principle (Shakkottai et al., 2003). In particular, we refer toa proactive algorithm belonging to the class link-state protocol that enhance the capabilitiesof the Link Estimation Parent Selection (LEPS) protocol. It is based on periodically informationneeded for building and maintaining the local routing table, depicted in Table 2. However,our approach resorts both to the signaling introduced by the MAC layer (i.e., synchronizationmessage) and by the Network layer (i.e., ping message), with the aim of minimizing the over-head and make the system more adaptive in a cross layer fashion. In particular, the parameterstransmitted along a MAC synchronization message, with period Tf , are the following:
• next hop (NH) to reach the gateway, that is, the MAC address of the one hop neighbor;
www.intechopen.com

Wireless Sensor Networks for On-ield Agricultural Management Process 9
1 2 3 4 5 6 7 8 9 10 110
0.1
0.2
0.3
0.4
0.5
0.6
0.7
Neighbour Nodes
Nor
mal
ized
Cos
t [m
A]
STAR MACS−MAC
1 2 3 4 5 60
0.1
0.2
0.3
0.4
0.5
0.6
0.7
Duty Cycle [%]
Nor
mal
ized
Cos
t [m
A]
S−MACSTAR MAC
• distance (HC) to the gateway in terms of number of needed hops;
• phase (PH) that is the schedule time at which the neighbor enter in listening mode ac-cording to Equation (2) and Equation (3);
• link quality (LQ) estimation as the ratio of correctly received and the expected synchro-nization messages from a certain neighbor.
Target NH HC PH LQ BL CL
Sink 1 A NA φA ηA BA CA
B NB φB ηB BB CB
Sink 2 C NC φC ηC BC CC
D ND φD ηD BD CD
Table 2. Routing Table General Structure
On the other hand, the parameters related to long-term phenomena are carried out by theping messages, with period Tp ≫ Tf , in order to avoid unnecessary control traffics and, thus,reducing congestion. Particularly, they are:
• battery level (BL) (i.e., an estimation of the energy available at that node);
• congestion level (CL) in terms of the ratio between the number of packets present in thelocal buffer and the maximum number of packets to be stored in.
Once, the routing table has been filled with these parameters, it is possible to derive the propermetric by means of a weighted summation of them. It is worth mentioning that the routingtable might indicate more than one destination (sink) thanks to the ping messages that keeptrace of the intermediate nodes within the message header.
5. Software and End User Interface Design
The software implementation was developed, considering a node as both a single elementin charge of accomplishing prearranged tasks and as a part of a complex network in whicheach component plays a crucial role in the network’s maintenance. As far as the former aspectis concerned, several TinyOS modules were implemented for managing high and low powerstates and for realizing a finite state machine, querying sensors at fixed intervals and achievinganti-blocking procedures, in order to avoid software failure or deadlocks and provide a robuststand alone system. On the other hand, the node has to interact with neighbors and provideadequate connectivity to carry the messages through the network, regardless of the destina-tion. Consequently, additional modules were developed according to a cross layer approachthat are in charge of managing STAR MAC and multihop protocols. Furthermore, other mod-ules are responsible for handling and forwarding messages, coming from other nodes or fromthe gateway itself. Messages are not only sensing (i.e., measures, battery level) but also controland management messages (i.e., synchronization, node reset). As a result, a full interactionbetween the final user and the WSN is guaranteed.The final user may check the system status through graphical user interface (GUI) accessiblevia web. After the log-in phase, the user can select the proper pilot site. For each site thedeployed WSN together with the gateway is schematically represented through an interactivemap. In addition to this, the related sensors display individual or aggregate time diagrams
www.intechopen.com

for each node with an adjustable time interval (Start/Stop) for the observation. System moni-toring could be performed both at a high level with a user friendly GUI and at a low level bymeans of message logging.Fig. 6 shows some friendly Flash Player applications that, based on mathematical models, an-alyze the entire amount of data in a selectable period and provide ready-to-use information.Fig. 6(a) specifically shows the aggregate data models for three macro-parameters, such asvineyard water management, plant physiological activity and pest management. The appli-cation, using cross light colors for each parameter, points out normal (green), mild (yellow)or heavy (red) stress conditions and provides suggestions to the farmer on how to apply pes-ticides or water in a certain part of the vineyard. Fig. 6(b) shows a graphical representationof the soil moisture measurement. Soil moisture sensors positioned at different depths in thevineyard make it possible to verify whether a summer rain runs off on the soil surface orseeps into the earth and provokes beneficial effects on the plants: this can be appreciated witha rapid look at the soil moisture aggregate report which, shows the moisture sensors at twodepths with the moisture differences colore in green tones. Fig. 6(c) highlights stress condi-tions on plants, due to dry soil and/or to hot weather thanks to the accurate trunk diametricgrowth sensor that can follow each minimal variation in the trunk giving important infor-mation on plant living activity. Finally, Fig. 6(d) shows a vineyard map: the green spots arewireless units, distributed in a vineyard of one hectare.
6. Real World Experiences
The WSN system described above was developed and deployed in three pilot sites and in agreenhouse. Since 2005, an amount of 198 sensors and 50 nodes have continuously sent datato a remote server. The collected data represents a unique database of information on grapegrowth useful for investigating the differences between cultivation procedures, environmentsand treatments.
6.1 Pilot Sites Description
The first pilot site was deployed in November 2005 on a sloped vineyard of the Montepaldifarm in Chianti Area (Tuscany - Italy). The vineyard is a wide area where 13 nodes (includingthe master node) with 24 sensors, running STAR MAC and dynamic routing protocols weresuccessfully deployed. The deployment took place in two different steps: during the first one,6 nodes (nodes 9,10,14,15,16,17) were placed to perform an exhaustive one week test. Themost important result regards the multi-hop routing efficiency, estimated as:
ηMHop =MEU
Mex(9)
where ηMHop is the efficiency, MEU are the messages correctly received by the remote user andMex are the expected transmitted messages. For the gateway neighbors, ηMHop is very high,over 90%. However, even nodes far from the gateway (i.e., concerning an end-to-end multihoppath) show a message delivery rate (MDR) of over 80%. This means that the implementedrouting protocol does not affect communication reliability. After the second deployment, inwhich nodes 11,12,13,18,19,20 were arranged, the increased number of collisions changed theglobal efficiency, thus decreasing the messages that arrived to the end user, except for nodes18,19,20, in which an upgraded firmware release was implemented. The related results aredetailed in Table 3.
GoodFood EU Integrated ProjectFood Safety and Quality Monitoring with Microsystems
Home LogoutSite 1 - Montepaldi Farm
This site requires Macromedia Flash Player. Download itGoodFood - EU Integrated Project © All rights reserved
Powered by C.S.I.A.F. Università degli Studi di Firenze
Page 1 of 1GoodFood Project
29/09/2009http://www.unifi.it/midra/goodfood/dashboard.php
This site requires Macromedia Flash Player. Download itGoodFood - EU Integrated Project © All rights reserved
Powered by C.S.I.A.F. Università degli Studi di Firenze
Page 2 of 2GoodFood Project
01/10/2009http://www.unifi.it/midra/goodfood/showIDW.php
www.intechopen.com

Wireless Sensor Networks for On-ield Agricultural Management Process 11
GoodFood EU Integrated ProjectFood Safety and Quality Monitoring with Microsystems
Home LogoutSite 1 - Montepaldi Farm
This site requires Macromedia Flash Player. Download itGoodFood - EU Integrated Project © All rights reserved
Powered by C.S.I.A.F. Università degli Studi di Firenze
Page 1 of 1GoodFood Project
29/09/2009http://www.unifi.it/midra/goodfood/dashboard.php
(a) Aggregate Data Models for Vineyard WaterManagement, Plant Physiological Activity andPest Management This site requires Macromedia Flash Player. Download it
GoodFood - EU Integrated Project © All rights reserved
Powered by C.S.I.A.F. Università degli Studi di Firenze
Page 2 of 2GoodFood Project
01/10/2009http://www.unifi.it/midra/goodfood/showIDW.php
(b) Soil Moisture Aggregation Report: the up-per map represent soil moisture @ 10 cm in thesoil and the lower map represents soil moisture@ 35cm in the vineyard after a slipping rain
(c) Trunk Diametric Growth Diagram: daily andnightly metabolic phases
(d) Distributed Wireless Nodes in a Vineyard
Fig. 6. Flash Player User Interface
This confirms the robustness of the network installed and the reliability of the adopted com-munications solution, also considering the power consumption issues: batteries were replacedon March 11th 2006 in order to face the entire farming season. After that, eleven months passedbefore the first battery replacement occurred on February 11th 2007, confirming our expecta-tions and fully matching the user requirements. The overall Montepaldi system has been run-ning unattended for one year and a half and is going to be a permanent pilot site. So far, nearly2 million samples from the Montepaldi vineyard have been collected and stored in the serverat the University of Florence Information Services Centre (CSIAF), helping agronomist expertsimprove wine quality through deeper insight on physical phenomena (such as weather andsoil) and the relationship with grape growth.The second pilot site was deployed on a farm in the Chianti Classico with 10 nodes and 50sensors at about 500 m above sea level on a stony hill area of 2.5 hectares. The environmental
www.intechopen.com

Location MDR
Node 9 72.2%
Node 10 73.7%
Node 11 88.5%
Node 12 71.4%
Node 13 60.4%
Node 14 57.2%
Node 15 45.6%
Node 16 45.4%
Node 17 92.1%
Node 18 87.5%
Node 19 84.1%
Table 3. Message Delivery Rate for the Montepaldi Farm Pilot Site
variations of the the ”terroir” have been monitored since July 2007, producing one of the mostappreciated wines in the world.Finally, the third WSN was installed in Southern France in the vineyard of Peach Rouge atGruissan. High sensor density was established to guarantee measurement redundancy and toprovide a deeper knowledge of the phenomena variation in an experimental vineyard wheremicro-zonation has been applied and where water management experiments have been per-formed for studying plant reactions and grape quality.
6.2 Greenhouse
An additional deployment at the University of Florence Greenhouse was performed to let theagronomist experts conduct experiments even in seasons like Fall and Winter, where plantsare quiescent, thus breaking free from the natural growth trend. This habitat also creates theopportunity to run several experiments on the test plants, in order to evaluate their responsesunder different stimuli using in situ sensors.The greenhouse environmental features are completely different from those of the vineyard: asa matter of fact, the multipath propagation effects become relevant, due to the indoor scenarioand the presence of a metal infrastructure. A highly dense node deployment, in terms ofboth nodes and sensors, might imply an increased network traffic load. Nevertheless, thesame node firmware and hardware used in the vineyard are herein adopted; this leads to aresulting star topology as far as end-to-end communications are concerned.Furthermore, 6 nodes have been in the greenhouse since June 2005, and 30 sensors have con-stantly monitored air temperature and humidity, plants soil moisture and temperature, differ-ential leaf temperature and trunk diametric growth. The sensing period is equal to 10 min-utes, less than the climate/plant parameter variations, providing redundant data storage. TheWSN message delivery rate is extremely high: the efficiency is over 95%, showing that a lownumber of messages are lost.
7. VineSense
The fruitful experience of the three pilot sites was gathered by a new Italian company, Netsens,founded as a spinoff of the University of Florence. Netsens has designed a new monitoring
www.intechopen.com
Wireless Sensor Networks for On-ield Agricultural Management Process 13
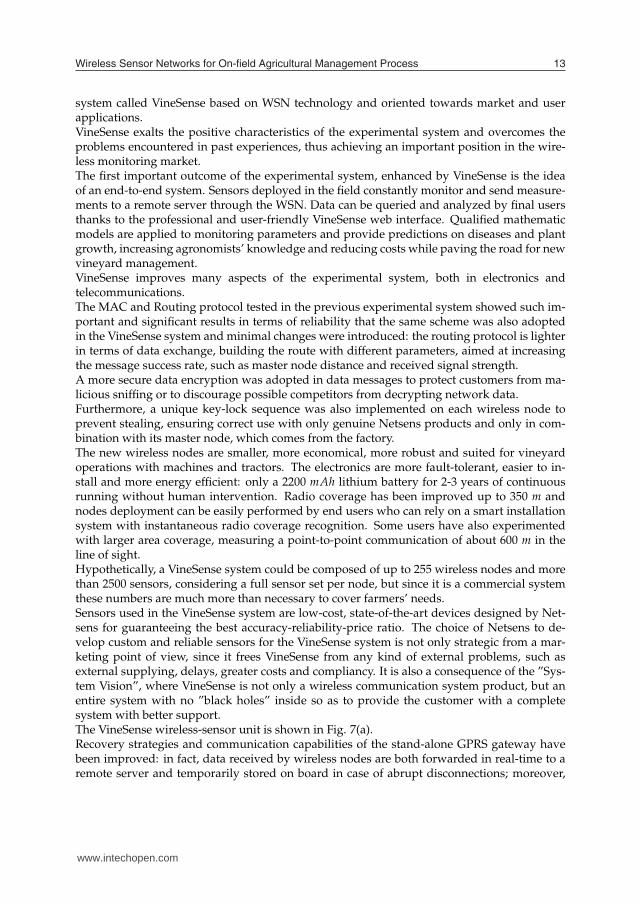
system called VineSense based on WSN technology and oriented towards market and userapplications.VineSense exalts the positive characteristics of the experimental system and overcomes theproblems encountered in past experiences, thus achieving an important position in the wire-less monitoring market.The first important outcome of the experimental system, enhanced by VineSense is the ideaof an end-to-end system. Sensors deployed in the field constantly monitor and send measure-ments to a remote server through the WSN. Data can be queried and analyzed by final usersthanks to the professional and user-friendly VineSense web interface. Qualified mathematicmodels are applied to monitoring parameters and provide predictions on diseases and plantgrowth, increasing agronomists’ knowledge and reducing costs while paving the road for newvineyard management.VineSense improves many aspects of the experimental system, both in electronics andtelecommunications.The MAC and Routing protocol tested in the previous experimental system showed such im-portant and significant results in terms of reliability that the same scheme was also adoptedin the VineSense system and minimal changes were introduced: the routing protocol is lighterin terms of data exchange, building the route with different parameters, aimed at increasingthe message success rate, such as master node distance and received signal strength.A more secure data encryption was adopted in data messages to protect customers from ma-licious sniffing or to discourage possible competitors from decrypting network data.Furthermore, a unique key-lock sequence was also implemented on each wireless node toprevent stealing, ensuring correct use with only genuine Netsens products and only in com-bination with its master node, which comes from the factory.The new wireless nodes are smaller, more economical, more robust and suited for vineyardoperations with machines and tractors. The electronics are more fault-tolerant, easier to in-stall and more energy efficient: only a 2200 mAh lithium battery for 2-3 years of continuousrunning without human intervention. Radio coverage has been improved up to 350 m andnodes deployment can be easily performed by end users who can rely on a smart installationsystem with instantaneous radio coverage recognition. Some users have also experimentedwith larger area coverage, measuring a point-to-point communication of about 600 m in theline of sight.Hypothetically, a VineSense system could be composed of up to 255 wireless nodes and morethan 2500 sensors, considering a full sensor set per node, but since it is a commercial systemthese numbers are much more than necessary to cover farmers’ needs.Sensors used in the VineSense system are low-cost, state-of-the-art devices designed by Net-sens for guaranteeing the best accuracy-reliability-price ratio. The choice of Netsens to de-velop custom and reliable sensors for the VineSense system is not only strategic from a mar-keting point of view, since it frees VineSense from any kind of external problems, such asexternal supplying, delays, greater costs and compliancy. It is also a consequence of the ”Sys-tem Vision”, where VineSense is not only a wireless communication system product, but anentire system with no ”black holes” inside so as to provide the customer with a completesystem with better support.The VineSense wireless-sensor unit is shown in Fig. 7(a).Recovery strategies and communication capabilities of the stand-alone GPRS gateway havebeen improved: in fact, data received by wireless nodes are both forwarded in real-time to aremote server and temporarily stored on board in case of abrupt disconnections; moreover,
www.intechopen.com

automatic reset and restart procedures avoid possible software deadlocks or GPRS networkfailures. Finally, a high-gain antenna guarantees good GPRS coverage almost everywhere.The GPRS gateway firmware has been implemented for remotely managing of the acquisitionsettings, relieving users of the necessity of field maintenance.The GPRS gateway communication has been greatly improved introducing new differentcommunication interfaces, such as Ethernet connection (RJ-45), USB data downloading andthe possibility of driving an external Wi-Fi communication system for short-range transmis-sions.Since the beginning of 2010, the ”Always On” connection started to be fully used and itboosted the VineSense system, enlarging its possible field of application: a complete bidi-rectional communication was established between the GPRS unit in the field and the remoteserver at Netsens. The previous ”one way” data flow, from the vineyard to the internet, wasgone over by a new software release, able to send instantaneous messages from the VineSenseweb interface to the field: the monitoring system was changed into the monitoring and controlsystem, sending automatic, scheduled or asynchronous commands to the gateway station orto nodes, i.e. to open or close irrigation systems or simply to download a firmware upgrade.In Fig. 7(b) the GPRS gateway with weather sensors is shown.
(a) VineSense Wireless Unit (b) VineSense GPRS Gatewaywith Weather Sensors
Fig. 7. VineSense Hardware Elements
The web interface is the last part of VineSense’s end-to-end: the great amount of data gatheredby the sensors and stored in the database needs a smart analysis tool to become useful andusable. For this reason different tools are at the disposal of various kinds of users. On onehand, some innovative tools such as control panels for real time monitoring or 2D chromaticmaps create a quick and easy approach to the interface. On the other hand, professional plotsand data filtering options allow experts or agronomists to study them more closely.
8. Agronomic Results
The use of VineSense in different scenarios with different agronomic aims has brought a largeamount of important results.
www.intechopen.com

Wireless Sensor Networks for On-ield Agricultural Management Process 15
When VineSense is adopted to monitor soil moisture positive effects can be obtained for plantsand saving water, thus optimizing irrigation schedules. Some examples of this applicationcan be found in systems installed in the Egyptian desert where agriculture is successful onlythrough wise irrigation management. In such a terroir, plants suffer continuous hydric stressduring daylight due to high air temperature, low air humidity and hot sandy soils with a lowwater retention capacity. Water is essential for plant survival and growth, an irrigation delaycan be fatal for the seasonal harvest therefore, a reliable monitoring system is necessary. Theadoption of VineSense in this scenario immediately resulted in continuous monitoring of theirrigating system, providing an early warning whenever pump failure occurred. On the otherhand, the possibility to measure soil moisture at different depths allows agronomists to decideon the right amount of water to provide plants; depending on different day temperatures andsoil moisture, pipe schedules can be changed in order to reduce water waste and increasewater available for plants.An example of different pipe schedules is shown in Fig. 8.
Fig. 8. Different Pipe Schedules in Accordance with Soil Moisture Levels
Originally, the irrigation system was opened once a day for 5 hours giving 20 liters per day(schedule 1); since sandy soils reach saturation very rapidly most of this water was wastedin deeper soil layers; afterwards irrigation schedules were changed (schedule 2), giving thesame amount of water in two or more times per day; the water remained in upper soil layersat plant root level, reducing wastes and increasing the amount of available water for plants,as highlighted by soil moisture at 60 cm (blue plot).Another important application of the VineSense system uses the dendrometer to monitor plantphysiology. The trunk diametric sensor is a mechanical sensor with +/− 5 microns of accu-racy; such an accurate sensor can appreciate stem micro variations occurring during day andnight, due to the xilematic flux inside the plant. Wireless nodes measure plant diameter ev-ery 15 minutes, an appropriate time interval for following these changes and for creating aplot showing this trend. In normal weather conditions, common physiologic activity can berecognized by agronomists the same as a doctor can do reading an electrocardiogram; whenair temperature increases and air humidity falls in combining low soil moisture levels, plantschange their activity in order to face water stress, preserve their grapes and especially them-
www.intechopen.com

selves. This changed behavior can be registered by the dendrometer and plotted in the Vine-Sense interface, warning agronomists about incoming risks; as a consequence, new irrigationschedules can be carried into effect.Fig. 9 shows an example of a plant diametric trend versus air temperature.
Fig. 9. Plant Diametric Trend vs. Air Temperature
The blue plot represents the air temperature in 10 days, from 13th August until the 22nd August2009 in Italy; the blue line becomes red when the temperature goes over a 35 degree threshold.During the period in which the temperature is so high, plant stem variations are reduced dueto the lower amount of xilematic flux flowing in its vessels, a symptom of water leakage.WSN in agriculture are also useful for creating new databases with historical data: storinginformation highlighting peculiarities and differences of vineyards provides agronomists animportant archive for better understanding variations in plant production capabilities andgrape ripening. Deploying wireless nodes on plants in interesting areas increases the knowl-edge about a specific vineyard or a specific terroir, thus recording and proving the specificityof a certain wine. I.E., the quality of important wines such CRU, coming from only one specificvineyard, can be easily related to ”grape history”: data on air temperature and humidity, plantstress, irrigation and rain occurring during the farming season can assess a quality growingprocess, that can be declared to buyers.Finally, VineSense can be used to reduce environmental impact thanks to a more optimizedmanagement of pesticides in order to reach a sustainable viticulture. Since many of the mostvirulent vine diseases can grow in wet leaf conditions, it is very important to monitor leafwetness in a continuous and distributed way. Sensors deployed in different parts of vineyardsare a key element for agronomists in monitoring risky conditions: since wetness can changevery rapidly during the night in a vineyard and it is not homogeneous in a field, a real timedistributed system is the right solution for identifying risky conditions and deciding when andwhere to apply chemical treatments. As a result, chemicals can be used only when they arestrictly necessary and only in small parts of the vineyard where they are really needed, thusreducing the number of treatments per year and decreasing the amount of active substancessprayed in the field and in the environment. In some tests performed in 2009 in Chianti, theamount of pesticides was reduced by 65% compared to the 2008 season.
www.intechopen.com

Wireless Sensor Networks for On-ield Agricultural Management Process 17
Leaf wetness sensors on nodes 2 and 3 measure different wetness conditions as shown in Fig.10. The upper part of the vineyard is usually wetter (brown plot) than the lower part (blueplot) and sometimes leaf wetness persists for many hours, increasing the risk of attacks onplants.
Fig. 10. Different Leaf Wetness Conditions in a Small Vineyard
9. Conclusion
This paper deals with the design, optimization and development of a practical solution forapplication to the agro-food chain monitoring and control. The overall system was addressedin terms of the experienced platform, network issues related both to communication protocolsbetween nodes and gateway operations up to the suitable remote user interface. Every con-stitutive element of the system chain was described in detail in order to point out the featuresand the remarkable advantages in terms of complexity reduction and usability.To highlight the effectiveness and accurateness of the developed system, several case studieswere presented. Moreover, the encouraging and unprecedented results achieved by this ap-proach and supported by several pilot sites into different vineyard in Italy and France wereshown.The fruitful experience of some pilot sites was gathered by a new Italian company, Netsens,founded as a spin off of the University of Florence. Netsens has designed a new monitoringsystem called VineSense based on WSN technology and oriented towards market and userapplications. In order to point out the improvements of the new solution respect to the ex-perimental one, the main features of VineSense were described. Moreover, some importantagronomic results achieved by the use of VineSense in different scenarios were sketched out,thus emphasizing the positive effects of the WSN technology in the agricultural environment.Nowadays, the application of the solution described in this paper is under investigation to themore general field of environmental monitoring, due to its flexibility, scalability, adaptabilityand self-reconfigurability.
www.intechopen.com

10. References
Blackmore, S. (1994). Precision Farming: An Introduction, Outlook on Agriculture Journal, Vol.
23, pp. 275-280.Wang, N., Zhang, N. & Wang, M. (2006). Wireless sensors in agriculture and food industry -
Recent development and future perspective, Computers and Electronics in AgricultureJournal, Vol. 50, pp. 114-120.
Akyildiz, I.F. & Xudong, W. (2005). A Survey on Wireless Mesh Networks, IEEE Communica-tion Magazine, Vol. 43, pp. S23-S30.
Al-Karaki, J. & Kamal, A. (2004). Routing Techniques in Wireless Sensor Networks: a Survey,IEEE Communication Magazine, Vol. 11, pp. 6-28.
Langendoen, K. & Halkes, G. (2004). Energy-Efficient Medium Access Control, The EmbeddedSystems Handbook, pp. 2-30.
Mica2 Series, Avaiable on http://www.xbow.com.Mattoli, V., Mondini, A., Razeeb, K.M., Oflynn, B., Murphy, F., Bellis, S., Collodi, G., Manes,
A., Pennacchia, P., Mazzolai, B., & Dario, P. (2005). Development of a ProgrammableSensor Interface for Wireless Network Nodes for Intelligent Agricultural Applica-tions, Proceedings of IE 2005, IEEE Computer and Communications Societies, Sydney,pp. 1-6.
Sveda, M., Benes, P., Vrba, R. & Zezulka, F. (2005). Introduction to Industrial Sensor Net-working, Handbook of Sensor Networks: Compact Wireless and Wired Sensing Systems,pp. 10-24.
Jain, J.N. & Agrawala, A.K. (1990). Open Systems Interconnection: Its Architecture and Protocols,Elsevier.
IEEE Standard 802.11 (1999). Wireless LAN Medium Access Control (MAC) and Physical Layer(PHY) Specifications, IEEE Computer Society.
El-Hoiydi, A., Decotignie, J., Enz, C. & Le Roux, E. (2003). WiseMAC, an Ultra Low PowerMAC Protocol for the WiseNET Wireless Sensor Network, Proceedings of SENSYS2003, Association for Computer Machinery, Los Angeles (CA), pp. 244-251.
Ye, W., Heidemann, J. & Estrin, D. (2002). An Energy-Efficient MAC Protocol for Wireless Sen-sor Networks, Proceedings of INFOCOM 2002, IEEE Computer and CommunicationsSocieties, New York (NY), pp. 1567-1576.
Dam, T. & Langendoen, K. (2003). An Adaptive Energy-Efficient MAC Protocol for WirelessSensor Networks, Proceedings of SENSYS 2003, Association for Computer Machinery,Los Angeles (CA), pp. 171-180.
Lu, G., Krishnamachari, B. & Raghavendra, C. (2004). Adaptive Energy-Efficient and Low-Latency MAC for Data Gathering in Sensor Networks, Proceedings of WMAN 2004,Institut fur Medien.Informatik, Ulm (Germany), pp. 2440-2443.
Shakkottai, S., Rappaport, T. & Karlsson, P. (2003). Cross-Layer Design for Wireless Networks,IEEE Communication Magazine, Vol. 41, pp. 77-80.
www.intechopen.com

Wireless Sensor Networks: Application-Centric DesignEdited by Yen Kheng Tan
ISBN 978-953-307-321-7Hard cover, 492 pagesPublisher InTechPublished online 14, December, 2010Published in print edition December, 2010
InTech EuropeUniversity Campus STeP Ri Slavka Krautzeka 83/A 51000 Rijeka, Croatia
InTech ChinaUnit 405, Office Block, Hotel Equatorial Shanghai No.65, Yan An Road (West), Shanghai, 200040, China
Phone: +86-21-62489820
Over the past decade, there has been a prolific increase in the research, development and commercialisationof Wireless Sensor Networks (WSNs) and their associated technologies. WSNs have found application in avast range of different domains, scenarios and disciplines. These have included healthcare, defence andsecurity, environmental monitoring and building/structural health monitoring. However, as a result of the broadarray of pertinent applications, WSN researchers have also realised the application specificity of the domain; itis incredibly difficult, if not impossible, to find an application-independent solution to most WSN problems.Hence, research into WSNs dictates the adoption of an application-centric design process. This book is notintended to be a comprehensive review of all WSN applications and deployments to date. Instead, it is acollection of state-of-the-art research papers discussing current applications and deployment experiences, butalso the communication and data processing technologies that are fundamental in further developing solutionsto applications. Whilst a common foundation is retained through all chapters, this book contains a broad arrayof often differing interpretations, configurations and limitations of WSNs, and this highlights the diversity of thisever-changing research area. The chapters have been categorised into three distinct sections: applicationsand case studies, communication and networking, and information and data processing. The readership of thisbook is intended to be postgraduate/postdoctoral researchers and professional engineers, though some of thechapters may be of relevance to interested master’s level students.
How to referenceIn order to correctly reference this scholarly work, feel free to copy and paste the following:
Luca Bencini, Davide Di Palma, Giovanni Collodi, Antonio Manes and Gianfranco Manes (2010). WirelessSensor Networks for On-Field Agricultural Management Process, Wireless Sensor Networks: Application-Centric Design, Yen Kheng Tan (Ed.), ISBN: 978-953-307-321-7, InTech, Available from:http://www.intechopen.com/books/wireless-sensor-networks-application-centric-design/wireless-sensor-networks-for-on-field-agricultural-management-process
www.intechopen.com

Phone: +385 (51) 770 447 Fax: +385 (51) 686 166www.intechopen.com
Phone: +86-21-62489820 Fax: +86-21-62489821