Embed Size (px)
Citation preview

GLOBAL ECONOMICS, DOMESTIC POLITICS, AND REFORMS OF SOCIAL
INSURANCE PROGRAMS IN ADVANCED CAPITALIST COUNTRIES
By
Stephen Craig Ammon
Dissertation
Submitted to the Faculty of the
Graduate School of Vanderbilt University
in partial fulfillment of the requirements for
the degree of
DOCTOR OF PHILOSOPHY
in
Political Science
May, 2002
Nashville, Tennessee
Approved:
Professor Donna L. Bahry
Professor M. Donald Hancock
Professor Kurt G. Weyland
Professor Bruce I Oppenheimer
Professor Robert A. Margo
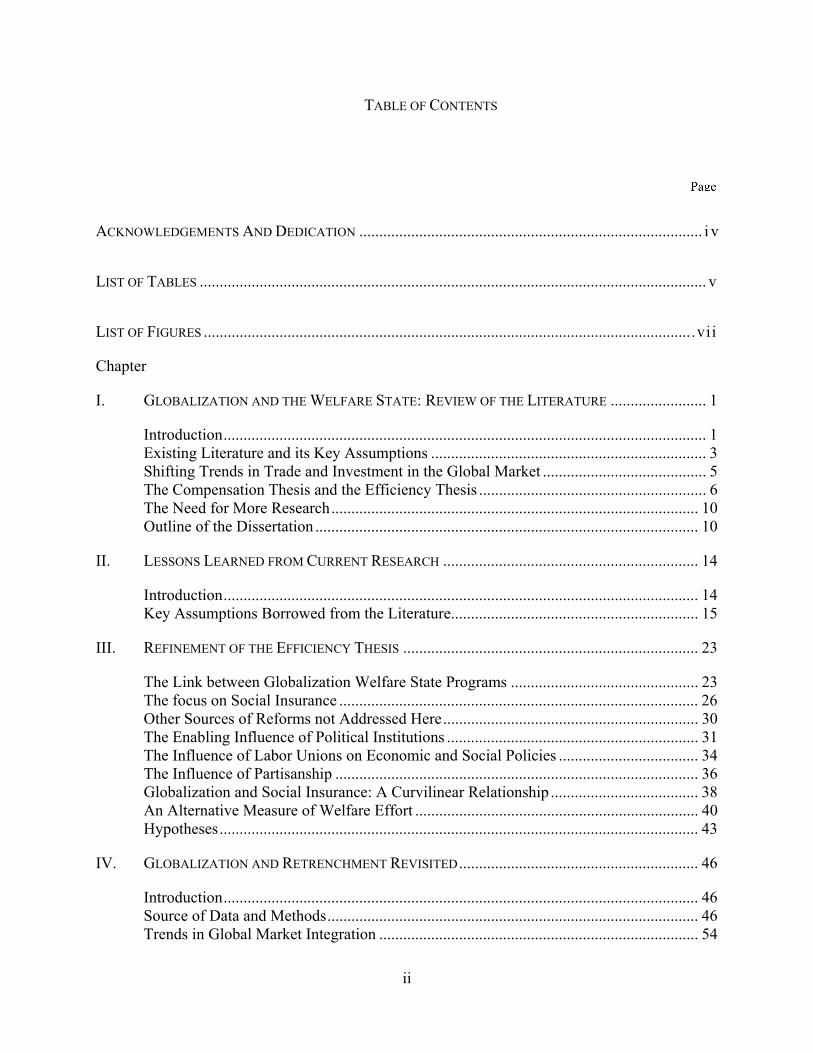
TABLE OF CONTENTS
ACKNOWLEDGEMENTS AND DEDICATION ...................................................................................... i v
LIST OF TABLES ............................................................................................................................... v
LIST OF FIGURES .......................................................................................................................... .vii
Chapter
I. GLOBALIZATION AND THE WELFARE STATE: REVIEW OF THE LITERATURE ........................ 1
Introduction......................................................................................................................... 1 Existing Literature and its Key Assumptions ..................................................................... 3 Shifting Trends in Trade and Investment in the Global Market ......................................... 5 The Compensation Thesis and the Efficiency Thesis ......................................................... 6 The Need for More Research............................................................................................ 10 Outline of the Dissertation ................................................................................................ 10
II. LESSONS LEARNED FROM CURRENT RESEARCH ................................................................ 14
Introduction....................................................................................................................... 14 Key Assumptions Borrowed from the Literature.............................................................. 15
III. REFINEMENT OF THE EFFICIENCY THESIS .......................................................................... 23
The Link between Globalization Welfare State Programs ............................................... 23 The focus on Social Insurance .......................................................................................... 26 Other Sources of Reforms not Addressed Here................................................................ 30 The Enabling Influence of Political Institutions ............................................................... 31 The Influence of Labor Unions on Economic and Social Policies ................................... 34 The Influence of Partisanship ........................................................................................... 36 Globalization and Social Insurance: A Curvilinear Relationship ..................................... 38 An Alternative Measure of Welfare Effort ....................................................................... 40 Hypotheses........................................................................................................................ 43
IV. GLOBALIZATION AND RETRENCHMENT REVISITED............................................................ 46
Introduction....................................................................................................................... 46 Source of Data and Methods............................................................................................. 46 Trends in Global Market Integration ................................................................................ 54
ii
The Influence of Intervening Political Variables.............................................................. 57 Unemployment and Economic Growth ............................................................................ 58 Specific Economic Trends in Each Country..................................................................... 63 The Influence of Institutions on the Feasibility of Reforms ............................................. 66 Predictions for Reforms .................................................................................................... 67 Policy Outcomes ............................................................................................................... 69 Regression Results ............................................................................................................ 74
V. PARTISANSHIP AND PROTECTING OF TRADITIONAL VALUES............................................ 124
Introduction..................................................................................................................... 124 Options that are Market Conforming.............................................................................. 124 Traditional Partisan Values............................................................................................. 126 Predictions for Reforms Based on Traditional Partisan Values...................................... 128 Specific Reforms of Social Insurance Programs ............................................................ 133
VI. CONCLUSION.................................................................................................................... 151
Introduction..................................................................................................................... 151 Contradictions in the Literature ...................................................................................... 152 The Contribution of this Dissertation ............................................................................. 153 Limitations of This Research .......................................................................................... 157 Avenues for Further Research ........................................................................................ 158
APPENDIX .................................................................................................................................... 160
BIBLIOGRAPHY ............................................................................................................................ 186
NOTES ......................................................................................................................................... 194
iii

ACKNOWLEDGEMENTS AND DEDICATION
I am grateful to my committee members for all of their input and guidance throughout the
process of writing this dissertation. I am also indebted to Professor Duane Swank for sharing his
data on state structures and partisanship. My dataset on which all of my findings are based also
incorporates data on labor unions from the Miriam Golden, Peter Lange and Michael Wallerstein
dataset, as well as data on demographic and labor market trends from the Evelyne Huber and
John D. Stephens “Comparative Welfare State Dataset.” I am thankful to all of these
scholars for making their data publicly available on their respective websites.
Writing this dissertation has been a tremendous challenge, but also a source of much
enjoyment for me. Still, most of this writing took place on nights and weekends – time I would
have otherwise spent with my wife, Kathryn, and my children, Evan and Vaughn. It was only
with their unending patience and support that I was able to finish. Therefore, I dedicate this
dissertation to the three of them.
iv

LIST OF TABLES
Table Page
1. Imports, Percentage of GDP, Five Year Averages ........................................................... 84
2. Exports, Percentage of GDP, Five Year Averages ........................................................... 85
3. Ratio of Imports to Total Trade, Five Year Averages ...................................................... 86
4. Inward Foreign Direct Investment, Percentage of GDP, Five Year Averages ................. 88
5. Outward Foreign Direct Investment, Percentage of GDP, Five Year Averages .............. 89
6. Ratio of Outward Foreign Direct Investment to Total Foreign Direct Investment, Five Year Averages................................................................................................................... 90
7. Total Employer Contributions for all Social Insurance Programs, Five Year Averages.. 91
8. Proportion of Cabinet Government Occupied by Left, Christian Democratic, Secular Center, and Right Parties .................................................................................................. 92
9. Indices of Political Institutional Configurations: Inclusive Electoral Institutions, Decentralization of Government Authority, and Social Corporatism .............................. 93
10. Unemployment Rates, Five Year Averages...................................................................... 94
11. Real Economic Growth Rates, Five Year Averages......................................................... 95
12. Regression Analysis for Unemployment Rates ................................................................ 96
13. Regression Analysis for Real Economic Growth Rates ................................................... 98
14. Predictions for Reform.................................................................................................... 100
15. Index of Reforms ............................................................................................................ 115
16. Regression for Unemployment Insurance Adjusted Replacement Rates ....................... 116
17. Regression for Old Age Pensions Adjusted Replacement Rates .................................... 118
18. Regression for Disability Pensions Adjusted Replacement Rates.................................. 120
19. Regression for Sickness Benefits Adjusted Replacement Rates..................................... 122
20. Comparison of Gross Replacement Rates for Unemployment Benefits, Workers with 2/3 Average Wages vs. Average Wages ............................................................................... 145
v
21. Program Summary for Unemployment Benefits ............................................................ 146
22. Old Age Pensions, Gross Replacement Rates for Workers with Minimum Contributions, Half of Maximum Contributions, and Maximum Contributions .................................... 147
23. Program Summary for Old Age Pensions....................................................................... 148
24. Program Summary for Disability Pensions..................................................................... 149
25. Program Summary for Sickness Benefits ....................................................................... 150
vi
LIST OF FIGURES
Figure Page
1. The Relationship Between Trends in Globalization and Reforms of Social Insurance.... 38
2. Options for Reforms ......................................................................................................... 42
3. Imports versus Exports, Percentage of GDP, Five Year Averages................................... 83
4. Inward versus Outward Foreign Direct Investment, Five Year Averages for Fourteen Countries ........................................................................................................................... 87
5. Adjusted Replacement Rates for Austria, 1973-1995..................................................... 101
6. Adjusted Replacement Rates for Belgium, 1973-1995................................................... 102
7. Adjusted Replacement Rates for Canada, 1973-1995 .................................................... 103
8. Adjusted Replacement Rates for Denmark, 1973-1995 ................................................. 104
9. Adjusted Replacement Rates for Finland, 1973-1995 .................................................... 105
10. Adjusted Replacement Rates for France, 1973-1995 ..................................................... 106
11. Adjusted Replacement Rates for Germany, 1973-1995 ................................................. 107
12. Adjusted Replacement Rates for Italy, 1973-1995 ......................................................... 108
13. Adjusted Replacement Rates for Japan, 1973-1995 ....................................................... 109
14. Adjusted Replacement Rates for Netherlands, 1973-1995 ............................................. 110
15. Adjusted Replacement Rates for Norway, 1973-1995 ................................................... 111
16. Adjusted Replacement Rates for Sweden, 1973-1995.................................................... 112
17. Adjusted Replacement Rates for the United Kingdom, 1973-1995 ............................... 113
18. Adjusted Replacement Rates for The United States, 1973-1995.................................... 114
vii

CHAPTER I
GLOBALIZATION AND THE WELFARE STATE: REVIEW OF THE LITERATURE
INTRODUCTION
The comparative literature has given much attention to the “crisis” of the welfare state,
the inability of advanced capitalist states to maintain generous social welfare programs and
ensure continued economic growth (Kitschelt 2001; Huber and Stephens 2001; Pierson 2001;
Schwartz 2001; Swank 2001, 1998; Hicks 1999; Clayton and Pontusson 1998; Garrett 1998).
Especially with the decline in trade barriers since the 1970s, the tensions between these two
goals have appeared ever more pronounced (Rodrik 1997, Rhodes 1996). The argument claims
that social welfare and insurance policies that redistribute earned incomes through taxes and
transfer payments undermine the goals of economic efficiency, capital accumulation, and
economic growth.1 At the micro-economic level, generous social welfare and insurance benefits
are assumed to discourage people from working, and this reduces aggregate levels of production
and growth. At the macro-economic level, payroll taxes and corporate income taxes divert
profits from reinvestment, thereby reducing aggregate levels of capital necessary for economic
growth. These arguments would apply even to countries in which outward foreign direct
investment is limited. In open markets for goods and services, some scholars claim that these
taxes further threaten economic growth by undermining the competitiveness of domestic
industries. First, because these taxes diminish profits, they render industries less attractive to
foreign investors. Second, because employers’ payroll taxes increase labor costs, the resulting
increase in the prices of their products dampens demand for them. As a result, many analysts
predicted that welfare programs would be cut in order reduce production costs, increase
investment, and restore economic growth.
However, research to date has been contradictory. Conclusive evidence that welfare state
expenditures do threaten competitiveness is still lacking.2 There is disagreement over the nature
of welfare state policy changes as well. Some analysts find little, if any, adjustment in welfare
programs, while others find substantial contraction. Further, those who do find evidence of
welfare retrenchment disagree about the causes. For some, shifts in domestic labor markets have
produced high rates of unemployment and slowed economic growth, which in turn have driven
1
reductions in benefits. For others, increasing numbers of benefit claimants, such as old age
pensioners and single mothers, have been the source of changes in welfare programs. So far,
there is little evidence to support the claim that the need for competitive industries in
increasingly integrated markets has prompted these reforms.
Thus, there is little agreement on whether and why the crisis of the welfare state has led
to retrenchment. My aim here is to reassess the debate. I will show that many advanced
capitalist countries did adopt reforms to limit benefits, and that these reforms were more
pronounced where the state faced deficits in trade and foreign direct investment, worsening
unemployment and weak economic growth. Globalization did have an impact, but in a different
way than is assumed in much of the literature. Specifically, I show that trends in globalization
are associated with expansion of benefit programs to a point, but as these trends become more
pronounced they are associated with reforms that reduce benefits. I will further show that
political institutions traditionally associated with rising benefits actually facilitate these reforms.
Finally, the influence of government partisanship on the incidence of reform should be weaker
than the influence of political institutions. However, where reforms do occur, partisanship
should be an important factor in determining specific policy outcomes that preserve traditional
interests.
I assess developments in social insurance programs in fourteen advanced capitalist
countries (hereafter OECD countries) for the period 1973 to 1995. Through at least the 1970s,
the economies of advanced capitalist countries were still quite strong and the costs of welfare
state programs were manageable. Therefore, despite these argued tensions between economic
growth and welfare state programs that redistribute incomes, neither constituents nor
policymakers had to make difficult choices between these two goals. In most OECD countries
both welfare benefits and the taxes that fund them rose at the same time that healthy levels of
economic growth were secured. However, as global market integration proceeds, the tensions
between economic growth and income redistribution should become more pronounced. Given
that the literature has not fully explored this relationship in the context of increased global
market competition, a reexamination of this relationship is needed.
2
EXISTING LITERATURE AND ITS KEY ASSUMPTIONS
All social welfare states serve at least four objectives that mitigate social and economic
problems that are inevitable byproducts of capitalism. They encompass several policies intended
to alleviate both poverty and income inequality that inhere in capitalist labor markets.3 They also
counter market inefficiencies that discourage or prevent individuals from entering the labor
market. Finally, welfare states spread the risk of investment in human capital (Barr 1992;
O’Connor 1973). Therefore, these programs receive widespread public support because they
significantly improve the economic welfare of many benefit recipients.
Some comparative scholars have long argued that contradictions that inhere in the
modern welfare state threaten its survival (Offe 1984, Gough 1979, O’Connor 1973). In
capitalist production, owners of capital will benefit when competition among workers for
employment drives down wages and increases profits. While workers are disadvantaged vis a vis
owners of capital in the market, their numbers grant them an advantage in the democratic
policymaking process. Laborers can elect policymakers who will increase taxes and social
welfare and insurance benefits that will redistribute earned incomes. But these taxes divert
profits from future investment, reducing demand for labor and threatening economic growth. So
in serving the workers’ short-term interests by redistributing incomes, the welfare state threatens
the long-term economic interests of both owners and capital and laborers alike. Despite the
soundness of this logic, advanced capitalist countries continued to expand their social welfare
programs even while achieving solid economic growth. Therefore, rather than questioning
whether the modern welfare state would survive, the comparative literature turned its attention to
the influence of interest groups, government partisanship, and political institutions in
determining the pace and character of welfare state expansion.
Early explanations for the development of welfare states among advanced capitalist
countries were almost devoid of politics. Functional / structuralist theories claimed that the
process of modernization is positively correlated with growth of social expenditures (Flora and
Alber 1981; Wilensky 1975). This theory puts forth a functionalist argument, claiming that the
expansion of social welfare policies reflects the state’s response to increased “need” among
citizens (Esping-Andersen 1990).
Power resources theorists rejected functionalist arguments linking economic development
to welfare expenditures and income equalities. These scholars claimed that changes in the
3
distribution of power among key political groups and social classes caused changes to social
welfare policies (Wennemo 1992; Hicks and Swank 1992; Korpi 1985; Castles 1982; Cameron
1978).4 Laborers seek to expand welfare state programs as long as their post-tax, post-transfer
incomes increase. In contrast, owners of capital seek to prevent increases in taxes that decrease
profits and divert income from future investment. These assumptions coincide with those
predicting the crisis of modern welfare states. However, power resources theorists predicted that
policymakers would serve the interests of laborers, given their numbers, organization, and their
ability to influence election outcomes. In fact, several power resources theorists produced
evidence showing that differences in labor union strength is the strongest predictor of welfare
state expenditures, the range of programs covered, and eligibility criteria (Kangas 1991, Myles
1989; Olsen 1988; Stephens 1979, Korpi 1980, Hicks 1991).
Recent efforts to refine power resources theory focus on the ways in which state
structures influence balance of power among competing groups as well as policymakers’
incentives (Swank 2001; Huber and Stephens 1998; Schwartz 1994; Immergut 1992). Rather
than focusing on the degree to which constituent groups can take advantage of electoral rules to
ensure that their interest are represented in the policymaking process, this “state structure”
literature focuses on the influence of the policymaking process itself. This literature
acknowledges that, in addition to the numbers and organization of parties and interest groups,
state structures determine their opportunities to influence policymaking process, opportunities
that translate into political power (Crepaz 1998; Birchfield and Crepaz 1998). These scholars
found that the extent to which political institutions encourage cooperative versus competitive
policy processes is also a strong predictor of welfare policy outcomes.
Finally, the “regime theory” literature posits that variations in demographics, economic
strength, or labor union mobilization cannot fully explain variations in the composition of
welfare states. Instead, this theory argues that critical historical and political determinants
“institutionalize” relationships among citizens, the state, and the market (Esping-Andersen 1990;
Huber, Ragin, and Stephen 1993). Social welfare programs, their benefits, and the extent to
which they redistribute incomes vary systematically according to these institutionalized
relationships. This explains why states with similar political institutions or labor union strength
in recent decades have very different policies, emphasizing different objectives.
4
The theories cited above present differing viewpoints on the sources of political influence
granted to laborers and owners of capital. However, each of these theories assumes that the
electoral laws and policymaking institutions that grant laborers influence in the policymaking
process have translated into political power vis a vis employers and owners of capital in many
OECD countries. As a result, welfare benefits and aggregate expenditures, as well as the taxes
that fund them, grew in these countries for much of the Post- World War II era.
SHIFTING TRENDS IN TRADE AND INVESTMENT IN THE GLOBAL MARKET
Most OECD countries have historically adopted policies that limited trade and foreign
direct investment in order to protect their industries from competition from imports and ensure
ample supplies of capital investment. However, as evidence of increasing faith the doctrines of
liberal economic principles, policymakers began in the 1970s to either modify or repeal these
policies in efforts to stimulate lagging economic growth. According to these principles, all
countries would benefit from specializing in industries in which they have a comparative
advantage and trading with other countries for all goods that they don’t produce. A country has a
comparative advantage when its opportunity cost of producing that good is lower than the
opportunity cost that other countries would incur. As comparative advantage is determined by
opportunity costs, and not actual costs, all countries will have a comparative advantage in the
production of some goods, even if the actual cost of production is higher than in other countries.
The process of market integration proceeded slowly and unevenly across countries, and
most countries’ markets for goods and capital are still not completely integrated. They were
certainly less integrated in the early 1980s, even after many legal barriers were dismantled. This
is largely due to the presence of de facto barriers to trade and investment such as transportation
costs, differing standards of quality and safety, environmental regulations, and taxes. The
argument that all countries will benefit from specialization, trade, and mobile capital starts to
unravel when these de facto barriers to trade and investment are taken into account. These
barriers were particularly relevant to trade and investment between OECD and non-OECD
countries because until recently the latter group lacked the human capital and infrastructure
needed for production and transportation of high quality goods. OECD countries have, therefore,
traditionally imported limited quantities of goods from non-OECD countries while exporting
large quantities of goods to those countries. Also as a result of these barriers, foreign direct
5

investment was relatively uncommon either among OECD countries or between OECD and non-
OECD countries through at least the early 1980s.
In the late 1970s, these de facto barriers to trade and foreign direct investment (FDI)
began to disappear. As a result, total volumes of both international trade and FDI increased
throughout the 1980s and 1990s. Most notably, newly industrialized countries (NICs) began
producing goods that met higher quality and safety standards and could compete in the world
market with goods produced in OECD countries. The improvement of infrastructure and
laborers’ skills made direct investment in these NICs more attractive to foreign owners of
capital. Therefore, trade and investment between OECD and non-OECD countries have risen to
unprecedented levels in recent years. As international markets for goods and capital become
increasingly integrated, industries from OECD countries must now compete for both export
market share and FDI more than in the past.
Industries in some OECD countries continue to thrive as markets integrate. As a result,
they incur trade surpluses, attract relatively healthy levels of FDI, and unemployment and growth
rates in these countries are at acceptable levels. In contrast, industries of some OECD countries
are struggling as markets integrate. These industries likely thrived in the past as a result of
protectionist policies. In those OECD countries whose industries are less competitive in the
global environment, real wages of workers should fall, unemployment rates should rise, and
these countries may experience slowed economic growth until their industries and labor markets
adapt to the changing global economy. Therefore, scholars have once again turned their
attention to these argued tensions between the goals of income redistribution and growth, and
examined policies that result.
THE COMPENSATION THESIS AND THE EFFICIENCY THESIS
The “compensation” thesis and the “efficiency” thesis both acknowledge that economic
growth serves the interests of virtually all citizens and is a strong predictor of election outcomes
(Rodrik 1997; Rhodes 1996; Teeple 1995; Pfaller 1991). Both theses also acknowledge that
efficiencies gained through the integration of markets for trade and investment are key to
securing economic growth in the future. Finally, both theses acknowledge the impact that
integration will have on labor markets in many countries; as some industries expand and others
contract in response to changing international demand for their products, laborers in contracting
6
industries will be lose their jobs. These workers are likely to support increases in social welfare
and insurance benefits that will compensate them for lost income as a result of this temporary
“dislocation” from the labor market. Despite their agreement over these issues, the
compensation thesis and the efficiency thesis predict opposing social welfare policy outcomes in
the era of global market integration.
The compensation thesis focuses on the political power that the electoral process grants
large numbers of constituents sharing common interests. Policymakers have enacted reforms
weakening or eliminating barriers to trade and FDI with the support of their constituents.
However, these reforms are not irreversible; if popular resistance to liberalization grew strong
enough, policymakers would be compelled to reestablish protectionist policies, or risk being
replaced by politicians pledged to do so. The compensation thesis claims that policymakers
advocating further integration will provide generous welfare benefits as “side-payments” to
dislocated workers in exchange for their continued support for integration. In sum, the
expansion of welfare policies is viewed as a means of ensuring continued integration and
economic growth in the new, competitive global economy. If the compensation thesis is correct,
we should expect to find that welfare states expand as global market integration proceeds in or to
counter growing inequality of earned incomes.
The efficiency thesis focuses on the political power that owners of capital are granted by
virtue of their “exit” option. This thesis claims that barriers to foreign direct investment are
already limited enough to provide owners of capital the option to invest overseas if doing so will
yield higher profits. Income taxes and payroll contributions that reduce profits are likely to
influence these investment decisions. In increasingly competitive investment markets,
policymakers should therefore reduce the tax burden on capital in order to either retain domestic
capital or attract foreign capital in order to foster economic growth (Andrews 1994; Frieden
1991). In order to prevent the need for increased taxes and payroll contributions to finance rising
welfare expenditures, policymakers will have to cut benefits despite the popularity of welfare
programs. In sum, the reform of welfare policies in order to control aggregate expenditures is
viewed as a means of ensuring continued investment economic growth in the global context. If
the efficiency thesis is correct, we should expect to find widespread retrenchment in those
countries whose industries are less competitive in open markets for goods and investment in
recent years. Clearly, both the efficiency thesis and the compensation thesis claim that
7

policymakers seek the end goal of economic growth, but these competing theses predict very
different means to that end.
Evidence for Welfare State Expansion
A number of comparative scholars examine welfare state developments in recent years,
although not testing directly for the effects of globalization. They claim that national
governments have still had the latitude they need to implement tax and benefit policies that serve
the interests of their supporters (Iversen and Cusack 1998; Birchfield and Crepaz 1998; Boix
1997; Huber, Ragin and Stephens 1993; Garrett and Lange 1991). While not explicitly
supporting the compensation thesis, these conclusions certainly challenge the efficiency thesis,
which would predict retrenchment of welfare state programs in recent years to coincide with
trends in globalization.
Evidence Supporting the Compensation Thesis
Some scholars acknowledge that international capital mobility and open markets for
goods and services produce financial pressures to reform welfare state expenditures. However,
they find that factors traditionally associated with welfare state expansion, such as incumbency
of left or Christian Democratic parties, strong and encompassing labor unions, and political
institutions that foster cooperative policymaking have enabled policymakers to resist financial
pressures for reform. Garrett and Mitchell’s (1999) quantitative analysis regresses changes in
social welfare expenditures on various measures of globalization and produces evidence in
support of the compensation thesis. 5 In several works, Swank (2001, 1998) uses both case
studies and regression analysis to show that welfare reforms in response to financial pressures
are likely only in states with pluralist decision making, exclusive electoral institutions, and
dispersed policymaking authority. Conversely, states exhibiting corporatist policymaking,
inclusive electoral institutions, centralized decision-making authority, and universalistic welfare
state programs are likely to resist financial pressures for reform. Similarly, Schwartz (2001)
finds that, due to domestic political forces protecting welfare state programs in Continental
European states, these states have been most resistant to financial pressures for reform stemming
from persistently high unemployment rates.
8
Evidence of Domestic Sources of Reforms
Many scholars who have examined the progress of welfare state reforms in OECD
countries claim that these reforms have generally been very modest (Crepaz 1998; Pierson 1996;
Garrett and Mitchell 1996; Esping-Andersen 1996; Dilnot 1995; Falkner and Talos 1994; Klein
1993; Hill 1993). They conclude that the coincidence of increasing numbers of beneficiaries
with rising unemployment rates and slowed economic growth have prompted temporary
“adjustments” aimed at controlling the growth of expenditures. Further, these scholars claim that
rising unemployment rates and slowed economic growth are due to domestic developments such
as aging populations and labor market shifts, and therefore conclude that these limited reforms
are unrelated to globalization. Huber and Stephens (2001) claim that rising labor force
participation among women has caused high unemployment rates in many OECD countries,
which have in turn required modest reforms of social insurance policies.6 In fact, Huber and
Stephens argue that as unemployment levels recede, efforts of retrenchment should be curtailed,
and partisan differences should once again produce different policy outcomes (2001: 145).
Pierson (2001a) attributes reforms to lower productivity as a result of shifts to the services sector,
maturing populations, and extensive commitments to welfare state expenditures. Clayton and
Pontusson (1998) claim that reforms have been widespread and significant, changing both the
size and the character of the welfare state. However, they do not attempt to identify specific
causes of these reforms, instead discussing several potential causes of reforms presented in the
literature.
Evidence Supporting the Efficiency Thesis
In contrast to the works cited above, Rodrik (1997) supports the efficiency thesis, arguing
that competition from low wage countries will drive down wages for low skilled workers in
OECD countries as well as increasing elasticity of demand for this labor. Rodrik uses panel data
to regress changes in levels of social spending and government consumption on changes in
measures of openness for goods and capital in fourteen OECD countries for the period 1996-
1991. He does find a very slight negative relationship between these variables, lending support
to the efficiency thesis (Rodrik 1997: 59-67). However, Rodrik’s evidence is easily challenged
9
because he does not control for demographic or political variables that have been shown time
and again to be critical determinants of welfare state expenditures.
THE NEED FOR MORE RESEARCH
In sum, the quantitative literature has produced evidence in support of the compensation
thesis rather than the efficiency thesis. Yet both case studies and quantitative analysis have
produced evidence of reforms of welfare state programs in the late 1980s and early 1990s. The
coincidence of these reforms with accelerated global market integration raises the possibility that
globalization is one of the causes of these reforms. I argue that the key assumptions about the
competing interests and relative power of vying political groups cannot be applied to social
welfare policymaking in the new, global context. An alternative thesis, with different
assumptions about the role of constituents’ short-term and long-term interests in the
policymaking process, must be developed. This alternative thesis must also refine arguments
linking specific trends in global market integration to welfare state policy outcomes. Finally, an
improved measure of these policy outcomes must be produced if quantitative analysis is to
account for the wide range of reforms options from which policymakers can choose. This
dissertation takes on these tasks.
OUTLINE OF THE DISSERTATION
In Chapter II I critique key assumptions that have been incorporated into both the
efficiency thesis and the compensation thesis. If globalization does, in fact, create a
contradiction between two very popular goals – fostering income redistribution and economic
growth – then policymakers lack a clear mandate. Therefore, established assumptions about the
role of interests in the policymaking process will fail to explain welfare policy outcomes in the
new, global context. Put simply, globalization should fundamentally change the politics of
welfare state policymaking. In Chapter II I also critique the measures of policy outcomes that
scholars have used in quantitative analysis testing the relationship between globalization and
these outcomes. I argue that the overwhelming empirical support of the compensation thesis
depends largely on these flawed measures of policy outcomes.
In Chapter III I refine the efficiency thesis and specify the ways in which various aspects
of global market integration should affect specific welfare state programs in OECD countries.
10
Some countries are thriving as global markets continue to integrate – they enjoy rising exports
and inward foreign direct investment, low unemployment rates, and solid economic growth. In
contrast, some countries are struggling to adjust to market integration, as evidenced by rising
imports, outward foreign direct investment, high unemployment rates, and slow or negative
economic growth. Those countries that are struggling face financial pressures for reforms of
their social insurance programs. My quantitative analysis will account for these differing
responses to exposure to competitive global markets.
In Chapter III I also present arguments as to how political factors should dictate policy
responses to financial pressures to reform social insurance policies. Political institutions should
significantly affect both policymakers’ incentives and ability to enact reforms when these
financial pressures are present. If adopted, these reforms will sacrifice the short-term interests of
some constituents in order to facilitate competitiveness and economic growth. Building on the
comparative literature that examines the effects of “inclusive” or “consensual” political
institutions on the policymaking process, one should be able to predict whether or not
policymakers will adopt reforms in each country.
Evidence presented in Chapter IV will show that, since the mid- 1980s, many OECD
countries are incurring large trade deficits as their imports exceed their exports. I will also show
that volumes of outward foreign direct investment exceed volumes of inward foreign direct
investment in many OECD countries in recent years. These trends indicate that tests of the
compensation thesis versus the efficiency thesis using data only through the late 1980s were
premature. If the efficiency thesis is correct, evidence to support it should not appear until at
least the late 1980s to early 1990s. Following the discussion of economic trends, I present my
hypotheses and make predictions as to which countries should adopt reforms of social insurance
programs.
In Chapter IV I also present my index of “adjusted” replacement rates for employment
related social insurance programs. Rather than measuring expenditures only, this index
incorporates all eligibility criteria that determine one’s access to social insurance benefits.
Reductions in adjusted replacement rates for the four social insurance programs examined here
are widespread among the fourteen included in this study, evidence that challenges the findings
of much of the recent quantitative research. Further, my regression results show positive,
statistically significant relationships between rising deficits in trade and investment and rising
11
payroll taxes on the one hand, and high unemployment on the other. My regression results also
show negative relationships between these trends and real economic growth. The relationships
between these economic developments and reforms of social insurance programs are statistically
significant as well, providing support for my refinement of the efficiency thesis. Most
importantly, the regression results will show that political institutions that facilitate cooperative,
“responsible” policymaking serve to reinforce these relationships.
Chapter V includes a more in-depth discussion of the timing and types of reforms in the
fourteen countries included in this study. This discussion will show that, while political
institutions will facilitate the adoption of reforms in response to economic and financial
pressures, partisan politics should largely dictate choices regarding specific programs and
components of these programs (such as gross replacement rates versus eligibility criteria) that are
preserved.
Chapter VI presents my conclusions, as well as a discussion of avenues for further
research. As I argue in Chapter II, globalization has not already “happened.” While markets for
goods and services, capital, and labor are more open than they were as recently as the mid-
1980s, legal barriers to the free flow of the goods and factors of production continue to exist.
Therefore, this dissertation certainly does not represent the last word on the effects of
globalization on these welfare state programs; complete global market integration is still far from
realized, and future trends could alter or even reverse the policy consequences of recent
integration and competition that I will present. However, this dissertation makes a significant
contribution to the literature in that it will show both that reforms of social insurance programs
are widespread among many OECD countries in recent years, and that the relationships between
these reforms and trends in globalization lend support to my arguments. The results presented in
Chapter IV also show that political institutions that encourage cooperative, responsible
policymaking are not predisposed to expand social insurance policies in order to serve the short-
term interests of many constituents. Rather, my regression results provide support for the
argument that these same political institutions that were once associated with welfare state
expansion are in the best position to adopt reforms in efforts to foster economic growth, which
serves the long-term interests of virtually all constituents. Finally, my results do provide support
for the view that partisanship still matters in welfare state policymaking despite overwhelming
12

financial concerns. Cross-national differences in partisanship will produce divergent choices for
the means by which national governments will reform their social insurance programs.
13
CHAPTER II
LESSONS LEARNED FROM CURRENT RESEARCH
INTRODUCTION
Both the efficiency thesis and the compensation thesis adopt key assumptions from the
established power resources theory and state structure theory about the interests and relative
political power of competing groups, as well as welfare state policy outcomes. I argue that the
influence of global economic trends has fundamentally changed the politics of domestic welfare
state policymaking. Therefore, these key assumptions cannot be applied to the new global
context. In this chapter I discuss the specific assumptions of both the compensation thesis and
the efficiency thesis that need to be refined. I also discuss the specific measures and methods
used in quantitative research testing for evidence to support either thesis that needs to be
improved. In Chapter III I present my refinement of the efficiency thesis as well as my improved
measures for testing this new thesis.
There are at least five reasons for which the existing quantitative research has not shown
that globalization produces financial pressures on welfare state programs, nor that policymakers
have responded to these pressures with reforms. The first two reasons relate to key assumptions
that the compensation thesis and the efficiency thesis have adopted from the power resources and
state structure literature. The third reason relates to formulation of the proposed relationship
between specific trends in globalization and reforms of welfare state programs. The remaining
two reasons relate to the specific methods that quantitative researchers have used to test these
competing theses.
First, both of these competing theses focus on the short-term interests of competing
interest groups or parties. They assume that these preferences are fixed, and that the interests of
laborers and capital oppose each other. Second, both theses overstate the political influence that
competing groups have in the policy process. Therefore, while they predict different policy
outcomes, both theses assume a linear relationship between globalization and reforms of welfare
state programs. Neither thesis allows for limitations on the political influence of dominant
groups, nor for compromise among them in order to achieve common goals. Third, quantitative
researchers have not differentiated between different trends in globalization nor between
14

different types of welfare state programs. Instead, scholars espousing the efficiency thesis claim
that the threat of capital exit renders all welfare programs vulnerable to cuts as a means of
reducing capital’s welfare burden. Conversely, scholars espousing the compensation thesis
claim that welfare state programs will expand in response to pressure from laborers, who will
continue to support expansion so long as they receive a net benefit (after taxes and transfers)
from the change.
The fourth and fifth reasons for which the quantitative research has not found evidence
for the efficiency thesis relates to the measures and methods that these researchers use to test
their arguments. Quantitative research has focused on expenditures as the sole measure of
“welfare effort.” But these measures fail to capture potential reforms of social welfare and
insurance programs aimed at controlling aggregate expenditures. Finally, the bulk of the
research uses data from 1990 at the latest, before the onset of important developments in world
markets for goods and capital.
KEY ASSUMPTIONS BORROWED FROM THE LITERATURE
Both the compensation thesis and the efficiency thesis acknowledge that economic
integration and efficient use of capital investment are key to long-term economic growth. Both
theses also acknowledge that long-term economic growth is important to virtually all
constituents, and that changes to welfare state legislation must serve the short-term interests of
dominant political groups in order to foster continued integration that will secure long-term
growth. But the two theses provide different explanations as to how domestic politics should
affect the development of social welfare and insurance policies in the context of global market
integration.
The Focus on Short-Term Interests that Generous Benefits Serve
The compensation thesis assumes the same dominant interests and predicts the same
policy outcomes as power resources theory. The compensation thesis views welfare benefits as
“side-payments” that policymakers must provide in order to secure popular support for continued
integration. Therefore, policymakers must expand of welfare state programs in order to serve the
interests of laborers interests because they are able to directly affect election outcomes.
15
The efficiency thesis also borrows from the power resources literature the assumption
that policymakers will serve the short-term interests of the most politically powerful groups,
even if the interests of less powerful groups must be sacrificed. But then the efficiency thesis
diverges from the literature because it claims that owners of capital enjoy an inherent advantage
over laborers in the policymakers process because the have an “exit” option. Open capital
markets prevent policymakers from forcing them to invest in their own countries. Yet if they do
invest overseas and deprive their own states of capital needed for investment and growth, these
policymakers will be held accountable for weak economic performance in upcoming elections.
Therefore, policymakers will adopt reforms of welfare state programs in order to control
aggregate expenditures and payroll taxes in efforts to retain domestic capital investment. In sum,
the efficiency thesis claims that owners of capital are granted political power by their ability to
indirectly affect election outcomes.
Recent compensation literature adopts “state structure” arguments claiming that, in
addition to the numbers and organization of parties and interest groups, state structures determine
their opportunities to influence policymaking process, opportunities that translate into political
power (Swank 2001; Huber and Stephens 1998; Crepaz 1998; Birchfield and Crepaz 1998;
Schwartz 1994; Immergut 1992). Several scholars have lauded institutions that facilitate
consensual policymaking over those that engender majoritarian policymaking because the former
encompass broader segments of society, better reflect the interests of the median voter, and
produce policies which favor the general interests of society as a whole (Crepaz 1996; Goodin
1996; Huber and Powell 1994; Lijphart 1984; Olson 1982). Based on this reasoning, Swank
(2001) and Crepaz (1998) posit that states comprised of cooperative veto points (proportional
electoral systems, multi-party legislatures, multi-party governments, and parliamentary regimes)
should produce higher welfare expenditures and a greater degree of de-commodification than
those states comprised of competitive veto points (federalism, strong bicameralism, and
presidential government). This is because cooperative veto points allow smaller groups of
constituents, including poorer constituents, to exercise influence in the policymaking process.
Because markets tend to distribute income less evenly than the distribution of votes, these groups
of constituents will use their influence to push for social welfare expenditures to increase their
incomes.
16
Again, these authors claim that “consensual” political institutions encourage cooperation
among various political groups. But their hypotheses about the effects of these institutions on
welfare state development focus on access enjoyed by disadvantaged groups. They assume that
structures encouraging consensual policymaking will produce more generous, redistributive
welfare and insurance policies as well. But their descriptions of the policymaking process are
not truly describing cooperation; rather, they are describing alliances of disadvantaged groups
that coerce wealthier constituents, including owners of capital, to fund their social welfare
interests. Again, by focusing on a narrow range of economic policy objectives – income
redistribution through social welfare and insurance programs – the bulk of this literature does not
allow for trade-offs between two important, but perhaps contradictory, goals of income
redistribution and growth.
Policies fostering income redistribution serve some constituents’ short-terms interests,
while those that foster investment, production, and economic growth serve more universal long-
term interests in the following ways. First, policies that increase investment and production
increase profits for owners of capital and increase demand for labor. This serves the economic
interests of the majority of constituents, especially those who find employment as a result of this
increased demand for labor. Second, higher rates of production and employment also increase
aggregate wages that are taxed to raise revenues for social insurance benefits. So these economic
policies indirectly support the viability of social insurance programs, which serves the interests
of those constituents who do not directly benefit from increased demand for labor. If
policymakers need to place greater priority on growth than on social welfare and insurance, they
will need to control aggregate social welfare expenditures until growth is regained. Yet most of
the welfare state literature would not view reforms of social insurance policies aimed at restoring
competitiveness, acceptable employment levels, and economic growth as serving the interests of
the parties and labor unions that traditionally support these social insurance policies.
In fact, a host of literature shows that these parties and labor unions support policies that
increase demand for labor and foster economic growth in addition to policies that redistribute
incomes. It is clear that Social Democratic parties have traditionally supported generous social
welfare and insurance benefits that provide an adequate standard of living for all citizens as a
basic right. But these parties have also traditionally supported government intervention in their
economies – through public investment and government employment – to foster full employment
17

for both men and women as the primary means of securing this standard of living. Christian
Democratic parties have traditionally supported economic and labor policies aimed at providing
employment opportunities and decent wages for male heads of households. And of course labor
unions clearly support economic and labor policies intended to boost demand for labor so that
their members can find employment (Compston, 1997).
If political institutions are truly encouraging cooperation, then policies that are enacted
should take into account both the short-term and long-term interest of both laborers and owners
of capital. For lack of a better phrase, resulting policies should be aimed at the “collective good”
of society as a whole. This would likely include policies aimed at restoring low rates of
unemployment and strong economic growth. Researchers should focus on political institutions
that allow policymakers to adopt policies that may produce short-term costs in order to foster
long-term gains, without threatening their political tenure.
The Assumption of Linearity
Both the efficiency thesis and the compensation thesis assume that the relationship
between factors of globalization and changes to social welfare policy is linear; the compensation
thesis posits a positive relationship while the efficiency thesis posits a negative one. The
efficiency thesis overstates the legitimacy of capital’s threat of exit. After all, many of the de
facto barriers to foreign investment still suffice to encourage domestic capital investment even if
costs are high. Conversely, the compensation thesis does not seem to take seriously the trade-off
between the two popular goals of income redistribution and growth. Nor does it seem to take
into account the capacity of the state to fund continually increasing welfare state expenditures.
Again, the literature has shown time and again that labor unions and Social Democratic and
Christian Democratic parties succeeded in their quest for more generous social welfare and
insurance programs, at least through the 1980s. But if the economic theory underlying the
efficiency thesis is correct, at some point social welfare taxes and expenditures will reduce
investment and employment and threaten economic growth. Therefore, a linear relationship,
whether positive or negative, between trends in globalization and welfare state policy
development is unlikely.
18

Mis-specified Relationships between Globalization and the Welfare State
The existing quantitative research does not find support for the efficiency thesis in part
because it fails to adequately specify the relationship between the globalization and changes to
welfare state legislation. First, this literature does not fully develop arguments explaining which
particular trends in globalization should affect the welfare state. Second, it does not fully
develop arguments explaining which specific welfare state programs that globalization should
affect. Instead, broad measures of “welfare effort” are regressed on equally broad measures of
market “openness.” These scholars have extended the arguments of earlier works that
demonstrated a positive relationship between economic openness and public expenditures. But
these earlier works focused on small states in which a few very large exported-oriented industries
employed substantial proportions of the workforce (Cameron 1978, Katzenstein 1985). These
scholars claimed that volatility in international markets could cause temporary reductions in
international demand for these exports, causing temporary bouts of unemployment for large
portions of the working population. As large numbers of workers perceived themselves at risk
for unemployment, generous social welfare and insurance benefits received popular support, and
levels of social welfare expenditures rose over time (Cameron 1978; Katzenstein 1985: 47-57).
Implicit in these arguments is the idea that while many workers will experience unemployment,
these bouts of unemployment should be rather short lived, and that aggregate levels of
unemployment should not increase significantly in the long run. In fact, for the years included in
Cameron’s and Katzenstein’s research, unemployment in these small, export-oriented states was
quite low.
Scholars have extended the logic of this research, arguing positive relationships between
the openness of markets for goods and investment and the expansion of welfare state programs in
OECD countries in recent years (Swank 2001; Garrett and Mitchell 1999; Mitchell 1998).
However, this argument is flawed. Trade openness is commonly defined as total volumes of
trade (imports plus exports) as a percentage of GDP. Capital market openness is defined as total
volumes of foreign direct investment (inward plus outward foreign direct investment) as a
percentage of GDP. But we must examine each of these trends separately. As argued in Chapter
I, high levels of imports and outward foreign direct investment will at least indirectly reduce
demand for labor in a given country, so the number of workers perceiving themselves at risk for
unemployment as a result of their open economy should be relatively high. As a result, numbers
19

of workers claiming social insurance benefits will increase just as aggregate payroll taxes that
fund these benefits shrink. These countries should face substantial pressures to reform their
social insurance programs. In contrast, high levels of exports and inward foreign direct
investment will indirectly increase demand for domestic labor, so the number of workers
perceiving themselves at risk may be relatively low. As a result, the numbers of individuals
claiming benefits relative to the numbers contributing to social insurance funds should not
increase. These countries should not face financial pressures to reform their programs as a result
of exposure to open markets for goods and capital.
The current quantitative research also has not identified a statistically significant
relationship between global market integration and welfare reform in part because this research
uses broad measures of “welfare effort” as dependent variables. These measures include both
welfare and insurance benefits as dependent variables. But substantial differences across these
programs will render them more or less likely to face increased financial pressures stemming
from trends in globalization. Funds for social welfare programs are raised through general
revenues and are therefore less reliant on domestic employment levels than are social insurance
benefits, which are funded through payroll taxes. Further, aggregate claims on some welfare
benefits such as family allowances or health care are likely to remain relatively constant,
whereas claims on unemployment benefits may increase quickly as a result of higher
unemployment rates. What is needed in the quantitative research is more focused inquiry into
which specific welfare state programs should be influenced by which specific developments in
the global market.
Existing Measures of “Welfare Effort”
Another reason for which the existing quantitative research does not find evidence to
support the efficiency thesis is that it uses expenditures on welfare state programs as the sole
measure of welfare effort. Most studies use aggregate expenditures, controlling for the size of
recipient groups, unemployment rates, and inflation. A few studies use gross replacement rates
of unemployment insurance benefits or ‘per capita’ benefits for other welfare and insurance
programs. Noting that these expenditures have either remained constant or increased in recent
years, these works conclude that the welfare state is relatively immune to retrenchment efforts.
20

But this research fails to capture the array of options that policymakers have to control the
growth of aggregate expenditures for these programs.
National governments may respond to increased financial pressures on social insurance
programs in at least four ways. First, they may increase revenues through increased taxation and
payroll contributions. This would allow them to maintain previous levels of benefits per
recipient (hereafter “gross replacement rates”). Second, they may maintain previous levels of
revenue and incur deficits in order to maintain gross replacement rates. Third, they may
maintain previous levels of revenue and decrease gross replacement rates in order to maintain
previous levels of aggregate expenditure. And finally, they may maintain previous levels of
revenue and decrease the number of recipients in order to maintain previous levels of aggregate
expenditure. They would accomplish this by tightening eligibility criteria, such as increasing the
amount of time for which one must contribute to social insurance funds, or increasing the
duration for which one is disqualified from receiving benefits for various reasons. Quantitative
research testing for relationships between global market integration and changes to welfare state
legislation must use measures that incorporate all aspects of welfare state programs that are
potential targets for reforms.7 My alternative measure of welfare retrenchment is presented in
Chapter IV.
Recent Changes in the Character of “Globalization”
Yet another reason for which the quantitative literature has not uncovered a constraining
effect of globalization on the welfare state is that the bulk of the research uses data from 1990 at
the latest. It is true that global trade of goods and services took off in the 1970s. It is also true
that legal barriers to capital mobility fell in the late 1970s and early 1980s. However, both
financial capital and direct investment have increased dramatically since the late 1980s. Also, as
I discuss in Chapter IV, competition for FDI and export market share became more pronounced
in the late 1980s as compared to previous years. So the pace and character of global market
integration has changed substantially in recent years. Therefore, any effect that these new
development would have on the welfare state would not be discovered by these research projects.
In the next chapter I put forth my revision of the efficiency thesis. This revised thesis
overcomes each of the deficiencies in the existing quantitative literature addressed in this
chapter. I discuss the means by which trends in globalization should affect rates of
21

unemployment and economic growth, and therefore create financial pressures for reform. Such
reforms are likely to be unpopular among the citizens of most of the countries examined here.
Therefore, I further discuss the political institutions that should provide opportunities for
policymakers to enact such reforms without prompting electoral backlash. Finally, I present
specific hypotheses to be tested in Chapter IV.
22

CHAPTER III
REFINEMENT OF THE EFFICIENCY THESIS
In this chapter I specify how particular developments in global market integration should
affect unemployment rates and economic growth rates, and how these trends should produce
financial pressures for reform. I also differentiate between what I call “enabling” versus
“disabling” political institutions, and argue that reforms are most likely where both economic
pressures and enabling political institutions are present. I conclude with specific hypotheses
delineating the ways in which trends in globalization, combined with particular political
institutions, should foster reforms of social insurance programs.
THE LINK BETWEEN GLOBALIZATION WELFARE STATE PROGRAMS
Much of the recent quantitative literature examining the effects of globalization on the
modern welfare state only examine market openness as the key indicator of globalization. But
the focus on openness does not fully capture recent developments in international markets in the
1980s and 1990. In studying the effects of global market integration on reforms of welfare state
legislation in OECD countries, one must separate market openness from the patterns of trade and
investment that emerge among them. Some OECD countries are thriving in this new global
environment. On the other hand, others are experiencing net deficits in trade and investment and
persistently high unemployment rates as their industries adjust to changes in international
markets. The examples of Austria and Sweden are illustrative. These two countries have
consistently had similar values of trade openness (exports plus imports as a percentage of GDP).
However, Sweden consistently incurs trade surpluses, while Austria consistently incurs trade
deficits. Clearly, the effect that similar levels of openness should have on unemployment and
economic growth in these two countries should be quite different. In fact, the relationships
between openness and direction of trade and investment (imports versus exports, inward versus
outward FDI) for these fourteen countries are tenuous at best, as indicated in Table A-2 of the
Appendix.
While total volumes of trade among OECD countries have not changed dramatically, in
many of these countries the direction of trade has changed. Many of these countries are
sustaining trade deficits as a result of consistently importing more than they export. Both of
23
these trends may be the result of waning competitiveness of exports from these countries. Again,
measures of trade openness do not capture this shift from trade surpluses to trade deficits.
Additionally, levels of foreign direct investment (FDI) crossing national borders are
unprecedented. More importantly, much like international markets for goods, many OECD
countries are sustaining net deficits in foreign direct investment, as volumes of outward FDI
consistently exceed volumes of inward FDI. Finally, unemployment rates in many OECD
countries have been high for over a decade, which some believe is a result of these trends in
trade and investment. These trends in market integration and unemployment levels in OECD
countries call for a reexamination of the effects globalization has on the modern welfare state. In
the sections that follow I discuss the potential effects of each of these developments on
investment, employment, and growth. I further discuss the ways in which these economic trends
create financial pressures for reforms of social insurance programs.
A host of scholars have examined potential relationships between welfare state
expenditures and competitiveness, but there still is no concensus on whether or not these
expenditures do threaten competitiveness. This dissertation will not enter into this debate.
Instead, I will present evidence that some OECD countries are, in fact, less competitive than
others in increasingly open markets, and I will examine the relationships between these trends
and reforms of social insurance policies. It should be noted, however, that there is growing
belief that that trade liberalization may be necessary for continued economic growth, despite its
at least temporary harm it may bring to some workers in OECD countries (Hanson 1998). Also,
independent of any empirical link between the welfare state and competitiveness, there is
growing belief among key constituent groups and policymakers that welfare state taxes and
expenditures discourage investment and reduce international demand for a given country’s
exports, which in turn threaten economic growth in that country (Jordan 1998:9, Rhodes 1998,
1996:308). Given the growing belief that policymakers should avoid increases in payroll taxes
to address these financial pressures, the desire to foster the competitiveness of their industries
should make it difficult for OECD countries to sustain large welfare programs that increase costs
of production and reduce returns to capital investment.
24
Trade
The connections between trade, the risk of unemployment, and changes to welfare
programs should result from two trends. First, cross-national differences in both wage and non-
wage labor costs may produce significant differences in the final costs of goods and services. As
a result, some countries will import goods that are less expensive than those produced
domestically. Second, international demand for exports originating in these countries is likely to
fall if prices for their goods are higher than substitutes produced in other countries. Declining
domestic and international demand for goods produced in these countries would produce higher
rates of unemployment that persist over the long run.8 Therefore, instead of total volumes of
trade, the relationship between exports and imports in each country should be incorporated into
quantitative analysis used to test these competing theses.
Foreign Direct Investment
As laborers often make us of capital in production, investment is clearly necessary to
sustain levels of production and increase demand for labor. This would in turn reduce
unemployment and stimulate growth. It is true that FDI constitutes a small portion of the fixed
capital stock in OECD Countries, but volumes of both inward and outward FDI are increasingly
rapidly in some countries. If volumes of outward FDI consistently exceeded volumes of inward
FDI in a given country, and volumes of capital originating in that country (e.g. reinvested
corporate profits) could not offset the deficit, then growth in stocks of physical capital would
slow. If the growth of physical capital slows and supplies cannot keep up with growing
populations or the entry of more women into the pool of potential laborers, the demand for labor
would stagnate and unemployment rates should rise (see Mishra 1993).9 In sum, as volumes of
outward FDI exceed volumes of inward FDI, these trends should lead to higher unemployment
rates. For these reasons, the relationship between inward and outward foreign direct investment
in each country should be incorporated into quantitative research linking trends in capital
markets to reforms of welfare state programs.
The effects of investment deficits on unemployment and economic growth should not be
as strong as the effects of trade deficits for two reasons. First, as long as the stock of fixed
capital is growing, albeit at a slower pace due to net deficits in FDI, the rate at which the labor
supply grows will determine the adequacy of capital to employ labor. If the labor supply grows
25
slowly as well, domestic sources of capital may suffice to maintain adequate demand for labor.
Second, despite significant growth in FDI in recent years, it still comprises a much smaller
percentage of GDP than does trade for all of the countries examined here. Therefore, FDI
deficits will have less of an impact than trade deficits demand for labor and aggregate levels of
production.
As a matter of fact, deficits in FDI may stem from two very different causes. The first is
described above; owners of capital invest overseas specifically to avoid high costs of production
such as wages, taxes, and payroll contributions. This is commonly referred to as “capital flight.”
But deficits in FDI may also result from saturated investment markets. Consider that domestic
corporate profits are the largest source of capital stock for the countries examined here. In a
strong economy, the growth of capital available for investment could outpace the growth in the
labor supply. In this situation owners of capital could invest overseas without curbing demand
for labor. Neither unemployment rates nor growth rates would be hurt as a result. A thorough
examination of these various relationships between investment and unemployment rates is
beyond the purview of this dissertation. However, in Chapter IV I test for the relationship
between trends in trade and FDI and unemployment rates among these fourteen countries,
controlling for partisanship and the presence of strong labor unions. The results from this
analysis will provide insight into the nature of deficits in FDI among these countries and the
likely impact on reforms of social insurance programs.
THE FOCUS ON SOCIAL INSURANCE
The relationship between globalization, unemployment, and welfare state programs in
OECD countries should be as follows. Social insurance programs are financed through employer
and employee payroll contributions, and these contributions are generally earmarked for specific
programs. These contributions increase the cost of production, and may render goods and
services produced in these countries less competitive relative to goods and services produced in
other countries. This lack of competitiveness leads to higher rates of unemployment until
industries and labor markets adapt to competition in the world market. Higher unemployment
rates would simultaneously increase aggregate expenditures on unemployment cash benefits
while decreasing aggregate payroll taxes that fund all social insurance benefits.
26
As a rule, payroll taxes should cover the entire costs of these social insurance programs.
Deficits, which require supplemental funding from general revenues, should not occur. So given
higher rates of unemployment, in order to prevent deficits policymakers would have to either
increase payroll tax rates or reduce aggregate expenditures. As payroll taxes should be partially
responsible for these high rates of unemployment in the first place, increasing payroll taxes
should prove difficult as market integration proceeds. Hence, these high unemployment rates
should create pressures to adopt reforms aimed at reducing (or at least controlling the growth of)
aggregate expenditures on all social insurance programs.
In contrast, social welfare programs are financed through general government revenues
that are collected primarily through individual and corporate income taxes. These taxes do not
directly affect costs of production or the competitiveness of industries, so they are unrelated to
unemployment rates. One could argue that corporate income taxes influence the decisions of
owners of capital as to where they will invest. As such, they may indirectly influence the
competitiveness of affected industries. However, these taxes also finance much costlier
programs, such as defense, regulatory programs, and infrastructure development, so social
welfare expenditures represent a small portion each corporation’s total tax burden. Reducing
aggregate expenditures on these programs would do little to facilitate the reduction of corporate
income taxes. Therefore, trends in global market integration should not produce financial
pressures to reduce social welfare expenditures. In sum, developments in global market
integration should have direct effects on employment-related social insurance programs, but not
on social welfare programs. For these reasons, I have chosen to focus my research on reforms of
employment related social insurance programs, rather than the array of welfare state programs
that OECD countries provide their citizens.
Falling exports, rising imports and deficits in FDI should create incentives to reform
social insurance programs in at least three ways. First, as indicated above, these trends should
contribute to rising unemployment, which will produce strictly financial pressures to reform
these programs. Second, these economic trends should produce divergent interests between
labor unions in “competitive” export industries versus labor unions in noncompetitive industries
and government. This division would prohibit their willingness or ability to bargain for
economic and labor market policies that include generous social insurance benefits.
Globalization also undermines the legitimacy of those laborers’ demands for more generous
27

social welfare benefits, because these generous benefits would necessitate increases in payroll
taxes. Third, globalization provides owners of capital an exit option. Policymakers should
therefore avoid increases in payroll taxes that might encourage this exit and indirectly inhibit
economic growth.
High Unemployment Rates
One key aspect of the earlier compensation thesis literature (Cameron 1978 and
Katzenstein 1985) that recent supporters of this thesis seem to overlook is that, although many
workers in these small states perceived themselves to be at risk of unemployment, aggregate
unemployment rates in these countries were actually relatively low. Aggregate expenditures on
these benefits grew relatively slowly, and these programs remained viable. In contrast,
unemployment rates in many OECD countries (especially in continental European countries)
have been very high for nearly a decade, driving up aggregate expenditures on unemployment
cash benefits.10
Reforms of social insurance programs would alleviate financial pressures on these
programs in at least three ways. First, reforms that either increase social insurance revenues or
control the growth of aggregate expenditures would alleviate financial pressures in the short-
term. Second, reforms that control aggregate expenditures would allow for cuts in employers’
payroll taxes, which should reduce labor costs. This costs savings should stimulate demand for
goods produced and therefore for additional labor. Third, reducing gross replacement rates of
social insurance benefits would provide greater incentive to individuals receiving benefits to
pursue employment. This would contribute to overall productivity while simultaneously
reducing aggregate social insurance expenditures. To the extent that these reforms stimulate
competitiveness and economic growth, they would represent long-term solutions to financial
pressures on social insurance programs.
Weakening Labor’s Claim for Generous Benefits
The comparative literature has thoroughly documented the decentralization of bargaining
and the declining strength of unions relative to employers since the mid- 1980s. Changes in the
composition of union membership have reduced the capacity of labor unions to act collectively
(Moene and Wallerstein 1993; Lange, Wallerstein, and Golden 1995). Thus far, however,
28
several authors have attributed these changes to de-industrialization, which has led to conflicts
within unions because the interests of blue collar and white-collar workers differ (Moene and
Wallerstein 1993). Others claim that a shift in production from large to small plants, flexible
work schedules, etc. that both produce divergent interests among workers and make it difficult
for unions to organize (Pontusson and Swenson 1996; Pontusson 1995).
Some scholars argue that union members’ interests regarding economic and social
welfare policies are influenced by their ability to compete in the international economy. In
general, those unions engaged in non-competitive enterprises such as services, public
employment, and non-export industries will continue to support higher taxes and social welfare
and insurance benefits that labor unions have traditionally supported. In contrast, those unions
engaged in competitive, export-oriented industries will oppose increases in payroll taxes and
benefits, and support wage flexibility that should allow their wages to rise. In fact, it should be
in their purely rational economic interests to ally with owners of capital seeking trade
liberalization (Frieden and Rogowski 1996; Pfaller et. al. 1991). To the extent that unions are
divided in their interests, they will lack the political clout to bargain for generous benefits or
elect policymakers pledged to raise payroll taxes to fund increasing aggregate expenditures.11
Perhaps more important than the influence of economic trends on labor unions strength
and coordination, the need for competitiveness in open markets should undermine labor unions’
traditional claims for generous social insurance benefits that require high rates of employer
payroll taxes. This should be true even in those few countries in which labor unions remain
relatively strong and centrally organized. To be clear, I argue that it should be especially hard
for weakened labor unions to push for more generous benefits in the face of increasing aggregate
expenditures. This does not imply that cuts in social insurance benefits should be more prevalent
where labor unions are weak. Constituents in OECD countries still largely support generous
social welfare and insurance benefits. Independent of labor unions, these constituents can
influence both the electoral and policymaking processes through a variety of channels in order to
oppose cuts in benefits.12
Strengthening Capital’s Claim for Moderate Payroll Taxes
Some scholars argue that increasingly mobile capital poses a minimal threat to the social
welfare state. They claim that the cost of labor plays a minimal role in decisions to invest
29

overseas. Instead, the skills of the labor force in a given country, access to raw materials, and
transportation costs are all more important factors in these decisions. In fact, the vast majority of
foreign direct investment is exchanged among OECD countries with comparable welfare states
(Hirst and Thompson 1996). However, as volumes of FDI increase, and especially as volumes of
outward FDI exceed volumes of inward FDI, the threat of capital exit becomes more credible.
Therefore, while the effect of deficits in FDI should be weaker than the effect of trade deficits on
unemployment and growth, rising outward FDI signals increasing opportunity for owners of
capital to invest overseas, making capital’s exit option more credible. Therefore, growing
investment deficits as a result of increasing outward FDI should produce incentives to reform
social insurance programs independent of, or in addition to, effects on unemployment and
growth rates.
OTHER SOURCES OF REFORMS NOT ADDRESSED HERE
Before proceeding with my revision of the efficiency thesis and my specific predictions
for reform, I should make clear what I am trying to accomplish and how the arguments and the
evidence that follows should fit with the current literature. My goal here is not to dispute those
scholars who have identified domestic labor market and demographic trends as causes for
reforms of social welfare and insurance programs in OECD countries. For example, rising
numbers of pensioners relative to workers contributing to pay-as-you-go pensions schemes have
required reforms of these programs in order to keep them viable. Japan is a notable example;
replacement rates for old age and disability pensions were cut as early as the late- 1970s, which
preceded a 50% increase in the number of elderly in the next 15 years. Rather, my goal is to
demonstrate that, in addition to these domestic economic and demographic factors that affect
welfare state policy development, trends in global market integration have played a role as well.
I also don’t dispute the observation that partisan politics (e.g. incumbency of right
parties) are responsible for reforms of social welfare and insurance programs in these countries.
Certainly welfare reforms that the Thatcher and Reagan administrations adopted in the U.K. and
the U.S., respectively, are well documented. To demonstrate once again that economically
liberal parties hostile to welfare state taxes and expenditures have instituted reforms of these
programs would add nothing new to this debate. Rather, my goal is to establish the political
institutions that would render economically necessary reforms of social insurance policies more
30

likely even when left and Christian Democratic parties traditionally committed to these programs
control government. Such reforms will be unpopular among constituents supporting these
parties because they undermine the short-term interests of those constituents receiving benefits,
or who view themselves as at risk for becoming unemployed and having to rely on these
benefits. Therefore, politicians representing these parties face challenges to reform programs
without incurring electoral backlash.
THE ENABLING INFLUENCE OF POLITICAL INSTITUTIONS
The financial pressures addressed above cannot directly lead to reforms of social
insurance programs; policymakers must respond to these pressures and enact legislation
mandating such reforms. Therefore, it is important to determine under which circumstances
policymakers give preferences to policies that foster long-term economic growth over policies
that foster short-term income redistribution. As many scholars have claimed, I argue that
political institutions are critical in determining these incentives. Again, laborers and the unions
and parties that represent them also desire low rates of unemployment and strong economic
growth, which are necessary to fund social insurance programs. Therefore, if economic growth
is threatened, then policymakers must adopt policies aimed at restoring economic growth as a
means of funding these social insurance programs. So short-term sacrifices must be made in
order to keep social insurance programs viable. But these reforms are likely to meet with
resistance from those who will immediately be hurt by such reforms.
Pierson (1994, 1996) claims that social welfare reforms differ qualitatively, and not just
quantitatively, from welfare expansion. Politically active constituencies have developed around
these established programs. And while cuts in benefits will seriously alienate those who depend
on targeted programs, budgetary reductions won’t be significant enough to secure electoral
support of taxpayers. Therefore, instead of claiming credit for expansion of social welfare
programs, politicians must strive to avoid blame for retrenchment. Therefore, policymakers
intent on reforms will avoid political backlash if they enact reforms that are difficult for
constituents to identify, thereby allowing themselves to “avoid blame” for these reforms.
31

Institutions That Foster Blame Avoidance
As an extension of Pierson’s central claim, I argue that political institutions allowing
individual politicians to avoid blame for policies of retrenchment would foster the adoption of
social insurance reforms. Bargaining and voting within coalitions that takes place in multi-party
legislatures make individual accountability difficult (Powell and Whitten 1993; Shugart and
Carey 1992). As a result, proportional representation and multi-party legislatures should allow
policymakers to avoid blame for policies that may sacrifice limited short-terms interests as a
means of serving broader long-term interests. Therefore, states with inclusive, or consensual,
policymaking institutions will be better able to respond to the economic imperatives to reform
their social insurance policies as a step towards restoring healthy levels of unemployment and
growth. Independent of constituents’ particular interests, then, these political institutions enable
policy change.
One might argue that multi-party government renders policy change difficult because of
the many interests that are represented in the policymaking process. In contrast, majority parties
can adopt reforms without addressing the interests of opposing parties and their constituents.
But again, reforms of social insurance programs are bound to be politically unpopular in most of
these countries. Even Thatcher and Reagan met with resistance when instituting reforms despite
an apparent conservative mandate that elected them into office (Pierson 1994, 1996). If we take
the view that these reforms will be unpopular and would put accountable parties – certainly a
majority party – at risk of electoral backlash, then multi-party legislatures are in a better position
to adopt reforms than are majority party legislatures.
Institutions That Encourage Cooperation
As indicated in Chapter II, several scholars have lauded institutions that facilitate
consensual policymaking because the former encompass broader segments of society and
produce policies which favor the general interests of society as a whole (Crepaz 1996; Goodin
1996; Huber and Powell 1994; Lijphart 1984; Olson 1982). But because these institutions grant
access to poor, otherwise under-represented groups, these scholars have argued that they also
facilitate the expansion of welfare state policies. But if one examines the effects of these state
institutions independent of constituents’ policy preferences, the key findings indicate that
collective veto points encourage policy change of any kind. This is because collective veto
32
points provide both the electoral and legislative incentives for policymakers representing varied
interests to compromise in order to enact legislation, rather than to compete with one another at
the risk of reaching a stalemate. Parliamentary government provides legislators and executives
the incentives to cooperate and enact legislation, as the cabinet is accountable to the legislature.
Proportional electoral systems often produce multi-party legislatures and governments that
prevent narrow interests held by any one party to dominate the content of legislation.
Given the incentives that collective veto points provide policymakers, these institutional
arrangements “enable” governments to adopt legislation of any kind (Lijphart 1984; Lijphart and
Crepaz 1991; Huber and Powell 1994; Crepaz 1998; Birchfield and Crepaz 1998). I also argue
that political institutions fostering policymaking that incorporates the varied interests – such as
both the short-term and long-term interests of laborers and owners of capital – should encourage
reforms in efforts to improve competitiveness and economic growth. In short, these institutions
provide policymakers with incentives to adopt responsible long-term economic and social
welfare policies goals.
Institutions That Disperse Policymaking Authority
The same literature cited above has found that states with political institutions comprised
of competitive veto points, or decentralization of political authority, have not expanded their
welfare state programs at the rate that states comprised of collective veto points have done.
These scholars argue that competitive veto points often produce deadlocks and prevent
policymakers from adopting policy changes, including expansions of welfare state expenditures
that mitigate earned income inequalities. For example, while minority groups such as owners of
capital and the right wing or neo-liberal parties that represent them may not gather enough
support for policymakers to adopt reforms that serve their interests, they may be able to veto
reforms that contradict their interests. In doing so, these minority groups may block the adoption
of reforms that serve the interests of larger, more powerful groups. The conclusion is that these
competitive veto points are inimical to the interests of those who benefit from these social
welfare and insurance programs.
Again, if we examine the effects of these competitive veto points independent of
constituents’ social welfare and insurance preferences, we find that these competitive veto points
“disable” governments from making significant policy changes of any kind. Single member
33
district representation provides legislators the incentive to serve the narrow interests of their
constituents, even if they contradict party platforms. As a result, it may prove difficult for even
the majority party in the legislature to adopt policy changes because individual members of the
party may stray from the party line if their constituents oppose the policy in question. (Of course
it should be easier for right-wing parties than left or Christian Democratic parties, given their
traditional opposition to generous welfare state programs.) Strong bicameralism magnifies this
effect because it provides constituents opposed to such policies with two avenues to influence the
legislature. Presidential government may produce divided government, which often results in a
deadlock between the legislature and the president who must either approve or veto policies the
legislature adopts. And finally, federalism provides constituents with yet another avenue to
block policies that they oppose. In sum, it should be more difficult to adopt policy changes of
any kinds in states with disabling political institutions. This would include reforms of social
insurance programs, even when the economic imperative to do so is present.
An extension of this argument would posit that concentration of political authority in
unitary governments with unicameral legislatures would foster policy change more readily than
in governments with dispersed policymaking authority. However, the relationship of the
executive to the legislature is likely to have a greater impact on policymaking than the number of
chambers in the legislature. Also, to the extent to which policies are truly national in their scope
and the degree to which varied interests are represented in the national legislature are likely to
have more of an impact on policymaking than the distinction between federal and unitary states.
Therefore, while states with dispersed policymaking authority may be less likely than those with
concentrated authority to adopt policy change, the distinction between enabling and disabling
political institutions should be stronger predictors of policy reforms.
THE INFLUENCE OF LABOR UNIONS ON ECONOMIC AND SOCIAL POLICIES
Labor unions can influence the policy process as a result of their numbers, coordination
or centralization, and their formal incorporation into the policymaking process. As indicated in
Chapter II, strong labor unions have traditionally been associated with expansion of welfare state
programs. In this chapter I cited evidence showing that in many countries levels of union density
and centralization have fallen. However, weakened labor unions should not render social
welfare and insurance benefits more vulnerable to cuts, as laborers can act independent of labor
34

unions to oppose cuts in these popular benefits. In contrast, cuts should be more likely in those
countries in which labor unions remain strong and centrally organized. This is because
encompassing labor unions cannot externalize negative consequences of their demands, so they
should consider the effects of social welfare and insurance policies on labor market and
macroeconomic performance. For example, high payroll taxes that increase the cost of labor
should decrease demand for labor and increase unemployment rates. Yet those who would
become unemployed are likely to belong to these encompassing labor unions. To avoid this,
encompassing labor unions should incorporate their social insurance policy preferences into
larger macroeconomic and labor market policy goals (Garrett 1998; Mishra 1984; Olson 1982).
Much of the literature has focused on labor’s bargaining directly with employers for
wages, training and employer-provided benefits. For example, wage restraint can translate into
greater demand for labor and lower unemployment rates (Compston 1997). But labor unions can
influence government policies as well, by electing politicians pledged to support their economic,
labor market, and social policy goals. Therefore, strong and encompassing labor unions should
encourage their members to support whatever economic and social policies will facilitate lower
levels of unemployment and stronger economic growth. Such policies may include reforming
social insurance benefits to control the growth of aggregate expenditures and prevent increases in
employer social insurance contributions that increase the costs of labor. However, even where
the interests of labor unions are formally incorporated into the policymaking process, politicians
acting on behalf of their parties within the legislature are ultimately responsible for the adoption
of reforms. Therefore, all else being equal, the effect of large and encompassing labor unions on
the incidence of policy reforms should be stronger than most of the literature would predict, but
will not be as strong as the effect of enabling institutions.
To summarize, global market integration exposes industries in OECD countries to
international competition in markets for both goods and capital. Some OECD countries are
losing FDI, and incurring trade deficits. In many OECD countries, unemployment rates are
persistently high and economic growth has slowed. If states are to restore unemployment rates
and economic growth to acceptable levels, they should have to reform their social insurance
programs. But such reforms will be difficult for many constituent groups, and opposition to
those reforms could be strong. Therefore, reforms are likely only where political institutions
encouraging cooperation and responsible policymaking are present. So while these institutions
35

were associated with the expansion of welfare state programs in the past, they will be most likely
to produce reforms when the economic imperative is present.
THE INFLUENCE OF PARTISANSHIP
Social Democratic parties and Christian Democratic parties have traditionally
championed both full employment and generous social welfare programs. Social Democratic
parties are more likely to support universal benefits that are awarded to any citizens in need,
regardless of past labor market involvement. It’s true that states in which Social Democratic
parties have traditionally controlled government do award more generous benefits to those with
substantial histories of employment and social insurance contributions, but flat-rate benefits that
are awarded to those with minimal labor market involvement do provide an acceptable standard
of living. In contrast, states in which Christian Democratic parties have traditionally controlled
government are more likely to have adopted social insurance programs that discriminate among
recipients, providing very generous benefits to those with relatively long employment and high
wages and social insurance contributions, but less generous benefits to those with sporadic work
histories or relatively low wages and payroll contributions. Despite these differences, control of
government by either Social Democratic or Christian Democratic parties has traditionally been
associated with generous social welfare and insurance benefits. Conversely, right wing parties
traditionally support social welfare and insurance programs as a last resort for citizens unable to
ensure their own welfare by securing employment, or relying on personal savings and private
insurance. Therefore, control of government by right wing parties has traditionally been
associated with relatively meager social welfare and insurance benefits.
While Social Democratic and Christian Democratic parties support generous social
welfare and insurance benefits, both view government policies that maximize demand for labor
as a greater priority. It is therefore reasonable to argue that waning competitiveness among
OECD countries might prompt Social Democratic and Christian Democratic parties that control
government to reform social insurance programs in efforts to reduce aggregate expenditures.
This would forestall further increases in employer contributions in order to stimulate demand for
domestically produced goods, attract foreign direct investment, and boost demand for labor. But
these reforms would cause immediate hardships for constituents relying on social insurance
benefits, and they would be unlikely to produce these positive economic outcomes in the short-
36
run. Therefore, unless electoral rules or political institutions make it difficult to hold individual
parties accountable for reforms, they risk losing future elections to parties pledged to reinstate
social insurance benefits.
Given the need to preserve constituents’ short-term interests as a means of maintaining
control of government, Social Democratic and Christian Democratic parties are unlikely to
hasten reforms in response to negative responses to globalization. Conversely, reforms should
be more likely in those states in which right-wing parties control government, because these
parties will seize upon economic hardships such as high unemployment rates and slow economic
growth as excuses to curtail social insurance expenditures to which they are already generally
opposed. That said, I believe that the influence of partisanship should be strongest when
examining the character of reforms (e.g. cutting gross replacement rates, tightening eligibility
criteria, or increasing payroll contributions), rather than the incidence of reforms.
The conclusions that I have reached about the economic trends, financial pressures on
social insurance programs, and political incentives that should encourage reforms of these
programs are illustrated in Figure 1 below. These argued effects that formal political institutions
and the incorporation of strong, encompassing labor unions on social insurance policies in this
era of globalization stand in stark contrast to conclusions in the literature about the effects of
these political determinants in the past. If these relationships are evident, they will indicate that
globalization has, indeed, caused significant changes in welfare state policymaking.
On the surface, high rates of unemployment and slow economic growth should produce
financial pressures for reforms. These reforms are most likely in cases where economic factors
render aggregate payroll taxes unable to keep pace with aggregate expenditures. Several
scholars have identified domestic causes of these high unemployment and slow economic
growth. However, I will show that trends in globalization are also partially responsible for these
economic trends. As a result, both unemployment and economic growth rates are endogenous to
the structural model depicted in Figure 1 below; globalization is ultimately at least partially
responsible for these financial pressures for reforms.
37

Strength of Industries in Open Markets
No reformsnecessary
“Enabling”Political
Institutions
“Disabling”Political
Institutions
Unable to Adopt Reforms
Trade and investment deficits, high unemployment, slow economic growth
Liberal / Right:Quickest to Reform.Penalize “Undeserving”
Social Dem.:Slowest to Reform.Significant, butEgalitarian
Conservative / Christian Dem.:
Protect “Breadwinner”
Trade and investment
surpluses, lowunemployment,
strong economic growth
Figure 1: The Relationship Between Trends in Globalization and Reforms of Social Insurance
GLOBALIZATION AND SOCIAL INSURANCE: A CURVILINEAR RELATIONSHIP
Both the compensation and efficiency theses fail to account for the interaction between
domestic political factors on the one hand, and international economic constraints on the other.
The compensation thesis argues that domestic political factors drive policy changes while the
efficiency thesis argues that international economic constraints drive policy changes. According
to much of the current literature, as unemployment rates rise and wage inequality increases, most
states should compensate dislocated workers with generous social welfare benefits in the short
run. This is because the political support of the unions and Social Democratic and Christian
Democratic parties to which they are affiliated is necessary for continued economic integration.
Owners of capital cannot easily use the threat of exit to resist such policy changes because the
costs of exiting may be too high; costs of liquidating physical capital, training labor in other
countries, and transporting final products may prevent profitable production elsewhere. These
38
are among the reasons for which previous claims of capital’s “privileged position” over labor in
the policy domain (Lindblom 1977) did not seem evident in the development of welfare policies.
In other words, laborers can use their numerical strength to push for social welfare expansion as
long as opportunity costs of domestic investment are not high enough to prompt capital exit.13
As unemployment and wage inequality worsens, however, tax rates would have to rise in
order to maintain the level of each recipient’s benefits. As those cost of social welfare rises, the
opportunity costs of investment rise and the threat of exit becomes more credible. If large
volumes of capital were invested in foreign markets instead of domestic markets, growth rates
would be threatened -- an almost universally undesirable outcome. Because open capital markets
prevent policymakers from forcing compliance from owners of capital, policymakers must
instead encourage their continued investment. Therefore, policy changes should serve the
interests of owners of capital despite their small numbers; replacement rates and benefits per
recipient will decrease in order to serve the interests of owners of capital. Of course the short-
term interests of capital foster the long-term interests of laborers, as these policies would
eventually stimulate investment and employment.
In sum, the relationship between global market integration and changes to social
insurance programs should be curvilinear. This curvilinear relationship will be most evident in
those states with enabling political institutions, as well as strong and encompassing labor unions.
This is because these institutions have been identified with significant social welfare and
insurance programs in the past, so initially the relationship should be positive. However, I argue
that these institutions should be the most likely to reform social insurance programs where the
economic imperative is present, so the relationship will become negative.
To date, only one other scholar has tested for this curvilinear relationship, although not
testing for the specific interactions that I specify. Hicks (1999) argues that open markets for
goods and capital should prompt governments in OECD countries to foster more competitive
industries by reducing non-productive costs, e.g. welfare state taxes and expenditures. However,
Hicks does not differentiate between those whose industries are thriving and those that are
struggling in open markets for goods and capital. Nor does he account for interaction between
economic and political variables; he treats political variables such as state structure, labor union
organization, and partisanship separately from economic variables. But his predictions for the
effects of these variables follow the precedent of existing literature; Hicks argues that social
39
democratic parties and labor unions should continue to defend welfare state programs, thereby
mitigating economic pressures for retrenchment. He also argues that “exclusionary” political
institutions (what I label “disabling” institutions) should promote retrenchment. Finally, Hicks
uses general measures of welfare effort, rather than measures of employment-related social
insurance benefits, as his dependent variables. Hicks’ mixed results lend only tentative support
to his arguments. However, given my measures that better capture both trends in globalization
social insurance policy outcomes, I expect to find stronger evidence in support of this proposed
curvilinear relationship.
AN ALTERNATIVE MEASURE OF WELFARE EFFORT
Yet another reason for which recent quantitative research has not identified widespread
retrenchment is that much of this research defines retrenchment as either convergence around the
residualist welfare state model, or privatization of social welfare and insurance programs that
amount to dismantling of these programs. But these definitions of retrenchment that are both too
rigid and unrealistic. The idea that the Scandinavian, social democratic welfare states would
respond to pressures from globalization by adopting reforms that render their welfare programs
similar to the residualist welfare programs of the U.S. and the U.K. is unrealistic.
But any reforms among these countries that imposed restrictions on access to these
benefits, such as requiring substantial past employment and social insurance contributions, or
passing a means test, would represent retrenchment. This would be the case even if aggregate
expenditures on these programs remained unchanged. Similarly, if the conservative, continental
European welfare states adopted reforms that reduced gross replacement rates of social insurance
benefits for even those workers who fulfilled maximum requirements for past employment and
social insurance contributions, such reforms would represent retrenchment as well.
This project rests on the assumption that the social welfare state provides for those absent
from the labor market due to old age, health problems, or unemployment, as well as for those
who cannot for whatever reason maintain a basic standard of living (Gough 1979). As such, the
welfare state substitutes for traditional modes to provide for these individuals, such as extended
families and the church (ibid, Esping-Andersen 1990). If one defines the social welfare state in
this way, it is clear that any reforms that shift the growing financial burden of the welfare state
back onto households represent retrenchment. This would include a shift from programs that
40
provide benefits on a universal basis to programs that either award benefits based on past
employment or contributions or to programs that provide only meager benefits to those who pass
means tests (Clayton and Pontusson, 1998). This would also include the reduction of gross
replacement rates of benefits and tightening of eligibility criteria that determine one’s access to
these benefits. This definition of retrenchment contrasts that which is applied by much of the
existing literature, which defines retrenchment as either dismantling of welfare state programs, or
at least convergence around the residualist model.
Policymakers have at their disposal many options for controlling the growth of aggregate
expenditures on social insurance programs, which in turn should control the growth of business’
welfare burden:
1) Policy makers may increase employee contributions to social insurance schemes. 2) They may cut replacement rates of social insurance benefits. 3) They may restrict access to benefits, thereby decreasing the number of beneficiaries
The array of options available to policymakers that shift the financial burden of
unemployment benefit programs onto households can be divided into four categories (see Figure
2). Options (A) and (B) increase aggregate revenues by shifting the burden to the entire working
population. Options (C) and (D) control the growth of aggregate expenditures by reducing the
number of recipients or reducing the amount that each receives; in both cases they shift the
burden directly to those who need to rely on these benefits. Any one of these options would
alleviate financial pressures on employment-related social insurance programs. However, most
quantitative research on the welfare state explores only Option (C). I argue that quantitative
research needs to examine all the components of social welfare and insurance programs, such as
contributions and eligibility criteria.
A logical extension of Pierson’s (1994) claim for the need to “avoid blame,” would
dictate that allowing the real value of gross replacement rates for benefits to fall would be the
most politically feasible option for reform. In some OECD countries, benefit amounts are
specified (i.e., a specific number of national currency units), rather than replacement rates (i.e., a
percentage of lost wages). Policymakers can avoid indexing replacement rates to increases in
wages or inflation without enacting explicit, easily identifiable reforms. In fact, they could even
increase benefits by small amounts while still allowing the real replacement rate to fall. An
41

advantage of this option is that it produces immediate relief of financial pressures on these
programs as aggregate payroll taxes will rise with increases in wages.
Reforms of eligibility criteria should also be politically feasible because current
beneficiaries would generally not be affected if eligibility criteria were changed. Tightening
eligibility criteria governing the receipt of sickness, disability, or unemployment benefits would
disqualify future beneficiaries who are unaware at the time that they will need to rely on these
benefits in the future.14 In the case of old age pension programs, workers plan to rely on these
benefits, but they discount reforms that will affect them because the effect will be experienced in
the distant future. A disadvantage of this strategy is that relief of financial pressures on social
insurance programs may not be realized for several years.
Impose “Direct” Costs Tighten Eligibility Criteria— Limit Access to Benefits.
Increase Revenues
(A) Increase employee payroll contributions (percentage of wages)
(B) Increase number of workers contributing to insurance schemes • Require a longer
history of work and contributions
Reduce Expenditures
(C) Decrease replacement rates of cash benefits • Lower ceiling on tax-exempt
income or benefits
(D) Decrease number of recipients • Greater penalties if
one refuses offers of employment
• More waiting days for unemployment benefits
• Shorten duration of benefits
Figure 2: Options for Reforms
Finally, in several OECD countries the replacement rates for benefits are specified,
expressed as a percentage of lost wages. In these countries, policymakers would have to adopt
42

new policies in order to decrease replacement rates. Again, this strategy would provide
immediate relief of financial pressures on these programs. However, as benefit recipients would
also immediately feel the effects of these reductions, and would be able to identify explicit policy
changes prompting these reductions, this strategy is the least likely of the options addressed here.
While the impact of reforming eligibility criteria would be less immediate and perhaps
less severe than cutting replacement rates, such reforms would definitely represent retrenchment
of these programs. In fact, reforming eligibility criteria may contradict widely held political and
social values more so than cutting replacement rates. Again, the most influential literature on the
welfare state identify these criteria as the key factor distinguishing cross-national differences
among welfare states because they preserve values that different political groups seek to further
through their welfare state programs (Pierson 1994 and 1996; Huber, Ragin, and Stephens 1993;
Esping-Andersen 1996 and 1990; Furniss and Tilton 1977). Therefore, a combination of factors,
such as the number of individuals that particular programs benefit, the size of these programs and
the employer contributions they require, and the values that these programs (as well as particular
aspects of these programs) foster should all influence politicians’ choices for reforms. In
Chapter IV I will examine only resulting replacement rates, and not the specific causes of these
changes. However, in Chapter V I will examine the sources of any changes to replacement rates
of benefits.
HYPOTHESES
Based on the arguments presented in this chapter, I put forth the following hypotheses,
which will be tested in Chapter IV.
1) Employer contributions to social insurance schemes increase non-wage labor costs and therefore increase the final costs of goods and services. These higher costs may render these goods and services less competitive in an increasingly integrated global economy. As a result, unemployment rates would rise. Therefore, I expect to find a positive relationship between employer contributions and unemployment rates. 2) Based on arguments presented throughout these three chapters, net deficits in both trade deficits and FDI in a given country should, all else being equal, reduce demand for labor. Therefore, I expect the relationships between my measures of net deficits in trade and investment on the one hand, and unemployment rates on the other, to be positive.
43

3) Net deficits in trade and investment should, all else being equal, inhibit economic growth. Therefore, I expect the relationships between my measures of net deficits in trade and investment on the one hand, and economic growth rates on the other, to be negative. 4) As high rates of employer contributions should contribute to the persistently high rates of unemployment observed in many OECD countries since the mid- 1980s, I expect the relationship between these contributions and net replacement rates for these social insurance benefits to be negative. As employer contributions and unemployment rates rise, policymakers are encouraged to reform these programs in order to forestall increases in employer contributions that might further exacerbate unemployment levels. 5) According to the current literature, policymakers should respond to workers’ dislocation from the labor market resulting from waning competitiveness with more generous social insurance benefits. However, as trade deficits grow, policymakers should have to reform these programs and control costs in order to forestall increases in employer contributions and restore competitiveness of domestic industries. Therefore, the relationship between net deficits in trade and social insurance benefits should be curvilinear. 6) Policymakers should also have incentives to reform social insurance benefits in order to control costs and continue to attract foreign direct investment. If domestic sources of capital are leaving a given country faster than foreign sources of capital are entering this country, this incentive grows stronger. Therefore, I expect the relationship between net deficits in FDI and social insurance benefits to mirror the relationship between net deficits in trade and social insurance benefits. This relationship will also be curvilinear, with benefits rising with these net deficits to a point, but then falling as net deficits continue to rise. 7) Enabling political institutions will magnify the independent effects of net deficits in trade and investment outlined above. I expect that the interactive effect of enabling political institutions and these economic measures on social insurance benefits to be curvilinear, and that this relationship should be stronger than for economic trends alone. Conversely, disabling political institutions should inhibit policy reforms in response to these economic pressures.
8) The interactive effect of strong and cohesive labor unions and net deficits in trade and investments should mirror the effects of enabling political institutions. In addition to the independent effects of the measures of trade and investment on social insurance benefits, I expect the interaction of my measure of labor union strength and cohesiveness and these economic measures also to be curvilinear. 9) I expect that the relationship between the interaction of trends in globalization and partisanship on the one hand, and social insurance benefits on the other will be weaker than the relationships between institutional variables and these benefits. Instead, I expect evidence of the effects of partisanship to be strongest when I examine specific types and timing of reforms of these programs.
44
Chapter IV presents trends in imports and exports, inward and outward FDI, and
unemployment rates and economic growth rates in fourteen OECD countries from 1973 to 1995.
Next, I will present indices showing the degree to which political institutions in these countries
are comprised of enabling versus disabling political institutions. I will also present an index that
measures the degree to which labor unions are strong and encompassing (or the degree to which
social corporatism influences the policy process). Based on the combined effects of economic
pressures and the influence of political institutions, I will make predictions as to which countries
should reform their social insurance programs.
Chapter IV also presents the values of adjusted replacement rates for all four social
insurance programs in each of these countries over the period 1973 to 1995. Just as much of the
literature has argued, my measure of adjusted replacement rates shows that social insurance
programs generally became more generous from the 1970s through at least the mid- 1980s in
nearly all of the countries included in this study. However, starting in the mid- to late- 1980s,
reforms that produced falling adjusted replacement rates were just as widespread as previous
increases had been. The coincidence of these reforms with the economic and political conditions
that I address will certainly not be enough to infer causality. Therefore, I also present the results
of regression analysis that tests the effects of both economic and political variables on these
adjusted replacement rates. If these relationships are statistically significant, and in the direction
that I anticipate, such relationships will lend support to my hypotheses.
Chapter V presents a discussion of the potential affects of partisanship on reforms
adopted and present data on partisan composition of governments in these countries during these
years. Based on this information, I will make predictions as to what types of reforms – and to
which programs – these countries should adopt. An examination of the specific types of reforms
adopted, the timing of these reforms, and in particular the parties in power when these reforms
were adopted, will provide yet another test for my hypotheses.
45
CHAPTER IV
GLOBALIZATION AND RETRENCHMENT REVISITED
INTRODUCTION
The discussion in Chapter II indicates that the disagreement in the current literature over
the effects of trends in global market integration on social insurance outcomes stems from at
least three sources. First, there is disagreement in the literature as to whether social welfare and
insurance expenditures help or hinder competitiveness of domestic industries in OECD countries.
Second, there is disagreement over whether reforms are widespread or not, and whether those
reforms that have been adopted represent minor “adjustments” or more significant retrenchment
of those social welfare and insurance programs. Finally, there is very limited quantitative
evidence linking trends in global market integration to these reforms. Therefore, while many
scholars agree that some reforms have taken place, there is little evidence that globalization is the
cause.
In this chapter I will present evidence that represents significant step towards resolving
each of these controversies. First, I will show that deficits in trade and foreign direct investment
that countries incur largely as a result of exposure to open markets are associated with the
persistently high unemployment rates and low rates of real economic growth that many OECD
countries have experienced in recent years. Second, I will show that when one accounts for the
broad range of reforms to social insurance programs that policymakers may adopt, the evidence
that reforms of these social insurance programs aimed at controlling aggregate expenditures on
these programs is quite clear. And finally, I will show that the relationships between net deficits
in trade and foreign direct investment (FDI), as well as total employer contributions to social
insurance schemes on the one hand, and reforms of social insurance programs on the other, are
both in the expected directions and statistically significant.
SOURCE OF DATA AND METHODS
Now that I have presented my arguments linking trends in global market integration to
reforms of social insurance programs, the following review of these trends in recent years serves
as the background for my predictions for such reforms in the countries included in this study.
46
Most of the research examining effects of globalization on the welfare state uses data from the
early 1970s onward, claiming that the OPEC oil shocks signaled a new era for economic and
social policymaking in which domestic politics were inextricably intertwined with international
economics. Evidence of expansions of welfare state programs in virtually all OECD countries
throughout the 1970s and most of the 1980s abounds (Iversen and Cusack 1998; Crepaz 1998;
Birchfield and Crepaz 1998; Huber, Ragin and Stephens 1993; Hicks and Swank 1992; Hicks
and Swank 1984; Pampel and Williamson 1989). And while I take issue with some of the
methods included in these research projects, my measure of adjusted replacement rates indicates
that most programs grew more generous throughout the 1970s and early 1980s. So while some
scholars start their analysis of welfare state policy changes in the early 1960s (Swank, 2001;
Hicks, 1999; Hicks and Swank, 1992), the analysis that follows starts with 1973, which should
be early enough to discover early reforms of these social insurance programs where they occur.
Much of the recent research on the welfare state also includes the same eighteen OECD
countries that, along with Luxembourg, constitute the nineteen advanced industrial countries that
have been democracies since World War II. These countries are Australia, Austria, Belgium,
Canada, Denmark, Finland, France, Germany15, Ireland, Italy, Japan, Netherlands, Norway, New
Zealand, Sweden, Switzerland, the United Kingdom, and the United States. These states are
studied time and again to assess economic and social policy outcomes because their economies
are very similar, but there is a great deal of variance among them in labor union strength,
partisanship of government, as well as government structure. Therefore, cross-national
differences in economic and social policies adopted can be attributed to political, rather than
purely economic, differences. My study excludes Australia, Ireland, New Zealand and
Switzerland from this group. Economic and political data for Ireland and Switzerland are
incomplete, preventing me from including these countries in my regression analysis.
I exclude Australia and New Zealand because general revenues, rather than payroll taxes,
fund their unemployment, pension, and sickness benefit. Also, these benefits are provided based
on a means test, rather than one’s history of employment or taxes paid. Therefore, these
programs amount to social welfare, rather than social insurance. As indicated in Chapter III, I
exclude all social welfare programs from this study. This is because they do not directly increase
the non-wage costs of labor that may decrease aggregate demand for labor or discourage capital
47
investment, so they are not affected by trends in globalization. For these reasons, I exclude
Australia and New Zealand entirely.
The four employment-related social insurance programs included in this study are old age
pensions, disability pensions, unemployment insurance cash benefits, and sickness cash benefits.
Eligibility criteria differ slightly for these four programs, and therefore so do policymakers’
options for reform. For old age pensions, these criteria include (1) duration of required
employment and contributions and (2) retirement age. For unemployment benefits, these
eligibility criteria include (1) duration of required employment and contributions, (2) number of
days one must wait after becoming unemployed before collecting benefits, and (3) the number of
weeks for which one is disqualified from receiving benefits if one turns down offers of
employment. Criteria for disability pensions include (1) duration of required employment and
contributions and (2) proof of disability. Sickness benefit eligibility criteria (1) duration of
required employment and contributions, (2) number of days one must wait before receiving
benefits.
A few authors have attempted to include eligibility criteria in quantitative measures of
welfare effort. Myles (1989), Esping-Andersen (1990) and Kangas (1991) each developed
measures of the quality of welfare benefits that include not only the replacement rates of
benefits, but also the duration of benefits and some eligibility criteria. Each of these works,
therefore, make significant strides towards creating a measure of welfare effort suitable for
quantitative analysis. However, each of these measures does have shortcomings.
Myles’ index for the quality of pension benefits includes values assigned for several
aspects of public pensions, such as maximum pensions, cost-of-living increases, and universality
of coverage. Myles compares the pension programs of the countries in his study and ranks his
six components, assigning values to them according to how generous or flexible they are relative
to the other countries. A drawback to Myles’ measure is that if all countries reform their pension
programs, his qualitative index will not register these changes as long as the countries maintain
their rankings. Therefore, this measure is best for cross-sectional comparisons at one point in
time, rather than comparisons both across and within countries over time.
Esping-Andersen’s (1990) measure ranks various social welfare and insurance programs
of eighteen countries according to a range of eligibility criteria and benefit amounts. Like
Myles’ index, Esping-Andersen’s is a qualitative index that compares the programs of these
48
countries and ranks the degree “de-commodification” according to their variance from the mean.
Therefore, Esping-Andersen’s index also will not register these changes as long as the countries
maintain their rankings. Given the huge disparity in de-commodification of the welfare states he
examines, it is easy to imagine that countries could adopt very significant reforms without
changing their ranking compared to the other seventeen countries.
Kangas’ (1991) index for sickness benefits combines 1) number of insured for daily
sickness allowances as a percentage of the population 15 – 64, 2) the income replacement rate as
a percentage of net wage, and 3) the number of waiting days before benefits can be collected.
Then Kangas weights the replacement rate by four-sixths and the number of waiting days and
coverage by one-sixth. These three components were then compiled into an additive index
measuring the quality of social rights in sickness benefits. A drawback to Kangas’ index is that
he does not justify the reason for which he assigns these weights to the various components of
sickness benefits. Also, his measure does not include required contributions to qualify for
sickness benefits, such as the duration of employment or insurance contributions. Reforms of
these criteria, particularly the former, could significantly limit one’s access to benefits.
In order to incorporate each of these options presented in Figure 2 into a measure of
welfare effort, I have developed a measure of “adjusted replacement rates” for social insurance
benefits. An advantage of this measure is that it incorporates eligibility criteria, but can be used
in quantitative analysis using very large data sets. The results of such an analysis should better
complement the thorough case studies of such reforms in the current literature. This measure
improves upon Myles’, Esping-Andersen’s, and Kangas’ measures because it incorporates
replacement rates, contributions, and the entire range of eligibility criteria that one must meet to
qualify for benefits. The value of this measure will change if any aspect of a given social
insurance program changes. Also, this measure can be used for both cross-national and
longitudinal comparisons because it captures trends that may affect all countries in this study in
similar ways. The formula for adjusted replacement rates is:
((Gross Replacement Rate * Duration Benefits) – (Tax Rate * Duration Contribution))
(Duration of Need for Benefit)
49
• Duration of Benefits = (Duration of Benefits before penalties – Waiting Period – Disqualification)
• For old age pension benefits, duration of need for benefits is calculated by subtracting the
retirement age from average life expectancy at retirement age. • For disability benefits, these values are further divided by the degree of disability required to
receive maximum benefits. Therefore, if the maximum disability benefit remains the same but legislation is adopted changing the required level of disability from, say, 85% to 100%, the adjusted replacement rate will fall.
Some might argue that the inclusion of disqualification periods overstates the impact of
reforms because many unemployed individuals would accept their first offers of employment,
thereby not incurring the penalty. However, I argue that the inclusion of this variable is justified,
and it underestimates the full effects of reforms, at any rate. An increase in the period of
disqualification from, say, two weeks to four would decrease the adjusted replacement rate by
only about four percent. However, such reforms would force many individuals to accept
unsatisfactory offers of employment, which would represent a significant change to such
programs.
Eligibility criteria for all four programs, benefit amounts, and total employer payroll
contributions for these programs come from Social Security Programs Throughout the World
(Social Security Administration, various years). This publication presents policies in effect as of
January 1st for each year included (odd years only). The OECD provides gross replacement rates
for unemployment cash benefits, but not for the other three social insurance programs. For the
remaining programs I calculated gross replacement rates based on benefit amounts. Many
countries included in this study award benefits according to a specific portion of one’s wages
(e.g. 60% replacement rate), which represent the gross replacement rates of these benefits. Some
countries assign either a flat amount or a specific amount for each year of contributions. Also,
minimum or maximum earnings for contributions or benefits purposes are often mandated. In
order to calculate gross replacement rates for old age pensions, disability pensions, and sickness
benefits for those countries, I compared the amount of cash benefits to either industrial or non-
agricultural wages using the Bulletin of Labor Statistics. Earnings statistics for United Kingdom
were supplemented using Statistical Yearbooks for that country for various years. Some
statistics for Denmark, Finland, Norway, and Sweden were supplemented using the Yearbook of
Nordic Statistics for various years.16
50
Data on unemployment rates come from OECD Historical Statistics. Data on foreign
direct investment, imports, and exports come primarily from the International Monetary Fund’s
International Financial Statistics. These data were supplemented with figures from the United
Nations’ World Investment Report, and the OECD International Direct Investment Yearbook
(OECD 1998) for select years. In this chapter I present trends in imports and exports, as well as
both inward and outward flows of FDI (all expressed as percentages of GDP), and predict
reforms of social insurance programs where economic pressures and facilitating political
variables make reforms likely. I argued in Chapter III that these trends should be examined
separately, rather than combining them to create measures of market openness. However, I
created a single measure for trade and a single measure for FDI for two reasons. First, as these
measures are expressed in terms of GDP, fluctuations in GDP will change these measures
independent of changes in volumes of trade or FDI. So, for example, if volumes of trade
remained relatively constant, the nominal value of total trade would rise with inflation. But if
increases in nominal GDP failed to keep pace with inflation, then the value of trade as a
percentage of GDP would rise, even though volumes remained constant.
The second reason for which I use a single measure each for trade and investment is that
measures for imports versus exports and inward FDI versus outward FDI may not provide
statistically significant results. This is because regression coefficients represent the effect that a
given independent variable has on the dependent variable holding all else equal. But, for
example, rising imports produce entirely different effects on domestic demand for labor
depending on whether they are coupled with rising exports (in which case domestic demand for
labor may still be strong) or falling exports (in which case domestic demand for labor is likely to
fall). Therefore, rather than examining these variables separately in the regression analysis, I
have created indices that measure the ratio of imports to total trade and the ratio of outward FDI
to total FDI. Values less than 0.5 these measures indicate net surpluses for trade and investment,
respectively, while values greater than 0.5 indicate net deficits.17 These values differentiate
between “positive” and “negative” responses to globalization, unlike the widely used measures
of market openness.
A drawback to the ratio of imports as a percentage of total trade is that it does not reveal
differences in total volumes of trade between two countries; it only reveals the relationship
between levels imports and levels of exports for a single country. Therefore, this ratio may be
51

similar for two countries and yet the extent to which trade influences the economic performance
of these two countries may differ substantially. For example, as Tables 1 through 3 reveal, the
value of this ratio is similar for Austria and the United Kingdom. Yet trade has a much greater
impact on the economy in Austria than it does in the United Kingdom. In the 1980s and 1990s
total trade in Austria was consistently above 50% of GDP. Conversely, that figure for the United
Kingdom was much closer to 42% of GDP. Therefore, while the ratio of imports to total trade is
similar for both countries, and this ratio indicates that both countries consistently incur trade
deficits, that trade deficit is likely to have a greater impact on unemployment and economic
growth in Austria than in the United Kingdom. Of course the ratio for outward FDI as a
percentage of total FDI has the same drawbacks. Nevertheless, these measures are independent
of fluctuations in GDP, capture cross-national differences in strength of export and investment
markets, and can be used in quantitative analysis to test for curvilinear relationships.
State structure and cabinet partisanship variables used here come from Swank (2001).
Measures for Left, Secular Center, Centrist Christian Democrat, and Right parties represent the
proportion of cabinet positions occupied by those parties. The measures of enabling versus
disabling political institutions incorporate most of the variables that several scholars have used in
examining the impact of state structures on changes to welfare policies. These scholars build
upon theories that Lijphart (1984) put forth about the effects of these structures on points of
access that constituents have to affect the policy process, as well as on the incentives of elected
policymakers. Some have created unweighted additive indices measuring the number of veto
points, produced by the presence of presidentialism versus parliamentarism, federalism,
bicameralism, electoral laws establishing proportional representation, the presence of multiparty
government that may result from proportional representation, and referendum voting.
In Chapter III my arguments also build upon these theories, claiming that
parliamentarism, proportional representation, and multiparty government should theoretically
enable policymakers to adopt reforms. In contrast, the division of power that results from
presidentialism, bicameralism, and federalism should disable policymakers from easily adopting
reforms. However, I avoid using unweighted additive indices that other scholars use because the
assignment of equal weight to each of these measures is arbitrary. If the institutional structures
these measures represent exercise differing influences on the policymaking process, these
unweighted additive indices fail to capture these differences.
52

Following the example set by Swank, I conducted correlation and principal components
analysis using measures of proportional representation, number of effective parties, bicameralism
of the legislature, federalism, and presidentialism versus parliamentarism. Not surprisingly, the
measures of proportional representation and number of effective parties loaded on the same
factor. I used these two variables to create a weighted standard score index of what Swank labels
inclusive electoral institutions, which enable policymakers to adopt reforms in response to
changing economic and political forces. Therefore, this factor represents the enabling political
institutions on which I based my hypotheses in Chapter III. Bicameralism and federalism loaded
on the same factor, and I used them to create a similarly constructed index of what Swank labels
“decentralization of political authority,” which prevents policymakers from adopting reforms in
response to political pressures. Therefore, this factor represents the disabling political
institutions on which I based my hypotheses in Chapter III.
Again following the example set by Swank, I use data on the organization of trade unions
and the labor and industrial relations systems in these fourteen OECD countries to develop an
indicator of social corporatism. These data come from Golden, Lange, and Wallerstein (1997). I
use correlation and principal components analysis of dimensions of corporatism that should
theoretically cohere. These include union density, inter-confederal concentration, confederal
power as indicated by measures of control over strike funds and involvement in wage bargaining,
and the level of wage bargaining. The measures of union density, confederal power, and level of
wage bargaining load heavily on the same factor, so I use them to create a weighted standard
score index to represent social corporatism. The measure of inter-confederal concentration loads
on a separate factor, so it is excluded from the analysis.
Recently, a number of comparative scholars have acknowledged growing financial
pressures on social welfare and insurance programs in many OECD countries, and reforms of
these programs that policymakers have adopted in response. As discussed in Chapter III,
however, there is very little evidence indicating statistically significant relationships between
trends in global integration and reforms of social insurance programs. It is generally
acknowledged that persistently high unemployment rates and slowed economic growth are
producing financial pressures, but domestic demographic trends, and not globalization, are
blamed for these domestic economic trends. Iversen (1998) offers convincing arguments that it
is deindustrialization, rather than globalization, that leads to prolonged bouts of unemployment
53
for workers in OECD countries, and therefore to expansion of social welfare states through the
late 1980s.18 Pierson (2001) also believes the shift to services has been significant for welfare
state legislation, but claims that lower productivity resulting from the shift from manufacturing
to services sectors, maturing populations, and extensive commitments to welfare program
expenditures have caused the fiscal pressures to reform welfare state programs. Maturing
populations contribute to this increased pressure because it raises the number of pensioners
receiving pensions benefits relative to the number of workers contributing to pension funds.
Huber and Stephens (1998) acknowledge that persistently high rates of unemployment
are associated with the “rollback” of some social insurance programs, but blame rises in rates of
female participation in the labor force for this unemployment. As the number of potential
workers rises and demand for labor fails to keep pace, the unemployment rate will rise in
response.
These scholars have put forth convincing arguments and evidence to explain some of the
causes of recent reforms, but I disagree with the popular notion that trends in global market
integration are unrelated to these reforms. In this chapter I will show statistically significant
relationships between trends in global market integration and social insurance reforms, even
when controlling for these domestic demographic factors. In my regression analysis, I include
variables for the proportion of the working population employed in services to represent
deindustrialization, the proportion of the working population that is female, and the proportion of
the population that is over 65 years of age. While this measure captures the aging of populations
in these countries, it is an imperfect measure of the trends that aging implies – growing numbers
of individuals retiring from work and collecting old age pensions. Nevertheless, this is the best
available measure of these trends. All of these variables come from Huber and Stephens’
Comparative Welfare State Dataset (see Huber and Stephens 2001).
TRENDS IN GLOBAL MARKET INTEGRATION
I now turn to recent trends in global market integration that should provide the source of
predictions for reforms in these fourteen countries. Some industries in OECD countries may
thrive in open markets for goods, services, and physical capital. For example, volumes of
exports may be rising and even exceeding volumes of imports in recent years. Similarly,
volumes of inward FDI may be rising and exceeding volumes of outward FDI in recent years as
54

well. In part as a result of these trends, unemployment rates may be relatively low and financial
pressures on social insurance programs should be manageable. Therefore, no reforms of social
insurance programs are necessary. Other countries experience negative responses to
globalization, with imports exceeding exports and outward FDI exceeding inward FDI.
Unemployment rates may rise in response to these trends, and financial pressures on social
insurance schemes funded through payroll contributions will increase. As a result, reforms of
social insurance programs may be necessary in order to keep these programs viable.
Figure 3 shows five-year averages for trends in imports versus exports for all fourteen
countries from 1972 to 1994. This figure shows that, on average, total volumes of trade as a
percentage of GDP increased substantially in these countries throughout the 1980s. Imports
exceeded exports for the group of countries during this period, indicating that many countries
experienced trade deficits as markets for goods became increasingly integrated. In the late 1980s
volumes of total trade relative to GDP decreased, and exports exceeded imports, indicating that
the trade positions of at least some countries had improved. Finally, in the early 1990s total
volumes of trade relative to GDP declined once again. Exports continued to outpace imports,
indicating that the trade positions of at least some countries had improved once again. Certainly
there is substantial variation these fourteen countries, and these variations are revealed in figures
discussed below. However, it appears that trade – to the extent that these deficits do affect
unemployment rates – this effect should be strongest in the mid- to late- 1980s.
Tables 1 and 2 show five-year trends in imports and exports, respectively, for each of the
fourteen countries included here. Table 1 reveals that most of these countries adhered to the
average trends indicated in Figure 3; imports relative to GDP were at their highest points in the
mid- to late- 1980s and the values of both measures generally fell in the first half of the 1990s.
Table 3 presents the ratio of imports to total trade. For this measure, a value less than 50%
represents a trade surplus, whereas a value of greater than 50% represents a trade deficit.
Following arguments from previous chapters, independent of domestic developments that will
affect demand for labor, net deficits in trade should dampen demand for labor, while net
surpluses should increase it. In Table 3 the countries are listed from highest to lowest average
values of imports as a proportion of total trade from 1980 to 1994. The exports markets of those
countries towards the top of the table are generally not as strong as those towards the bottom of
55
the table. Independent of other factors, these countries should face stronger financial pressures
on their social insurance programs.
The highlighted cells in Table 3 indicate periods in which this ratio was highest, as well
as values within .02 of this highest proportion for each country. These highlights illustrate that
imports as a proportion of total trade was highest in the 1970s in most of these countries. In fact,
eight of these countries incurred trade deficits for most of this decade. However, the fourteen
countries seemed to have divided into two distinct groups by the late 1970s. Those with the
largest trade deficits in the 1970s continued to run trade deficits throughout the 1980s. In
contrast, most of the countries with smaller trade deficits or even trade surpluses in the 1970s
continued to improve their trade positions in the 1980s and early 1990s. The U.S., Austria, the
U.K., Italy, France, and Belgium are not competing as well in the increasingly integrated global
market for goods as are the remaining eight countries. In particular, Sweden, Germany, Norway,
and Japan are faring quite well throughout the 1980s and early 1990s.
Trends in FDI differ substantially from trends in trade in most of these fourteen countries,
as Figure 4 and Tables 4, 5, and 6 indicate. Foreign direct investment, measured as a percentage
of GDP, is relatively small compared to trade in all fourteen of these countries. However, it has
become increasingly relevant to the economies of these countries in recent years. First, Figure 4
shows five-year averages for inward and outward FDI for all fourteen countries included in this
study. This figure shows two trends that should be relevant for the analysis that follows. First,
in contrast to declining levels of trade (relative to GDP) in the late 1980s and early 1990s,
average levels of FDI for the group increased substantially throughout the 1980s, and increased
slightly once again in the early 1990s. Second, outward consistently FDI exceeds inward FDI,
and the gap between these two measures widened for each five-year period through the late
1980s. Based on these trends, to the extent that net deficits in FDI do affect unemployment
levels, this effect should be strongest in the late 1980s and early 1990s.
Tables 4 and 5 show five-year averages for trends in inward and outward FDI,
respectively, in each of these fourteen countries. These tables show that most of these countries
adhere to the trends in the group averages. Inward FDI is at its highest level in the 1990s in ten
of the fourteen countries. Germany, Italy, the United Kingdom and the United States are the
only exceptions to this trend. More importantly, average levels of outward FDI were at their
56
highest point in the first half of the 1990s in eight of the fourteen. For the remaining six, the
highest average levels of outward FDI relative to GDP were in the late 1980s.
Table 6 shows five-year average values of the ratio of outward FDI to total FDI. For
each country, highlighted cells indicate periods in which this proportion was highest, as well as
values within .02 of this highest proportion. These highlighted cells illustrate that this ratio was
highest in the late 1980s and early 1990s in nine of these countries. Only Belgium enjoys FDI
surpluses in the early 1990s, although Finland experienced a dramatic shift from the 1980s and
recorded equal levels of inward and outward FDI for the 1990s.
Total employer contributions for old age and disability pensions, sickness cash benefits,
and unemployment cash benefits are presented in Table 7. There is significant variance across
these fourteen countries in the value of total contributions, from an average of 34.2% of wages in
Italy to an average of 5.9% of wages in Canada in the 1990s. In general, the value of total
contributions has increased steadily over time. The value of total contributions was highest in
eleven of the fourteen countries in the 1990s. Therefore, further increasing total employer
payroll contributions to sustain higher aggregate social insurance programs, whether these higher
expenditures were due to increased numbers of pensioners and unemployed or to more generous
benefits, may be infeasible. This should be especially true for those countries with the highest
total contributions.
THE INFLUENCE OF INTERVENING POLITICAL VARIABLES
The literature has shown that Social Democratic and Christian Democratic parties, as
well as encompassing labor unions have in the past been able to partially offset market forces
that would otherwise increase unemployment rates. Countries in which Social Democratic
parties have traditionally been very strong are able to offset market forces because relatively
large proportions of their working populations are public employees, and are therefore fairly
insulated from these market forces. These countries also tend to spend heavily on investment in
both human and physical capital. Doing so bolsters aggregate levels of capital investment and
also ensures that workers’ skills match production needs. Countries in which Christian
Democratic parties have traditionally been quite strong tend to invest in worker training
programs for those who become unemployed. Finally, encompassing labor unions have agreed
to pay cuts to boost demand for labor, and have also bargained for worker retraining programs
57
for those members who become unemployed. In contrast to the efforts of these countries, those
countries in which right-wing parties have traditionally been fairly strong are generally less
concerned with unemployment rates than they are with inflation, as the latter is more relevant to
investment opportunities for owners of capital. Therefore, these countries generally do the least
to offset market forces that drive up unemployment rates.
Table 8 shows five-year averages for the cabinet share for Social Democratic, Christian
Democratic, secular center, and right wing parties for each of the fourteen countries examined
here.19 According to the arguments above, the influence of government partisanship on efforts to
combat market forces that would otherwise increase unemployment rates should be strongest in
Austria, Finland, Norway, and Sweden, as well as Germany in the 1970s and early 1980s, where
Social Democratic parties have enjoyed considerable influence in government. This should also
be the case in Germany in the late 1980s, as well as in Italy, the Netherlands, and to a lesser
extent Belgium, where Christian Democratic parties have usually comprised cabinet majorities.
Table 9 includes five-year averages for my measure of social corporatism that represents union
density and union centralization.20 Based on these measures, countries in which labor unions
should exercise the greatest influence in combating high unemployment rates include (not
surprisingly) Denmark, Finland, Norway, and Sweden.
UNEMPLOYMENT AND ECONOMIC GROWTH
Table 10 shows five-year averages for unemployment rates for each of the fourteen
countries. For each country, I have highlighted the five-year period in which average
unemployment rates have been highest. In eight of the fourteen countries, average
unemployment rates were at their highest in the first half of the 1990s. In Belgium and Italy,
average unemployment rates in the early 1990s were only slightly lower than their highest points
from earlier periods. Only the Netherlands, the United Kingdom, and the United States showed
substantially lower unemployment rates in the late 1980s and the early 1990s than they
experienced in the mid- 1980s. For nearly all of these countries, then, purely financial pressures
to reform employment-related social insurance programs stemming from high unemployment
rates should be greatest in the late 1980s and especially the early 1990s. As I discussed in
Chapter II and Chapter III, previous quantitative studies that end their analysis around 1990
58
would logically fail to capture retrenchment when financial pressures on social insurance
programs make retrenchment most likely.
Table 11 shows five-year averages for real rates of economic growth from 1971 to 1995.
A few trends that may influence economic pressures for reform are evident. First, the average
rate of economic growth for these countries fell substantially from an average of over three
percent in the 1970s to just 2.1 percent in the first half of the 1980s. After recovering to rates
averaging about 2.9 percent in the late 1980s, average growth fell substantially again to 1.6
percent for the first half of the 1990s. Of course there is significant variation across these
fourteen countries; Japan and Germany produced rates of economic growth in the late 1980s as
high as they had since the early 1970s, whereas rates of economic growth in Sweden and Finland
were significantly lower in the 1990s than they had been in the previous twenty years. These
slowed rates of growth, combined with high rates of unemployment shown in Table 10, indicate
that in several of these countries economic pressures to reform social insurance programs should
have been strongest in the 1990s.
The efficiency thesis posits waning competitiveness in open markets for trade and
investment would produce the rising rates of unemployment and falling rates of economic
growth presented in the tables above. By contrast, several scholars have claimed that domestic
economic and demographic trends are largely responsible for these trends in unemployment and
economic growth. Therefore, they conclude, these domestic developments – and not trends in
global market integration - are ultimately responsible for reforms of social welfare and insurance
programs in recent years. These scholars have presented convincing evidence to support their
claims. In order for the efficiency thesis to have merit, evidence to support the claim that trends
in globalization affect both unemployment rates and economic growth rates is needed.
Table 12 shows the results of the regression including various demographic and political
variables in an attempt to explain variation in unemployment rates in these fourteen countries.
Of course changes in the independent variables should not have contemporaneous effects on the
unemployment and growth rates, so each independent variable is lagged. Political variables are
lagged one year. The demographic variables are also lagged one year. To smooth fluctuations in
trade and investment, lagged three-year moving averages are used. As I had to omit one of the
four party classifications from the regression, I omitted Christian Democrats. Therefore, the
coefficients for each of the economic variables represent the relationship between that variable
59
and unemployment rates where Christian Democratic parties control government. I first address
the effects of increased female participation in the labor market and the shift to service industries
on unemployment rates, as argued by Huber and Stephens (1998) and Iversen (1998),
respectively. The relatively large, negative coefficient for female labor force participation is
surprising, indicating that where Christian Democratic parties control government, a one-point
increase is associated with a 0.26-point decrease in unemployment rates. While Huber and
Stephens’ argument is very logical, this result contradicts that argument. However, this result
must be interpreted along with the interactive effect of parties and social corporatism. The
positive coefficients for the interaction between female participation both left-wing and right-
wing parties completely offset the interaction of female participation and CD government.
Therefore, where left and right parties control government, female participation in the labor force
yields a slight increase in the unemployment rate, just as Huber and Stephens predict. As many
women recently entering the labor force are employed in services, it is possible that the inclusion
of a measure of deindustrialization in this equation explains some of the same variation that
female participation explains, producing these puzzling effects for female participation. In any
case, as female participation in the labor force contributes to only marginally higher
unemployment rates in some cases, I exclude it from the rest of my analysis.
The relatively large, positive coefficient for the proportion of the labor force engaged in
services (Iversen’s 1998 measure of “deindustrialization”) supports Iversen’s central argument; a
one percentage point increase in services as a proportion of total employment is associated with a
0.13 percentage point increase in the unemployment rate.21 This indicates that the shift towards
services is associated with increases in unemployment rates among the countries examined here.
Therefore, I will control for trends in deindustrialization in my regressions testing for the
relationship between trends in globalization and reforms of social insurance programs.
As shown in Table 12, none of the coefficients for partisanship were statistically
significant on their own. This indicates that, holding all else constant, partisanship alone does is
not associated with differences in unemployment rates. In contrast, the coefficient for Social
Corporatism is negative and statistically significant, indicating that the presence of strong and
centrally organized labor unions is associated with a decrease in the unemployment rate. This
result agrees with Compston’s research (1997).
60
I first address the interactions of foreign direct investment deficits with these domestic
political variables. In Table 12, the coefficient for the ratio of outward FDI to total FDI is
positive, although it is also fairly small. This indicates that, when Christian Democratic parties
control government, increases outward FDI relative to inward FDI are associated with small
increases in unemployment rates. This result supports my arguments in Chapter III. In contrast,
the coefficient for the interaction of right-wing parties with the ratio of outward FDI to total FDI
is twice as large, and negative. This indicates that, where right-wing parties control government,
increases in the ratio of outward FDI to total FDI are associated with small decreases in the
unemployment rate. This finding might seem to contradict arguments that net losses in FDI may
cause slowed growth in fixed capital and therefore adversely affect demand for labor. However,
as I argued in Chapter III, countries may incur deficits in FDI without reducing the supply of
fixed capital per worker if domestic sources of capital keep pace with the growth in the labor
supply. This negative coefficient could indicate that, among these countries in which right-wing
parties control government, deficits in FDI are the result of saturated investment markets in
which unemployment rates are low.
The coefficient for the ratio of imports to total trade represents the relationship between
this ratio and unemployment rates when Christian Democratic parties control government. This
coefficient is large and statistically significant, indicating that where CD parties control
government, a one percent increase in the ratio of imports to total trade is associated with a 0.18
percent increase in the unemployment rate. In contrast, the coefficient for the interaction of
right-wing parties and imports is negative, although not as large as the coefficient for the ratio of
imports to total trade on its own. So while the relationship between rising imports and
unemployment is weaker when right-wing parties control government, it is still slightly positive.
These findings largely support arguments that failure to compete in open markets for goods may
dampen demand for labor and increase unemployment rates.
The positive coefficient for total employer contributions to social insurance schemes
indicates that - where Christian Democratic control government – a one-point increase in
employer contributions yields a 0.06 percentage point increase in the unemployment rate. This
finding supports my arguments in Chapter III. High employer payroll contributions increase the
cost of labor, reducing demand for labor and increasing the unemployment rate. In contrast, the
coefficient for the interaction between left-wing parties and payroll taxes is negative, and slightly
61
larger than the coefficient for the interaction with Christian Democratic government. This
indicates that, where left-wing parties control government, a one-point increase in payroll
contributions is associated with slightly lower unemployment rates than where Christian
Democratic parties controlled government.
Table 13 shows results of my analysis regressing real economic growth rates on the ratio
of imports to total trade, the ratio of outward FDI to total FDI, the percentage of the population
in services, and the percentage of the population over 65 years old. The coefficient for Services
is positive and statistically significant. This indicates that, when controlling for aging
populations and trends in globalization, the shift from manufacturing to services is associated
with a slight increase, rather than a decrease, in economic growth rates. The coefficient for the
proportion of the population over 65 years old is rather large and statistically significant,
indicating that a one percent increase in the proportion that is elderly is associated with a 0.69
percent decrease in real economic growth. This is intuitive; as the proportion of the elderly (and,
in most cases, retired) grows, the relative proportion of the population that is productive shrinks,
and real economic growth should slow in response. The coefficients for the ratio of imports to
total trade and for the ratio of outward FDI to total FDI are both negative and statistically
significant, although the coefficient for outward FDI is quite small. Nevertheless, these results
lend support to my arguments that as imports and outward FDI grow relative to exports and
inward FDI, demand for labor and production falls, and rates of real economic growth fall in
response.
In sum, while these results lend support to Iversen’s arguments that domestic economic
trends are partially responsible for persistently high rates of unemployment in many OECD
countries in recent decades, they also contradict the claims by many scholars that trends in global
market integration are not associated with recent high rates of unemployment in many OECD
countries. Instead, the results in Table 12 show that the relationships between deficits in FDI and
trade on the one hand, and unemployment rates on the other, are positive and statistically
significant. Additionally, the relationships between deficits in both trade and investment and
economic growth are negative and statistically significant. These results lend support to the
claim that deficits in FDI may slow growth in fixed capital, leading to lower levels of production
and therefore economic growth. The results in Tables 12 and 13 support these arguments,
indicating that the efficiency thesis, or some variant of it, has merit. High rates of
62
unemployment and low rates of economic growth appear to be linked to lack of competitiveness
in increasingly integrated world markets.
One way to increase competitiveness would be to decrease, or at least control, the cost of
labor. This cost includes employer contributions to social insurance funds. If the growth in
employer contributions to these funds is to be arrested, then benefits must be curtailed in order to
prevent deficits. Based on these arguments, it follows that those countries with high rates of
employer contributions, net deficits in trade, and net deficits in FDI face the greatest pressures to
reform their social insurance programs in efforts to restore their competitiveness and foster more
favorable levels of economic growth.
These regressions results above indicate statistically significant relationships between net
deficits in trade and investment, and deindustrialization on the one hand, and high rates of
unemployment and low rates of economic growth on the other. In the analysis that follows I
regress adjusted replacement rates for social insurance programs on these deficits, payroll
contributions, and the measure of deindustrialization. Again, as I indicate in Chapter III,
unemployment and rates of economic growth are endogenous to the structural equation I have
formulated; trends in globalization can explain changes in unemployment rates and economic
growth, which in turn produce financial pressures for reforms. As these same variables explain
much of the variance in unemployment and economic growth among these countries, I exclude
measures of unemployment and economic growth from the analysis. Instead, I include measures
of these economic trends, along with variables that represent the configuration of state
institutions as well as partisanship. For even though high rates of unemployment may, on the
surface, be the trigger for recent reforms of social insurance programs, it is domestic and
international developments that have caused these high rates of unemployment that are
ultimately the causes of financial pressures on these social insurance programs.
SPECIFIC ECONOMIC TRENDS IN EACH COUNTRY
Some of these fourteen countries have thrived in open markets for trade and investment;
they enjoy trade surpluses, their net deficits in FDI are relatively small, unemployment rates are
manageable, and economic growth is higher than many of the other countries included here. For
these countries, economic imperatives to reform social insurance programs will be weak. In
contrast, some countries are struggling in open markets for trade and investment; they
63
consistently run both trade and investment deficits, unemployment rates are high and rates of
economic growth are low. In these countries, the economic imperative to reform social
insurance programs should be strong. The extent to which these economic imperatives translate
into reforms of social insurance programs will largely depend on the configuration of political
institutions and, to a lesser extent, partisanship of government. These political factors and
predictions for reforms are discussed below.
Countries Thriving as Markets Integrate
The economies of Japan, Germany, and the United States are fairly strong in the face of
open markets for trade and investment. Volumes of FDI leaving Japan are almost ten times the
volumes of FDI entering that country because policies limiting investment in Japan have
rendered inward FDI almost non-existent. Apart from trade deficits resulting from its investment
policies, Japan is thriving in increasingly integrated global markets. Japan has the largest trade
surpluses of any of these countries, has among the lowest unemployment, and (until the 1990s)
had among the highest rates of real economic growth. As economic trends included in the tables
above indicate , the economies of Germany and the United States have also been fairly strong in
the face of market integration, although not as strong as Japan. Therefore, trends in trade,
investment, and unemployment should not produce financial pressures to social insurance
programs in these three countries in the 1980s and 1990s.
Countries Experiencing Economic Hardships Early
The Netherlands and the United Kingdom were among the first countries to experience
trade and investment deficits as markets became slightly more integrated in the 1970s. The
Netherlands incurred only slight trade deficits in the 1970s, but recovered in the early 1980s and
incurred slight trade surpluses for the remainder of this period. In contrast, both investment
deficits and unemployment rates were larger than in most countries throughout the 1980s. In
addition, growth rates in the early 1980s were much lower than they had been in years before or
since, and were lower than in nine of these fourteen countries for that time period. The United
Kingdom consistently incurred substantial deficits in both trade and investment. Trade deficits
were at their highest levels in the 1970s while investment deficits were at their highest in the
early 1980s, due in part to economic “adjustment” under Margaret Thatcher. Growth rates have
64
hovered around 2.0 percent for much of this entire period, but unemployment rates were also at
their highest, and quite high relative to the other thirteen countries, throughout the 1980s. In
sum, trends in trade, investment, and unemployment should produce financial pressures to social
insurance programs in these two countries as early as the 1970s and the first half of the 1980s.
Countries Experiencing Economic Hardships Later
Half of the countries examined here – Austria, Canada, Denmark, Finland, France, Italy,
and Sweden – have experienced some combinations of trade and investment deficits, high
unemployment, and slow economic growth beginning in the mid-1980s. Specific trends in
Austria and France are presented here, and trends in the remaining countries are summarized in
the tables included above. Austria consistently runs one of the highest trade deficits among these
countries throughout the period. Austria incurred relatively small investment deficits until the
1990s, when deficits were higher than most of the countries included here. Unemployment rates
are consistently among the lowest of these countries, but they increased from an average rate of
less than 2% in the 1970s to almost 3% in the early 1980s and about 3.5% in the late 1980s and
1990s. Economic growth rates fell sharply in the early 1980s and then, after recovering in the
late 1980s, fell again in the 1990s. Trade deficits in France have eased slightly in recent years,
but net deficits in FDI rose substantially in the 1990s. At the same time, unemployment rates
rose substantially, just as rates of real economic growth have dropped sharply. In sum, economic
pressures to reform social insurance programs should be moderate in these countries in the mid-
1980s, and then quite strong in the 1990s.
Norway has experienced “mixed” responses to globalization. For the 1980s and 1990s,
Norway’s trade surplus and average growth rates are second only to Japan’s. However,
Norway’s investment deficits increased dramatically in the 1980s. And although average
unemployment rates are among the lowest for the 1980s and 1990s of the fourteen countries
included here, they increased substantially in the 1980s and again in the early 1990s. Also,
average growth rates in the late 1980s were lower than all other countries except for Denmark.
Total employer payroll contributions in Norway are only slightly higher than the average for
these fourteen countries. So while Norway’s trade surplus is strong, recent trends in investment
deficits, unemployment and (for at least the late 1980s) economic growth make moderate
reforms of social insurance programs starting in the late 1980s likely.
65
Finally, Belgium is a special case among these fourteen countries, given trends in trade
and investment unemployment, and economic growth. Belgium has the highest average
unemployment rates and among the lowest real economic growth rates. But these trends seem to
be independent of trends in globalization. Belgium exports almost as much as it imports, and
Belgium enjoys the highest investment surplus of any country included here. Total employer
contributions in Belgium are about average. Given these high rates of unemployment and low
rates of growth, reforms in Belgium may be likely, but I admit that these reforms would unlikely
be in response to trends in global market integration.
THE INFLUENCE OF INSTITUTIONS ON THE FEASIBILITY OF REFORMS
Reforms of social insurance programs would alleviate financial pressures they are now
experiencing. But reforms are also likely to meet with resistance from those who relying on
social insurance benefits, who also may not realize how these reforms may eventually benefit
them. As I argued in Chapter III, the extent to which political institutions foster or inhibit
“responsible” policymaking will influence the likelihood of reforms being adopted in response to
these financial pressures. Those countries with enabling electoral institutions, strong social
corporatism, and concentration of political authority (as represented by low or negative scores
for the measure of disabling institutions or decentralization of political authority) should be the
most likely to adopt reforms.22
As indicated in Table 9, Belgium, Denmark, and Finland have the most enabling electoral
institutions as a result of electoral laws instituting proportional representation that contributes to
the existence of large numbers of effective parties. Italy and Sweden also have fairly enabling
electoral institutions, while the Netherlands’ electoral institutions are highly enabling in the
1970s and less so in subsequent periods. Norway’s electoral institutional are also fairly enabling,
becoming more so in the 1990s. If economic conditions for reform are ripe, the effect of
enabling electoral institutions in these countries should be to facilitate such reforms. In contrast,
electoral institutions in Austria, France, and Germany are less enabling, so the adoption of
responsible social insurance policies in response to the financial pressures stemming from
globalization should be more difficult. Finally, the electoral institutions of Canada, the U.K., the
U.S., and to a lesser extent Japan are highly disabling, indicating that coordinated and
responsible policymaking is unlikely. Certainly, these four countries stand out as the most
66
economically liberal of the countries examined here. To the extent that right-wing parties
control government, they can and have adopted reforms of social welfare and insurance
programs. The disabling effects of these political institutions should be more evident during the
times that the left and secular center control government.
As I argued in Chapter III, strong social corporatism should also facilitate the adoption of
responsible economic and welfare policies aimed at restoring the competitiveness of a given
country’s industries. In addition to enabling electoral institutions, Denmark, Finland, Norway,
and Sweden all have strong social corporatist traditions (see Table 9). Social corporatism is also
fairly strong in Belgium and Austria, as well as The Netherlands until the late 1980s and Italy
until the 1990s. Finally, social corporatism is very weak in Canada, France, Japan, the U.K., the
U.S and (at this for the period under observation) Germany. This lack of social corporatist
bargaining, combined with the lack of enabling electoral institutions, renders these countries less
likely to adopt responsible economic and social policies that would contradict the short-term
interests of large numbers of recipients.
Disabling political institutions, represented by the presence of strong bicameralism and
federalism, are intended to provide divide policymaking authority among various branches of
government and inhibit policy change of any kind. The intent, therefore, is to protect the status
quo. As indicated in Table 9, these political institutions are most disabling in Germany, the U.S.
and to a lesser extent in Canada. These institutions are also fairly disabling in Belgium. In
contrast, the configuration of political institutions concentrates policymaking authority more so
in Austria and to a lesser extent in Italy, Japan, and the Netherlands. And finally, policymaking
authority is most concentrated in Denmark, Finland, France, Norway, Sweden, and the U.K.
Among this latter group of countries, those with enabling electoral institutions and strong social
corporatism should be most likely to adopt reforms of their social insurance programs in
response to economic imperatives to do so.
PREDICTIONS FOR REFORMS
The economic and political factors included in all of the figures and tables above that
should influence the incidence of reform are summarized in Table 14. In order to determine if
these economic trends and political variables were “very low,” “low,” “mid,” “high,” or “very
high,” I compared the average value for the entire period (e.g. average unemployment rate or
67
average value of social corporatism for 1973 to 1995) for a given country to the first quartile,
median, and third quartile for the entire group. Of course some judgment calls were needed,
based on peculiarities of the data. Nevertheless, these categorizations should provide useful
information for predicting reforms in each country. Values of “very low” or “low” for economic
trends indicate that financial pressures for reform should not be present. Conversely, values of
“high” and “very high” should indicate the presence of financial pressures. Values of “very low”
or “low” for Enabling Institutions and Social Corporatism indicate that institutions are not
enabling, so reforms are likely if financial pressures are present. Conversely, values of “high” or
“very high” for these variables indicate that lack of enabling institutions should inhibit reforms
even where financial pressures for reform are present. In contrast, high values for Disabling
Institutions should inhibit reforms, whereas low values should foster them.
Given their negative responses to globalization and the presence of enabling electoral
institutions, strong social corporatism, and concentration of policymaking authority, Denmark,
Finland, and Belgium should be the most likely of these countries to adopt significant reforms of
their social insurance programs. Sweden’s electoral institutions are not quite enabling, although
government authority is highly concentrated, and social corporatism is strong. Therefore,
Sweden is also likely to adopt fairly significant reforms. These predictions stands in stark
contrasts to the predictions put forth in virtually all of the literature examining the relationship
between trends in global market integration and the development of social welfare and insurance
policies.
The Netherlands has also experienced negative responses to globalization, as has Italy in
the 1990s. Both of these states have moderately enabling social and political institutions.
Government authority is slightly dispersed and social corporatism wanes from moderate to weak.
Still, given the importance that enabling political institutions should play, modest reforms of
social insurance policies in both countries are likely in these countries as well. However, they
should be more limited, or the adoption of such policies may be delayed when compared to the
countries with more enabling policymaking institutions, more concentrated authority, and
stronger social corporatism.
As indicated above, both Austria and France have experienced trade and investment
deficits, as well as high unemployment rates in recent years. Government authority is fairly
concentrated in Austria and social corporatism is strong. Additionally, government authority is
68

highly concentrated in France, although social corporatism is weak. However, electoral
institutions in Austria and France are weakly exclusive, making reforms of social insurance
programs more difficult than in the countries addressed above. As a result, reforms in Austria
and France should be fairly limited.
The U.K. experienced deficits in investment and investment, slowed economic growth,
and nearly a 100% increase in its unemployment in the 1970s. Canada experienced similar
trends in investment, unemployment, and growth, but not until the 1990s. Economic pressures to
reform social insurance programs should have been fairly strong for these two countries,
although at different times. However, given the lack of enabling electoral institutions or social
corporatist bargaining, combined with fairly decentralized policymaking authority, reforms in
Canada are unlikely. Policymaking authority is more concentrated in the U.K., but given the
lack of enabling electoral institutions and social corporatism, reforms are unlikely when other
than right-wing parties control government.
Finally, responses to globalization have been largely favorable in Norway, Germany,
Japan, and the United States. In addition, these latter three countries lack enabling electoral
institutions, social corporatism is weak, and policymaking authority is decentralized. So, even if
economic trends warranted reforms, they would likely be politically infeasible unless right-wing
parties enjoy popular mandates to reform these programs.
POLICY OUTCOMES
Trends in adjusted replacement rates for all four social insurance programs for each
country are presented in Figures 5 through 18. Instead of addressing each in detail, this section
compares policy outcomes to my predictions outlined above. The assessment as which each of
these countries has adopted significant, modest, or minimal reforms, is of course, open to
interpretation. The assessments below are based on the relative sizes of each of the programs,
the number of programs affected, and the size of the reductions in adjusted replacement rates for
benefits.
First, these programs differ considerably in the size of aggregate expenditures and the
rates of payroll contributions that fund them. Old age pensions constitute the largest social
insurance expenditures in all fourteen countries, increasing from an average of 6.1% of GDP for
all fourteen countries in 1980s to an average of 7.7% of GDP in 1995. Unemployment cash
69
benefits constitute the second largest amount of expenditures, from 1.4% of GDP in 1980 to a
high of 2.3% of GDP in 1993, falling to 1.9% of GDP by 1995. Expenditures on disability
benefits were, on average, nearly as large as expenditures on unemployment benefits; the
average for these countries grew from 1.5% of GDP in 1980 to 1.9% of GDP in 1995. Finally,
sickness benefits constitute by far the smallest expenditures, from around 0.8% and 0.9% of
GDP in the 1980s, and falling to between 0.6% and 0.7% of GDP in the early 1990s (OECD
sources). Therefore, reforms of old age pension benefits will constitute the most significant
reforms, followed by reforms of unemployment and disability pensions, and then by sickness
benefits. The number of programs reformed will also determine the extent to which reforms are
significant, modest, or minimal. In general, a country that has reformed all four programs will
certainly have adopted more significant reforms than a country that has reformed one or two
programs, particularly if old age pensions are not among them. Finally, the size of the reduction
in adjusted replacement rates (ARRs) is important. For example, a country in which ARRs for
old age pensions have ten percentage points or more will have adopted more significant reforms
than a country in which ARRs for old age pensions have dropped by smaller increments.
Reforms in most of these fourteen countries support my predictions. In most cases, the
combination of financial pressures on social insurance programs and enabling political
institutions produced reforms aimed at alleviating these financial pressures. It is important to
note that the countries whose reforms contradict my predictions do so because reforms were
more significant or widespread than I predicted based on the disabling nature of their political
institutions. In several of these countries economically liberal, right-wing parties control
government. That fact that right-wing parties adopted these reforms is certainly in line with their
values, and with the predictions of several scholars addressing the role of partisanship on welfare
state policy development. These results indicate that these right parties were able to adopt
reform despite the inability to avoid blame for these reforms. In that sense they contradict my
predictions.
What is more noteworthy is that the significant reforms in several of these countries with
inclusive political institutions, social corporatist bargaining, and left and Christian Democratic
parties controlling government do, indeed support my predictions. The bulk of the comparative
literature claims that reforms in most OECD countries have been very limited largely where
70
these domestic political factors all temper financial pressures for reform. The results presented
here, as well as the regression results that follow, largely contradict this popular view.
In order to assess the overall impact of reforms of these four programs across all fourteen
countries, I developed and index that multiplies the change in adjusted replacement rates times
the size of the program (in terms of GDP) in the year the change in ARRs first started. I added
each of the products for each of the four programs to arrive at the value of the index of reforms.
These fourteen countries vary in both the timing and direction of policy changes (i.e. increase or
decrease in ARRs). If the ARR for a given program increased throughout the period, I
subtracted the highest value from the lowest, producing a negative number that indicates the
absence of reform. If the value of ARRs decreased throughout the period, I subtracted the lowest
value from the highest, producing a positive number indicating substantial reform. If the values
of ARRs followed a curvilinear pattern, as they do in many cases, computing the index for
reform was not as straightforward.
ARRs for these benefits in many of the fourteen countries generally follow the pattern
that I predicted in Chapter III; they increase from the early 1970s to some point around the mid-
1980s or 1990s, then they decrease as a result of reforms. Yet the post-reform value of ARRs in
the 1990s might still be above the lowest value in the early 1970s. In order to capture the
incidence of reform of these programs, I subtracted from the highest ARR the value of the lowest
ARR following this high point. Conversely, a few countries adopted reforms that reduced ARRs
by the early 1980s, but then subsequent policy changes caused ARRs to increase once again. In
order to capture the nature of policy changes in these instances, I calculated the index of reform
in two different ways. For the first index I subtracted from value for ARRs in 1973 the lowest
value that followed (usually around the mid-1980s) producing a positive number indicating the
incidence of reform. For the second index I subtracted the value for ARRs in 1995 from the
lowest value preceding it, producing a negative number indicating the absence of reforms.
Adjusted replacement rates in ten of these fourteen countries generally follow one of the
first three patterns described above. As a result, the values of the two indices were very close, if
not identical. For the remaining four countries the values of the two indices differ, but not
enough to change their relative rankings, nor the general assessment of the extent to which they
reformed their social insurance programs.
71
Table 15 shows that reforms in most of the countries corresponded with the predictions
outlined above. Generally, enabling political institutions allowed policymakers to respond to
high rates of unemployment and economic growth that were in part due to trade and investment
deficits, social insurance policy reforms are substantial. Conversely, where economic trends
made reforms necessary but political institutions rendered them difficult to adopt, reforms were
more modest. And finally, where economic trends made reforms unnecessary, they are either
modest or non-existent.
Significant or widespread reforms were adopted in the Netherlands and Denmark, and to
a lesser extent Germany and Belgium. Based on economic trends and political institutions in
Denmark and Belgium, I predicted significant reforms in these two countries. I also predicted
fairly significant reforms in the Netherlands due largely enabling political institutions. However,
the results for Germany contradict my prediction. Germany’s unemployment rate hovers around
seven percent, which is higher than, for example, the U.S. and Japan, but lower than many
European countries. In contrast, its total employer contributions are significantly lower than
only Italy and Sweden. Still, given its disabling political institutions, these substantial reforms
are surprising.
Reforms were also prevalent in Japan, Sweden, and to a lesser extent the United
Kingdom. I predicted fairly significant reforms in Sweden, based on economic trends and
enabling political institutions. However, by focusing on only the interactions of trends in
globalization and political institutions and putting aside the influence of domestic demographic
and economic trends, as well as partisanship, I predicted only moderate reforms in the U.K. and
no reforms in Japan. The scale of Japan’s overall reforms is driven almost entirely by reductions
in adjusted replacement rates for old age and disability pensions. Japan experienced a rapid and
substantial increase in the proportion of the elderly population in the 1970s and 1980s, placing
significant financial pressures on its pension programs. Despite its disabling political
institutions, Japan’s right-wing Liberal government was able to adopt reforms to ease these
financial pressures. When Prime Minister Thatcher took office in the U.K., unemployment and
growth rates were modest and total employer contributions were lower than in any other
European country except Denmark. Therefore, it does not appear that reforms were financially
motivated. Instead, the ideological motivation behind Thatcher’s reforms is well documented in
the literature. Despite the fact that the U.K.’s institutions made it impossible for Thatcher or the
72
MPs to avoid blame for these reforms, they instituted them without any political backlash – at
least not for many years.
As indicated in Table 15, Austria, Finland, Canada, France, and Italy all instituted modest
overall reforms of their social insurance programs. The results for Austria and France are right
in line with my predictions. Finland’s economy has suffered in the 1990s and its political
institutions are highly enabling. Therefore, I anticipated very significant reforms in the 1990s,
but the reforms were modest. I also predicted reforms in Italy to be more prevalent than they
turned out to be. Conversely, based on its disabling institutions, I expected reforms in Canada to
be more slightly more modest than the value in Table 15 indicate. But the specific trends in
adjusted replacement rates in Figure 7 for Canada are enlightening. The overall value of the
index of reforms for Canada is driven almost entirely by reduction in unemployment insurance
benefits. ARRs for old age, disability, and sickness benefits have been constant for several
years. Therefore, the scope of reforms in Canada is actually very limited.
The policy outcomes in a few of these countries either contradicted or at least did not
fully realize my predictions. However, most of my predictions made based on my central
arguments presented in Chapter III applied to the economic trends presented in this chapter are
support by the results outlined above. Two very significant results bear repeating. First, reforms
in Denmark and Belgium are widespread, and reforms in Sweden have been substantial. Norway
did not reform its programs, but also lacked the economic imperative to do so. Two contributing
groups of factors led to these reforms. First, Denmark and Sweden incurred fairly large
investment deficits in the 1980s, Denmark incurred substantial trade deficits in the 1980s,
economic growth rates were very low for one or more five-year periods, and unemployment rates
rose sharply above levels observable in the 1970s. Additionally, Belgium experienced high
unemployment and slow economic growth in the late 1980s and 1990s. Sweden has experienced
high unemployment and slow economic growth in recent years and has among the highest rates
of total payroll contributions of all fourteen countries. Given these negative economic trends,
purely financial incentives to reform these social insurance programs should have been strong.
The second factor that led to these reforms was the configuration of social and political
institutions that encouraged social corporatist bargaining, enabled policymakers through their
electoral rules, and concentrated policymaking authority. All these factors encourage
responsible policymaking that provides for the adoption of reforms aimed at controlling costs
73

and restoring competitiveness, even when doing so is contrary to the short-term interests of many
constituents. Again, my arguments as to the effects that these institutions should have on
facilitating the adoption of reforms runs contrary to the bulk of the scholarly research on the
subject. Further, these results for Denmark and Sweden, while contradicting the dominant
arguments in the literature, largely support my arguments presented in Chapter III.
The second significant result presented above included policy responses in both Canada
and the United States. These two countries produced fairly different economic trends during this
period. The U.S. responded generally favorably to globalization, so economic pressures to
reform social insurance programs should have been weak. In contrast, Canada incurred large
investment deficits, very high rates of unemployment, and very low rates of growth in the 1990s.
Therefore, economic pressures to reform programs in Canada should have been strong in the
1990s. These two countries are similar in that their social and political institutional
arrangements discourage social corporatist bargaining, electoral rules discourage inclusive
policymaking (i.e. they lack enabling features), and policymaking authority is highly
decentralized. As a result, these countries lack institutions that would encourage responsible
policymaking that might contradict the short-term interests of constituents in order to secure
broader long-term economic goals. Of course these disabling institutions are more relevant for
Canada, given its economic hardships, than the U.S. Nevertheless, the policy outcomes in both
countries are similar. Cost-saving reforms in both countries are modest at best, and in fact
adjusted replacement rates for pensions – by far the costliest of all social insurance programs –
increased in both countries just as most other countries examined here were reducing adjusted
replacement rates. These outcomes again lend support to my predictions based on my central
arguments presented in Chapter III, and contradict the bulk of the comparative literature that
claims that these same political institutions should lead to less generous social welfare and
insurance expenditures.
REGRESSION RESULTS
I now turn my attention to the results of my regression analysis, which will show that
several of the relationships I addressed above are statistically significant, lending further support
to my hypotheses. The coefficients for many of the variables included in the regression
equations for long-term unemployment benefits were statistically significant, but so small as to
74
render them substantively insignificant. Therefore, although I presented trends in ARRs for
these benefits in Figures 5 through 18 above, I exclude them from my discussion of the
regression analysis that follows.
The curvilinear relationship that should exist between trends in global market integration
and net replacement rates for these social insurance programs should result from two separate
effects. First, financial pressures that these economic trends may cause will produce pressures to
reform these social insurance programs independent of the effects of domestic political
institutions and partisan preferences. Policymakers may respond affirmatively to calls for
increased benefits from those workers dislocated by these trends in globalization to a certain
point. However, as revenues from payroll contributions that finance these benefits fail to keep
pace with increasing demands for these benefits, policymakers may be forced to reform these
programs in efforts to curb aggregate expenditures. Second, where either political institutions
create incentives to adopt responsible legislation aimed at increasing demand for labor and
encouraging growth, or where parties in power are committed to fostering full employment,
these political incentives may mitigate or even counter popular calls for increased benefits that
may threaten employment and growth.
The regressions below were run using pooled cross-sectional and time series data (or
panel data) including observations from the fourteen countries included in this study, for odd
years from 1973 to 1995. The regressions were run with country dummies to control for fixed
effects, as well as with lagged dependent variables. Because I include the lagged value of the
dependent variables in these regressions, observations from 1973 were actually dropped and only
odd years 1975 through 1995 are included. Therefore, a total of eleven years and fourteen
countries are included in each regression, for a total of 154 observations. As the United States
has no national sickness benefits program, the U.S. is excluded from the analysis for sickness
benefits, so this regression has only 143 pooled observations.
The adjusted replacement rates for benefits are comprised of replacement rates and
eligibility criteria in effect as of January 1st of each year. For reforms to be captured in this
measure, they would have to be adopted in the previous year. Therefore, I lagged the political
institutional and partisan variables by one year. The influence of economic variables on social
insurance reforms will be less direct. Policymakers adopting a reform that becomes effective in
year T must adopt such reform in year T-1 at the latest. If financial pressures provide the
75
incentives for such reforms, then the lag between the onset of financial pressures and the
adoption of these reforms would be even greater. Therefore, the most recent economic data
including in the regressions are from T-2. Short-term fluctuations in trade and investment would
affect unemployment and growth rates, but these latter economic trends are unlikely to prompt
social insurance reforms. As I expect policymakers to adopt such reforms only after high
unemployment rates and low economic growth rates have persisted for some time, I chose to
smooth these fluctuations in trade and investment by creating moving averages. For each year
included I created a moving average for exports as a percentage of total trade, outward FDI as a
percentage of total FDI, and employer contributions, using the values in years T-2, T-3, and T-4.
This smoothing prevents such short-term fluctuations to otherwise influence the regression
results, as in reality they are unlikely to influence long-term unemployment rates or policy
reforms. Data on the proportion of the population employed in services, female participation in
labor force participation, and the proportion of the population over 65 do not fluctuate, though
these figures have grown incrementally each year. Therefore, I use only lagged values of these
measures, rather than lagged moving averages.
In sum, in the analysis that follows I regress adjusted replacement rates on lagged
adjusted replacement rates, employer payroll tax rates the percentage of the workforces in
services, the ratio of outward FDI to total FDI, and the ratio of imports to total trade, as well as
squared terms for each of these economic variables. Further, I include my measures of enabling
institutions, disabling institutions, social corporatism, as well as the proportion of cabinet
occupied by left, Christian Democratic, and secular center parties. Finally, I include interactions
between all of the economic and political variables.
To simplify this discussion, I refer to the ratio of outward FDI to total FDI as investment
deficits, and the ratio of imports to total trade as trade deficits. In fact, only values of these two
ratios above .50 represent deficits. But the relationships between these trends and reforms of
social insurance programs should be strongest when deficits do occur, and the labels will
simplify the discussion that follows. The regressions included here include squared terms for
trade and investment deficits, as well as the ratio of the population employed in services,
Iversen’s (1998) measure for deindustrialization.
Where the coefficient for either trade or investment deficits are positive and statistically
significant and the coefficient for the squared term for that variable is negative and statistically
76

significant, these results would indicate the curvilinear relationship between these economic
trends and net replacement rates that I predict are indeed present. The same results for the
interactions of these economic trends and the political variables I include would indicate that
these political variables magnify this curvilinear relationship, which would give further support
to my arguments in Chapter III.
Several scholars have denied that recent reforms of social welfare and insurance
programs are the result of fiscal crises stemming waning competitiveness in the face of global
market openness. Instead, these scholars claim that domestic developments such as the shift
from manufacturing to less productive services, as well as maturing populations, are responsible
for the fiscal pressures that have led to reforms. The results below will show that the relationship
between negative responses to global market openness and reforms of social insurance programs
is statistically significant independent of these domestic developments. Therefore, I first
dispense with the results for these domestic trends. The coefficients for Services are positive,
while the coefficient for Services-squared is negative, for unemployment cash benefits, disability
pensions, and sickness cash benefits. These results indicate that the effect of the shift towards
services is similar to my argued effects of global market integration for those countries that
respond negatively to this integration. Holding all else constant, the effect of shifts towards
services on adjusted replacement rates (ARRs) for these three programs is curvilinear; ARRs
initially rise in response to increases in the proportion of the population employed in services,
but then fall after a critical point is reached. Generally, when adjusted replacement rates rise up
to the point at which the proportion of the population employed in services reaches roughly 60%
for unemployment and sickness benefits, and 55% for disability benefits, and then fall as the
proportion of the population employed services rises above these points. The proportion of the
population employed in services exceeded 60% in most of these fourteen countries by the early
1980, and in all of these countries by 1990. According to these results, then, deindustrialization
is indeed associated with reductions in benefits for these three programs presented above.
As shown in Tables 17 and 18, the coefficients for the proportion of the population over
age 65 – Elderly – are negative, indicating essentially that increases in the number of retirees is
associated with decreases in adjusted replacement rates for both old age and disability pensions.
These results contradict central arguments of power resource theory, which would predict that
growing numbers of retirees would exercise increasing influence on the policymaking process
77
and secure more generous benefits for themselves. In contrast, while this relationship is
unrelated to globalization, it is related to my central argument that financial pressures on these
social insurance programs should suffice to prompt reforms of social insurance benefits even
though these programs enjoy popular support.
Independent Effects of Trends in Globalization
I included all of the economic and political variable specified above in each of the four
regression equations. But for some programs none of these variables were significant, whether
on their own or interacted with other variables. This was the case for the measure of social
corporatism. While these variables were included in the regressions, they were excluded from
the results in the figures below in order to simplify the presentation of the regression output. The
full regression results are included Tables 3 through 6 in the Appendix. The independent effects
of trends in globalization on reforms of social insurance programs are limited to old age and
disability pensions. For these programs, the coefficients for trade deficits are positive, while the
coefficients for the squared values of these variables are negative, and all are statistically
significant. These results indicate that, independent of the either contravening or reinforcing
effects of the political variables included in these regressions, the relationships between these
trends in globalization and old age and disability pension benefits are curvilinear. All else being
equal, increases in net investment deficits are associated with increase in old age pension ARRs
until outward FDI reaches 60% of total investment, at which point ARRs decline. Similarly,
increases in trade deficits are associated with increases in ARRs until the point at which imports
constitute about 52% of total trade, at which point ARRs decline. As indicated in Tables 3 and
6, these levels of trade and investment deficits were common among the fourteen countries
included here, especially in the 1980s and early 1990s. These results indicate that the curvilinear
relationship between these economic trends and reforms of old age and disability pension
benefits for many of these countries that are presented above are statistically significant.
Interactive Effects of Political Institutions
The coefficients for trade deficits interacted with enabling political institutions presented
in Table 15 indicate that the interactive effects of these variables on adjusted replacement rates
for short-term unemployment benefits are curvilinear. Increases in imports relative to exports in
78
states with enabling political institutions are associated with increases in ARRs for
unemployment benefits until the ratio of imports to total trade reaches 50% and trade deficits are
incurred. Beyond that point, further increases in imports are associated with reductions in
unemployment benefits. The coefficients for the interactive effects of trade deficits and
institutional variables are not statistically significant for the remaining three programs.
However, the interactive effects of trade deficits with partisan variables are statistically
significant. These results are discussed below, following the discussion of the interactive effects
of trade deficits with institutional political variables.
The interactive effects of rising outward FDI relative to total volumes of FDI with each
of the three types of institutional variables are statistically significant for several of these social
insurance programs. Table 19 shows that for sickness cash benefits, the relationship between the
interaction of investment deficits and enabling institutions on the one hand, and ARRs is
curvilinear. Where electoral institutions are inclusive, increases in outward FDI relative to
inward FDI are associated with increases in adjusted replacement rates until the point at which
outward FDI reaches roughly 66% of total FDI. Increases in net investment deficits beyond this
point are associated with decreases in ARRs for sickness benefits.
The relationship shown in Table 18 between the interaction of investment deficits and
disabling political institutions on the one hand, and ARRs for disability pensions on the other
would seem to logically follow from these argument. The coefficients indicate that in those
states where disabling institutions are lacking (i.e. policymaking authority is concentrated) the
relationship between trade deficits and ARRs for disability pension benefits is also curvilinear.
Table 16 shows that the relationship between the interaction of investment deficits and
disabling political institutions on the one hand and short-term unemployment cash benefits on
the other also indicate a curvilinear relationship, but these results do not support my hypotheses.
Generally speaking, in states with institutions that decentralize policymaking authority or lack
social corporatist bargaining, increases in outward FDI are associated with increases in adjusted
replacement rates for unemployment benefits to a point, beyond which these replacement rates
decrease. Given the extent to which these institutional configurations should discourage
coordinated, responsible policymaking, these relationships are unexpected.
In Table 17 the coefficients for the relationship between the interaction of investment
deficits and enabling political institutions and ARRs for old age pensions also shows a
79
relationship that is predominantly negative. However, at very high levels of investment deficits,
this relationship but becomes weakly positive (producing a slight curvilinear relationship).
While this result does not support my predictions about the initially positive relationship between
dislocating effects of globalization and reforms of social insurance programs, it also seems to
contradict the bulk of the literature that would claim that trade deficits leading to dislocation of
workers should lead to increases in social insurance benefits.
Employer contributions of course are independent of trends in globalization. However,
they are related to globalization in that increases in employer contributions may render domestic
industries less competitive in international markets because these contributions increase the cost
of production and decrease profits. The coefficient for employer contributions alone is
statistically significant only for short-term unemployment benefits, but the result support my
central claims. The negative coefficient indicates that increases in employer contributions are
associated with decreases in ARRs for short-term unemployment benefits. This relationship is
magnified by the interaction between employer contributions and social corporatism for
unemployment cash benefits.
Interactive Effects of Partisanship
These regression equations include coefficients for the independent effects of government
partisanship, but only the coefficient for secular center parties is statistically significant for old
age pensions, while the coefficients for secular center, left, and Christian Democratic parties are
significant for disability pensions. These coefficients are not surprising; they indicate that,
independent of trends in globalization – and by extension, trends in unemployment and growth –
adjusted replacement rates these pension benefits are higher where these parties control
government than where right-wing parties control government.
The relationship between total employer payroll contributions and unemployment
benefits is negative, and this relationship is reinforced by the presence of strong social
corporatist bargaining. However, this relationship is countered by the interaction of employer
contributions and the incumbency secular center parties, and in countries in which social
corporatism is weak, the negative effect of increases in employer contributions may be
completely offset. While the coefficients for total employer payroll contributions is not
statistically significant for the other programs, the interactive effect of employer payroll
80

contributions with secular center parties is positive and statistically significant for old age
pensions, and positive and statistically significant for disability pensions. These results indicate
that the downward pressure on net replacement rates that employer contributions create are
strongest when right wing parties control government, and are mitigated when parties center or
left parties. These results support the wealth of literature arguing the tendency of left and even
center parties to favor social welfare and insurance benefits more so than right parties.
In contrast to the relationship between the interactive effect of left and center parties and
payroll taxes on ARRs for three of these programs, the relationship between the interaction of
these parties and trends in globalization on ARRs is quite different. The coefficients for
investment and trade deficits interacted with left and secular center parties indicate that the
effects of these interactions on ARRs for old age pensions and disability pensions are negative.
(The coefficients for the squared terms of trade deficits are positive, but the based on the size of
the coefficients, these relationships would only become weakly negative at values of trade
deficits of 0.52, 0.53 or higher.) As indicated in Table 3, deficits this large were rare, especially
after the 1970s. Where center or left parties occupy government cabinets, the effect of rising
trade or investment deficits is to push down adjusted replacement rates for these benefits. These
results seem to counter the literature arguing that these parties should increase social insurance
benefit above the levels that right-wing parties do. While I reserve my discussion of proposed
effects of partisanship for the next chapter, these results deserve note. Again, contrary to the
predictions of much of the literature, the influence of left and center parties on adjusted
replacement rates for social insurance benefits when trends in globalization should produce
financial pressures on these programs is to reduce benefits.
The results presented above indicate that several of the relationships between
globalization and social insurance policy reforms implied by the predictions and policy outcomes
presented here are statistically significant. These results lend considerable support to my
hypotheses presented in Chapter III. These results also contradict the arguments put forth in the
literature about the effects that state institutions and parties should have on policies responses
when financial pressures for reform are present. However, based on the enabling effects of the
institutions, these outcomes are to be expected. Of course there is considerable variation across
these fourteen countries both in the timing of their reforms (e.g. the extent to which policy
responses following the onset of financial pressures with either immediate or delayed) and the
81
types of reforms adopted (e.g. cutting gross replacement rates versus tightening eligibility
criteria, or cutting benefits for universal pensions or more targeted unemployment benefits).
These differences, and the extent to which partisanship of government affect these differences,
are presented in Chapter V.
As discussed throughout Chapters I through III, several scholars have claimed that
exposure resulting from trade openness (expressed as total trade as shares of GDP) puts workers
at risk of dislocation, and therefore should be associated with pressures for greater social welfare
and insurance expenditures. Conversely, some sholars argue that geater capital market openness
(often expressed as the ratio of inward and outward FDI to GDP) gives owners of capital an exit
option and should therefore be associated with reforms of social welfare and insurance programs.
I have argued that directions of trade and investment, and not levels of openness, should affect
unemployment and economic growth, and should therefore be associated with changes in social
insurance legislation. The results presented above to support my claims. To test alternative
claims about the influence of openness, I ran regressions for these social insurance programs
with all of the same independent variables, substituting measures of trade and investment
openness for my original measures of imports as a percentage of total trade and outward FDI as a
percentage of total FDI and omitting any squared terms. These results are presented in Tables A-
7 through A-10 in the Appendix. For unemployment benefits, the coefficient for Trade
Openness is positive and statistically significant, but is entirely offset when interacted with either
Left or Secular Center parties (Table A-7). The results for the other three programs are weak and
really inconclusive.
As an additional test of alternatives to my arguments, I ran another set of regressions that
duplicate my originals, except omitting the squared terms for the economic variables. These
regressions therefore tested for linear relationships – either posititive or negative – between
economic trends and reforms of social insurance programs. The results, are presented in Tables
A-11 through A-14 in the Appendix. Table A-11 shows that the coefficient for Imports as a
Percentage of Total Trade is negative and statistically significant, but neither trade nor
investment are statistically significant for any of the other programs. These results give greater
support my original findings, which showed that direction, and not just volumes, of trade and
investment has an impact on social and insurance programs, and there is support for the claim
that relationship between these trends and social insurance programs is curvilinear.
82
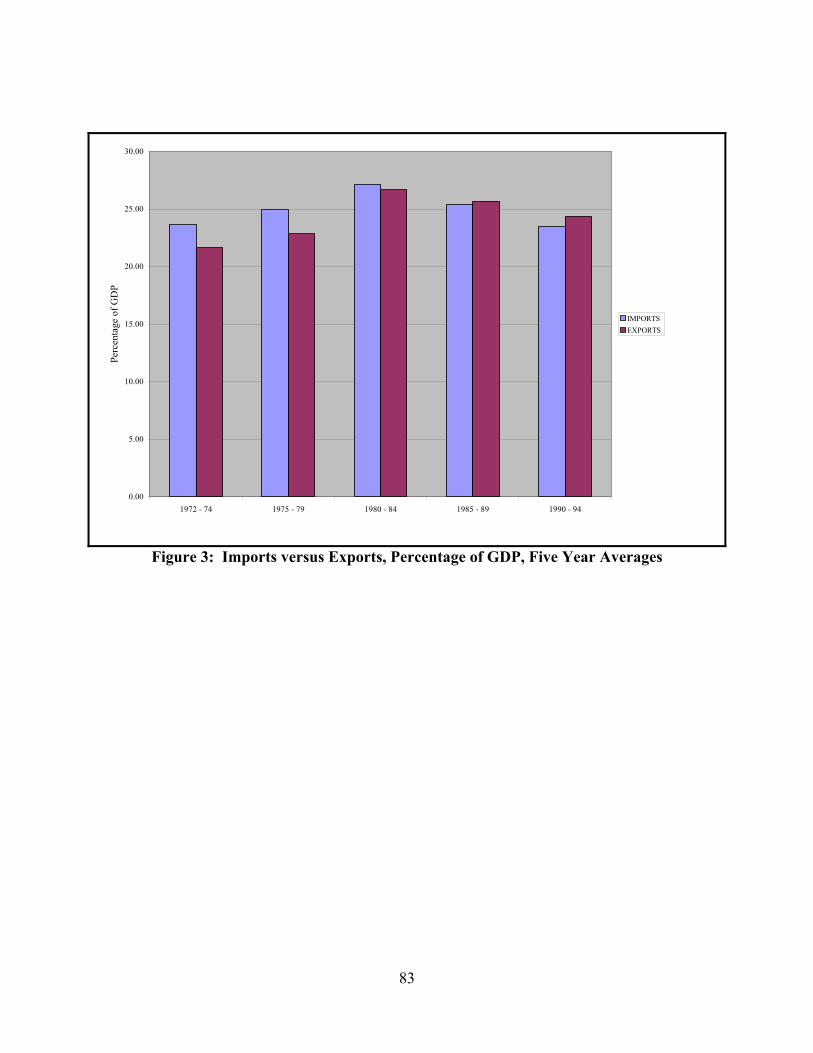
0.00
5.00
10.00
15.00
20.00
25.00
30.00
1972 - 74 1975 - 79 1980 - 84 1985 - 89 1990 - 94
Perc
enta
ge o
f GD
P
IMPORTSEXPORTS
Figure 3: Imports versus Exports, Percentage of GDP, Five Year Averages
83
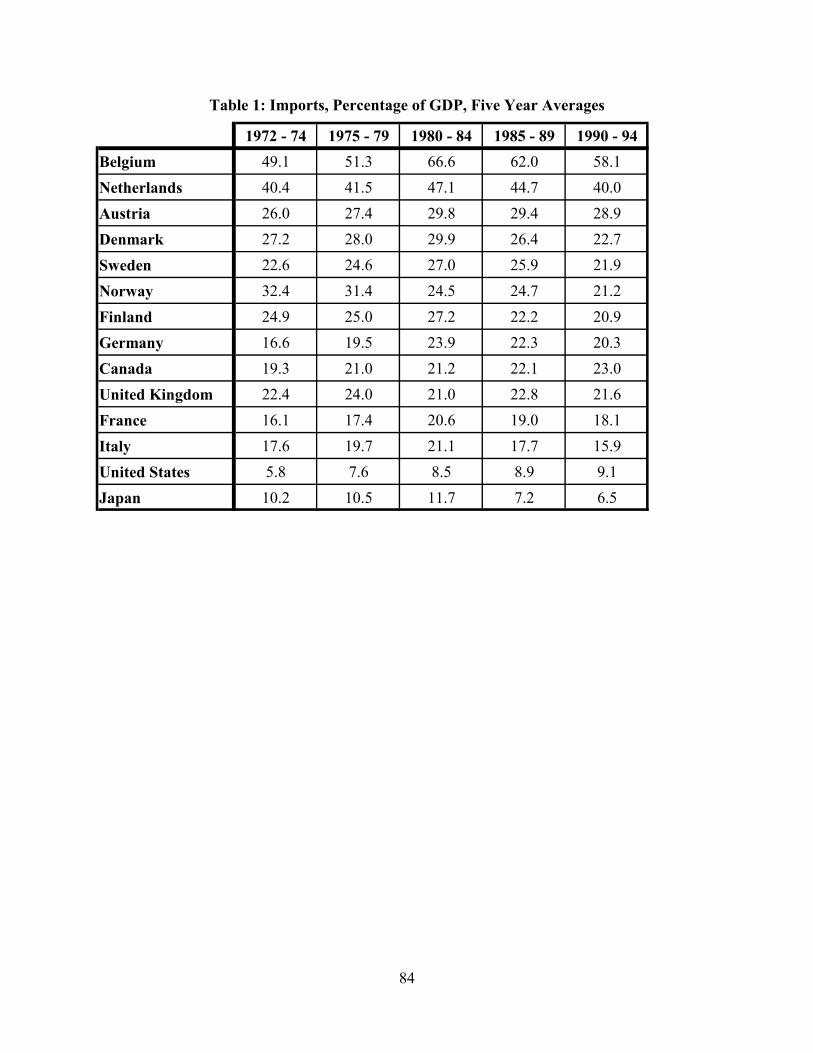
Table 1: Imports, Percentage of GDP, Five Year Averages
1972 - 74 1975 - 79 1980 - 84 1985 - 89 1990 - 94Belgium 49.1 51.3 66.6 62.0 58.1Netherlands 40.4 41.5 47.1 44.7 40.0Austria 26.0 27.4 29.8 29.4 28.9Denmark 27.2 28.0 29.9 26.4 22.7Sweden 22.6 24.6 27.0 25.9 21.9Norway 32.4 31.4 24.5 24.7 21.2Finland 24.9 25.0 27.2 22.2 20.9Germany 16.6 19.5 23.9 22.3 20.3Canada 19.3 21.0 21.2 22.1 23.0United Kingdom 22.4 24.0 21.0 22.8 21.6France 16.1 17.4 20.6 19.0 18.1Italy 17.6 19.7 21.1 17.7 15.9United States 5.8 7.6 8.5 8.9 9.1Japan 10.2 10.5 11.7 7.2 6.5
84

Table 2: Exports, Percentage of GDP, Five Year Averages
1972 - 74 1975 - 79 1980 - 84 1985 - 89 1990 - 94Belgium 49.0 47.7 60.9 61.6 55.6Netherlands 39.1 39.7 48.7 46.5 43.3Sweden 23.8 25.4 30.7 30.6 24.8Norway 24.3 24.6 29.7 26.0 28.0Denmark 22.2 22.0 27.8 26.1 26.0Germany 20.4 22.5 26.1 27.9 22.4Finland 21.5 23.2 26.7 22.6 24.0Canada 20.7 21.8 24.6 23.9 24.3Austria 19.8 20.5 23.0 24.6 23.8United Kingdom 17.5 20.6 19.8 19.1 18.9France 15.0 16.4 18.2 17.8 17.7Italy 14.4 18.2 17.8 16.3 16.1Japan 10.2 11.0 12.7 10.4 9.0United States 5.3 6.5 6.7 5.7 7.1
85
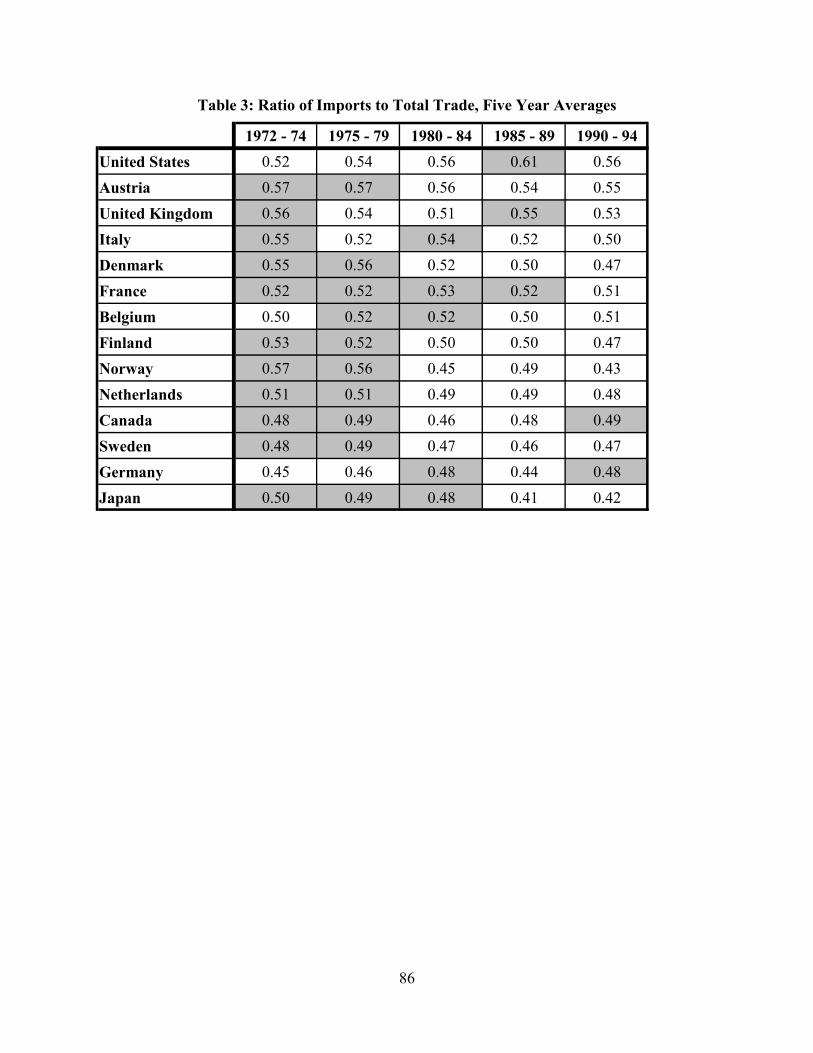
Table 3: Ratio of Imports to Total Trade, Five Year Averages
1972 - 74 1975 - 79 1980 - 84 1985 - 89 1990 - 94United States 0.52 0.54 0.56 0.61 0.56Austria 0.57 0.57 0.56 0.54 0.55United Kingdom 0.56 0.54 0.51 0.55 0.53Italy 0.55 0.52 0.54 0.52 0.50Denmark 0.55 0.56 0.52 0.50 0.47France 0.52 0.52 0.53 0.52 0.51Belgium 0.50 0.52 0.52 0.50 0.51Finland 0.53 0.52 0.50 0.50 0.47Norway 0.57 0.56 0.45 0.49 0.43Netherlands 0.51 0.51 0.49 0.49 0.48Canada 0.48 0.49 0.46 0.48 0.49Sweden 0.48 0.49 0.47 0.46 0.47Germany 0.45 0.46 0.48 0.44 0.48Japan 0.50 0.49 0.48 0.41 0.42
86

0.00
0.00
0.00
0.01
0.01
0.01
0.01
0.01
0.02
0.02
0.02
1972 - 74 1975 - 79 1980 - 84 1985 - 89 1990 - 94
Perc
enta
ge o
f GD
P
Inward FDIOutward FDI
Figure 4: Inward versus Outward Foreign Direct Investment, Five Year Averages for Fourteen Countries
87
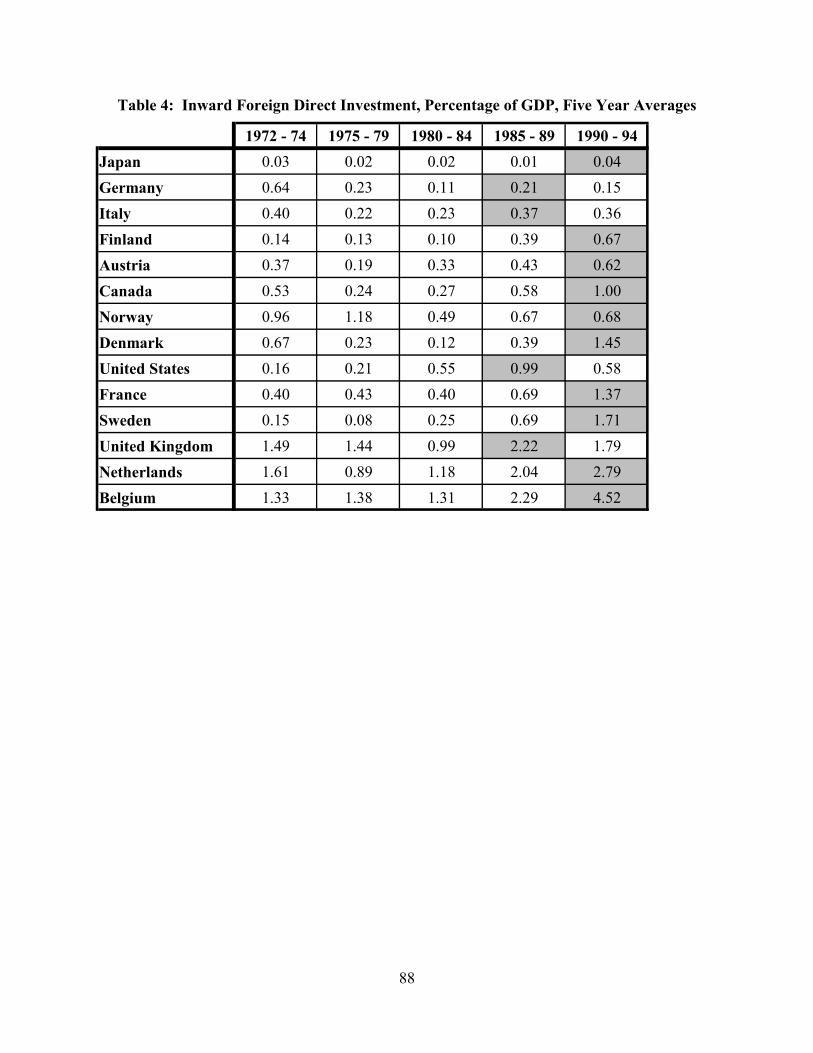
Table 4: Inward Foreign Direct Investment, Percentage of GDP, Five Year Averages
1972 - 74 1975 - 79 1980 - 84 1985 - 89 1990 - 94Japan 0.03 0.02 0.02 0.01 0.04Germany 0.64 0.23 0.11 0.21 0.15Italy 0.40 0.22 0.23 0.37 0.36Finland 0.14 0.13 0.10 0.39 0.67Austria 0.37 0.19 0.33 0.43 0.62Canada 0.53 0.24 0.27 0.58 1.00Norway 0.96 1.18 0.49 0.67 0.68Denmark 0.67 0.23 0.12 0.39 1.45United States 0.16 0.21 0.55 0.99 0.58France 0.40 0.43 0.40 0.69 1.37Sweden 0.15 0.08 0.25 0.69 1.71United Kingdom 1.49 1.44 0.99 2.22 1.79Netherlands 1.61 0.89 1.18 2.04 2.79Belgium 1.33 1.38 1.31 2.29 4.52
88
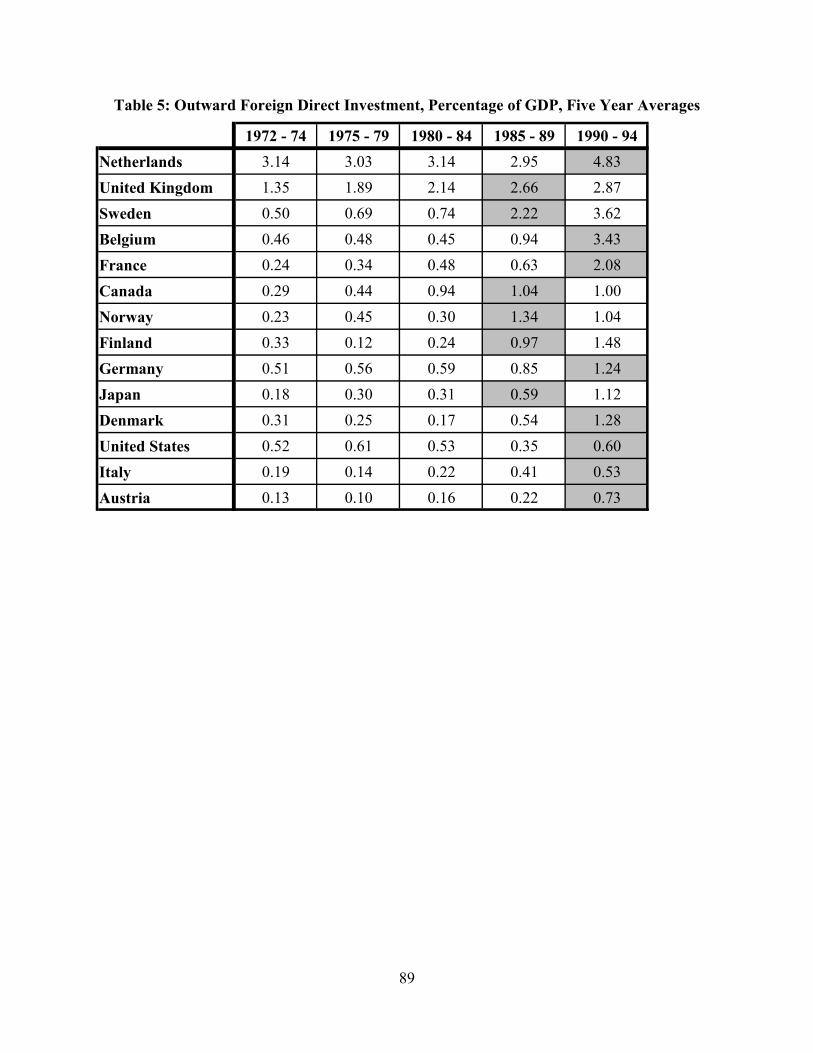
Table 5: Outward Foreign Direct Investment, Percentage of GDP, Five Year Averages
1972 - 74 1975 - 79 1980 - 84 1985 - 89 1990 - 94Netherlands 3.14 3.03 3.14 2.95 4.83United Kingdom 1.35 1.89 2.14 2.66 2.87Sweden 0.50 0.69 0.74 2.22 3.62Belgium 0.46 0.48 0.45 0.94 3.43France 0.24 0.34 0.48 0.63 2.08Canada 0.29 0.44 0.94 1.04 1.00Norway 0.23 0.45 0.30 1.34 1.04Finland 0.33 0.12 0.24 0.97 1.48Germany 0.51 0.56 0.59 0.85 1.24Japan 0.18 0.30 0.31 0.59 1.12Denmark 0.31 0.25 0.17 0.54 1.28United States 0.52 0.61 0.53 0.35 0.60Italy 0.19 0.14 0.22 0.41 0.53Austria 0.13 0.10 0.16 0.22 0.73
89

Table 6: Ratio of Outward Foreign Direct Investment to Total Foreign Direct Investment, Five Year Averages
1972 - 74 1975 - 79 1980 - 84 1985 - 89 1990 - 94Japan 0.91 0.95 0.93 0.98 0.95Germany 0.49 0.72 0.85 0.85 0.88Sweden 0.81 0.89 0.80 0.83 0.65Finland 0.54 0.54 0.82 0.79 0.50Canada 0.46 0.76 0.83 0.71 0.52Netherlands 0.69 0.77 0.73 0.63 0.63Denmark 0.35 0.49 0.68 0.73 0.54United Kingdom 0.59 0.57 0.69 0.63 0.57Norway 0.25 0.23 0.59 0.73 0.52Italy 0.26 0.42 0.59 0.59 0.66France 0.41 0.46 0.55 0.60 0.61Austria 0.21 0.36 0.37 0.40 0.59United States 0.75 0.78 0.30 0.33 0.58Belgium 0.24 0.32 0.17 0.48 0.36
90
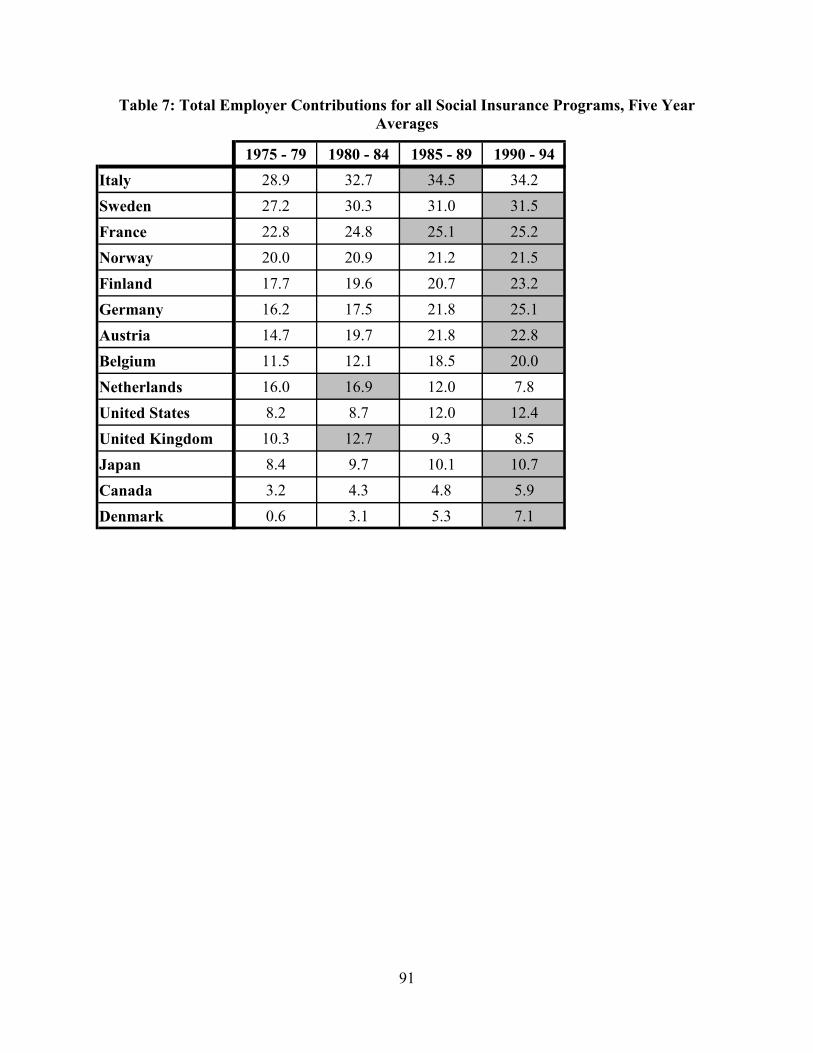
Table 7: Total Employer Contributions for all Social Insurance Programs, Five Year Averages
1975 - 79 1980 - 84 1985 - 89 1990 - 94Italy 28.9 32.7 34.5 34.2Sweden 27.2 30.3 31.0 31.5France 22.8 24.8 25.1 25.2Norway 20.0 20.9 21.2 21.5Finland 17.7 19.6 20.7 23.2Germany 16.2 17.5 21.8 25.1Austria 14.7 19.7 21.8 22.8Belgium 11.5 12.1 18.5 20.0Netherlands 16.0 16.9 12.0 7.8United States 8.2 8.7 12.0 12.4United Kingdom 10.3 12.7 9.3 8.5Japan 8.4 9.7 10.1 10.7Canada 3.2 4.3 4.8 5.9Denmark 0.6 3.1 5.3 7.1
91
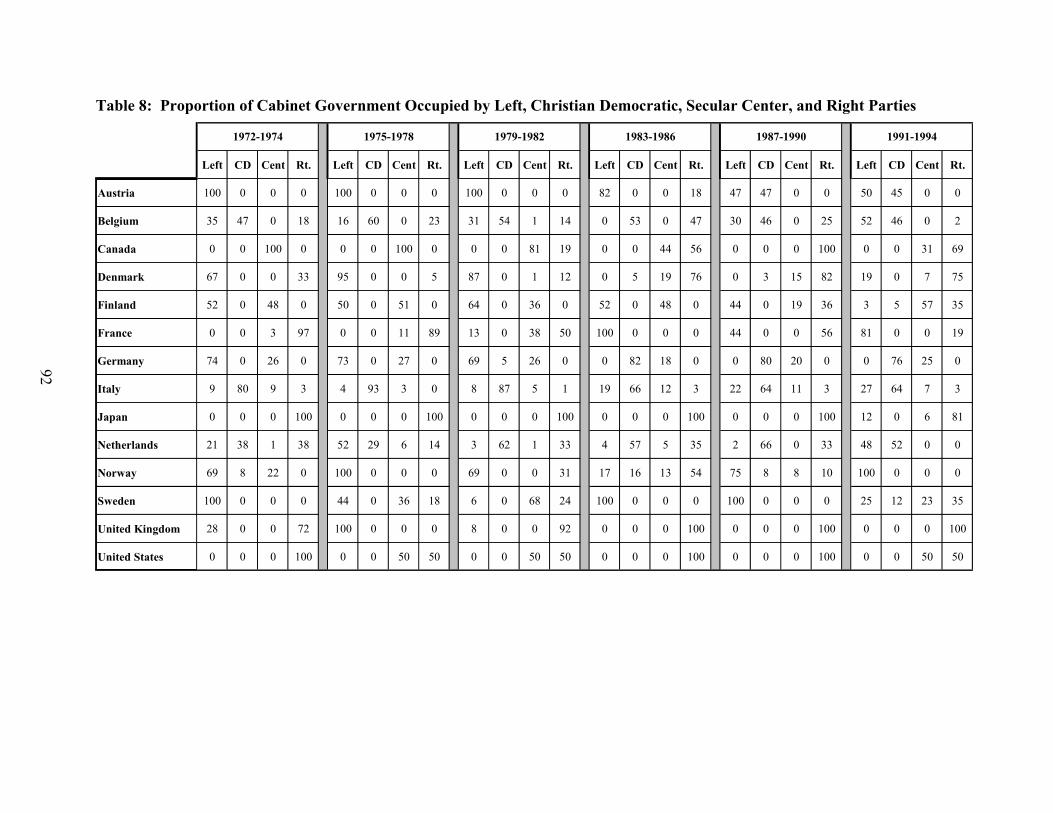
Table 8: Proportion of Cabinet Government Occupied by Left, Christian Democratic, Secular Center, and Right Parties
Left CD Cent Rt. Left CD Cent Rt. Left CD Cent Rt. Left CD Cent Rt. Left CD Cent Rt. Left CD Cent Rt.
Austria 100 0 0 0 100 0 0 0 100 0 0 0 82 0 0 18 47 47 0 0 50 45 0 0
Belgium 35 47 0 18 16 60 0 23 31 54 1 14 0 53 0 47 30 46 0 25 52 46 0 2
Canada 0 0 100 0 0 0 100 0 0 0 81 19 0 0 44 56 0 0 0 100 0 0 31 69
Denmark 67 0 0 33 95 0 0 5 87 0 1 12 0 5 19 76 0 3 15 82 19 0 7 75
Finland 52 0 48 0 50 0 51 0 64 0 36 0 52 0 48 0 44 0 19 36 3 5 57 35
France 0 0 3 97 0 0 11 89 13 0 38 50 100 0 0 0 44 0 0 56 81 0 0 19
Germany 74 0 26 0 73 0 27 0 69 5 26 0 0 82 18 0 0 80 20 0 0 76 25 0
Italy 9 80 9 3 4 93 3 0 8 87 5 1 19 66 12 3 22 64 11 3 27 64 7 3
Japan 0 0 0 100 0 0 0 100 0 0 0 100 0 0 0 100 0 0 0 100 12 0 6 81
Netherlands 21 38 1 38 52 29 6 14 3 62 1 33 4 57 5 35 2 66 0 33 48 52 0 0
Norway 69 8 22 0 100 0 0 0 69 0 0 31 17 16 13 54 75 8 8 10 100 0 0 0
Sweden 100 0 0 0 44 0 36 18 6 0 68 24 100 0 0 0 100 0 0 0 25 12 23 35
United Kingdom 28 0 0 72 100 0 0 0 8 0 0 92 0 0 0 100 0 0 0 100 0 0 0 100
United States 0 0 0 100 0 0 50 50 0 0 50 50 0 0 0 100 0 0 0 100 0 0 50 50
1972-1974 1983-1986 1987-1990 1991-19941975-1978 1979-1982
92
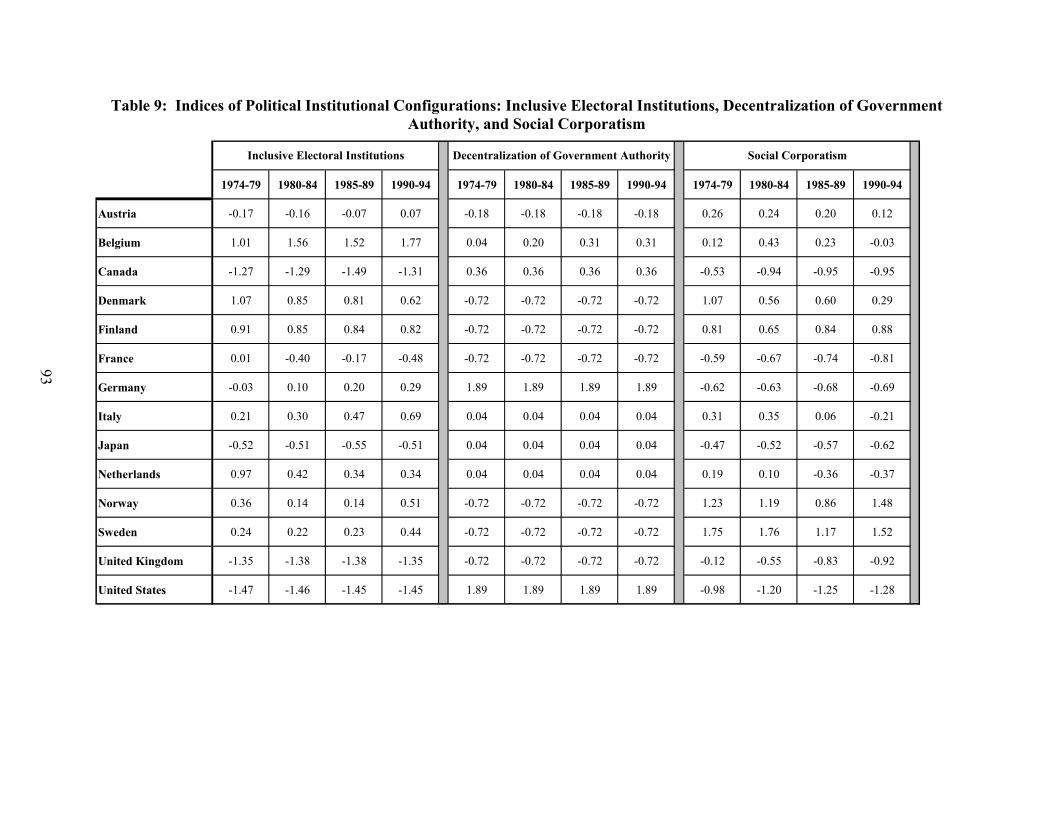
Table 9: Indices of Political Institutional Configurations: Inclusive Electoral Institutions, Decentralization of Government Authority, and Social Corporatism
1974-79 1980-84 1985-89 1990-94 1974-79 1980-84 1985-89 1990-94 1974-79 1980-84 1985-89 1990-94
Austria -0.17 -0.16 -0.07 0.07 -0.18 -0.18 -0.18 -0.18 0.26 0.24 0.20 0.12
Belgium 1.01 1.56 1.52 1.77 0.04 0.20 0.31 0.31 0.12 0.43 0.23 -0.03
Canada -1.27 -1.29 -1.49 -1.31 0.36 0.36 0.36 0.36 -0.53 -0.94 -0.95 -0.95
Denmark 1.07 0.85 0.81 0.62 -0.72 -0.72 -0.72 -0.72 1.07 0.56 0.60 0.29
Finland 0.91 0.85 0.84 0.82 -0.72 -0.72 -0.72 -0.72 0.81 0.65 0.84 0.88
France 0.01 -0.40 -0.17 -0.48 -0.72 -0.72 -0.72 -0.72 -0.59 -0.67 -0.74 -0.81
Germany -0.03 0.10 0.20 0.29 1.89 1.89 1.89 1.89 -0.62 -0.63 -0.68 -0.69
Italy 0.21 0.30 0.47 0.69 0.04 0.04 0.04 0.04 0.31 0.35 0.06 -0.21
Japan -0.52 -0.51 -0.55 -0.51 0.04 0.04 0.04 0.04 -0.47 -0.52 -0.57 -0.62
Netherlands 0.97 0.42 0.34 0.34 0.04 0.04 0.04 0.04 0.19 0.10 -0.36 -0.37
Norway 0.36 0.14 0.14 0.51 -0.72 -0.72 -0.72 -0.72 1.23 1.19 0.86 1.48
Sweden 0.24 0.22 0.23 0.44 -0.72 -0.72 -0.72 -0.72 1.75 1.76 1.17 1.52
United Kingdom -1.35 -1.38 -1.38 -1.35 -0.72 -0.72 -0.72 -0.72 -0.12 -0.55 -0.83 -0.92
United States -1.47 -1.46 -1.45 -1.45 1.89 1.89 1.89 1.89 -0.98 -1.20 -1.25 -1.28
Social CorporatismInclusive Electoral Institutions Decentralization of Government Authority
93
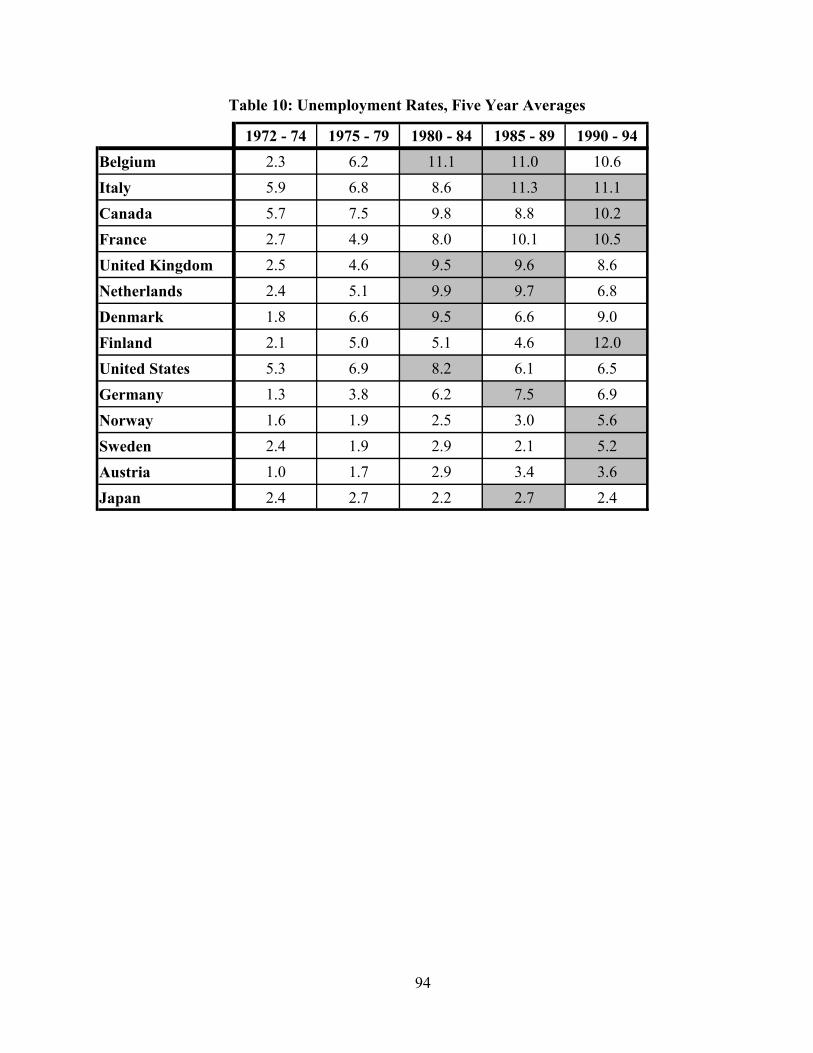
Table 10: Unemployment Rates, Five Year Averages
1972 - 74 1975 - 79 1980 - 84 1985 - 89 1990 - 94Belgium 2.3 6.2 11.1 11.0 10.6Italy 5.9 6.8 8.6 11.3 11.1Canada 5.7 7.5 9.8 8.8 10.2France 2.7 4.9 8.0 10.1 10.5United Kingdom 2.5 4.6 9.5 9.6 8.6Netherlands 2.4 5.1 9.9 9.7 6.8Denmark 1.8 6.6 9.5 6.6 9.0Finland 2.1 5.0 5.1 4.6 12.0United States 5.3 6.9 8.2 6.1 6.5Germany 1.3 3.8 6.2 7.5 6.9Norway 1.6 1.9 2.5 3.0 5.6Sweden 2.4 1.9 2.9 2.1 5.2Austria 1.0 1.7 2.9 3.4 3.6Japan 2.4 2.7 2.2 2.7 2.4
94

Table 11: Real Economic Growth Rates, Five Year Averages
1971 - 75 1976 - 80 1981 - 85 1986 - 90 1991 - 95Sweden 2.6 1.3 1.8 2.3 0.4Belgium 3.5 3.1 0.8 3.0 1.2Italy 2.8 4.5 1.5 3.0 1.1Finland 4.1 2.8 2.8 3.4 -0.4France 3.5 3.1 1.5 3.2 1.1Denmark 2.0 2.5 2.7 1.3 2.1Netherlands 3.2 2.6 1.3 3.1 1.9Austria 4.0 3.3 1.4 3.2 2.0United Kingdom 2.1 1.9 2.0 3.3 1.3United States 2.3 3.3 2.6 2.7 1.9Canada 5.2 3.9 2.9 2.9 1.5Germany 1.8 3.4 1.2 3.3 3.8Norway 4.6 4.9 3.2 1.7 3.6Japan 4.4 4.8 3.7 4.5 1.5
95
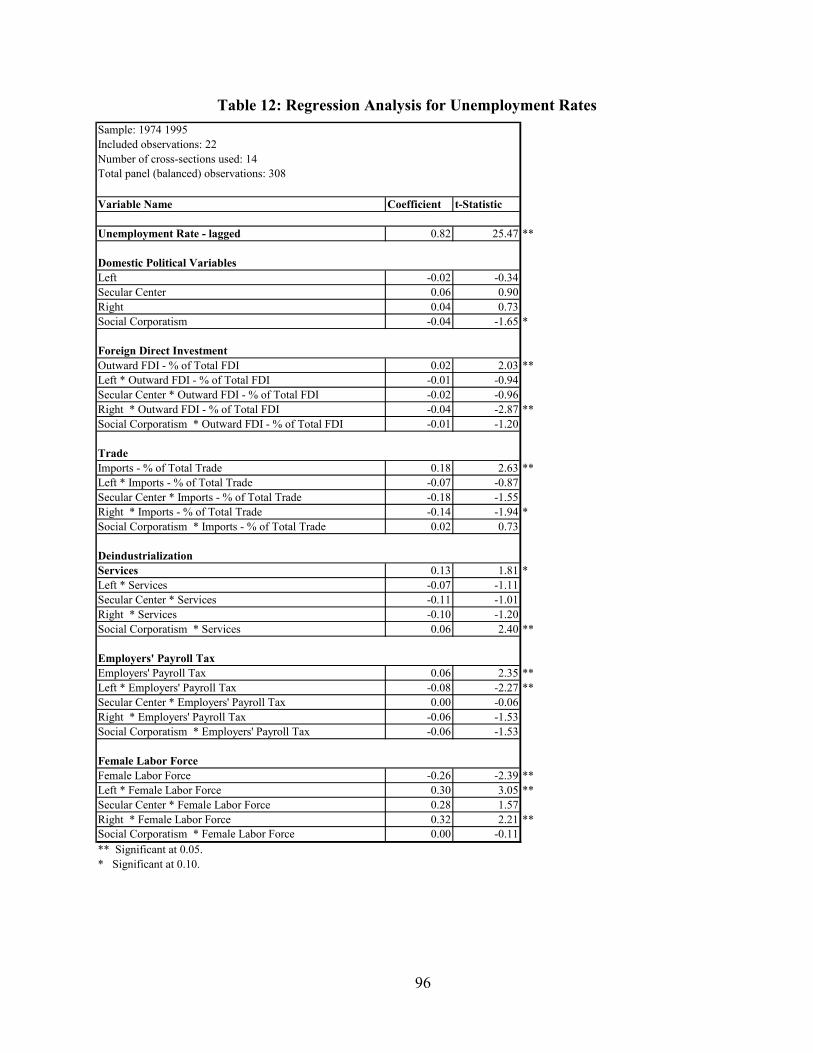
Table 12: Regression Analysis for Unemployment Rates Sample: 1974 1995Included observations: 22Number of cross-sections used: 14Total panel (balanced) observations: 308
Variable Name Coefficient t-Statistic
Unemployment Rate - lagged 0.82 25.47 **
Left -0.02 -0.34Secular Center 0.06 0.90Right 0.04 0.73Social Corporatism -0.04 -1.65 *
Outward FDI - % of Total FDI 0.02 2.03 **Left * Outward FDI - % of Total FDI -0.01 -0.94Secular Center * Outward FDI - % of Total FDI -0.02 -0.96Right * Outward FDI - % of Total FDI -0.04 -2.87 **Social Corporatism * Outward FDI - % of Total FDI -0.01 -1.20
Imports - % of Total Trade 0.18 2.63 **Left * Imports - % of Total Trade -0.07 -0.87Secular Center * Imports - % of Total Trade -0.18 -1.55Right * Imports - % of Total Trade -0.14 -1.94 *Social Corporatism * Imports - % of Total Trade 0.02 0.73
Services 0.13 1.81 *Left * Services -0.07 -1.11Secular Center * Services -0.11 -1.01Right * Services -0.10 -1.20Social Corporatism * Services 0.06 2.40 **
Employers' Payroll Tax 0.06 2.35 **Left * Employers' Payroll Tax -0.08 -2.27 **Secular Center * Employers' Payroll Tax 0.00 -0.06Right * Employers' Payroll Tax -0.06 -1.53Social Corporatism * Employers' Payroll Tax -0.06 -1.53
Female Labor Force -0.26 -2.39 **Left * Female Labor Force 0.30 3.05 **Secular Center * Female Labor Force 0.28 1.57Right * Female Labor Force 0.32 2.21 **Social Corporatism * Female Labor Force 0.00 -0.11** Significant at 0.05.* Significant at 0.10.
Female Labor Force
Employers' Payroll Tax
Deindustrialization
Trade
Foreign Direct Investment
Domestic Political Variables
96

Table 12, continued
Fixed EffectsAustria -0.14Belgium -0.11Canada -0.13Denmark -0.13Finland -0.11France -0.09Germany -0.10Italy -0.07Japan -0.13Netherlands -0.15Norway -0.18Sweden -0.17United Kingdom -0.12United States -0.13
Weighted Statistics
R-squared 0.92 Mean dependent var 0.08Adjusted R-squared 0.91 S.D. dependent var 0.05S.E. of regression 0.02 Sum squared resid 0.06Log likelihood 901.93 F-statistic 110.36Durbin-Watson stat 0.59 Prob(F-statistic) 0.00
Unweighted Statistics
R-squared 0.79 Mean dependent var 0.06Adjusted R-squared 0.76 S.D. dependent var 0.03S.E. of regression 0.02 Sum squared resid 0.07Durbin-Watson stat 0.51
97

Table 13: Regression Analysis for Real Economic Growth Rates
Sample: 1974 1995Included observations: 22Number of cross-sections used: 14Total panel (balanced) observations: 308
Variable Name Coefficient t-Statistic
Real Economic Growth - lagged 0.17 3.05 **Imports - % of Total Trade -0.16 -3.09 **Outward FDI - % of Total FDI -0.02 -2.60 **Services 0.08 2.06 **Elderly - % of Population -0.69 -3.52 **** Significant at 0.05.* Significant at 0.10.
98
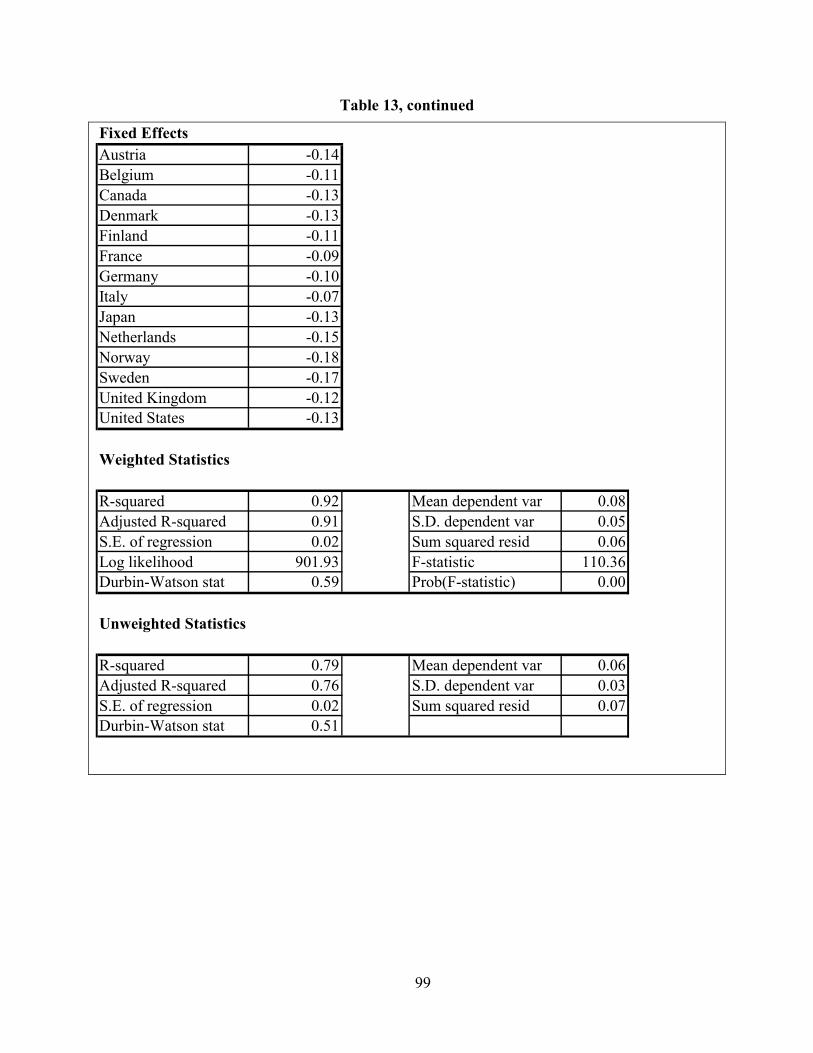
Table 13, continued
Fixed EffectsAustria -0.14Belgium -0.11Canada -0.13Denmark -0.13Finland -0.11France -0.09Germany -0.10Italy -0.07Japan -0.13Netherlands -0.15Norway -0.18Sweden -0.17United Kingdom -0.12United States -0.13
Weighted Statistics
R-squared 0.92 Mean dependent var 0.08Adjusted R-squared 0.91 S.D. dependent var 0.05S.E. of regression 0.02 Sum squared resid 0.06Log likelihood 901.93 F-statistic 110.36Durbin-Watson stat 0.59 Prob(F-statistic) 0.00
Unweighted Statistics
R-squared 0.79 Mean dependent var 0.06Adjusted R-squared 0.76 S.D. dependent var 0.03S.E. of regression 0.02 Sum squared resid 0.07Durbin-Watson stat 0.51
99
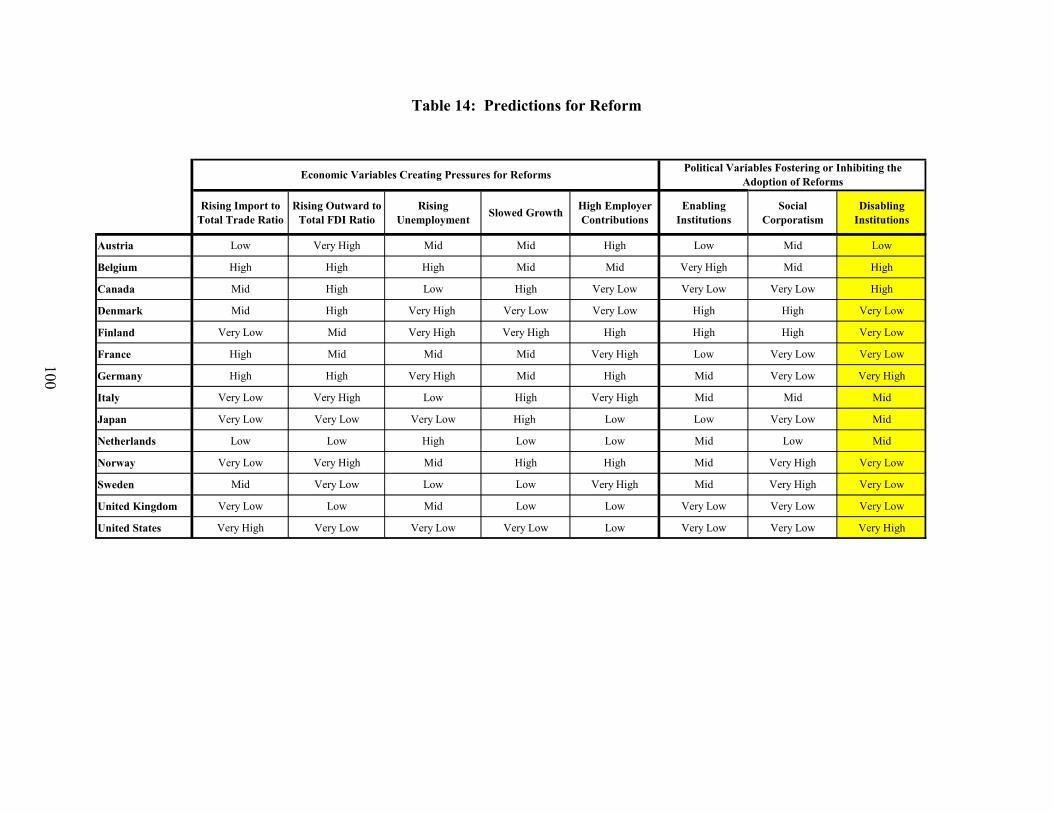
Table 14: Predictions for Reform
Rising Import to Total Trade Ratio
Rising Outward to Total FDI Ratio
Rising Unemployment Slowed Growth High Employer
ContributionsEnabling
InstitutionsSocial
CorporatismDisabling
Institutions
Austria Low Very High Mid Mid High Low Mid Low
Belgium High High High Mid Mid Very High Mid High
Canada Mid High Low High Very Low Very Low Very Low High
Denmark Mid High Very High Very Low Very Low High High Very Low
Finland Very Low Mid Very High Very High High High High Very Low
France High Mid Mid Mid Very High Low Very Low Very Low
Germany High High Very High Mid High Mid Very Low Very High
Italy Very Low Very High Low High Very High Mid Mid Mid
Japan Very Low Very Low Very Low High Low Low Very Low Mid
Netherlands Low Low High Low Low Mid Low Mid
Norway Very Low Very High Mid High High Mid Very High Very Low
Sweden Mid Very Low Low Low Very High Mid Very High Very Low
United Kingdom Very Low Low Mid Low Low Very Low Very Low Very Low
United States Very High Very Low Very Low Very Low Low Very Low Very Low Very High
Political Variables Fostering or Inhibiting the Adoption of Reforms Economic Variables Creating Pressures for Reforms
100

-15.0
5.0
25.0
45.0
65.0
85.0
105.0
1973 1975 1977 1979 1981 1983 1985 1987 1989 1991 1993 1995
Perc
enta
ge o
f Los
t Wag
es
OLD AGEDISABILITYUI ONE YEARUI FIVE YEARSSICK ONE YEAR101
Figure 5: Adjusted Replacement Rates for Austria, 1973-1995

102
-15.0
5.0
25.0
45.0
65.0
85.0
105.0
1973 1975 1977 1979 1981 1983 1985 1987 1989 1991 1993 1995
Perc
enta
ge o
f Los
t Wag
es
OLD AGEDISABILITYUI FIRST YEARUI FIVE YEARSSICK FIRST YEAR
Figure 6: Adjusted Replacement Rates for Belgium, 1973-1995
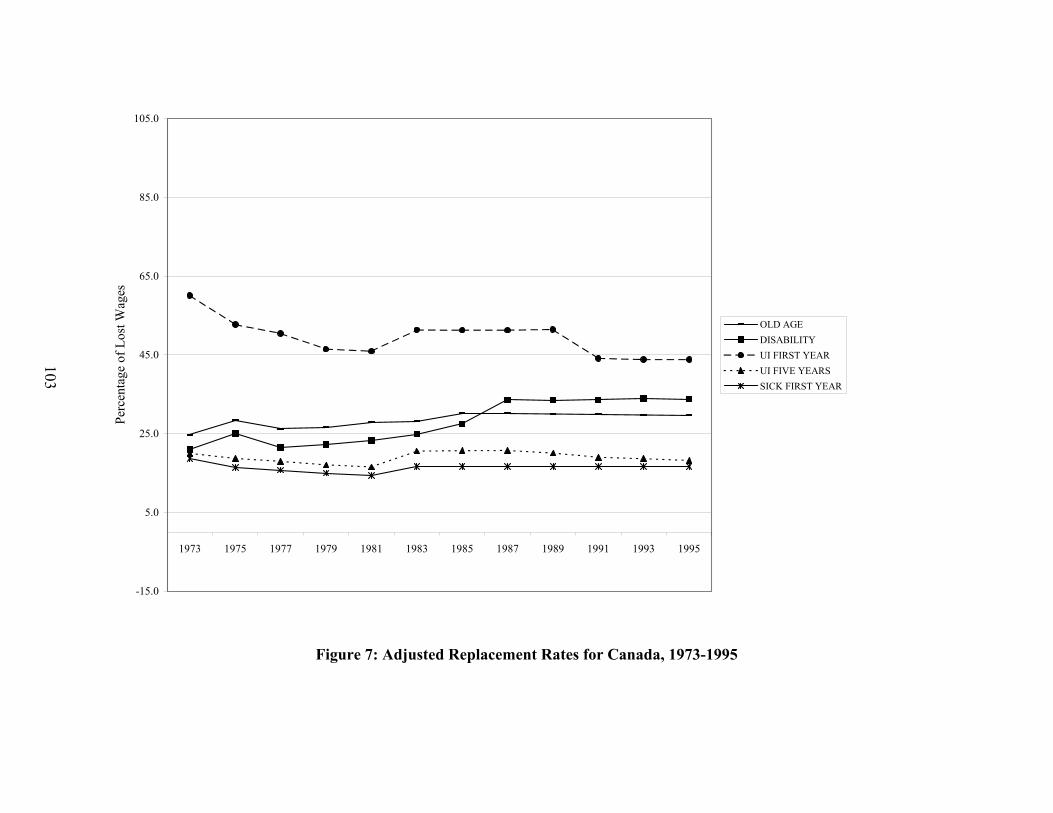
103
-15.0
5.0
25.0
45.0
65.0
85.0
105.0
1973 1975 1977 1979 1981 1983 1985 1987 1989 1991 1993 1995
Perc
enta
ge o
f Los
t Wag
es
OLD AGEDISABILITYUI FIRST YEARUI FIVE YEARSSICK FIRST YEAR
Figure 7: Adjusted Replacement Rates for Canada, 1973-1995
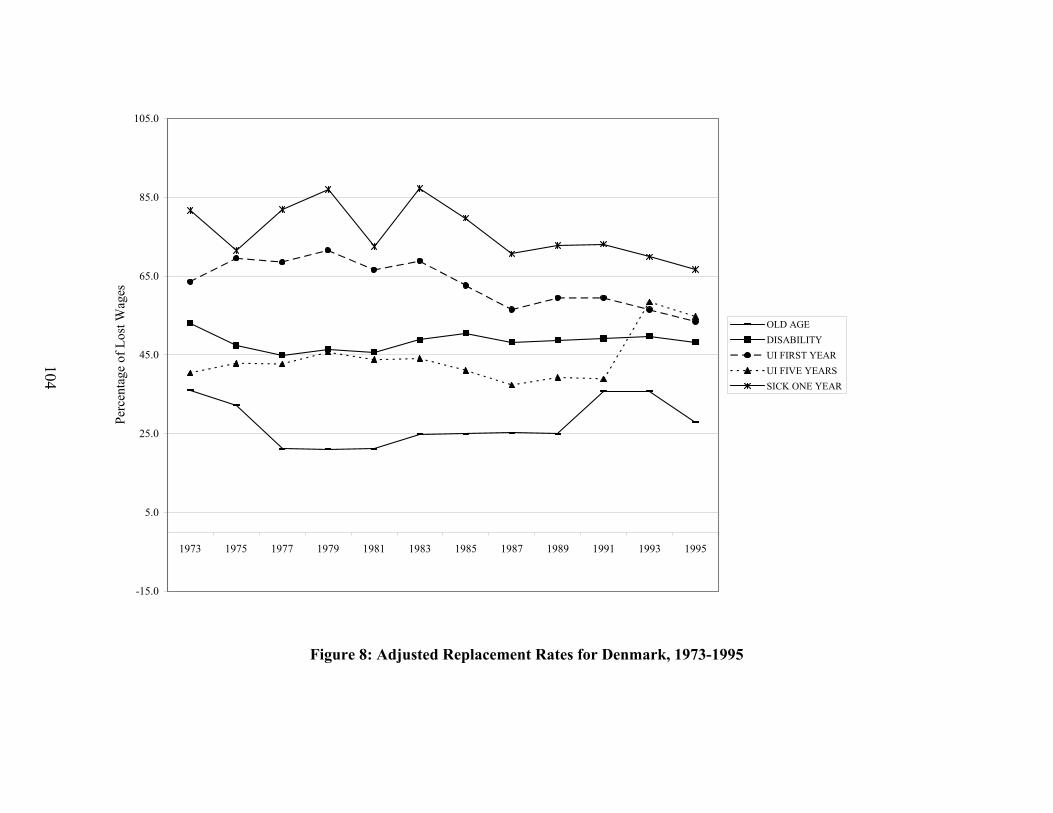
104
-15.0
5.0
25.0
45.0
65.0
85.0
105.0
1973 1975 1977 1979 1981 1983 1985 1987 1989 1991 1993 1995
Perc
enta
ge o
f Los
t Wag
es
OLD AGEDISABILITYUI FIRST YEARUI FIVE YEARSSICK ONE YEAR
Figure 8: Adjusted Replacement Rates for Denmark, 1973-1995

-15.0
5.0
25.0
45.0
65.0
85.0
105.0
1973 1975 1977 1979 1981 1983 1985 1987 1989 1991 1993 1995
Perc
enta
ge o
f Los
t Wag
es
OLD AGEDISABILITYUI FIRST YEARUI FIVE YEARSSICK FIRST YEAR
105
Figure 9: Adjusted Replacement Rates for Finland, 1973-1995

106
-15.0
5.0
25.0
45.0
65.0
85.0
105.0
1973 1975 1977 1979 1981 1983 1985 1987 1989 1991 1993 1995
Perc
enta
ge o
f Los
t Wag
es
OLD AGEDISABILITYUI FIRST YEARUI FIVE YEARSSICK FIRST YEAR
Figure 10: Adjusted Replacement Rates for France, 1973-1995
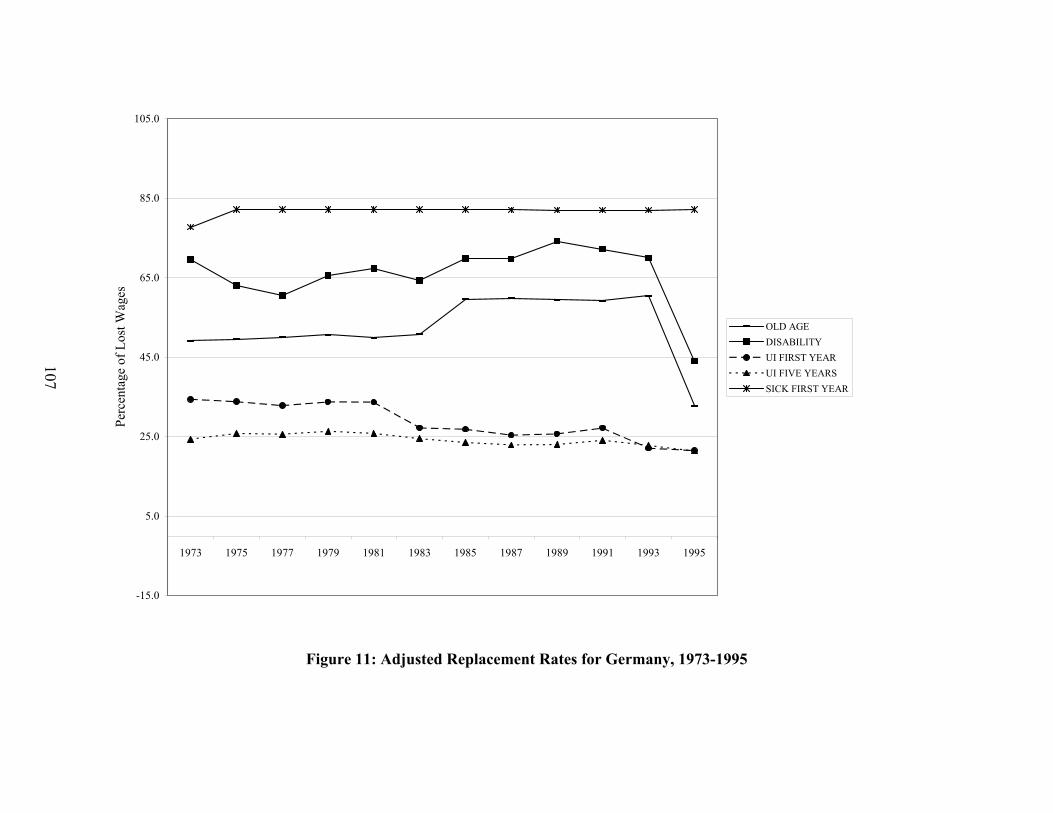
107
-15.0
5.0
25.0
45.0
65.0
85.0
105.0
1973 1975 1977 1979 1981 1983 1985 1987 1989 1991 1993 1995
Perc
enta
ge o
f Los
t Wag
es
OLD AGEDISABILITYUI FIRST YEARUI FIVE YEARSSICK FIRST YEAR
Figure 11: Adjusted Replacement Rates for Germany, 1973-1995

108
-15.0
5.0
25.0
45.0
65.0
85.0
105.0
1973 1975 1977 1979 1981 1983 1985 1987 1989 1991 1993 1995
Perc
enta
ge o
f Los
t Wag
es
OLD AGEDISABILITYUI FIRST YEARUI FIVE YEARSSICK FIRST YEAR
Figure 12: Adjusted Replacement Rates for Italy, 1973-1995
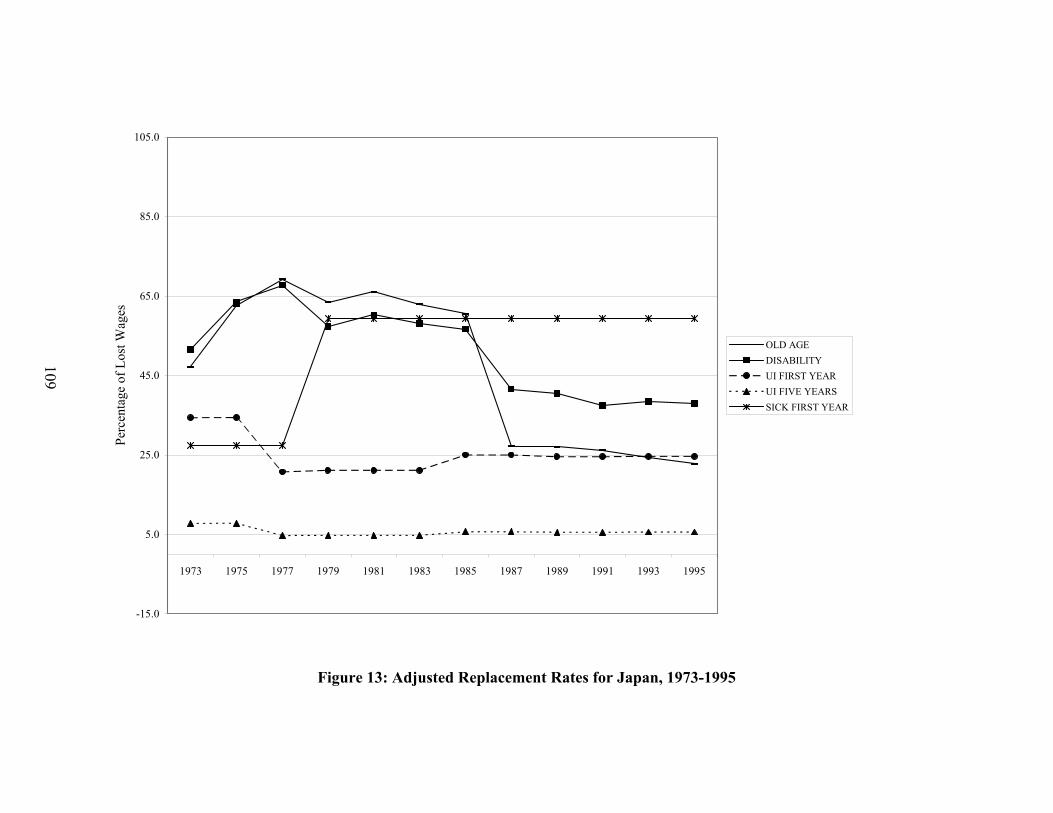
-15.0
5.0
25.0
45.0
65.0
85.0
105.0
1973 1975 1977 1979 1981 1983 1985 1987 1989 1991 1993 1995
Perc
enta
ge o
f Los
t Wag
es
OLD AGEDISABILITYUI FIRST YEARUI FIVE YEARSSICK FIRST YEAR
109
Figure 13: Adjusted Replacement Rates for Japan, 1973-1995
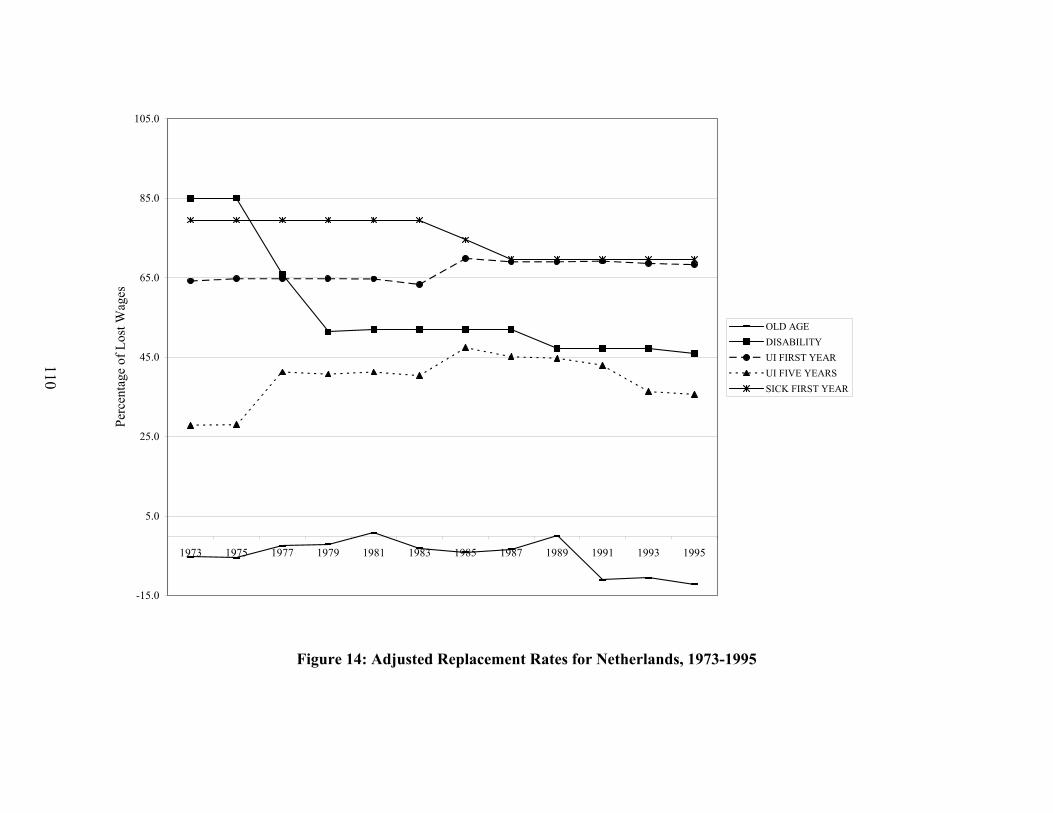
110
-15.0
5.0
25.0
45.0
65.0
85.0
105.0
1973 1975 1977 1979 1981 1983 1985 1987 1989 1991 1993 1995
Perc
enta
ge o
f Los
t Wag
es
OLD AGEDISABILITYUI FIRST YEARUI FIVE YEARSSICK FIRST YEAR
Figure 14: Adjusted Replacement Rates for Netherlands, 1973-1995
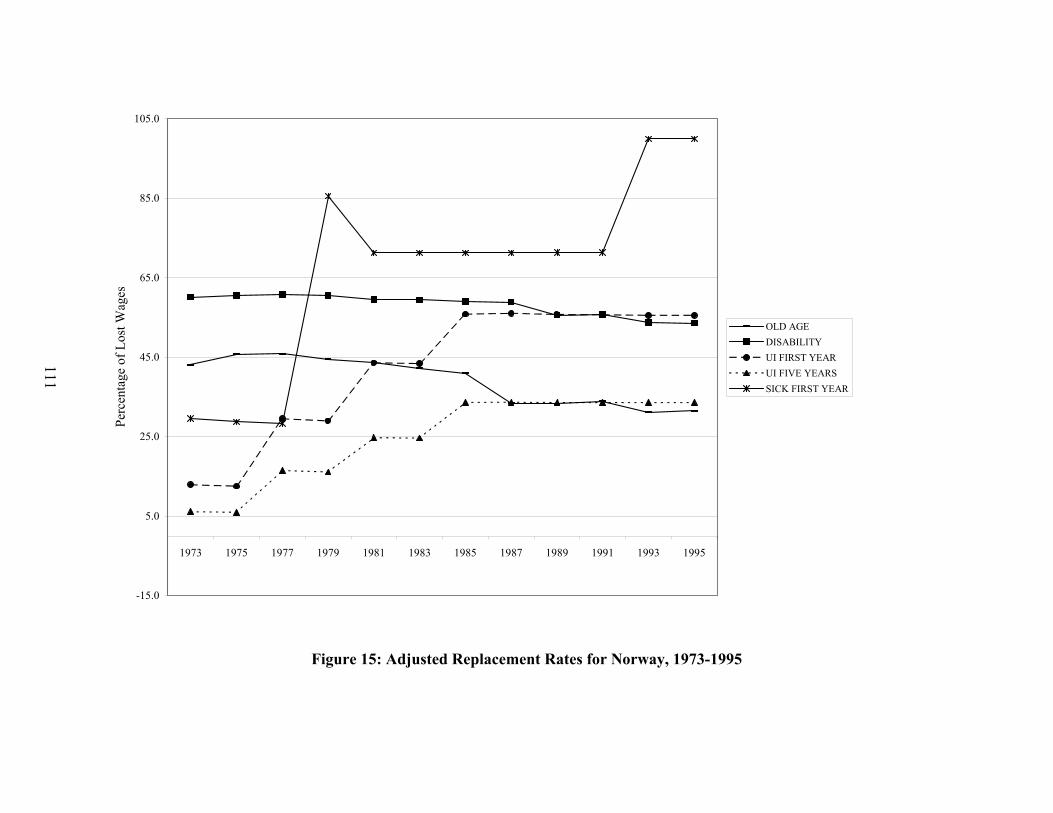
111
-15.0
5.0
25.0
45.0
65.0
85.0
105.0
1973 1975 1977 1979 1981 1983 1985 1987 1989 1991 1993 1995
Perc
enta
ge o
f Los
t Wag
es
OLD AGEDISABILITYUI FIRST YEARUI FIVE YEARSSICK FIRST YEAR
Figure 15: Adjusted Replacement Rates for Norway, 1973-1995
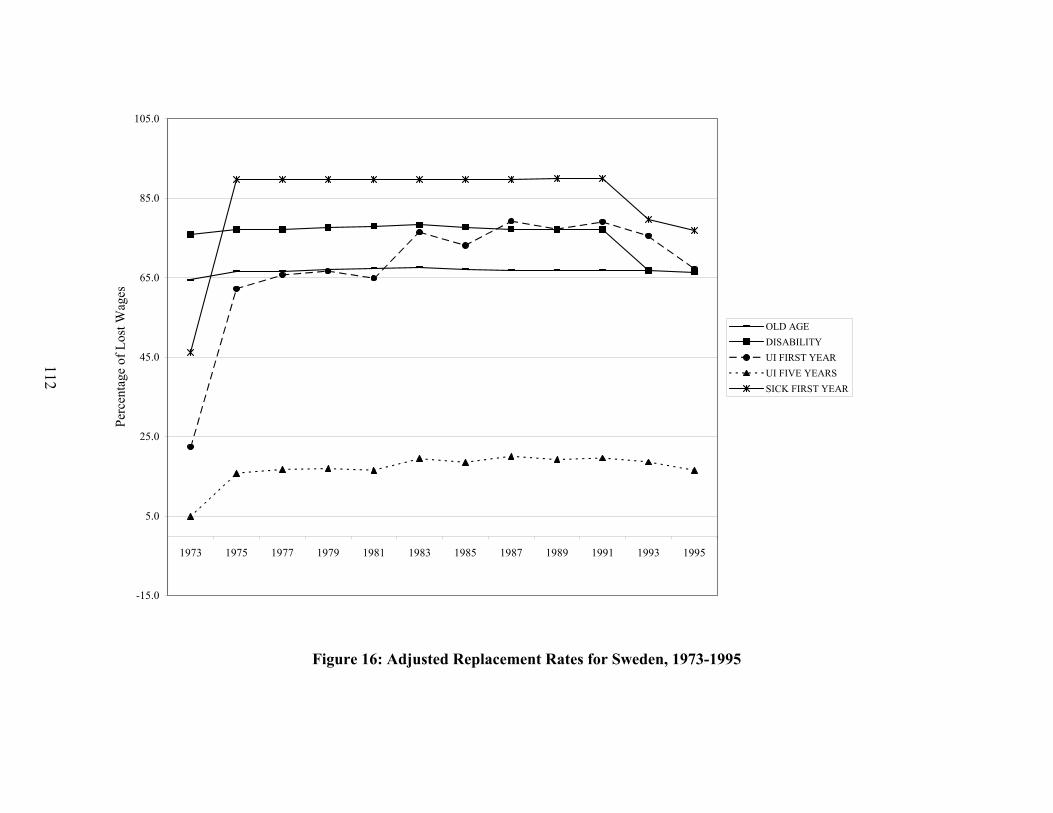
112
-15.0
5.0
25.0
45.0
65.0
85.0
105.0
1973 1975 1977 1979 1981 1983 1985 1987 1989 1991 1993 1995
Perc
enta
ge o
f Los
t Wag
es
OLD AGEDISABILITYUI FIRST YEARUI FIVE YEARSSICK FIRST YEAR
Figure 16: Adjusted Replacement Rates for Sweden, 1973-1995

113
-15.0
5.0
25.0
45.0
65.0
85.0
105.0
1973 1975 1977 1979 1981 1983 1985 1987 1989 1991 1993 1995
Perc
enta
ge o
f Los
t Wag
es
OLD AGEDISABILITYUI FIRST YEARUI FIVE YEARSSICK FIRST YEAR
Figure 17: Adjusted Replacement Rates for the United Kingdom, 1973-1995

114
-15.0
5.0
25.0
45.0
65.0
85.0
105.0
1973 1975 1977 1979 1981 1983 1985 1987 1989 1991 1993 1995
Perc
enta
ge o
f Los
t Wag
es
OLD AGEDISABILITYUI FIRST YEARUI FIVE YEARS
Figure 18: Adjusted Replacement Rates for The United States, 1973-1995
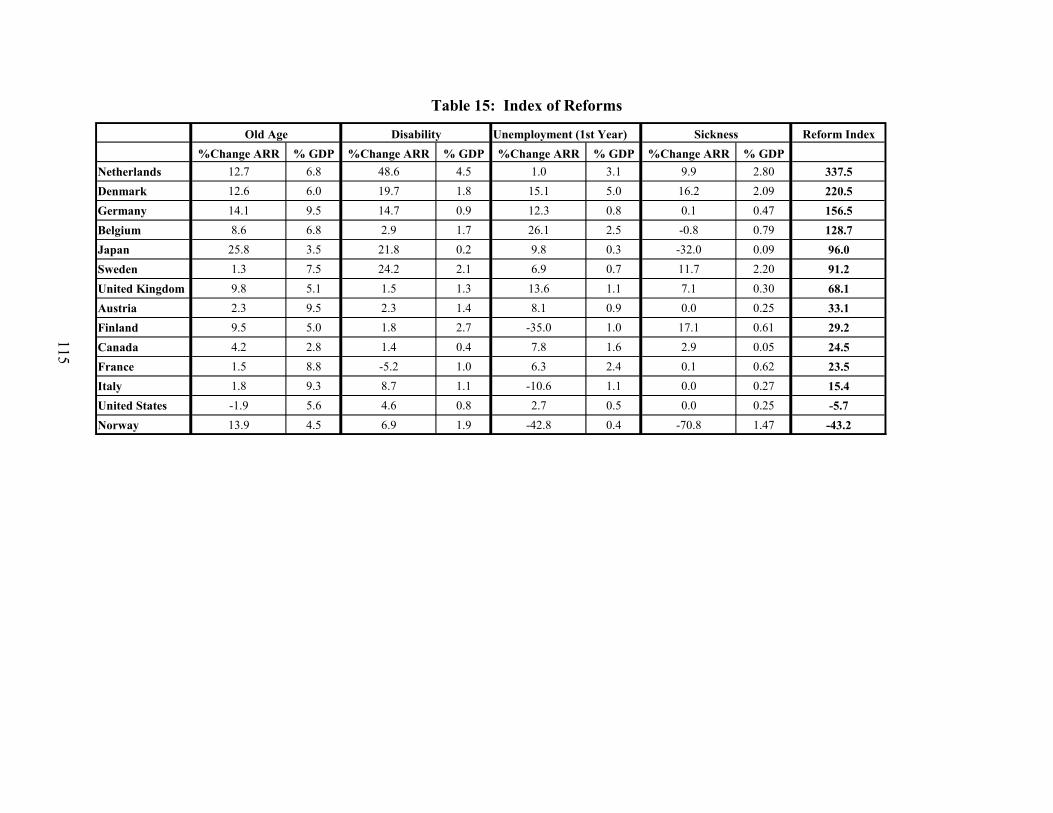
Table 15: Index of Reforms
Reform Index%Change ARR % GDP %Change ARR % GDP %Change ARR % GDP %Change ARR % GDP
Netherlands 12.7 6.8 48.6 4.5 1.0 3.1 9.9 2.80 337.5Denmark 12.6 6.0 19.7 1.8 15.1 5.0 16.2 2.09 220.5Germany 14.1 9.5 14.7 0.9 12.3 0.8 0.1 0.47 156.5Belgium 8.6 6.8 2.9 1.7 26.1 2.5 -0.8 0.79 128.7Japan 25.8 3.5 21.8 0.2 9.8 0.3 -32.0 0.09 96.0Sweden 1.3 7.5 24.2 2.1 6.9 0.7 11.7 2.20 91.2United Kingdom 9.8 5.1 1.5 1.3 13.6 1.1 7.1 0.30 68.1Austria 2.3 9.5 2.3 1.4 8.1 0.9 0.0 0.25 33.1Finland 9.5 5.0 1.8 2.7 -35.0 1.0 17.1 0.61 29.2Canada 4.2 2.8 1.4 0.4 7.8 1.6 2.9 0.05 24.5France 1.5 8.8 -5.2 1.0 6.3 2.4 0.1 0.62 23.5Italy 1.8 9.3 8.7 1.1 -10.6 1.1 0.0 0.27 15.4United States -1.9 5.6 4.6 0.8 2.7 0.5 0.0 0.25 -5.7Norway 13.9 4.5 6.9 1.9 -42.8 0.4 -70.8 1.47 -43.2
Old Age Disability Unemployment (1st Year) Sickness
115
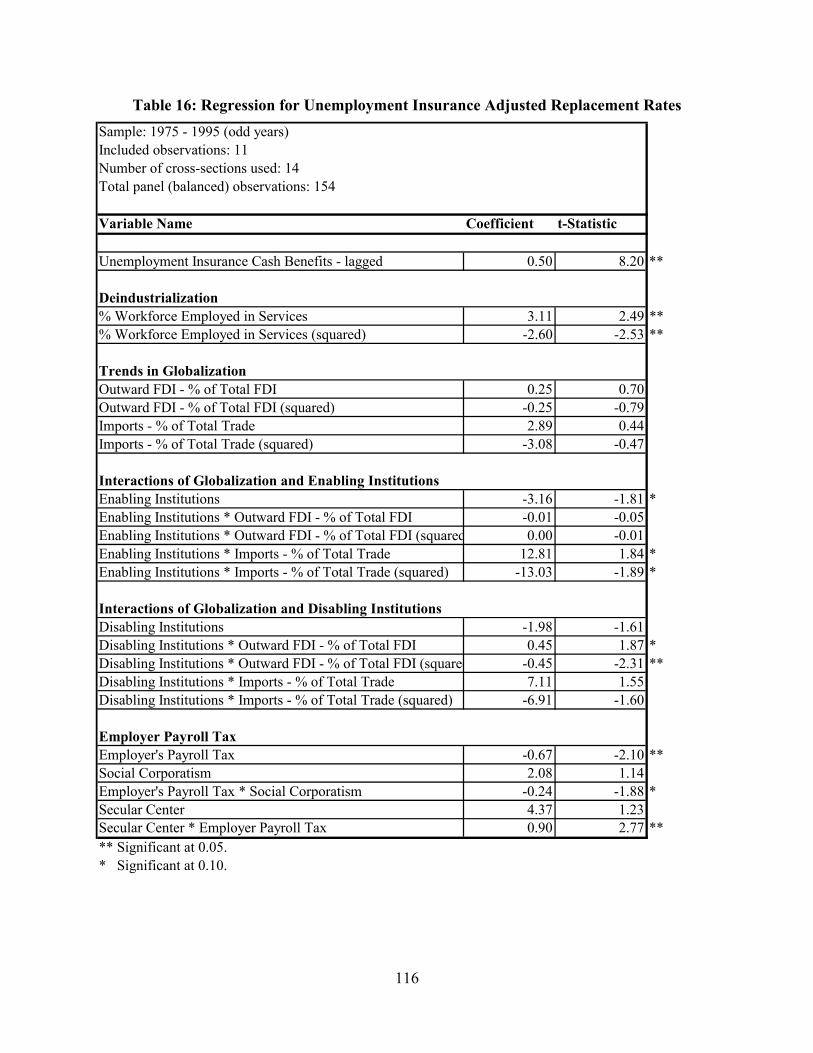
Table 16: Regression for Unemployment Insurance Adjusted Replacement Rates Sample: 1975 - 1995 (odd years)Included observations: 11Number of cross-sections used: 14Total panel (balanced) observations: 154
Variable Name Coefficient t-Statistic
Unemployment Insurance Cash Benefits - lagged 0.50 8.20 **
% Workforce Employed in Services 3.11 2.49 **% Workforce Employed in Services (squared) -2.60 -2.53 **
Outward FDI - % of Total FDI 0.25 0.70Outward FDI - % of Total FDI (squared) -0.25 -0.79Imports - % of Total Trade 2.89 0.44Imports - % of Total Trade (squared) -3.08 -0.47
Enabling Institutions -3.16 -1.81 *Enabling Institutions * Outward FDI - % of Total FDI -0.01 -0.05Enabling Institutions * Outward FDI - % of Total FDI (squared 0.00 -0.01Enabling Institutions * Imports - % of Total Trade 12.81 1.84 *Enabling Institutions * Imports - % of Total Trade (squared) -13.03 -1.89 *
Disabling Institutions -1.98 -1.61Disabling Institutions * Outward FDI - % of Total FDI 0.45 1.87 *Disabling Institutions * Outward FDI - % of Total FDI (squared -0.45 -2.31 **Disabling Institutions * Imports - % of Total Trade 7.11 1.55Disabling Institutions * Imports - % of Total Trade (squared) -6.91 -1.60
Employer's Payroll Tax -0.67 -2.10 **Social Corporatism 2.08 1.14Employer's Payroll Tax * Social Corporatism -0.24 -1.88 *Secular Center 4.37 1.23Secular Center * Employer Payroll Tax 0.90 2.77 **** Significant at 0.05.* Significant at 0.10.
Employer Payroll Tax
Interactions of Globalization and Enabling Institutions
Interactions of Globalization and Disabling Institutions
Deindustrialization
Trends in Globalization
116

Table 16, continued
Austria -1.36Belgium -1.32Canada -1.33Denmark -1.36Finland -1.38France -1.31Germany -1.21Italy -1.37Japan -1.45Netherlands -1.17Norway -1.36Sweden -1.21United Kingdom -1.57United States -1.28
Weighted Statistics
R-squared 0.99 Mean dependent var 0.47Adjusted R-squared 0.98 S.D. dependent var 0.31S.E. of regression 0.04 Sum squared resid 0.18F-statistic 183.78 Durbin-Watson stat 2.33Prob(F-statistic) 0.00
Unweighted Statistics
R-squared 0.97 Mean dependent var 0.39Adjusted R-squared 0.95 S.D. dependent var 0.21S.E. of regression 0.05 Sum squared resid 0.22Durbin-Watson stat 2.04
117
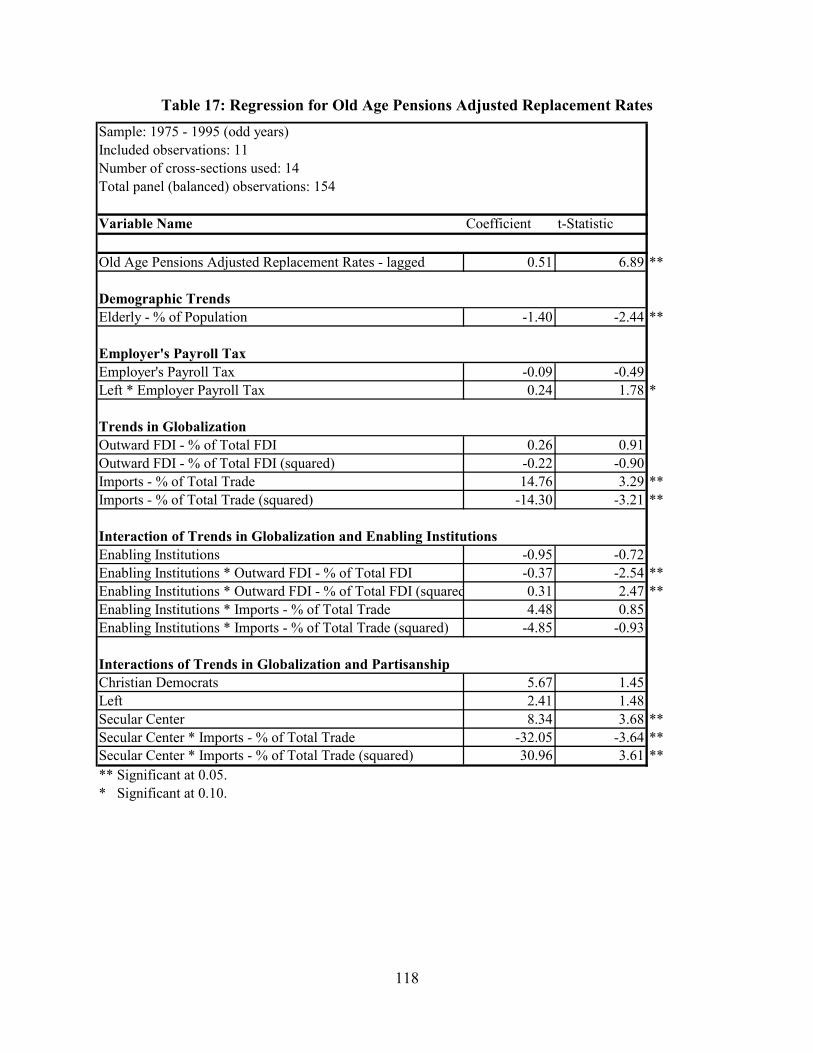
Table 17: Regression for Old Age Pensions Adjusted Replacement Rates Sample: 1975 - 1995 (odd years)Included observations: 11Number of cross-sections used: 14Total panel (balanced) observations: 154
Variable Name Coefficient t-Statistic
Old Age Pensions Adjusted Replacement Rates - lagged 0.51 6.89 **
Elderly - % of Population -1.40 -2.44 **
Employer's Payroll Tax -0.09 -0.49Left * Employer Payroll Tax 0.24 1.78 *
Outward FDI - % of Total FDI 0.26 0.91Outward FDI - % of Total FDI (squared) -0.22 -0.90Imports - % of Total Trade 14.76 3.29 **Imports - % of Total Trade (squared) -14.30 -3.21 **
Enabling Institutions -0.95 -0.72Enabling Institutions * Outward FDI - % of Total FDI -0.37 -2.54 **Enabling Institutions * Outward FDI - % of Total FDI (squared 0.31 2.47 **Enabling Institutions * Imports - % of Total Trade 4.48 0.85Enabling Institutions * Imports - % of Total Trade (squared) -4.85 -0.93
Christian Democrats 5.67 1.45Left 2.41 1.48Secular Center 8.34 3.68 **Secular Center * Imports - % of Total Trade -32.05 -3.64 **Secular Center * Imports - % of Total Trade (squared) 30.96 3.61 **** Significant at 0.05.* Significant at 0.10.
Interaction of Trends in Globalization and Enabling Institutions
Interactions of Trends in Globalization and Partisanship
Employer's Payroll Tax
Trends in Globalization
Demographic Trends
118

Table 17, continued
Fixed Effects
Austria -3.79Belgium -3.79Canada -3.87Denmark -3.89Finland -3.79France -3.93Germany -3.51Italy -3.67Japan -3.73Netherlands -4.05Norway -3.85Sweden -3.67United Kingdom -4.17United States -3.70
Weighted Statistics
R-squared 1.00 Mean dependent var 0.62Adjusted R-squared 1.00 S.D. dependent var 0.54S.E. of regression 0.03 Sum squared resid 0.10F-statistic 970.77 Durbin-Watson stat 2.40Prob(F-statistic) 0.00
Unweighted Statistics
R-squared 0.98 Mean dependent var 0.38Adjusted R-squared 0.97 S.D. dependent var 0.22S.E. of regression 0.04 Sum squared resid 0.16Durbin-Watson stat 2.31
119

Table 18: Regression for Disability Pensions Adjusted Replacement Rates Sample: 1975 - 1995 (odd years)Included observations: 11Number of cross-sections used: 14Total panel (balanced) observations: 154
Variable Name Coefficient t-Statistic
Disability Adjusted Replacement Rates - lagged 0.59 8.01 **
Elderly - % of Population -1.42 -3.20 **% Workforce Employed in Services 0.84 1.50% Workforce Employed in Services (squared) -0.63 -1.30
Employer's Payroll Tax 0.00 -0.02Christian Democrats * Employer Payroll Tax -0.17 -0.40Left * Employer Payroll Tax 0.12 1.28Secular Center * Employer Payroll Tax 0.43 3.13 **
Outward FDI - % of Total FDI 0.26 1.18Outward FDI - % of Total FDI (squared) -0.19 -1.01Imports - % of Total Trade 9.72 3.03 **Imports - % of Total Trade (squared) -9.54 -3.02 **
Disabling Institutions 0.64 0.78Disabling Institutions * Outward FDI - % of Total FDI -0.56 -2.88 **Disabling Institutions * Outward FDI - % of Total FDI (squared) 0.46 2.73 **
Christian Democrats 5.68 1.73 *Left 3.71 3.06 **Secular Center 6.68 3.65 **
Left * Outward FDI - % of Total FDI -0.57 -2.29 **Left * Outward FDI - % of Total FDI (squared) 0.48 2.27 **Left * Imports - % of Total Trade -13.99 -2.93 **Left * Imports - % of Total Trade (squared) 13.71 2.90 **Christian Democrats * Imports - % of Total Trade -22.25 -1.73 *Christian Democrats * Imports - % of Total Trade (squared) 21.77 1.73 *Secular Center * Imports - % of Total Trade -25.92 -3.64 **Secular Center * Imports - % of Total Trade (squared) 25.35 3.65 **** Significant at 0.05.* Significant at 0.10.
Trends in Globalization
Interactions of Trends in Globalization and Partisanship
Interaction of Trends in Globalization and Disabling Institutions
Partisanship
Demographic Trends
Interaction of Employer's Payroll Tax and Partisanship
120

Table 18, continued
Fixed Effects
Austria -2.53Belgium -2.56Canada -2.63Denmark -2.56Finland -2.55France -2.65Germany -2.39Italy -2.42Japan -2.55Netherlands -2.57Norway -2.52Sweden -2.45United Kingdom -2.73United States -2.51
Weighted Statistics
R-squared 1.00 Mean dependent var 0.82Adjusted R-squared 1.00 S.D. dependent var 0.57S.E. of regression 0.03 Sum squared resid 0.08F-statistic 1301.93 Durbin-Watson stat 2.17Prob(F-statistic) 0.00
Unweighted Statistics
R-squared 0.97 Mean dependent var 0.50Adjusted R-squared 0.94 S.D. dependent var 0.16S.E. of regression 0.04 Sum squared resid 0.14Durbin-Watson stat 1.85
121
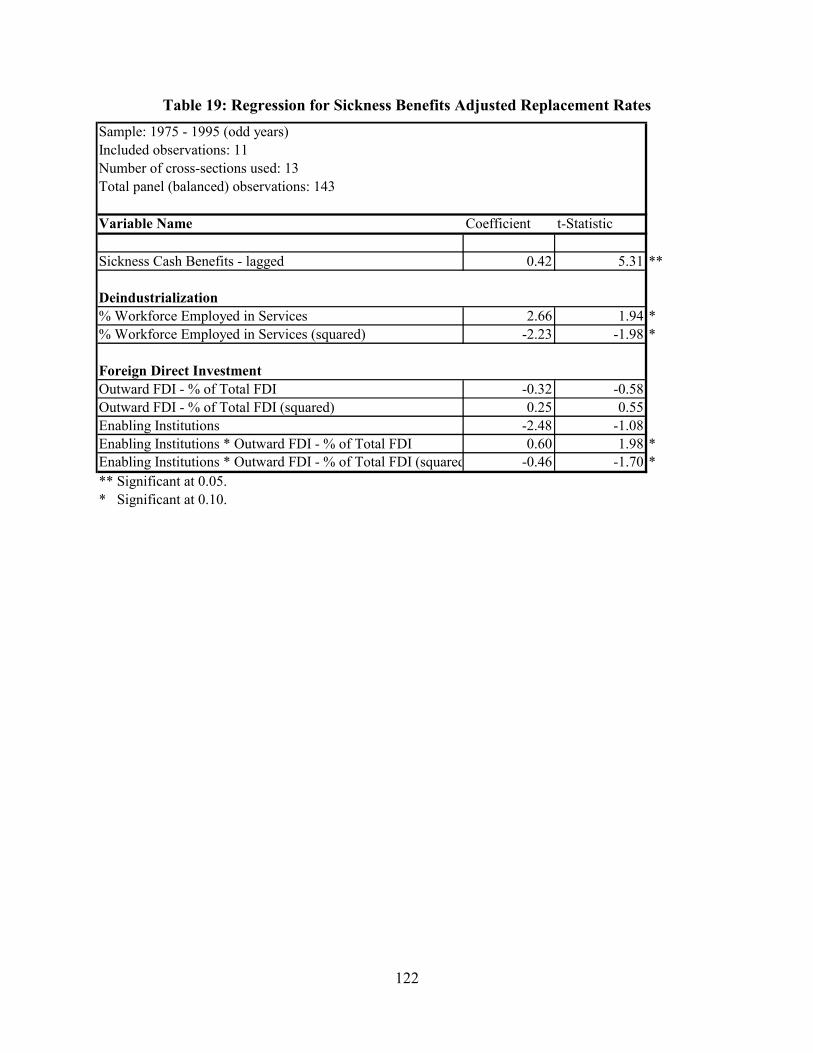
Table 19: Regression for Sickness Benefits Adjusted Replacement Rates Sample: 1975 - 1995 (odd years)Included observations: 11Number of cross-sections used: 13Total panel (balanced) observations: 143
Variable Name Coefficient t-Statistic
Sickness Cash Benefits - lagged 0.42 5.31 **
% Workforce Employed in Services 2.66 1.94 *% Workforce Employed in Services (squared) -2.23 -1.98 *
Outward FDI - % of Total FDI -0.32 -0.58Outward FDI - % of Total FDI (squared) 0.25 0.55Enabling Institutions -2.48 -1.08Enabling Institutions * Outward FDI - % of Total FDI 0.60 1.98 *Enabling Institutions * Outward FDI - % of Total FDI (squared -0.46 -1.70 *** Significant at 0.05.* Significant at 0.10.
Foreign Direct Investment
Deindustrialization
122

Table 19, continued
Fixed Effects
Austria 1.78Belgium 1.89Canada 1.70Denmark 1.99Finland 1.86743France 1.916655Germany 1.946492Italy 1.727292Japan 1.867Netherlands 1.966Norway 2.002Sweden 2.029United Kingdom 1.671United States
Weighted Statistics
R-squared 0.99 Mean dependent var 0.74Adjusted R-squared 0.99 S.D. dependent var 0.47S.E. of regression 0.06 Sum squared resid 0.26F-statistic 236.50 Durbin-Watson stat 2.08Prob(F-statistic) 0.00
Unweighted Statistics
R-squared 0.94 Mean dependent var 0.54Adjusted R-squared 0.91 S.D. dependent var 0.26S.E. of regression 0.08 Sum squared resid 0.53Durbin-Watson stat 2.15
123

CHAPTER V
PARTISANSHIP AND PROTECTING OF TRADITIONAL VALUES
INTRODUCTION
The evidence presented in Chapter IV showed that trends in globalization have create
financial pressures to reform social insurance programs in many of the fourteen countries
examined here. First, growing deficits in trade and investment, as well as increases in employer
payroll contributions, are associated with rising unemployment rates. Thus, these trends lead to
depressed demand for labor as industries fail to compete in increasingly integrated markets.
Also, growing deficits in trade and investment are associated with falling rates of real economic
growth, even when controlling for “deindustrialization” and aging populations. These results
provide support for the claim that waning competitiveness that leads to higher unemployment
rates also depresses real economic growth. Additional results further show that these economic
trends are associated with reforms of various social insurance programs that reduce adjusted
replacement rates for these benefits, especially where enabling political institutions are present.
In this chapter I will show that, while international economic trends may produce these purely
financial pressures for reforms, partisan politics should play an important role in determining
what types of reforms are adopted.
OPTIONS THAT ARE MARKET CONFORMING
As indicated in Chapter II, some scholars have interpreted the efficiency thesis as
claiming that globalization should cause convergence around the residualist welfare state model
that right-wing, economically liberal parties endorse. When no such evidence is found, these
scholars claim that the efficiency thesis is weakened. But this line of reasoning is overdrawn.
It’s true that some aspects of social insurance programs are less “market conforming” than
others. Virtually all social insurance programs serve dual functions; they provide an insurance
function through horizontal transfers of funds from those who are employed to those who are
not, and a redistributive function through vertical transfers that award low-income workers
benefits that are disproportionately large relative to their wages and past contributions. Several
of the countries examined here have universal, flat rate components to their old age and disability
124
pensions, and some UI cash benefits. These benefits represent vertical transfers because the
same amount is awarded to all recipients regardless of past earnings or contributions. Every
country examined here also provides benefits that are determined based on past earnings and
contributions. These represent horizontal transfers between workers and benefit recipients with
similar earnings.
Universal, flat rate benefits are the least market-conforming of the various components of
the social insurance programs that these countries offer. They effectively transfer funds that the
payroll taxes of high-income workers generate to low-income workers when they become sick,
disabled, or unemployed, or when they retire. Because the amount of benefits that low-income
workers will receive will likely exceed past contributions to social insurance funds, payroll taxes
will have to increase in order to keep these insurance schemes viable as numbers of unemployed
workers or pensioners increase. As a result, this component of social insurance programs is the
least market conforming.
Generous social insurance benefits that require relatively high payroll taxes are also less
market conforming than more meager benefits that require relatively low payroll contributions.
Again, while financial pressures on these programs should not require policymakers to slash
benefits to fractions of their previous levels, modest reductions in the replacement rates of these
benefits in the face of high rates of unemployment and growing numbers of pensioners would
forestall dramatic increases in employer payroll contributions.
Some might argue that policymakers in countries facing financial pressures on their
social insurance programs should be forced to adopt more market conforming criteria for their
social insurance programs. Such reforms would reduce aggregate expenditures, but they would
also compromise relationships between citizens, the market, and the state that have been long
established in countries in which left-wing and Christian Democratic parties control government.
In contrast, I argue that policymakers have at their disposal a wide range of reform options, all of
which would control the growth of aggregate expenditures and obviate significant increases in
employer payroll contributions. So long as the growth of employer payroll taxes and, therefore,
the costs of production are controlled, export industries should regain strength and capital flight
should be less likely.
125
TRADITIONAL PARTISAN VALUES
The comparative literature has produced a host of works discussing the social welfare and
insurance policy preferences of left-wing parties, Christian Democrats, and right-wing parties.
What we know about the most important policy goals of parties and their constituents should
guide their decisions as to which aspects of social insurance programs they will retain while
reforming others in order to mitigate financial pressures on these programs.
Social Democratic parties have traditionally viewed a rather generous basic standard of
living as a right of citizenship (Pontusson 1995; Esping-Andersen 1990). To achieve this end,
social democratic parties support policies aimed at fostering full employment. However, this
basic standard of living is a right earned by virtue of citizenship, and not a privilege earned
through past employment. Therefore, the economic and labor market policies that Social
Democratic parties adopt are also more likely than those policies that other parties adopt to
“bypass” the market in order to counteract inequalities stemming from one’s position in the labor
market. Citizens are granted easy access to a wide range of social welfare and insurance benefits
and services that the government provides directly to them in order to provide this basic standard
of living. These benefits are provided to those who are separated from the labor market for any
reason, as well as for any length of time, and are therefore more redistributive than benefits that
Catholic/Christian Democratic parties (Stephens 1979) and certainly right wing parties provide.
Many states with strong left or Social Democratic traditions have a two tiered old age and
disability pension scheme with a generous flat-rate component that serves to redistribute incomes
(Iversen 1998), as well as an employment-related component that rewards those with long work
histories prior to their departure from the labor market. Some have relatively generous flat-rate
components of sickness and unemployment insurance benefits as well, even for those with short
or sporadic histories of employment and contributions. In other words, eligibility criteria for
benefits are very lenient, in keeping with the guarantee of a minimum standard of living as a
right of citizenship (Wennemo 1992; Palme 1990). It is this guarantee of social rights that
preserve the status of individuals by virtue of their citizenship, and not the generosity of the
benefits, that constitutes the hallmark of welfare state programs that left-wing parties secure.
Members of Christian Democratic parties prefer welfare state programs that foster more
conservative values than do left-wing parties. These programs support the “breadwinner” model
in which the man of the household earns the only income while his wife cares for the home.
126
Christian Democratic (CD) parties also are less inclined than are left-wing parties to bypass
market mechanisms to ensure employment opportunities and redistribute incomes. Therefore,
while CD parties are also associated with relatively high welfare state expenditures, they focus
more on transfer payments that are less redistributive than social welfare, flat-rate social
insurance, and publicly provided services (Wilensky 1985; Castles 1982; Stephens 1979; Esping-
Andersen 1990). These transfer payments generally serve to provide a decent standard of living
when the breadwinner is temporarily separated from the labor market, but they also serve to
replicate earned income inequalities.
Clearly, these CD parties strongly support social insurance benefits for those workers
who are separated from the labor market. Maximum gross replacement rates often exceed the
replacement rates that states with strong left parties grant. The assumption here is that if the sole
income earner is no longer working due to unemployment, sickness, or disability, a substantial
amount of his earnings must be replaced so that he can continue to support his family and
maintain his status. However, these maximum gross replacement rates for social insurance
benefits are awarded only to those who have “earned” them through past employment and
contributions, so the defense of one’s status is not a guarantee of citizenship. Benefits provided
to those with shorter or more sporadic periods of work and contributions are much less generous
than benefits provided to those with maximum contributions. The relatively tight eligibility
criteria that govern the receipt of benefits and the amount of benefits provided are typical of
welfare state programs that CD parties support.
Members of right-wing, economically liberal parties that are more prevalent among
Anglo-Saxon countries believe that individuals should rely on the market not only for their
wages, but also as a source of private insurance or investment to rely upon should their
employment be interrupted for any reason (Iversen 1998; Rhodes 1996; Esping-Andersen 1990).
Certainly, countries with traditionally strong right-wing parties have developed social welfare
and insurance programs beyond the level that this description of them would imply. However, in
countries where right-wing parties are strong, payroll taxes and replacement rates for social
insurance benefits are far below those among countries with strong left or CD parties. These low
levels of payroll taxes and allow individuals to retain larger portions of their earned incomes and,
if they choose, use portions of this earned income to obtain private insurance. As a result, social
insurance benefits are reserved only for those who are unable to rely on the market for their well-
127
being. Additionally, benefits are generally so meager as to render them qualitatively distinct
from the benefits that left and CD parties support. These benefit levels are intended to
discourage potential recipients from too easily relying on these benefits instead of employment
for their livelihood. These aspects of social insurance programs are the mark of right-wing
parties and reflect the values they support.
Secular center parties have not received as much attention in the comparative literature
addressing welfare state development, as have these other three party classifications. While
secular center parties would generally endorse welfare state programs more so than would right-
wing parties, they certainly have not developed distinct commitments to particular aspects of
welfare programs that left and Christian Democratic parties have either. Therefore, I set aside
secular center parties and do not make predictions for the types of reforms of social insurance
programs that they should adopt if these programs face financial pressures to do so. Evidence to
support or refute such predictions would be limited in any case; secular center parties have
enjoyed very little influence in government in most of the states under examination. The
Liberals held a majority of cabinet seats in Canada throughout the 1970s. Several secular center
parties comprised a majority of positions in the Swedish cabinet in the early 1980s, and about
half of positions in the Finnish cabinet throughout the period under examination. Finally, the
Democrats exercised considerable control over policymaking in the U.S. in the late 1970s and
early 1990s.
PREDICTIONS FOR REFORMS BASED ON TRADITIONAL PARTISAN VALUES
Evidence presented in Chapter IV indicate that the social insurance programs in several
of the countries are experiencing financial strain because the numbers of individuals claiming
benefits are growing relative to the numbers of workers whose payroll taxes finance these
benefits. Contrary to the claim that more market conforming social insurance policies must be
adopted, policymakers may alleviate these financial pressures by increasing aggregate social
insurance revenues. They may accomplish this either by increasing payroll tax rates or adopting
policies that will stimulate demand for labor and increase the number of contributors.
Alternatively, they may alleviate financial pressures by decreasing aggregate expenditures. They
may accomplish this either by cutting benefit amounts or tightening eligibility criteria to reduce
the number of benefit recipients. The discussion that follows presents my predictions for which
128

options policymakers representing left-wing, Christian Democratic, and right-wing parties
should choose.
The discussion that follows specifies reform options that parties should choose, and these
options are presented in Figure 2 in Chapter III. Given the values that left wing parties
traditionally uphold, one would not expect recent financial strains on social insurance programs
to cause a tightening of eligibility criteria so as to discriminate among individuals based on their
labor market involvement. For example, we should not expect to see greater penalties, such as
increased waiting days for the receipt of unemployment benefits, or longer periods of
disqualification from receipt of unemployment benefits (Option D). Nor should we expect these
states to cut universal, flat-rate components of benefit calculations more severely than earning-
related components. Doing so would reduce the effective replacement rate for those with short
or sporadic work histories and limited payroll contributions more so than the effective
replacement rate of those with maximum work contributions. Such reforms would significantly
alter the relationships between the state, the market, and the citizenry, granting benefits in
repayment for past contributions, rather than as a right of citizenship.23
Left-wing parties also should not discriminate among programs based on the functions
they serve. For example, unemployment cash benefits should not be targeted more so than old
age pensions, under the assumption that pensioners have “earned” their benefits and the
unemployed have not. Instead, they should spread the burden equally among both contributors
and benefit recipients.
Given the values that left-wing parties support, I predict that states in which these parties
control government are likely to raise employee contributions (but may avoid increases in
employer contributions) and cut earnings-related components of gross replacement rates while
maintaining flat-rate components of these benefits (Options A and C). As a result, no specific
group within the population should be at a greater disadvantage relative to other groups. In other
words, these states should increase employee contributions and institute other reforms that
encourage those workers who can remain in, or return to the labor market, but adequately
provide for those who cannot. Additionally, they may increase the minimum length of time that
one must work and contribute to social insurance schemes in order to receive the maximum gross
replacement rate, so long as the ratio of benefits for those with less than maximum contributions
is preserved (e.g. a 2% reduction in earnings-related benefits per year less than the maximum,
129
but no additional penalty for not achieving the maximum) (Option B). By adopting these
reforms, Social Democratic parties would alleviate financial strains on their states’ social
insurance programs without changing the structure of these programs or limiting access to
benefits, which would compromise the values most important to them.
Left-wing parties should be the slowest of the three party classifications to respond to
economic pressures with reforms of their social insurance programs. This is because any cost-
saving reform will place some sector at a disadvantage relative to others, according to
differences in work history, past wages, or failure to meet other eligibility criteria. In other
words, there are few, if any options that would preserve the status quo relationships between the
state, citizens, and the market. And while any reforms would immediately disadvantage some
members of society, any cost savings reaped may not improve international competitiveness,
unemployment levels, growth rates, in the immediate future. As a result, these parties could be
replaced and benefits reinstated before the economic advantages of reforms are realized.
Contrary to the values of left-wing parties cited above, CD parties favor transfer
payments that award benefits based on past market involvement and contributions, thereby
replicating income inequalities produced in the market. As such, one would not expect these
parties to cut gross replacement rates of earnings-related benefits for those with maximum
contributions, even if such reforms would yield the greatest cost savings (Option B). Instead,
one would expect to find that states with strong CD parties would attempt to preserve relatively
generous benefits for those with established histories of employment and contributions to social
insurance schemes. In order to prevent rising expenditures on social insurance benefits, these
states should tighten eligibility criteria for these benefits. Doing so would increase the number of
workers contributing to these schemes (Option B) and decrease the number of individuals
receiving benefits (Option D). Those states with flat-rate components to their benefits may also
allow the implicit replacement rates of these components to fall (Option C) while maintaining the
explicit replacement rate of earnings-related benefits (e.g. 1.5% of wages for each year of
contributions, up to a maximum of 40 years, or 60%). Doing so may slightly decrease the total
replacement rates for those with maximum contributions, but the reduction would be less severe
than for those with less than maximum contributions.
Options B and D would disqualify very young workers with limited employment history
(and without families) and those older workers with short or sporadic work histories (especially
130
married women). Also, increased waiting days and periods of disqualification should discourage
“frivolous” claims on social insurance programs and encourage a return to the market as soon as
possible. However, neither options B nor D would adversely affect individuals who have
worked for many years and are willing to immediately return to work when an offered
employment. By choosing these reforms, CD parties should be able to address the financial
strains on their states’ social insurance programs while still preserving the values most important
to them. CD parties should also protect all four programs equally, but give priority to earnings-
related components of benefits.
To the extent that CD parties are able to limit reforms to those cited above, they should
respond to economic pressures to reform their programs more quickly than do left-wing parties.
This is because these reforms would still serve the objective of providing relatively generous
benefits to the typical breadwinner with extensive work experience and payroll contributions.
These reforms alone may not suffice to control the growth of aggregate social insurance
expenditures, however, and cutting gross replacement rates of maximum benefits would likely
significantly reduce aggregate expenditures. If reductions in maximum gross replacement rates
are necessary to address substantial financial burdens on social insurance funds, then CD parties
should be slow to respond to these pressures. If countries with strong CD parties do reduce
maximum gross replacement rates, one would expect them to do so only after other reforms are
adopted, and after these economic pressures have persisted for some time.
In states in which right-wing parties have been very influential in formulating social
welfare and insurance policies, faith in market efficiencies and the view that government should
limit its intervention are evident in the roles these policies play. Programs are more targeted for
the poor who have not or cannot support themselves through employment or private insurance
and pensions. Given these values, one would not expect these states to increase employee or
employer contributions to finance greater aggregate expenditures on these programs. Instead,
one would expect states with strong right-wing parties to allow pressures for economic
competitiveness to directly affect benefit recipients. When necessary, reforms should include
reducing gross replacement rates (Option A), increasing the number of waiting days required for
the receipt of benefits, and increasing the period of disqualification for violating eligibility
criteria for the receipt of unemployment cash benefits (Option D). Further, these states should
target unemployment and sickness cash benefits, under the assumption that recipients have not
131

“earned” these targeted benefits, as pensioners have. Finally, these states may adopt reforms that
increase the length of required contributions for one to qualify for benefits, or at least for
maximum benefits, which would reduce the number of claimants on these programs (Option B).
In adopting such reforms, right-wing parties would be able to alleviate financial strains on their
states’ social insurance programs while obviating unpopular increases in employer contributions
that divert earned incomes from private savings and insurance premiums. They should therefore
respond to economic pressures to reform their social insurance programs more quickly than
either left or CD parties. These reforms would reinforce the discipline that the market imposes
on the workforce, in line with their underlying values of individualism and skepticism toward
social solidarity.
In sum, my predictions for the effects of partisan influences on reforms are as follows.
First, of course one would not expect reforms of these programs where no economic incentives
or pressures for reform exist. The literature has shown time and again that purely ideological
reforms of social welfare and insurance programs (e.g. initiated by right-parties) are difficult to
accomplish and therefore unlikely. Second, as indicated in Chapter IV, reforms will be more
likely when political institutions provide policymakers with incentives to act responsibly and
adopt policies aimed at fostering long-term competitiveness and economic growth, even if these
reforms cause short-term financial hardships for social insurance recipients. Third, to the extent
that reforms are adopted, the partisanship of government should influence the character of
reforms. My specific hypotheses are presented below:
1) Social Democratic parties faced with financially strained social insurance programs should be willing to impose direct costs on both employees and benefit recipients. They will choose Options A and C in order to distribute the growing burden of these programs among all citizens, regardless of their labor market involvement. They may also choose Option B by extending contributions periods as long as the ratio of benefits for those with less than maximum contributions remains the same. Both options A and B increase revenues, which reduces pressures to cut benefits.
2) Christian Democratic parties faced with financially strained social insurance programs should choose Options B and D in order to limit access to benefits. Doing so will disqualify workers with short or sporadic work histories from receiving benefits so that generous benefits for those with long histories of employment and contributions can be preserved. They may also allow flat-rate components of benefits to fall while maintaining earnings-related components (Option B) that, in combination with Option B will reduce aggregate expenditures.
132
3) Right wing parties faced with financially strained social insurance programs should be motivated primarily to reduce aggregate expenditures. They should Options C and D in order to reduce aggregate expenditures and obviate increases in either employer or employee payroll contributions and reinforce the discipline of the market 4) Also, left parties will respond less quickly to signs of economic trouble and financial strain, whereas right parties will takes these signs as a pretext to retrenchment. CD parties will respond more quickly than SD parties to adopt reforms that tighten eligibility criteria, but should be much slower than right parties to reduce maximum earnings-related benefits.
SPECIFIC REFORMS OF SOCIAL INSURANCE PROGRAMS
Reductions in gross replacement rates of these benefits were more common than I
expected. These reforms were certainly adopted by left and CD parties more often than the
literature would predict. Also, reforms of eligibility criteria among CD parties were limited by
the fact that these criteria were very tight before reforms were necessary. Still, as the discussion
below will show, there is some evidence that partisan values influenced the types of reforms
chosen when they were financially necessary.
The Influence of Left-Wing Parties
Left-wing parties have been the more dominant than right-wing and Christian Democratic
parties among these fourteen countries. Left parties controlled the cabinets for most of the 24-
year period examined here in Austria, Norway and Sweden (See Table 8). These left-wing
parties controlled government for ten years or more in Denmark, Finland, and Germany through
the mid-1980s, and in France from the mid-1980s to the 1990s. Given the abiding influence that
left-wing parties exercise over the policymaking process in these countries, I expect that reforms
of social insurance policies will conform to the predictions outlined above.
Overview of Programs
Total employer payroll taxes in five of these countries are lower than only Italy; Denmark
has much lower rates of total payroll taxes. These taxes fund very generous benefits for
unemployment and sickness benefits, and old age and disability pensions. Six of the seven
countries in which left-wing parties have been very influential in government provide universal,
133
flat-rate old age and pension benefits. Additionally, four of these countries do not require any
contributions to old age and disability pensions schemes to receive substantial disability benefits.
These countries have among the shortest waiting periods for sickness benefits of among
these fourteen countries. In fact, left-wing parties dominate in four of the six countries not
requiring any waiting periods for sickness benefits. Among the seven countries that do not
require waiting periods for the receipt of unemployment insurance benefits (at least by 1995),
left-wing parties have controlled government for roughly half of these 23 years or more in five of
those countries. Also, these countries have among the shortest periods of disqualification for
quitting work or turning down offers of employment. Given the commitment of left-wing parties
not to discriminate among benefit recipients based on their employment histories or the reasons
for which they are separated from the labor market, these lenient eligibility criteria are expected.
Reforms of Gross Replacement Rates
I predicted that left-wing governments facing financial pressures are likely to reduce
gross replacement rates of benefits, but reductions in benefits for those with less than maximum
contributions should not be more severe than benefits for those with maximum contributions. As
Tables 20, 22, and 24 show, six of those countries in which left-wing parties traditionally control
government reduced maximum gross replacement rates (GRRS) unemployment insurance
benefits, but few reduced GRRs for old age or disability benefits.
Gross replacement rates for unemployment insurance benefits fell in Finland, Denmark,
and Germany in the early 1980s, and France and Sweden from the mid-1980 through the 1990s,
and in Austria in the 1990s. In all six of these countries in which benefits were cut while left-
wing parties controlled government, the ratios of the replacement rates for those with 2/3 of
average earnings and those with average earnings remained constant. These lend support for to
my expectation that left-wing parties would be likely to cut replacement rates for benefits, but to
spread the cuts across all recipients, regardless of past earnings or contributions.
For old age pensions, Norway reduced gross replacement rates in the early 1980s and the
1990s, while France cut GRRs in the mid-1980s and Austria cut GRRs in the 1990s. In Norway
the flat-rate component of old age pensions fell very slightly while the earnings-related
component buoyed maximum GRRs in the early 1980s. However, when replacement rates were
cut again in the 1990s, the flat-rate component remained constant while the replacement rate for
134

maximum benefits fell. In France the replacement rate of flat-rate benefits fell by one percentage
point effective in 1987 while maximum replacement rates remained constant. In Austria, GRRs
for those with half the maximum contributions started to fall in the mid-1980s when the
Socialists controlled government, while GRRs for those with maximum contributions remained
constant. However, the minimum flat-rate benefit was also retained, and even rose slightly in
1993 when maximum GRRs fell. Additionally, the flat-rate component of old age pensions rose
relative to the earnings-related component in Finland effective in 1977, yielding higher adjusted
replacement rates for those with less than maximum contributions. In each of these countries,
cuts in replacement rates for disability pensions mirrored those for old age pensions. Except for
the very slight reduction in minimum flat-rate pensions relative to maximum pensions in France,
these results lend support to my predictions.
Reforms of Eligibility Criteria
In both France and Sweden total employee contributions to all social insurance schemes
increased relative to employer contributions in the late 1980s and early 1990s, respectively. In
Finland employer contributions rose relative to employee contributions in the mid-1970s, but
both have remained constant since then. These policy developments in France and Sweden in
particular reduce the welfare burden on employers, which renders these programs more market
conforming, while imposing costs on employees to keep these benefits programs viable.
Five of the fourteen countries under examination increased the duration that one must
work before becoming unemployed in order to receive maximum replacement rates for
unemployment benefits (Table 21). Of these, left-wing parties controlled government in three
countries when the changes were adopted. The German Social Democrats adopted the reform
that took effect by 1983, the Socialists in France adopted the reform that became effective by
1985, and the Belgian Socialists did the same in 1995. However, both France and Germany
provide relatively generous benefits (through flat-rate components and means-tested
supplements) to those who fail to meet requirements for earnings-related benefits.
Another five countries increased the duration of employment and contributions required
to receive maximum replacement rates for old age pensions, and left-wing parties controlled
government in two of these countries (Table 23). The Labour Party in Norway increased the
duration of contributions required for maximum old age pension benefits 1989 through 1995.
135
An increase in the duration of contributions that started under right-wing Conservatives in
Sweden in the early 1980s continued under the Swedish Social Democrats in the late 1980s.
Increases in the minimum age at which one must retire in order to receive full pension benefits
were also fairly rare, as only three countries instituted such reforms. Of these three, only the
Socialists in France increased the retirement age from 60 to 65 years old effective in 1995.
However, it should be noted that the ratios of GRRs for those without maximum contributions
and those with maximum contributions were maintained in all three of these countries despite
these changes.
Reforms that tightened eligibility criteria unrelated to work history and contributions
were also relatively rare among the countries under observation. The Social Democrats in
Sweden raised the percentage of disability required for one to qualify for maximum disability
pension benefits effective in 1993, one of only two countries to do so (Table 24). Four countries
increased the period for which one is disqualified from receiving unemployment insurance
benefits for voluntarily quitting their jobs or turning down offers of employment. Of these, the
Socialists held a slight majority of cabinet seats over the Christian Democrats, Belgium effective
in 1993. Finally, no left-wing parties instituted or increased waiting periods for the receipt of
unemployment benefits or sickness benefits. In fact, Sweden’s Social Democrats repealed the
waiting period for unemployment insurance benefits effective in 1993. Left-wing parties in
Austria and Norway repealed their waiting period for sickness benefits effective in 1975 and
1979, respectively (Table 25).
In sum, while tightening eligibility criteria was a rare occurrence, left-wing parties
seemed even less likely than other parties to adopt such reforms. These parties were responsible
for less than half of the occurrences of reform, even though they are the most dominant of any of
these classifications of parties throughout the period under examination. Left-wing parties
controlled government in three of the five countries increasing the period of employment
required to qualify for maximum unemployment insurance benefits, but two of the three
provided generous minimum benefits to those not qualified. Additionally, only Belgium’s
Socialists increased the disqualification period for unemployment benefits while left-wing parties
in two countries repealed waiting days. Also, in each case in which left-wing parties increased
the retirement age or the number of years one must work in order to qualify for maximum
replacement rates for old age pensions, flat-rate components of these benefits remained generous
136

for those who failed to meet the new criteria. These policy changes generally support my
predictions that left-wing parties were likely to cut replacement rates increase work requirements
while preserving the gross replacement rates of benefits for those not qualified for maximum
benefits.
However, those left-wing parties that responded to economic pressures with these types
of reforms were quick to do so. When comparing the timing of reforms to the first onset of
economic hardships – as indicated by rising deficits in trade and investment, rising
unemployment rates, and slowed economic growth – these reforms were generally adopted
within a year or two of the onset of these financial pressures. Only one exception to this trend
stands out. Belgium experienced dramatic increases in unemployment rates and substantial
decreases in growth rates in the early 1980s, yet the one reform of eligibility criteria – the
increase in the disqualification period for unemployment benefits – was not adopted until the
early 1990s. So while in general left-wing parties did not seem eager to adopt reforms that
penalized those with limited work histories more so than those with more established work
histories, those parties that did adopt such reforms did so more quickly after the onset of
financial pressures than the current literature would predict.
The Influence of Christian Democrats
Christian Democrats have exercised the most control over the governments of Belgium,
Germany, Italy, and the Netherlands during the period under examination (See Table 8). Given
the enduring influence of Christian Democratic parties in these countries, they should have been
able to exercise the character of reforms of social insurance programs during these periods.
Therefore I expect that, to the extent that reforms are adopted, they are likely to limit the number
of workers qualifying for benefits in order to preserve the amount of benefits awarded to those
with the greatest past contributions.
Overview of Programs
The Netherlands and Germany have among the highest total employee payroll taxes, but
these rates Belgium and Italy are closer to the average for all of the countries included here. In
contrast, while Italy has the highest total employer payroll tax rates, these rates in the other three
countries are closer to the average for all of the countries included here. Given these moderate
137

payroll tax rates, these countries have very tight criteria that determine the receipt of very
generous maximum gross replacement rates. Maximum gross replacement rates for old age
pensions in Italy, Germany, and Belgium are among the highest five rates provided among these
fourteen countries (Table 22). Three of these countries do not have universal, flat-rate
components to their old age and disability pension programs; Italy is the only exception. The
others provide social welfare benefits to those failing to qualify for pensions, but these are not
part of the social insurance programs. Therefore, these very generous replacement rates in
Belgium and Germany are entirely dependent on employment and contributions.
The Netherlands and Belgium have among the greatest number of years of employment
necessary to qualify for maximum replacement rates, at 50 years and 45 years, respectively,
although these requirements in Germany and Italy are just 15 years (Table 23). These longer
required durations are especially noteworthy, given that they do not provide universal, flat-rate
benefits for those who do not meet maximum requirements. Germany and Belgium two of the
four longest contributions periods for maximum unemployment benefits. Additionally, Belgium,
Germany, and Italy are three of the top five longest periods of disqualification for quitting one’s
job or turning down offers of employment.
Reforms of Gross Replacement Rates
In both Belgium and Germany the gross replacement rate for old age and disability
pensions for those with maximum contributions fell in the 1990s (Table 22). And while GRRs
for those with half the maximum contributions also fell, the ratio between those with half and
full contributions was preserved. The GRR for both old age and disability pensions for those
with maximum contributions rose in the Netherlands in 1981, but the GRR for those with half
contributions did not. As a result, after 1981 the ratio of benefits for those with half and full
contributions was not preserved. This policy change is in line with my prediction above.
In contrast, in Italy the flat rate component of both old age and disability benefits (and, as
an extension, the GRR for those with half of max contributions) rose slightly relative to max
contributions in the mid-1970s. However, this contrast only brought the ratio of benefit for those
with half contributions up to half of those with full contributions, so this policy change does not
further redistribute benefits. Gross replacement rates for unemployment benefits fell in Belgium
in the mid-1980s and Germany in the 1990s. In Germany the ratio of replacement rates for those
138

earning average wages and 2/3 average wages was preserved while the replacement rate for those
with average earnings fell faster in Belgium. In the Netherlands, gross replacement rates for
sickness benefits were cut substantially in the 1980s, but not in these other countries (Table 20).
Reforms Eligibility Criteria
Contrary to the hypothesis above, the criteria that determine ones access to old age and
disability benefits did not change very often while Christian Democratic parties controlled
government. Increases in the minimum age at which one can retire and still receive full pension
benefits were rare; only Italy gradually increased this retirement age from 60 to 61 and then 62
from 1991 to 1995 (Table 24). There is tremendous variation across these countries in the
amount of time that one must contribute to receive maximum disability benefits, but none of
these countries lengthened this period. There is also considerable variation across countries in
the degree of disability that is required for receiving maximum disability benefits. Still, twelve
of the fourteen countries made no changes to this policy; among the countries dominated by CD
parties, only Italy increased the disability requirement from 2/3rds to 5/6ths disability beginning in
1983.
Tightening of eligibility criteria for the receipt of maximum unemployment insurance
(UI) cash benefits was slightly more common, as four of these countries adopted these reforms
(Table 21). In two of these countries, CD parties instituted reforms that increased the period of
required employment and payroll contributions to qualify for either short-term or long-term
unemployment insurance cash benefits. These reforms took effect in Germany by 1985 and in
the Netherlands by 1987. Belgium and Germany were two of only four countries to increase the
period of disqualification for violating any of the eligibility criteria that determines one’s access
to unemployment insurance benefits. Belgium increased the duration of its disqualification
period in 1979, and Germany was next in 1985.
In sum, tightening of eligibility criteria was not as common among these fourteen
countries as I expected. Still, CD parties adopted these reforms about as often as left-wing
parties did. Given that CD parties have not controlled government nearly as much as left-wing
parties have (see Table 8), its appears that they were slightly more willing to adopt such reforms
than were left-wing parties. This is especially noteworthy, given that these countries already had
among the more stringent eligibility criteria in the period before reforms were financially
139
motivated. However, these Christian Democratic parties did tend to adopt these reforms soon
after the onset of financial pressures on these programs. Italy may be considered an exception,
as the timing of reforms was either well before, or several years after, the onset of high
unemployment rates and low economic growth in the mid- 1980s.
The Influence of Right-Wing Parties
Right wing parties have exercised considerable control over the governments of Japan,
the United Kingdom, and the United States for many years throughout the period under
examination. Right-wing parties also held majorities of cabinet seats in Canada and Denmark
from the mid-1980s to the end for the period, and in France until 1982 (see Table 8). I expect
that to the extent that right-wing parties in these countries adopt reforms, these reforms should
place the burden of growing expenditures on benefit recipients in order to obviate increases in
payroll taxes.
Overview of Programs
As one would expect, both payroll taxes and social insurance benefits in countries
dominated by right-wing parties are among the lowest of the fourteen countries examined here.
Total employee contributions in Japan and France are fairly high, but these contributions in the
remaining four countries are lower than all others except Finland and Sweden. More notably,
only France has relatively high employer contributions; the remaining five countries in which
right-wing parties have controlled government for many years have the five lowest average rates
of total employer contributions. In short, the social insurance programs in these five countries
place the least burden on employers. Given what the literature tells us about the values of right-
wing parties, these trends are to be expected.
Japan, the U.S., and the U.K. provide lower unemployment insurance benefits than all
other countries included here except Italy (Table 20). Even gross replacement rates for old age
pensions in these six countries are lower than almost all other countries examined here; only
GRRs in the Netherlands are lower than four of these countries. Additionally, three of these
countries have among the longest waiting periods for the receipt of unemployment and sickness
benefits and among the longest periods of disqualification from receiving unemployment
benefits for violating eligibility criteria. Again, given that right-wing parties typically seek to
140
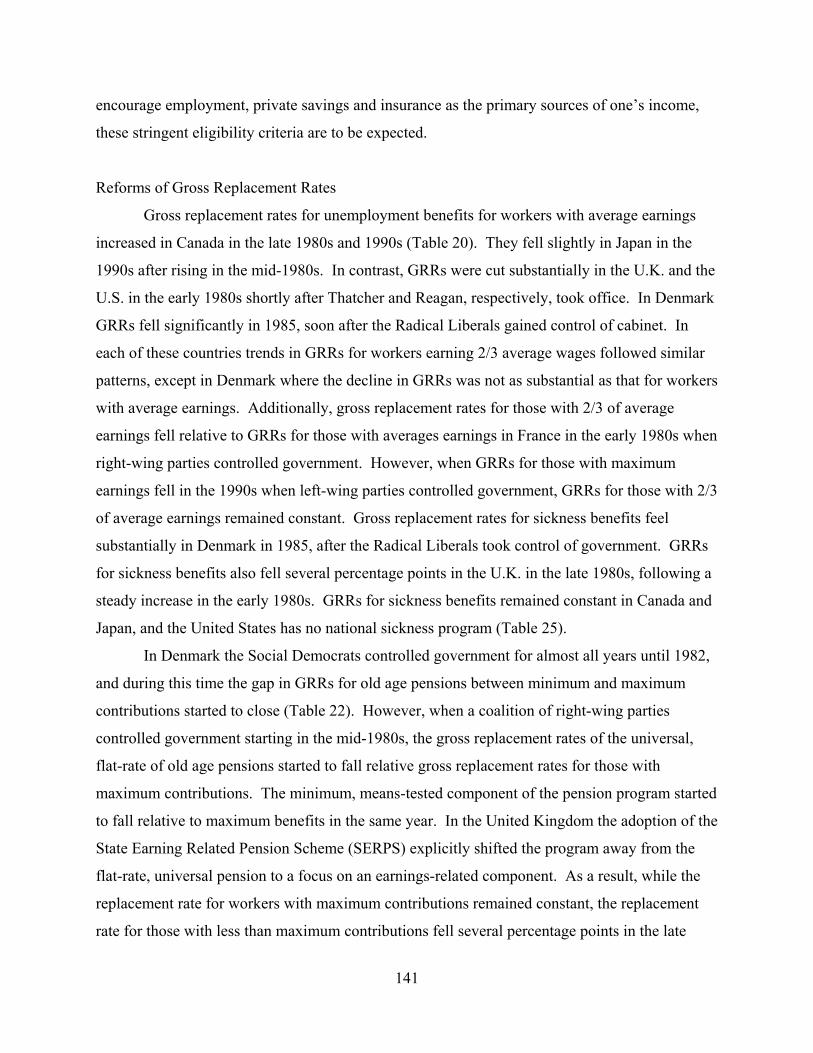
encourage employment, private savings and insurance as the primary sources of one’s income,
these stringent eligibility criteria are to be expected.
Reforms of Gross Replacement Rates
Gross replacement rates for unemployment benefits for workers with average earnings
increased in Canada in the late 1980s and 1990s (Table 20). They fell slightly in Japan in the
1990s after rising in the mid-1980s. In contrast, GRRs were cut substantially in the U.K. and the
U.S. in the early 1980s shortly after Thatcher and Reagan, respectively, took office. In Denmark
GRRs fell significantly in 1985, soon after the Radical Liberals gained control of cabinet. In
each of these countries trends in GRRs for workers earning 2/3 average wages followed similar
patterns, except in Denmark where the decline in GRRs was not as substantial as that for workers
with average earnings. Additionally, gross replacement rates for those with 2/3 of average
earnings fell relative to GRRs for those with averages earnings in France in the early 1980s when
right-wing parties controlled government. However, when GRRs for those with maximum
earnings fell in the 1990s when left-wing parties controlled government, GRRs for those with 2/3
of average earnings remained constant. Gross replacement rates for sickness benefits feel
substantially in Denmark in 1985, after the Radical Liberals took control of government. GRRs
for sickness benefits also fell several percentage points in the U.K. in the late 1980s, following a
steady increase in the early 1980s. GRRs for sickness benefits remained constant in Canada and
Japan, and the United States has no national sickness program (Table 25).
In Denmark the Social Democrats controlled government for almost all years until 1982,
and during this time the gap in GRRs for old age pensions between minimum and maximum
contributions started to close (Table 22). However, when a coalition of right-wing parties
controlled government starting in the mid-1980s, the gross replacement rates of the universal,
flat-rate of old age pensions started to fall relative gross replacement rates for those with
maximum contributions. The minimum, means-tested component of the pension program started
to fall relative to maximum benefits in the same year. In the United Kingdom the adoption of the
State Earning Related Pension Scheme (SERPS) explicitly shifted the program away from the
flat-rate, universal pension to a focus on an earnings-related component. As a result, while the
replacement rate for workers with maximum contributions remained constant, the replacement
rate for those with less than maximum contributions fell several percentage points in the late
141
1980s and 1990s. Japan abolished the flat-rate component of its old age pensions. So while
replacement rates fell for workers with maximum contributions as well, this policy change had a
greater impact on those with minimal contributions who would rely heavily on flat-rate benefits.
Neither Canada nor the U.S. adopted reforms that cut gross replacement rates for old age
pensions. Reforms of disability pensions were similar in all of these countries except the U.S., in
which maximum gross replacement rates for disability pensions fell substantially from the mid-
1980s to the mid-1990s.
Reforms of Eligibility Criteria
As outlined above, one would expect states in which right wing parties dominate to
institute reforms that penalize those receiving benefits (Table 21). This would include increases
in periods of disqualification from receiving UI benefits for either quitting a recent job or turning
down an offer of employment while collecting unemployment insurance benefits. Only four
countries adopted such reforms, and in two of these countries the reforms took effect while right
parties controlled government. Canada increased this period from three weeks to nine and a half
weeks beginning in 1991. The U.K. increased from three weeks to thirteen weeks beginning in
1993. Canada has a relatively generous flat-rate, universal component to its old age pension
benefit, which is earned by virtue of residency in Canada, with 40 years required for the
maximum. The Progressive Conservatives increased the minimum contribution required to
receive earnings-related old age pension to one year, effective 1991.
There is significant variation across countries in the number of weeks required to qualify
for sickness benefits (Table 25). Relatively long periods of employment and contributions
effectively disqualify those workers with short or sporadic work histories. Six countries require
only current coverage in order to qualify for benefits. At the other extreme, Canada and the
United Kingdom are among a few countries that require several months of contributions to
qualify for benefits. Additionally, when the coalition of right wing parties controlled the Danish
cabinet, they increased the number of weeks of required contributions for sickness benefits from
one week to three weeks beginning in 1991. They also increased required disability required to
receive maximum pensions from 50% to 67% effective in 1985.
Although the countries in which right parties exercise considerable influence in
government generally have among the most stringent eligibility criteria, reforms that further
142

tightened these criteria were rare. Four of the fourteen countries increased the duration of
contributions required for maximum old age pension benefits, and in half of these cases right-
wing parties controlled government. The Conservatives in the U.K. increased this period
substantially from 36 years to 49 years, effective 1981, and the Japanese Liberal Democrats
increased this requirement after 1985, and again after 1991. Additionally, the Republicans in the
U.S. adopted reforms that incrementally increased the retirement age starting in 1983.
Six of the fourteen countries have no waiting periods for unemployment insurance cash
benefits (Table 21). Conversely, the waiting periods in Canada (two weeks) and the U.S. (one
week) are the only ones to exceed a few days. Yet while the waiting periods that dominant right-
wing parties produced are the longest of these fourteen countries, they did not increase during
this period. It should be noted that, among the six countries in which right-wing parties
controlled government for extended periods of time, reforms were not financially necessary in
Japan or the U.S. All four of the remaining countries (Canada, Denmark, France, and the U.K.),
reduced gross replacement rates for unemployment benefits, as one would expect based on the
priorities of these parties.
Reforms such as these by right wing parties are to be expected, as they place the burden
of growing financial pressures on benefit recipients themselves. When facing financial pressure
to reform their social insurance programs, right-wing parties should be able to enact such
reforms more easily than left or Christian Democratic parties because these reforms reinforce,
rather than compromise, their traditional values.
As many of the countries in which left-wing parties typically control government also
faced growing financial pressures to reform their social insurance programs, the frequency of
reforms is not surprising. Given that these countries rarely tightened eligibility criteria, it is not
surprising that they cut maximum gross replacement rates of many benefits. However, it is very
noteworthy that most of these parties retained the flat-rate components of their old age pension
benefits as maximum earning-related replacement rates fell. Two tiered pension systems have
always discriminated between benefits recipients based on past employment and contributions,
but generous flat-rate benefits have also ensured the economic well-being of those with limited
work experience. In allowing maximum gross replacement rates to fall while supporting the
replacement rates of flat-rate benefits, these left-wing parties preserved their traditional values
while reducing aggregate expenditures.
143
As indicated above, I was surprised by the frequency with which Christian Democrats cut
earnings-related components of generous gross replacement rates. But again, options to tighten
eligibility criteria were limited by the fact that they were very tight before financial imperatives
for reform set in. Nevertheless, these results do also give support to my arguments that, while
economic pressures have made reforms of these programs necessary and political institutions
make these reforms possible, the character of these reforms tend more often than not to preserve
the dominant values of parties that control government when these reforms are adopted.
144

Table 20: Comparison of Gross Replacement Rates for Unemployment Benefits, Workers with 2/3 Average Wages vs. Average Wages
A * B * C * D * A * B * C * D *
Austria 28.8 34.3 35.5 34.4 21.6 32.8 34.6 32.8
Belgium 59.8 59.2 58.2 56.7 49.5 45.3 41.4 38.0
Canada 65.1 57.8 57.8 57.8 58.9 53.3 57.8 57.8
Denmark 90.0 90.0 89.3 86.2 67.7 69.7 61.0 58.0
Finland 44.5 39.9 59.5 65.4 29.8 26.6 52.9 59.2
France 51.6 58.2 61.2 60.4 43.0 49.9 58.0 56.0
Germany 40.1 40.8 39.1 38.4 38.1 38.1 36.6 36.4
Italy 5.4 2.7 3.8 10.9 3.5 1.8 3.1 10.9
Japan 35.5 27.1 31.8 31.1 35.2 25.0 29.3 29.0
Netherlands 65.0 65.0 70.0 70.0 65.0 65.0 70.0 70.0
Norway 21.6 43.4 61.5 61.5 20.1 42.6 61.5 61.5
Sweden 72.8 90.3 90.8 90.0 55.5 76.4 84.3 80.7
United Kingdom 40.0 36.3 27.9 27.0 28.1 25.8 18.4 18.1
United States 31.6 33.8 30.9 27.6 24.8 26.3 24.3 23.9
C = average for 1985-89, and D = average for 1991-95Definitions of Periods: A = average for 1973-77, B = average for 1979-83,
Gross Replace, Workers with 2/3 Average Wages
Gross Replace, Workers with Average
Wages
145
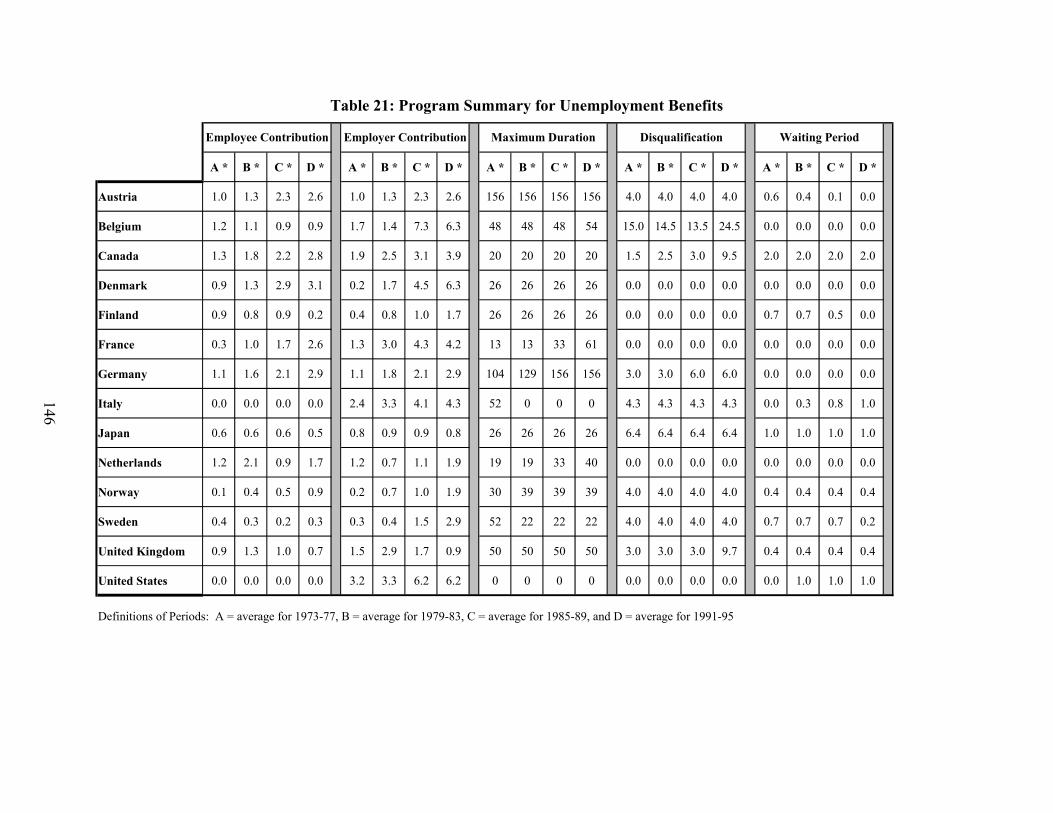
Table 21: Program Summary for Unemployment Benefits
A * B * C * D * A * B * C * D * A * B * C * D * A * B * C * D * A * B * C * D *
Austria 1.0 1.3 2.3 2.6 1.0 1.3 2.3 2.6 156 156 156 156 4.0 4.0 4.0 4.0 0.6 0.4 0.1 0.0
Belgium 1.2 1.1 0.9 0.9 1.7 1.4 7.3 6.3 48 48 48 54 15.0 14.5 13.5 24.5 0.0 0.0 0.0 0.0
Canada 1.3 1.8 2.2 2.8 1.9 2.5 3.1 3.9 20 20 20 20 1.5 2.5 3.0 9.5 2.0 2.0 2.0 2.0
Denmark 0.9 1.3 2.9 3.1 0.2 1.7 4.5 6.3 26 26 26 26 0.0 0.0 0.0 0.0 0.0 0.0 0.0 0.0
Finland 0.9 0.8 0.9 0.2 0.4 0.8 1.0 1.7 26 26 26 26 0.0 0.0 0.0 0.0 0.7 0.7 0.5 0.0
France 0.3 1.0 1.7 2.6 1.3 3.0 4.3 4.2 13 13 33 61 0.0 0.0 0.0 0.0 0.0 0.0 0.0 0.0
Germany 1.1 1.6 2.1 2.9 1.1 1.8 2.1 2.9 104 129 156 156 3.0 3.0 6.0 6.0 0.0 0.0 0.0 0.0
Italy 0.0 0.0 0.0 0.0 2.4 3.3 4.1 4.3 52 0 0 0 4.3 4.3 4.3 4.3 0.0 0.3 0.8 1.0
Japan 0.6 0.6 0.6 0.5 0.8 0.9 0.9 0.8 26 26 26 26 6.4 6.4 6.4 6.4 1.0 1.0 1.0 1.0
Netherlands 1.2 2.1 0.9 1.7 1.2 0.7 1.1 1.9 19 19 33 40 0.0 0.0 0.0 0.0 0.0 0.0 0.0 0.0
Norway 0.1 0.4 0.5 0.9 0.2 0.7 1.0 1.9 30 39 39 39 4.0 4.0 4.0 4.0 0.4 0.4 0.4 0.4
Sweden 0.4 0.3 0.2 0.3 0.3 0.4 1.5 2.9 52 22 22 22 4.0 4.0 4.0 4.0 0.7 0.7 0.7 0.2
United Kingdom 0.9 1.3 1.0 0.7 1.5 2.9 1.7 0.9 50 50 50 50 3.0 3.0 3.0 9.7 0.4 0.4 0.4 0.4
United States 0.0 0.0 0.0 0.0 3.2 3.3 6.2 6.2 0 0 0 0 0.0 0.0 0.0 0.0 0.0 1.0 1.0 1.0
Definitions of Periods: A = average for 1973-77, B = average for 1979-83, C = average for 1985-89, and D = average for 1991-95
Employee Contribution Employer Contribution Maximum Duration Disqualification Waiting Period
146

Table 22: Old Age Pensions, Gross Replacement Rates for Workers with Minimum Contributions, Half of Maximum Contributions, and Maximum Contributions
A * B * C * D * A * B * C * D * A * B * C * D *
Austria 40.0 40.0 40.0 41.3 50.0 50.0 45.2 42.8 79.5 79.5 79.5 79.5
Belgium 0.0 0.0 0.0 0.0 30.0 30.8 31.4 30.4 60.0 61.7 62.7 60.8
Canada 15.0 15.0 15.0 15.0 30.3 25.4 32.3 32.8 34.9 36.5 40.0 40.0
Denmark 29.5 29.9 31.2 31.2 21.1 20.1 22.4 24.9 34.3 32.7 36.0 36.0
Finland 31.2 30.2 28.0 20.5 28.4 37.0 36.1 35.9 60.0 60.0 60.0 60.0
France 14.7 19.6 19.8 18.6 30.9 41.6 46.4 43.6 30.9 42.1 50.0 50.0
Germany 0.0 0.0 0.0 0.0 33.6 34.2 34.3 31.1 68.0 68.0 68.0 61.7
Italy 11.1 12.1 12.7 12.6 41.2 43.3 43.3 43.3 82.3 86.7 86.7 86.7
Japan 3.7 7.0 2.4 0.0 33.8 37.1 25.2 20.0 67.5 74.2 50.4 40.0
Netherlands 0.0 0.0 0.0 0.0 16.5 16.5 16.5 16.5 33.7 36.9 37.8 37.8
Norway 25.0 24.3 20.8 17.5 41.1 41.4 38.5 35.2 58.5 58.5 55.1 53.1
Sweden 21.2 28.5 27.8 28.2 41.8 43.8 42.9 42.0 66.3 67.4 67.0 66.7
United Kingdom 21.1 23.7 21.5 19.5 9.5 11.9 11.2 10.6 21.1 26.2 27.8 29.5
United States 0.0 0.0 0.0 0.0 33.3 33.6 33.9 34.8 44.4 44.8 45.2 46.4
Definitions of Periods: A = average for 1973-77, B = average for 1979-83, C = average for 1985-89, and D = average for 1991-95
Flat Rate w/ Supplement
GRR Half Maximum Contribution
GRR Maximum Contribution
147
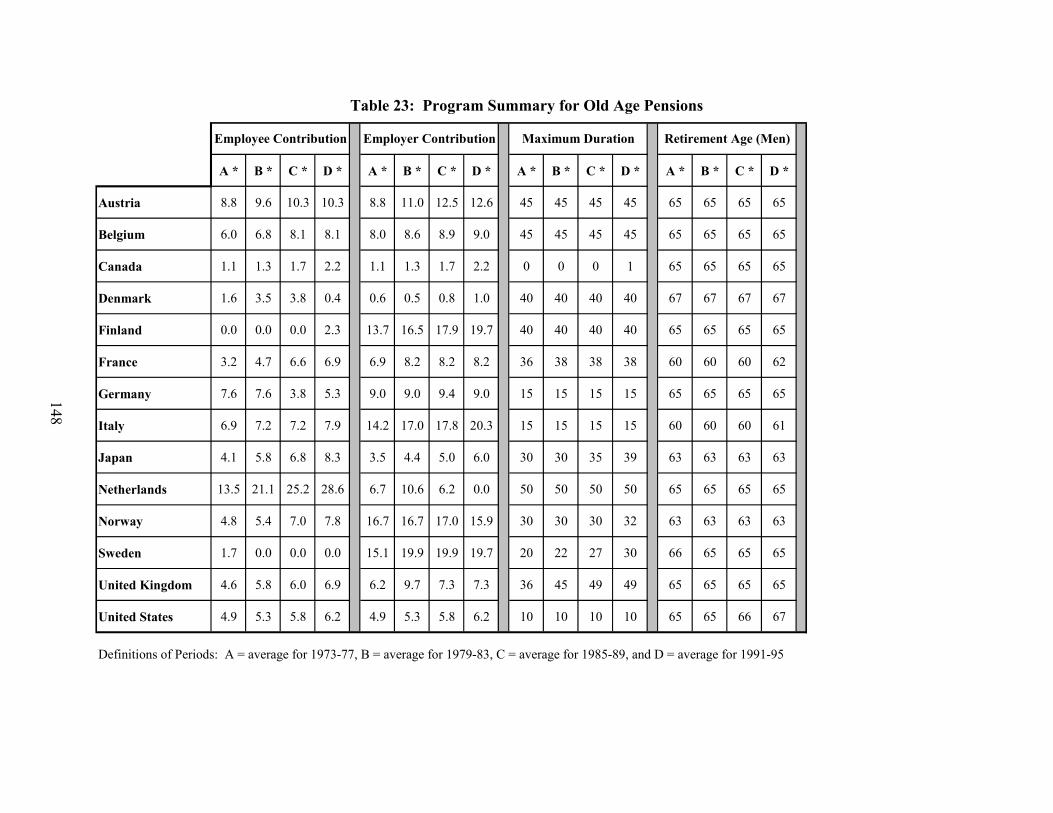
Table 23: Program Summary for Old Age Pensions
A * B * C * D * A * B * C * D * A * B * C * D * A * B * C * D *
Austria 8.8 9.6 10.3 10.3 8.8 11.0 12.5 12.6 45 45 45 45 65 65 65 65
Belgium 6.0 6.8 8.1 8.1 8.0 8.6 8.9 9.0 45 45 45 45 65 65 65 65
Canada 1.1 1.3 1.7 2.2 1.1 1.3 1.7 2.2 0 0 0 1 65 65 65 65
Denmark 1.6 3.5 3.8 0.4 0.6 0.5 0.8 1.0 40 40 40 40 67 67 67 67
Finland 0.0 0.0 0.0 2.3 13.7 16.5 17.9 19.7 40 40 40 40 65 65 65 65
France 3.2 4.7 6.6 6.9 6.9 8.2 8.2 8.2 36 38 38 38 60 60 60 62
Germany 7.6 7.6 3.8 5.3 9.0 9.0 9.4 9.0 15 15 15 15 65 65 65 65
Italy 6.9 7.2 7.2 7.9 14.2 17.0 17.8 20.3 15 15 15 15 60 60 60 61
Japan 4.1 5.8 6.8 8.3 3.5 4.4 5.0 6.0 30 30 35 39 63 63 63 63
Netherlands 13.5 21.1 25.2 28.6 6.7 10.6 6.2 0.0 50 50 50 50 65 65 65 65
Norway 4.8 5.4 7.0 7.8 16.7 16.7 17.0 15.9 30 30 30 32 63 63 63 63
Sweden 1.7 0.0 0.0 0.0 15.1 19.9 19.9 19.7 20 22 27 30 66 65 65 65
United Kingdom 4.6 5.8 6.0 6.9 6.2 9.7 7.3 7.3 36 45 49 49 65 65 65 65
United States 4.9 5.3 5.8 6.2 4.9 5.3 5.8 6.2 10 10 10 10 65 65 66 67
Definitions of Periods: A = average for 1973-77, B = average for 1979-83, C = average for 1985-89, and D = average for 1991-95
Employee Contribution Employer Contribution Maximum Duration Retirement Age (Men)
148

149
Table 24: Program Summary for Disability Pensions
A * B * C * D * A * B * C * D * A * B * C * D * A * B * C * D *
Austria 40.0 40.0 40.0 41.3 79.5 79.5 79.5 79.5 40 40 40 40 50 50 50 50
Belgium 0.0 0.0 0.0 0.0 63.5 65.3 66.8 65.0 0 0 0 0 67 67 67 67
Canada 0.0 0.0 0.0 0.0 19.1 20.4 28.7 31.5 10 8 3 2 100 100 100 100
Denmark 57.6 58.0 59.9 57.7 57.6 58.0 59.9 57.7 0 0 0 0 50 50 67 67
Finland 31.2 30.2 28.0 20.5 60.0 60.0 60.0 60.0 0 0 0 0 100 100 100 100
France 14.7 19.6 19.8 18.6 50.0 50.0 50.0 50.0 0 0 0 0 50 50 50 50
Germany 0.0 0.0 0.0 0.0 67.2 68.3 68.6 62.1 5 5 5 5 75 75 75 75
Italy 11.1 12.1 12.7 12.6 82.3 86.7 86.7 86.7 5 5 5 5 56 67 83 83
Japan 4.6 13.9 4.4 6.8 47.8 42.0 37.0 35.8 7 7 7 7 88 88 88 88
Netherlands 0.0 0.0 0.0 0.0 73.3 45.0 43.3 40.0 0 0 0 0 80 80 80 80
Norway 25.0 24.3 20.8 17.5 59.2 58.3 56.5 53.2 3 3 3 3 100 100 100 100
Sweden 24.7 37.0 37.1 37.2 66.3 67.4 67.0 66.7 3 3 3 3 83 83 83 94
United Kingdom 19.0 21.3 19.8 18.7 19.8 19.7 22.3 21.1 3 1 1 1 100 100 100 100
United States 0.0 0.0 0.0 0.0 44.4 44.4 56.8 51.9 10 10 10 10 100 100 100 100
Definitions of Periods: A = average for 1973-77, B = average for 1979-83, C = average for 1985-89, and D = average for 1991-95
Maximum Duration Percent DisabilityFlat Rate w/ Supplement
GRR Maximum Contribution

Table 25: Program Summary for Sickness Benefits
A * B * C * D * A * B * C * D * A * B * C * D * A * B * C * D * A * B * C * D *
Austria 31.4 36.5 36.5 36.5 3.3 3.2 3.2 3.6 3.3 7.0 7.0 7.4 0.0 0.0 0.0 0.0 1.0 0.0 0.0 0.0
Belgium 62.7 62.6 63.1 63.4 1.1 1.1 1.2 1.2 1.8 1.9 2.3 2.2 0.3 0.3 0.3 0.3 0.0 0.0 0.0 0.0
Canada 17.0 15.4 16.7 16.7 0.8 0.8 0.8 0.8 . . . . . . . . 0.0 0.0 0.0 0.0
Denmark 78.4 82.3 74.4 70.0 0.3 1.0 1.9 1.2 0.0 0.0 0.0 0.0 0.0 0.0 0.0 0.1 0.0 0.0 0.0 0.0
Finland 30.8 35.2 65.9 50.8 0.1 0.1 0.1 0.1 2.0 1.9 1.8 2.8 0.3 0.3 0.3 0.3 7.0 7.0 7.0 8.3
France 50.0 50.0 50.0 50.0 3.8 5.2 5.6 6.8 12.8 13.5 12.6 12.7 . . . . 3.0 3.0 3.0 3.0
Germany 80.8 82.3 82.3 82.3 5.4 6.3 10.3 11.1 5.4 6.4 10.4 11.1 0.0 0.0 0.0 0.0 0.0 0.0 0.0 0.0
Italy 32.0 32.0 32.0 32.0 0.2 0.4 1.0 1.0 10.8 11.5 12.6 10.3 0.0 0.0 0.0 0.0 3.0 3.0 3.0 3.0
Japan 27.7 60.0 60.0 60.0 3.4 4.2 4.2 4.1 3.7 4.2 4.2 4.1 0.0 0.0 0.0 0.0 3.0 3.0 3.0 3.0
Netherlands 80.0 80.0 71.7 70.0 1.2 1.1 1.0 1.1 6.8 5.9 4.8 4.5 0.0 0.0 0.0 0.0 2.0 2.0 2.0 2.0
Norway 29.2 76.2 71.4 90.5 4.2 4.4 3.5 1.4 3.2 3.2 3.2 2.8 0.0 0.0 0.0 0.0 3.0 0.0 0.0 0.0
Sweden 75.4 90.0 90.0 83.3 0.1 0.0 0.0 1.3 6.1 10.2 9.6 8.3 0.0 0.0 0.0 0.0 1.0 1.0 0.7 5.0
United Kingdom 14.2 8.2 11.9 10.0 0.2 0.3 0.3 0.3 0.3 0.4 0.3 0.3 0.5 0.5 0.5 0.5 3.0 3.0 3.0 3.0
United States . . . . . . . . . . . . . . . .
Definitions of Periods: A = average for 1973-77, B = average for 1979-83, C = average for 1985-89, and D = average for 1991-95
Gross Replace Employee Contribution Employer Contribution Maximum Duration Waiting Period
Table 25: Program Summary for Sickness Benefits
150
CHAPTER VI
CONCLUSION
INTRODUCTION
There has been an ongoing debate in the comparative literature in recent years over the
effects of global market integration on the modern welfare state. There is general agreement
among scholars that as patterns of trade and investment change in response to market integration,
many workers in advanced capitalist countries will become unemployed or underemployed as
labor markets adjust to these changes. However, there is considerable disagreement over welfare
state policy responses to this worker dislocation. The compensation thesis posits that
policymakers will provide generous social welfare and insurance benefits to workers as side-
payments to secure their continued support for market integration. In contrast, the efficiency
thesis posits that benefits will have to be cut in order to reduce the welfare burden on owners of
capital and prevent capital flight.
Of course, globalization itself is not “bad” for to the welfare state. Both market
integration and reforms of welfare state programs are the result of the democratic policymaking
process in these countries. Policymakers in many OECD countries began repealing policies that
once protected their industries as evidence of faith in classical economic theory, which dictates
that gains from trade and specialization will maximize exploitation of the world’s resources, and
all countries will benefit. So why are the economies of some OECD countries suffering?
Some scholars argue that worker dislocation in many OECD countries represents a
transitional phase. Many newly industrialized countries (NICs) are producing high quality goods
that compete with those produced in OECD countries in world markets. These NICs are also
attracting foreign direct investment. OECD countries should, and are, shifting to technology and
services that take advantage of skilled labor. Many workers in these OECD countries lack the
skills that our labor markets now demand, and until they gain those skills they will not find long-
term employment. The compensation thesis assumes that market integration has this effect on
the economies of OECD countries. Dislocated workers push for generous social welfare or
insurance benefits as a condition to supporting continued integration.
151

In contrast, the efficiency thesis argues owners of capital are investing outside the OECD
and other countries are importing less from, and exporting more to, OECD countries because our
costs of production are too high. Corporate income taxes and employer payroll taxes comprise a
substantial portion of these costs, and they must be cut in order to restore. The implication is that
leaner welfare state programs are the new reality in competitive world markets.
This issue is important to the study of comparative politics because it appear to raise the
question of whether or not global market integration undermines the autonomy of the nation
state, and the ability of policymakers to serve constituents’ interests. These interests include
both income redistribution and economic growth. I have tried to show here that recent reforms
of social insurance programs should serve constituents’ interests by bolstering demand for labor,
investment, production, and growth in an increasingly competitive world economy.
CONTRADICTIONS IN THE LITERATURE
The compensation thesis claims that domestic political forces can counteract financial
pressures on social welfare and insurance programs stemming from global competition, worker
dislocation, and rising aggregate expenditures. Conversely, the efficiency thesis claims that open
capital markets render all social welfare and insurance programs vulnerable to cuts in order to
prevent the growth of corporate income and payroll taxes that would prompt capital flight.
While both arguments do have their strengths, I have attempted to show in this dissertation that
both theses are oversimplified. Evidence in support of the efficiency thesis is lacking due to
disagreement over three important issues: 1) whether global market integration is linked to rising
unemployment and lagging economic growth in OECD countries; 2) the extent of reforms of
welfare state programs in these countries; and 3) the relationship – if any – between market
integrations and reforms.
Recently, some scholars acknowledging financial pressures on welfare state programs
have produced evidence of limited reforms or “adjustments” of these programs. Yet these
scholars view these financial pressures as the results of changes in domestic demographic and
economic trends, such as the shift from industry to services and aging populations, rather than
global economic trends. Further, several scholars view these financial pressures as temporary;
once labor markets adjust to these changes, governments should be able to reinstate more
generous social welfare and insurance benefits to past levels. But the coincidence of shifting
152

trends in international markets for goods with increasingly mobile capital with reforms of social
insurance programs called for a reexamination of the relationship between the two.
THE CONTRIBUTION OF THIS DISSERTATION
As I argued in Chapter II, early research espousing the compensation thesis did not
address waning competitiveness in export markets. Instead this literature addressed fluctuations
in international demand for a few small countries’ exports that produced short-term bouts of
unemployment (Cameron 1973; Katzenstein 1985). In recent years scholars have extended the
logic of these works to open markets for both goods and capital among all advanced capitalist
countries. The liberalization of policies that once limited international trade and investment in
order to protect domestic industries from international competition has made global market
integration possible. Some scholars have focused on these policies in examining the relationship
between market integration and the welfare state. Others have defined global market integration
as increasing volumes of international trade and investment that the repeal of protectionist
policies has made possible.
In this dissertation I proposed an alternative to both the efficiency thesis and the
compensation thesis. The effect of globalization on welfare states should be mitigated by both
economic and political factors. First, the effects of market openness on the ability to maintain
capital investment, compete in trade, and sustain acceptable levels of production and growth
depend on the competitiveness of domestic industries. I argue that consistent trade and
investment deficits resulting from the combination of market exposure and less competitive
industries are responsible for rising unemployment and slowed economic growth. These trends
are in turn producing financial pressures to reform social insurance programs in some OECD
countries. For this reason, I limited my inquiry to a group of advanced capitalist countries, many
of which are struggling.
But in fact, there is no relationship between market openness and deficits in trade or FDI.
Some of the most “open” OECD countries (as determined by the size of markets for foreign trade
and investment relative to GDP) are thriving by earning trade surpluses and very modest
investment deficits. Unemployment rates are manageable and economic growth is stable. In
contrast, some of the countries in which trade and foreign investment represent smaller portions
of their economic activity, trade and investment deficits are contributing to persistently high rates
153

of unemployment and low rates of economic growth. Therefore, research must focus on cross-
national differences in markets for trade and investment and their effect on the health of their
economies.
By differentiating between “positive” and “negative” trends in trade and investment, I
was able to show statistically significant relationships between these “negative” trends and high
unemployment and low levels of economic growth. As claims on social insurance benefits rise
and aggregate payroll taxes fall, financial pressures on these programs build, creating an
imperative to reform these programs in some way. Therefore, the relationship between global
market integration and reforms of welfare state programs relies heavily on cross-national
differences in competitiveness, which produce differences in unemployment rates, economic
growth rates, and the ability to finance social insurance programs.
However, increasing numbers of constituents are relying on program benefits, so these
programs are still very popular. Therefore, as these reforms must be adopted through the
democratic process, initial resistance to them will slow their adoption. In fact, I agree with much
of the literature, claiming that social insurance benefits should expand in response to worker
dislocation to a point. However, as financial pressures on these programs grow, policymakers
must choose between further increases in employer payroll taxes or cuts in benefits. Given the
need to control production costs, attract capital investment, stimulate demand for labor, and
boost economic growth, I argue that expenditures will have to be cut. This dissertation therefore
refines the efficiency thesis, claiming that the relationship between these trends in trade and
investment and the generosity of social insurance benefits should be curvilinear.
These reforms should be difficult for policymakers to enact even if financial pressures to
do so are strong. Such reforms would produce immediate and significant hardships for those
receiving benefits, while not necessarily realizing economic gains for those contributing to social
insurance schemes. The comparative literature has given much attention to this fact, even
showing that right-wing politicians have had very limited success in reforming costly social
welfare or insurance programs.
I started with the claim that reforms of these programs would slow the growth in payroll
taxes and eventually bolster the competitiveness of industries. This would in turn foster strong
economic growth. Therefore, these reforms represent short-term sacrifices specifically intended
to bring about widespread benefits. The challenge, then, is for policymakers to succeed in
154

making these reforms without prompting electoral backlash. I focused on institutional variables
that would simultaneously provide politicians with the incentives to cooperate with one another
to adopt policy changes, while also allowing them to avoid blame for reforms. In so doing, I
further refine the efficiency thesis claiming that enabling political institutions traditionally
associated with the expansion of welfare state programs should be instrumental in adopting
reforms where necessary. These conclusions directly contradict the bulk of the comparative
literature examining the influence of institutions on welfare state policy development, giving
further support to the view that global market integration has significantly changed the politics of
welfare state policymaking.
By using a quantitative measure of adjusted replacement rates for social insurance
programs, I was able to better test the link between trends in global market integration and policy
reforms. The evidence from my regression analysis shown in Chapter IV showed that the
relationship between trends in globalization and reforms of social insurance programs tend to be
curvilinear. Further, enabling political institutions reinforce, rather than counteract this
relationship.
I also showed that partisanship should play a role in determining the types of reforms that
policymakers choose. The efficiency thesis claims that the threat of capital flight will force all
countries with open markets to curtail welfare state expenditures. Some scholars have applied
this argument in claiming that, if correct, this thesis would also predict a “race to the bottom” or
convergence toward the residualist welfare state model with low taxes and meager, mean-tested
benefit. Those states facing financial pressures should have to reduce aggregate expenditures in
order to forestall increases in payroll taxes that may encourage capital flight. On this point I
agree with the arguments of the efficiency thesis. But I argue that there is no need for
convergence around the residualist model, or even for policymakers to adopt market conforming
policy reforms. Instead, policymakers need only control the growth of expenditures and avoid
substantial increases in payroll taxes. They have a wide range of choices for reform that will
control the growth of aggregate expenditures while still preserving their traditional values.
Benefit replacement rates and aggregate expenditures are not the most important factor
distinguishing between social insurance programs that left-wing parties, Christian Democrats,
and right-wing parties support. In fact, while aggregate expenditures on old age pensions are
lowest (as a percentage of GDP) in those countries in which right-wing parties typically control
155
government, no clear pattern among partisan influence, program type or aggregate expenditures
is evident (OECD expenditure statistics).
It is not generous benefits that distinguish social welfare and insurance programs that
strong left-wing parties have produced; rather, lenient eligibility criteria and relatively generous
universal benefits distinguish these programs. In proving relatively generous benefits even to
those with limited work histories, programs that left-wing parties have traditionally supported
guarantee a decent standard of living as a right of citizenship, rather than a privilege earned
through past employment.
In those countries in which Christian Democratic parties often control government, the
values of gross replacement rates for those with maximum earnings and contributions are not
substantially different from those provide by programs that left-wing parties support. What
distinguishes programs that these parties support is the fact that benefits are closely tied to past
income and contributions, and therefore replicate earned income inequalities. So those with
maximum earnings and contribution do receive very generous incomes, but those with lower
earnings or short or sporadic work histories receive more modest benefits. Eligibility criteria
discourage reliance on benefits if workers can remain active in the labor market. But when
workers reach retirement age or if they are unable to return to employment (due to sickness,
disability, involuntary unemployment), then benefits provided can be very generous.
Finally, social welfare programs that right-wing parties typically support assess low
payroll taxes and award meager, often means-tested benefits. These benefit levels are meant to
discourage reliance on social welfare and insurance, thereby encouraging reliance on wages and
private savings and insurance. Eligibility criteria are often even more stringent than those for
programs that CD parties support, which discourages reliance on benefits, regardless of the
reason for which recipients are inactive in the labor market.
Chapter V presented evidence supporting my claim that cross-national differences in
partisanship yield different choices for reform. Left-wing parties have generally succeeded in
protecting their traditional values when adopting reforms. By cutting maximum gross
replacement rates for benefits but largely preserving flat-rate components of these benefits and
maintaining lenient eligibility criteria, they have also adopted reforms that preserve the status of
citizens regardless of past employment more so than Christian Democratic or right-wing parties
have. Similarly, Christian Democratic parties have maintained very tight eligibility criteria in
156
order to control the growth of aggregate expenditures. They have cut maximum gross
replacement rates more frequently than I predicted, but they did also tend to further tighten
eligibility criteria in some cases in order to forestall more dramatic cuts. Finally, right-wing
parties are able to most easily enact reforms that cut benefits and limit access to benefits because
doing so reflects their conviction that individuals should rely on employment and private
insurance to secure their own economic well-being.
LIMITATIONS OF THIS RESEARCH
The data examined here extend only to 1995 due to limited availability of data on both
intervening political variables and policy outcomes. But as I argued in Chapters One and Two,
globalization still has not yet “happened,” and certainly had not by 1995. The economies of
OECD countries (and certainly non-OECD countries) are still far from integrated. In fact,
domestic pressures are building within some of countries these countries to reinstate protectionist
measures until others repeal theirs. These countries are likely to differ significantly in the future
in the strength of their export markets, their ability to prevent capital flight and attract foreign
capital, and levels of unemployment and economic growth. As deficits in trade and foreign
direct investment continue to rise in some countries, and high rate of unemployment persist,
pressures for reform will grow stronger. Where political conditions are right, these trends may
have prompted reforms beyond those that were included here.
Also, all of the quantitative evidence presented in Chapter IV and most of the evidence in
Chapter V applies only to adjusted replacement rates for those with average earnings and
maximum contributions (e.g. the greatest number of years required to contribute to pension
schemes to qualify for maximum replacement rates). However, there are so many criteria to
qualify for these benefits that reforms may affect workers with different earnings and work
histories much differently than workers with maximum contributions. Future research should
examine the effects that these reforms have on individuals with differing work histories,
employment levels, etc. This research might uncover more pronounced differences in policy
reforms adopted by various parties.
Finally, some scholars have linked trends in globalization, political institutions, and
partisanship to post tax and transfer inequalities, an important line of research. I only examine
social insurance programs because those are the only ones that should be directly affected by
157
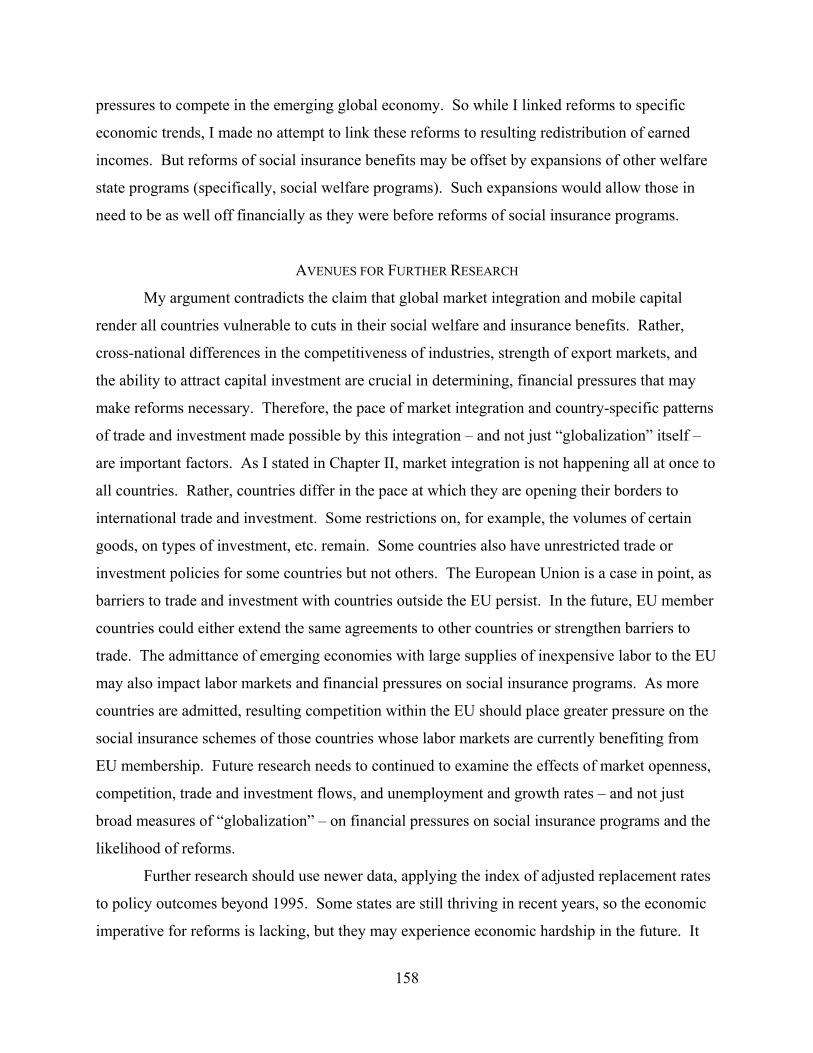
pressures to compete in the emerging global economy. So while I linked reforms to specific
economic trends, I made no attempt to link these reforms to resulting redistribution of earned
incomes. But reforms of social insurance benefits may be offset by expansions of other welfare
state programs (specifically, social welfare programs). Such expansions would allow those in
need to be as well off financially as they were before reforms of social insurance programs.
AVENUES FOR FURTHER RESEARCH
My argument contradicts the claim that global market integration and mobile capital
render all countries vulnerable to cuts in their social welfare and insurance benefits. Rather,
cross-national differences in the competitiveness of industries, strength of export markets, and
the ability to attract capital investment are crucial in determining, financial pressures that may
make reforms necessary. Therefore, the pace of market integration and country-specific patterns
of trade and investment made possible by this integration – and not just “globalization” itself –
are important factors. As I stated in Chapter II, market integration is not happening all at once to
all countries. Rather, countries differ in the pace at which they are opening their borders to
international trade and investment. Some restrictions on, for example, the volumes of certain
goods, on types of investment, etc. remain. Some countries also have unrestricted trade or
investment policies for some countries but not others. The European Union is a case in point, as
barriers to trade and investment with countries outside the EU persist. In the future, EU member
countries could either extend the same agreements to other countries or strengthen barriers to
trade. The admittance of emerging economies with large supplies of inexpensive labor to the EU
may also impact labor markets and financial pressures on social insurance programs. As more
countries are admitted, resulting competition within the EU should place greater pressure on the
social insurance schemes of those countries whose labor markets are currently benefiting from
EU membership. Future research needs to continued to examine the effects of market openness,
competition, trade and investment flows, and unemployment and growth rates – and not just
broad measures of “globalization” – on financial pressures on social insurance programs and the
likelihood of reforms.
Further research should use newer data, applying the index of adjusted replacement rates
to policy outcomes beyond 1995. Some states are still thriving in recent years, so the economic
imperative for reforms is lacking, but they may experience economic hardship in the future. It
158

would be interesting to see if they follow the same path of other countries examined here and
institute reforms in order to control the growth of expenditures.
The dissertation shows that the imperative to reform comes from financial pressures such
as slow growth and high unemployment resulting in part from trade and investment deficits. I do
not address the idea that reforming these programs may render their industries more competitive.
But this is certainly an important question. The economies of several of the states included here
are doing better in recent years. Ratios of imports to total trade and outward FDI to total FDI are
improving, and in some cases unemployment rates are falling. Using newer data would allow for
the examination of whether or not these reforms are associated with economic recovery, or if
economic recovery (regardless of the cause) would allow states to repeal recent reforms,
producing more generous programs once again.
Finally, as NICs continue to gain from trade and grow wealthier, their citizens could call
for more generous social welfare and insurance benefits. Doing so would increase production
costs and may curb the competitiveness of their industries. At the same time, developing
countries may improve their infrastructures and the skills of their laborers, much as the NICs
have done in the past few decades. It will be interesting to see if NICs follow the same path of
expansion and contraction of social insurance that many OECD countries have followed.
In closing, in this dissertation I attempted to show that global market integration has been
an important factor in the development of social insurance policy reforms in recent years. In
those countries whose industries are not competing well in open markets for goods and capital,
high unemployment rates and slow economic growth are creating pressures to reform programs
and forestall increases in employer payroll taxes. But these trends do not in any way indicate
that globalization and the influence granted to owners of capital have tied the hands of
policymakers striving to serve constituents’ interests. Rather, policymakers should choose
reforms specifically to foster stronger economic growth that would benefit virtually all citizens.
Given that such reforms will produce short-terms costs as a means of securing long-term
benefits, political institutions and the incentives they provide are important in determining the
adoption of reforms when they are financially necessary. Additionally, these policymakers have
at their disposal a range of options to control expenditures, many of which will preserve
traditional values. In short, while globalization matters in the development of social insurance
policies, domestic politics still very much matters as well.
159

APPENDIX
Table A-1: Correlations Among Independent Political Variables
Correlations Among Independent Variables
Variable N Mean Std Dev Sum Minimum MaximumLEFT 322 32.79354 38.6141 10560 0 100CENTER 322 15.0705 26.67815 4853 0 100RIGHT 322 34.17391 40.86259 11004 0 100CD 322 17.56832 28.32604 5657 -1 100ENABLE 322 0 0.892 0 -1.52602 1.96999DISABLE 322 0 0.86708 0 -0.71973 1.89015SOC_CORP 308 -0.0045 0.85 -1.38547 -1.33273 1.85022
LEFT CENTER RIGHT CD inclusive DISABLE SOC_CORP-0.24644 -0.60533 -0.25685 0.25494 -0.32237 0.44339
<.0001 <.0001 <.0001 <.0001 <.0001 <.0001322 322 322 322 322 308
-0.29485 -0.18163 -0.16938 0.18656 -0.02246<.0001 0.0011 0.0023 0.0008 0.6946
322 322 322 322 308-0.33504 -0.41726 -0.00124 -0.3965
<.0001 <.0001 0.9823 <.0001322 322 322 308
0.40799 0.27129 -0.02172<.0001 <.0001 0.7042
322 322 308-0.28196 0.61005
<.0001 <.0001322 308
-0.57602<.0001
308
ENABLE
DISABLE
SOC_CORP
LEFT
CENTER
RIGHT
CD
Simple Statistics
Pearson Correlation CoefficientsProb > |r| under H0: Rho=0
Number of Observations
ENABLE = Factor representing Enabling Institutions. DISABLE = Factor representing Disabling Institutions. SOC_CORP = Factor representing Social Corporatism.
160
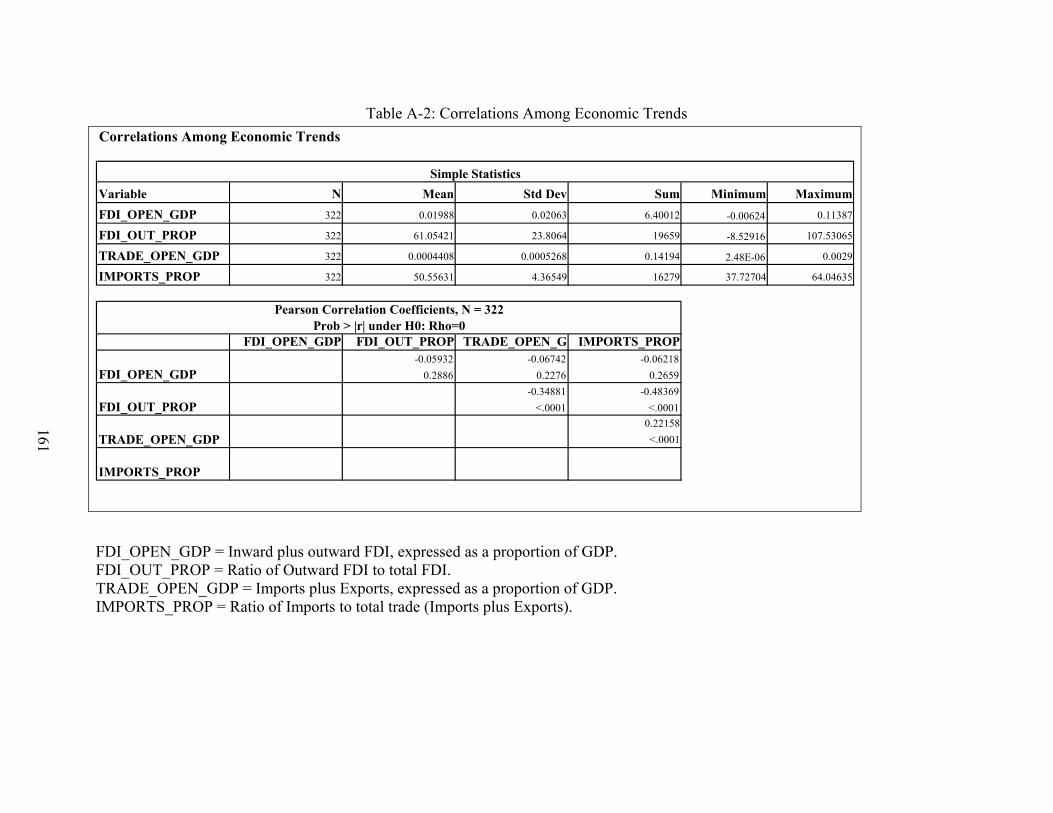
Table A-2: Correlations Among Economic Trends
161
Correlations Among Economic Trends
Variable N Mean Std Dev Sum Minimum MaximumFDI_OPEN_GDP 322 0.01988 0.02063 6.40012 -0.00624 0.11387
FDI_OUT_PROP 322 61.05421 23.8064 19659 -8.52916 107.53065
TRADE_OPEN_GDP 322 0.0004408 0.0005268 0.14194 2.48E-06 0.0029
IMPORTS_PROP 322 50.55631 4.36549 16279 37.72704 64.04635
FDI_OPEN_GDP FDI_OUT_PROP TRADE_OPEN_G IMPORTS_PROP-0.05932 -0.06742 -0.06218
0.2886 0.2276 0.2659-0.34881 -0.48369
<.0001 <.00010.22158<.0001
Simple Statistics
Pearson Correlation Coefficients, N = 322Prob > |r| under H0: Rho=0
FDI_OPEN_GDP
IMPORTS_PROP
FDI_OUT_PROP
TRADE_OPEN_GDP
FDI_OPEN_GDP = Inward plus outward FDI, expressed as a proportion of GDP. FDI_OUT_PROP = Ratio of Outward FDI to total FDI. TRADE_OPEN_GDP = Imports plus Exports, expressed as a proportion of GDP. IMPORTS_PROP = Ratio of Imports to total trade (Imports plus Exports).

162
Figure A-3, Unemployment Cash Benefits, Full Model
Sample: 1975 - 1995 (odd years)Included observations: 11Number of cross-sections used: 14Total panel (balanced) observations: 154
Variable Coefficientt-Statistic
Unemployment Benefits - lagged 0.50 8.20 **Employer's Payroll Tax -0.67 -2.10 **% Workforce Employed in Services 3.11 2.49 **% Workforce Employed in Services - Squared -2.60 -2.53 **Outward FDI - % of Total FDI 0.25 0.70Outward FDI - % of Total FDI - Squared -0.25 -0.79Imports - % of Total Trade 2.89 0.44Imports - % of Total Trade - Squared -3.08 -0.47Enabling Institutions -3.16 -1.81 *Disabling Institutions -1.98 -1.61Social Corporatism 2.08 1.14Employer's Payroll Tax * Enabling Institutions -0.09 -0.61Employer's Payroll Tax * Disabling Institutions -0.12 -0.61Employer's Payroll Tax * Social Corporatism -0.24 -1.88 *Outward FDI - % of Total FDI * Enabling Institutions -0.01 -0.05Outward FDI - % of Total FDI - Squared * Enabling Institutions 0.00 -0.01Outward FDI - % of Total FDI * Disabling Institutions 0.45 1.87 *Outward FDI - % of Total FDI - Squared * Disabling Institutions -0.45 -2.31 **Outward FDI - % of Total FDI * Social Corporatism 0.36 1.12Outward FDI - % of Total FDI - Squared * Social Corporatism -0.34 -1.29Outward FDI - % of Total FDI * Enabling Institutions 12.81 1.84 *Outward FDI - % of Total FDI - Squared * Enabling Institutions -13.03 -1.89 *Outward FDI - % of Total FDI * Disabling Institutions 7.11 1.55Outward FDI - % of Total FDI - Squared * Disabling Institutions -6.91 -1.60Outward FDI - % of Total FDI * Social Corporatism -8.49 -1.16Outward FDI - % of Total FDI - Squared * Social Corporatism 8.55 1.17Christian Democrats 5.18 1.13Left -0.88 -0.30Secular Center 4.37 1.23Employer's Payroll Tax * Christian Democrats 0.51 0.83Employer's Payroll Tax * Left 0.15 0.66Employer's Payroll Tax * Secular Center 0.90 2.77 **Outward FDI - % of Total FDI * Christian Democrats -0.89 -1.29Outward FDI - % of Total FDI - Squared * Christian Democrats 0.70 1.24Outward FDI - % of Total FDI * Left 0.11 0.23Outward FDI - % of Total FDI - Squared * Left 0.02 0.05Outward FDI - % of Total FDI * Secular Center -0.96 -1.44Outward FDI - % of Total FDI - Squared * Secular Center 0.67 1.34Outward FDI - % of Total FDI * Christian Democrats -18.01 -0.99Outward FDI - % of Total FDI - Squared * Christian Democrats 15.83 0.88Outward FDI - % of Total FDI * Left 3.59 0.31Outward FDI - % of Total FDI - Squared * Left -3.94 -0.35Outward FDI - % of Total FDI * Secular Center -15.48 -1.10Outward FDI - % of Total FDI - Squared * Secular Center 14.39 1.04** Significant at .05.* Significant at .10.

Figure A-3, continued
Fixed Effects
Austria -1.36Belgium -1.32Canada -1.33Denmark -1.36Finland -1.38France -1.31Germany -1.21Italy -1.37Japan -1.45Netherlands -1.17Norway -1.36Sweden -1.21United Kingdom -1.57United States -1.28
Weighted Statistics
R-squared 0.99 Mean dependent var 0.47Adjusted R-squared 0.98 S.D. dependent var 0.31S.E. of regression 0.04 Sum squared resid 0.18F-statistic 183.78 Durbin-Watson stat 2.33Prob(F-statistic) 0.00
Unweighted Statistics
R-squared 0.97 Mean dependent var 0.39Adjusted R-squared 0.95 S.D. dependent var 0.21S.E. of regression 0.05 Sum squared resid 0.22Durbin-Watson stat 2.04
163

Figure A-4: Old Age Pension Benefits, Full Model
Sample: 1975 - 1995 (odd years)Included observations: 11Number of cross-sections used: 14Total panel (balanced) observations: 154
Variable Coefficientt-Statistic
Old Age Pensions - lagged 0.51 6.89 **Elderly - % of Population -1.40 -2.44 **Employer's Payroll Tax -0.09 -0.49% Workforce Employed in Services 0.56 0.81% Workforce Employed in Services - Squared -0.48 -0.82Outward FDI - % of Total FDI 0.26 0.91Outward FDI - % of Total FDI - Squared -0.22 -0.90Imports - % of Total Trade 14.76 3.29 **Imports - % of Total Trade - Squared -14.30 -3.21 **Enabling Institutions -0.95 -0.72Disabling Institutions 0.76 0.69Social Corporatism 1.06 0.97Employer's Payroll Tax * Enabling Institutions 0.08 0.69Employer's Payroll Tax * Disabling Institutions -0.07 -0.39Employer's Payroll Tax * Social Corporatism 0.01 0.07Outward FDI - % of Total FDI * Enabling Institutions -0.37 -2.54 **Outward FDI - % of Total FDI - Squared * Enabling Institutions 0.31 2.47 **Outward FDI - % of Total FDI * Disabling Institutions -0.15 -0.62Outward FDI - % of Total FDI - Squared * Disabling Institutions 0.10 0.48Outward FDI - % of Total FDI * Social Corporatism 0.05 0.28Outward FDI - % of Total FDI - Squared * Social Corporatism -0.06 -0.39Outward FDI - % of Total FDI * Enabling Institutions 4.48 0.85Outward FDI - % of Total FDI - Squared * Enabling Institutions -4.85 -0.93Outward FDI - % of Total FDI * Disabling Institutions -3.10 -0.75Outward FDI - % of Total FDI - Squared * Disabling Institutions 2.97 0.75Outward FDI - % of Total FDI * Social Corporatism -4.02 -0.93Outward FDI - % of Total FDI - Squared * Social Corporatism 3.71 0.86Christian Democrats 5.67 1.45Left 2.41 1.48Secular Center 8.34 3.68 **Employer's Payroll Tax * Christian Democrats 0.17 0.42Employer's Payroll Tax * Left 0.24 1.78 *Employer's Payroll Tax * Secular Center 0.16 1.14Outward FDI - % of Total FDI * Christian Democrats 0.48 0.86Outward FDI - % of Total FDI - Squared * Christian Democrats -0.41 -0.82Outward FDI - % of Total FDI * Left -0.37 -1.14Outward FDI - % of Total FDI - Squared * Left 0.27 0.98Outward FDI - % of Total FDI * Secular Center -0.46 -0.93Outward FDI - % of Total FDI - Squared * Secular Center 0.38 1.00Outward FDI - % of Total FDI * Christian Democrats -23.27 -1.52Outward FDI - % of Total FDI - Squared * Christian Democrats 23.27 1.56Outward FDI - % of Total FDI * Left -9.47 -1.47Outward FDI - % of Total FDI - Squared * Left 9.62 1.49Outward FDI - % of Total FDI * Secular Center -32.05 -3.64 **Outward FDI - % of Total FDI - Squared * Secular Center 30.96 3.61 **** Significant at .05.* Significant at .10.
164

Figure A-4, continued
Fixed Effects
Austria -3.63Belgium -3.62Canada -3.70Denmark -3.70Finland -3.63France -3.76Germany -3.35Italy -3.51Japan -3.57Netherlands -3.87Norway -3.68Sweden -3.51United Kingdom -3.99United States -3.53
Weighted Statistics
R-squared 1.00 Mean dependent var 0.61Adjusted R-squared 1.00 S.D. dependent var 0.52S.E. of regression 0.03 Sum squared resid 0.10F-statistic 896.38 Durbin-Watson stat 2.38Prob(F-statistic) 0.00
Unweighted Statistics
R-squared 0.98 Mean dependent var 0.38Adjusted R-squared 0.97 S.D. dependent var 0.22S.E. of regression 0.04 Sum squared resid 0.16Durbin-Watson stat 2.30
165
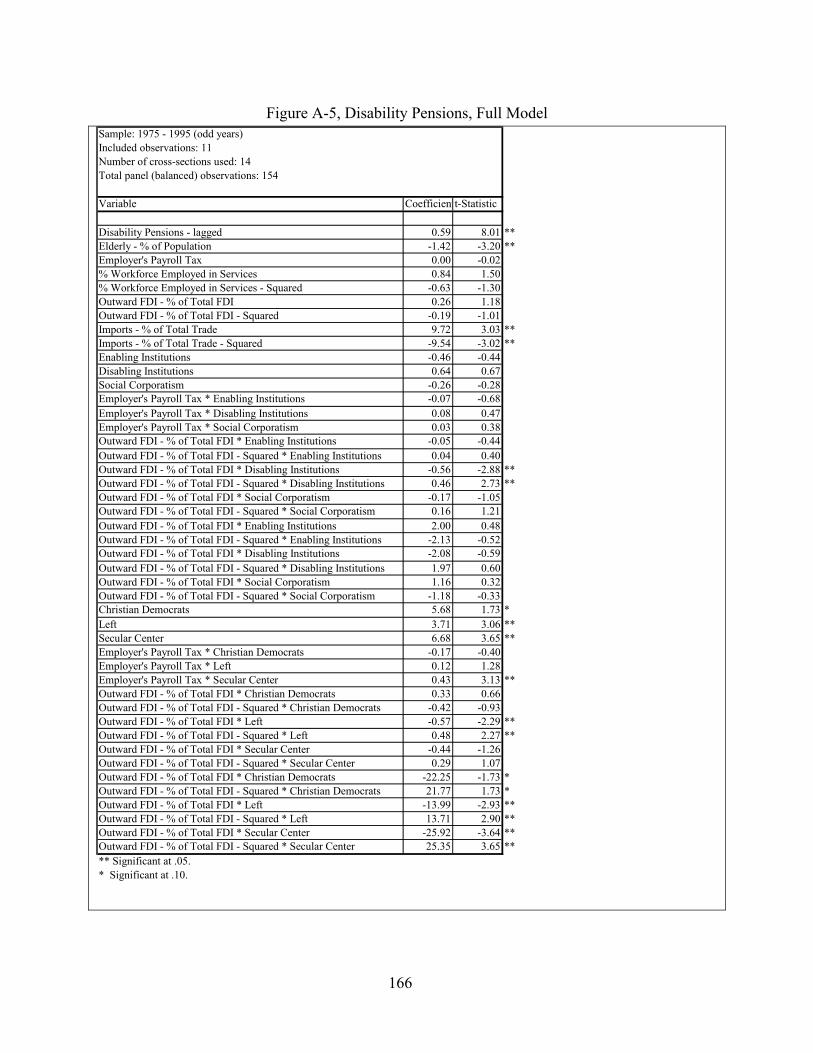
Figure A-5, Disability Pensions, Full Model
Sample: 1975 - 1995 (odd years)Included observations: 11Number of cross-sections used: 14Total panel (balanced) observations: 154
Variable Coefficientt-Statistic
Disability Pensions - lagged 0.59 8.01 **Elderly - % of Population -1.42 -3.20 **Employer's Payroll Tax 0.00 -0.02% Workforce Employed in Services 0.84 1.50% Workforce Employed in Services - Squared -0.63 -1.30Outward FDI - % of Total FDI 0.26 1.18Outward FDI - % of Total FDI - Squared -0.19 -1.01Imports - % of Total Trade 9.72 3.03 **Imports - % of Total Trade - Squared -9.54 -3.02 **Enabling Institutions -0.46 -0.44Disabling Institutions 0.64 0.67Social Corporatism -0.26 -0.28Employer's Payroll Tax * Enabling Institutions -0.07 -0.68Employer's Payroll Tax * Disabling Institutions 0.08 0.47Employer's Payroll Tax * Social Corporatism 0.03 0.38Outward FDI - % of Total FDI * Enabling Institutions -0.05 -0.44Outward FDI - % of Total FDI - Squared * Enabling Institutions 0.04 0.40Outward FDI - % of Total FDI * Disabling Institutions -0.56 -2.88 **Outward FDI - % of Total FDI - Squared * Disabling Institutions 0.46 2.73 **Outward FDI - % of Total FDI * Social Corporatism -0.17 -1.05Outward FDI - % of Total FDI - Squared * Social Corporatism 0.16 1.21Outward FDI - % of Total FDI * Enabling Institutions 2.00 0.48Outward FDI - % of Total FDI - Squared * Enabling Institutions -2.13 -0.52Outward FDI - % of Total FDI * Disabling Institutions -2.08 -0.59Outward FDI - % of Total FDI - Squared * Disabling Institutions 1.97 0.60Outward FDI - % of Total FDI * Social Corporatism 1.16 0.32Outward FDI - % of Total FDI - Squared * Social Corporatism -1.18 -0.33Christian Democrats 5.68 1.73 *Left 3.71 3.06 **Secular Center 6.68 3.65 **Employer's Payroll Tax * Christian Democrats -0.17 -0.40Employer's Payroll Tax * Left 0.12 1.28Employer's Payroll Tax * Secular Center 0.43 3.13 **Outward FDI - % of Total FDI * Christian Democrats 0.33 0.66Outward FDI - % of Total FDI - Squared * Christian Democrats -0.42 -0.93Outward FDI - % of Total FDI * Left -0.57 -2.29 **Outward FDI - % of Total FDI - Squared * Left 0.48 2.27 **Outward FDI - % of Total FDI * Secular Center -0.44 -1.26Outward FDI - % of Total FDI - Squared * Secular Center 0.29 1.07Outward FDI - % of Total FDI * Christian Democrats -22.25 -1.73 *Outward FDI - % of Total FDI - Squared * Christian Democrats 21.77 1.73 *Outward FDI - % of Total FDI * Left -13.99 -2.93 **Outward FDI - % of Total FDI - Squared * Left 13.71 2.90 **Outward FDI - % of Total FDI * Secular Center -25.92 -3.64 **Outward FDI - % of Total FDI - Squared * Secular Center 25.35 3.65 **** Significant at .05.* Significant at .10.
166

Figure A-5, continued
Fixed Effects
Austria -2.42Belgium -2.44Canada -2.53Denmark -2.44Finland -2.44France -2.54Germany -2.28Italy -2.31Japan -2.44Netherlands -2.46Norway -2.41Sweden -2.35United Kingdom -2.62United States -2.41
Weighted Statistics
R-squared 1.00 Mean dependent var 0.82Adjusted R-squared 1.00 S.D. dependent var 0.57S.E. of regression 0.03 Sum squared resid 0.08F-statistic 1271.00 Durbin-Watson stat 2.18Prob(F-statistic) 0.00
Unweighted Statistics
R-squared 0.97 Mean dependent var 0.50Adjusted R-squared 0.94 S.D. dependent var 0.16S.E. of regression 0.04 Sum squared resid 0.14Durbin-Watson stat 1.85
167

Figure A-6: Sickness Benefits, Full Model
Sample: 1975 - 1995 (odd years)Included observations: 11Number of cross-sections used: 13Total panel (balanced) observations: 143
Variable Coefficientt-Statistic
Sickness Benefits - lagged 0.42 5.31 **Employer's Payroll Tax 0.00 -0.01% Workforce Employed in Services 2.66 1.94 *% Workforce Employed in Services - Squared -2.23 -1.98 *Outward FDI - % of Total FDI -0.32 -0.58Outward FDI - % of Total FDI - Squared 0.25 0.55Imports - % of Total Trade -9.30 -0.85Imports - % of Total Trade - Squared 9.56 0.86Enabling Institutions -2.48 -1.08Disabling Institutions 2.40 0.66Social Corporatism 3.44 1.11Employer's Payroll Tax * Enabling Institutions -0.09 -0.59Employer's Payroll Tax * Disabling Institutions 0.15 0.61Employer's Payroll Tax * Social Corporatism 0.10 0.70Outward FDI - % of Total FDI * Enabling Institutions 0.60 1.98 *Outward FDI - % of Total FDI - Squared * Enabling Institutions -0.46 -1.70 *Outward FDI - % of Total FDI * Disabling Institutions -0.18 -0.43Outward FDI - % of Total FDI - Squared * Disabling Institutions 0.04 0.13Outward FDI - % of Total FDI * Social Corporatism -0.23 -0.71Outward FDI - % of Total FDI - Squared * Social Corporatism 0.20 0.73Outward FDI - % of Total FDI * Enabling Institutions 8.81 0.96Outward FDI - % of Total FDI - Squared * Enabling Institutions -8.31 -0.91Outward FDI - % of Total FDI * Disabling Institutions -9.13 -0.62Outward FDI - % of Total FDI - Squared * Disabling Institutions 9.15 0.61Outward FDI - % of Total FDI * Social Corporatism -12.90 -1.05Outward FDI - % of Total FDI - Squared * Social Corporatism 12.23 1.00Christian Democrats -0.96 -0.13Left 0.20 0.05Secular Center -4.16 -0.61Employer's Payroll Tax * Christian Democrats 0.15 0.22Employer's Payroll Tax * Left -0.35 -1.54Employer's Payroll Tax * Secular Center 0.18 0.53Outward FDI - % of Total FDI * Christian Democrats -0.64 -0.79Outward FDI - % of Total FDI - Squared * Christian Democrats 0.54 0.77Outward FDI - % of Total FDI * Left -0.19 -0.33Outward FDI - % of Total FDI - Squared * Left 0.33 0.64Outward FDI - % of Total FDI * Secular Center 0.70 0.70Outward FDI - % of Total FDI - Squared * Secular Center -0.51 -0.66Outward FDI - % of Total FDI * Christian Democrats 4.65 0.16Outward FDI - % of Total FDI - Squared * Christian Democrats -4.73 -0.16Outward FDI - % of Total FDI * Left 0.08 0.01Outward FDI - % of Total FDI - Squared * Left -0.63 -0.04Outward FDI - % of Total FDI * Secular Center 16.05 0.57Outward FDI - % of Total FDI - Squared * Secular Center -16.51 -0.57** Significant at .05.* Significant at .10.
168

Figure A-6, continued
Fixed Effects
Austria 1.78Belgium 1.89Canada 1.70Denmark 1.99Finland 1.87France 1.92Germany 1.95Italy 1.73Japan 1.87Netherlands 1.97Norway 2.00Sweden 2.03United Kingdom 1.67United States
Weighted Statistics
R-squared 0.99 Mean dependent var 0.74Adjusted R-squared 0.99 S.D. dependent var 0.47S.E. of regression 0.06 Sum squared resid 0.26F-statistic 236.50 Durbin-Watson stat 2.08Prob(F-statistic) 0.00
Unweighted Statistics
R-squared 0.94 Mean dependent var 0.54Adjusted R-squared 0.91 S.D. dependent var 0.26S.E. of regression 0.08 Sum squared resid 0.53Durbin-Watson stat 2.15
169

Figure A-7: Openness and Unemployment Benefits
Sample: 1975 - 1995 (odd years)Included observations: 11Number of cross-sections used: 14Total panel (balanced) observations: 154
Variable Coefficientt-Statistic
Unemployment Cash Benefits - Lagged 0.45 6.62 **Employer's Payroll Tax -0.49 -1.76 *% of Workforce Employed in Services 0.19 1.47Investment Openness 0.01 0.58Trade Openness 1.07 2.54 **Enabling Institutions -0.03 -0.72Disabling Institutions -0.24 -1.72 *Social Corporatism -0.01 -0.45Employer's Payroll Tax * Enabling Institutions 0.07 0.47Employer's Payroll Tax * Disabling Institutions -0.12 -0.72Employer's Payroll Tax * Social Corporatism -0.23 -1.94 *Investment Openness * Enabling Institutions 0.00 0.55Investment Openness * Disabling Institutions 0.00 0.30Investment Openness * Social Corporatism 0.01 1.93 *Trade Openness * Enabling Institutions -0.15 -0.62Trade Openness * Disabling Institutions 1.03 2.18 **Trade Openness * Social Corporatism 0.41 1.61Christian Democrats 0.01 0.07Left 0.15 2.51 **Secular Center 0.02 0.42Employer's Payroll Tax * Christian Democrats 0.29 0.62Employer's Payroll Tax * Left -0.21 -0.96Employer's Payroll Tax * Secular Center 0.60 1.94 *Investment Openness * Christian Democrats -0.01 -0.57Investment Openness * Left -0.01 -1.20Investment Openness * Secular Center -0.03 -1.12Trade Openness * Christian Democrats -0.62 -0.70Trade Openness * Left -1.34 -3.41 **Trade Openness * Secular Center -1.69 -2.55 **** Significant at .05.* Significant at .10.
170
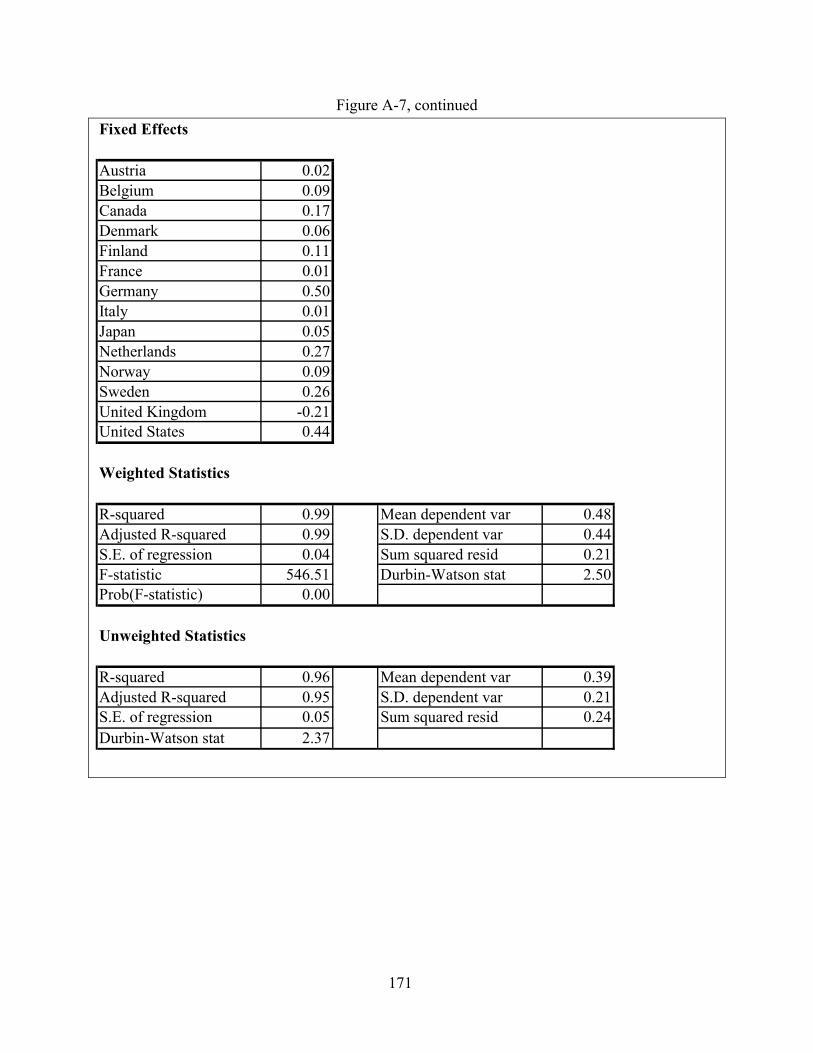
Figure A-7, continued
Fixed Effects
Austria 0.02Belgium 0.09Canada 0.17Denmark 0.06Finland 0.11France 0.01Germany 0.50Italy 0.01Japan 0.05Netherlands 0.27Norway 0.09Sweden 0.26United Kingdom -0.21United States 0.44
Weighted Statistics
R-squared 0.99 Mean dependent var 0.48Adjusted R-squared 0.99 S.D. dependent var 0.44S.E. of regression 0.04 Sum squared resid 0.21F-statistic 546.51 Durbin-Watson stat 2.50Prob(F-statistic) 0.00
Unweighted Statistics
R-squared 0.96 Mean dependent var 0.39Adjusted R-squared 0.95 S.D. dependent var 0.21S.E. of regression 0.05 Sum squared resid 0.24Durbin-Watson stat 2.37
171

Figure A-8: Openness and Old Age Pensions
Sample: 1975 - 1995 (odd years)Included observations: 11Number of cross-sections used: 14Total panel (balanced) observations: 154
Variable Coefficientt-Statistic
Old Age Pensions - Lagged 0.65 9.85 **Elderly - % of Population -1.12 -2.70 **Employer's Payroll Tax -0.08 -0.59% of Workforce Employed in Services 0.03 0.33Investment Openness 0.01 1.36Trade Openness -0.03 -0.11Enabling Institutions -0.04 -1.19Disabling Institutions -0.04 -0.75Social Corporatism -0.03 -1.76 *Employer's Payroll Tax * Enabling Institutions 0.15 1.39Employer's Payroll Tax * Disabling Institutions 0.00 -0.01Employer's Payroll Tax * Social Corporatism 0.10 1.72 *Investment Openness * Enabling Institutions 0.00 0.54Investment Openness * Disabling Institutions 0.01 1.67 *Investment Openness * Social Corporatism 0.00 0.45Trade Openness * Enabling Institutions -0.12 -0.79Trade Openness * Disabling Institutions -0.29 -1.26Trade Openness * Social Corporatism 0.04 0.45Christian Democrats 0.15 1.48Left 0.00 0.00Secular Center -0.03 -1.29Employer's Payroll Tax * Christian Democrats -0.38 -0.99Employer's Payroll Tax * Left 0.04 0.37Employer's Payroll Tax * Secular Center 0.10 0.78Investment Openness * Christian Democrats -0.04 -2.88 **Investment Openness * Left 0.00 -0.09Investment Openness * Secular Center 0.01 1.21Trade Openness * Christian Democrats 0.00 -0.01Trade Openness * Left -0.04 -0.20Trade Openness * Secular Center -0.28 -1.15** Significant at .05.* Significant at .10.
172

Figure A-8, continued
Fixed Effects
Austria 0.31Belgium 0.30Canada 0.15Denmark 0.25Finland 0.31France 0.25Germany 0.37Italy 0.38Japan 0.23Netherlands 0.12Norway 0.25Sweden 0.38United Kingdom 0.06United States 0.25
Weighted Statistics
R-squared 1.00 Mean dependent var 0.86Adjusted R-squared 1.00 S.D. dependent var 0.81S.E. of regression 0.04 Sum squared resid 0.16F-statistic 2456.22 Durbin-Watson stat 2.14Prob(F-statistic) 0.00
Unweighted Statistics
R-squared 0.97 Mean dependent var 0.38Adjusted R-squared 0.95 S.D. dependent var 0.22S.E. of regression 0.05 Sum squared resid 0.25Durbin-Watson stat 1.63
173
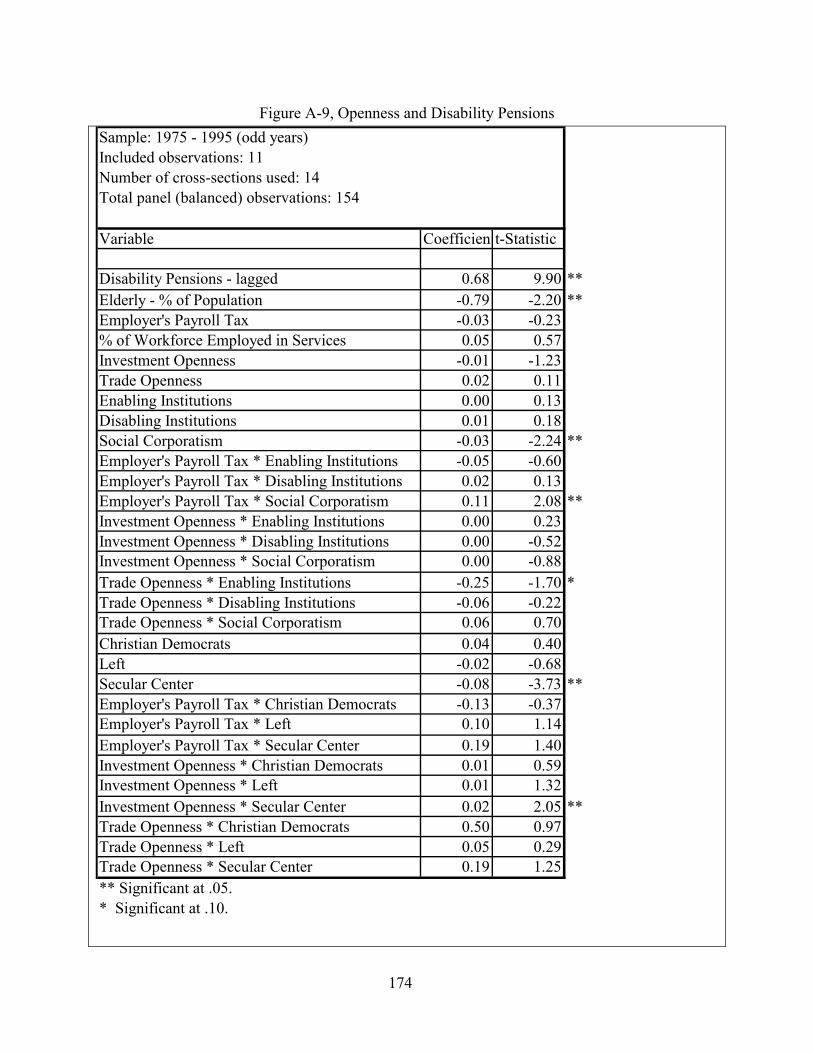
Figure A-9, Openness and Disability Pensions
Sample: 1975 - 1995 (odd years)Included observations: 11Number of cross-sections used: 14Total panel (balanced) observations: 154
Variable Coefficientt-Statistic
Disability Pensions - lagged 0.68 9.90 **Elderly - % of Population -0.79 -2.20 **Employer's Payroll Tax -0.03 -0.23% of Workforce Employed in Services 0.05 0.57Investment Openness -0.01 -1.23Trade Openness 0.02 0.11Enabling Institutions 0.00 0.13Disabling Institutions 0.01 0.18Social Corporatism -0.03 -2.24 **Employer's Payroll Tax * Enabling Institutions -0.05 -0.60Employer's Payroll Tax * Disabling Institutions 0.02 0.13Employer's Payroll Tax * Social Corporatism 0.11 2.08 **Investment Openness * Enabling Institutions 0.00 0.23Investment Openness * Disabling Institutions 0.00 -0.52Investment Openness * Social Corporatism 0.00 -0.88Trade Openness * Enabling Institutions -0.25 -1.70 *Trade Openness * Disabling Institutions -0.06 -0.22Trade Openness * Social Corporatism 0.06 0.70Christian Democrats 0.04 0.40Left -0.02 -0.68Secular Center -0.08 -3.73 **Employer's Payroll Tax * Christian Democrats -0.13 -0.37Employer's Payroll Tax * Left 0.10 1.14Employer's Payroll Tax * Secular Center 0.19 1.40Investment Openness * Christian Democrats 0.01 0.59Investment Openness * Left 0.01 1.32Investment Openness * Secular Center 0.02 2.05 **Trade Openness * Christian Democrats 0.50 0.97Trade Openness * Left 0.05 0.29Trade Openness * Secular Center 0.19 1.25** Significant at .05.* Significant at .10.
174

Figure A-9, continued
Fixed Effects
Austria 0.26Belgium 0.22Canada 0.16Denmark 0.29Finland 0.30France 0.22Germany 0.27Italy 0.33Japan 0.21Netherlands 0.21Norway 0.29Sweden 0.36United Kingdom 0.17United States 0.19
Weighted Statistics
R-squared 1.00 Mean dependent var 0.99Adjusted R-squared 1.00 S.D. dependent var 0.79S.E. of regression 0.03 Sum squared resid 0.12F-statistic 2971.43 Durbin-Watson stat 2.08Prob(F-statistic) 0.00
Unweighted Statistics
R-squared 0.96 Mean dependent var 0.50Adjusted R-squared 0.94 S.D. dependent var 0.16S.E. of regression 0.04 Sum squared resid 0.18Durbin-Watson stat 1.59
175
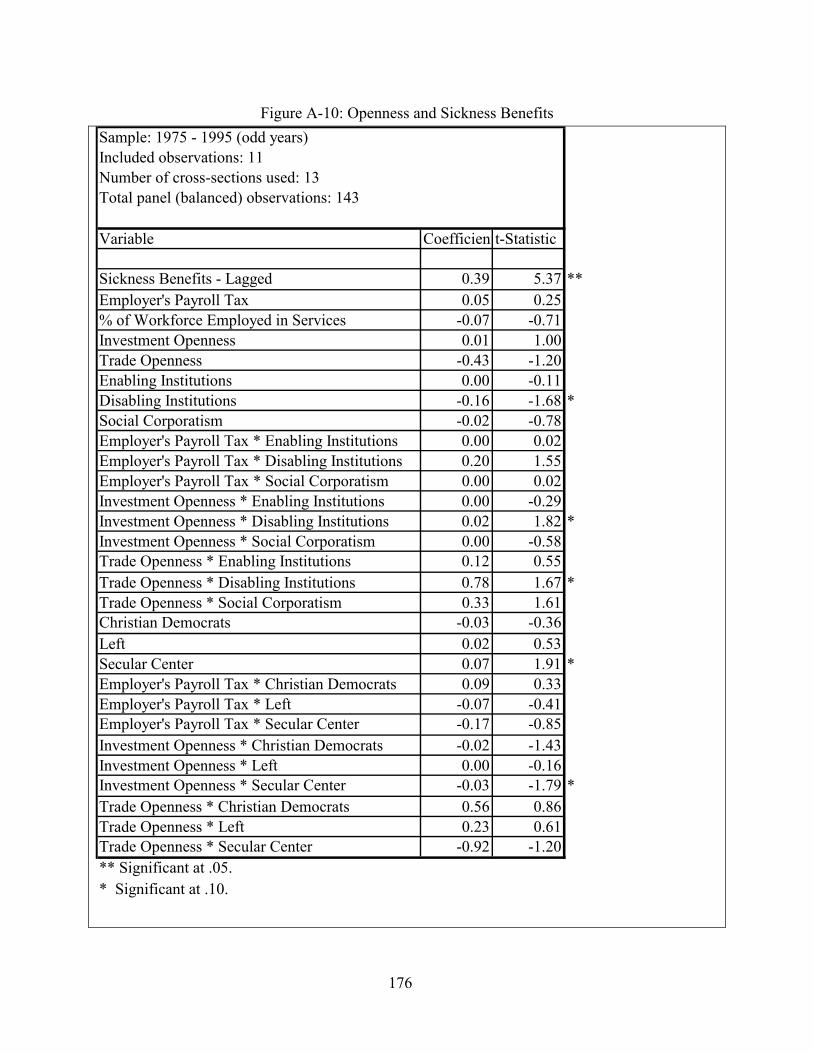
Figure A-10: Openness and Sickness Benefits
Sample: 1975 - 1995 (odd years)Included observations: 11Number of cross-sections used: 13Total panel (balanced) observations: 143
Variable Coefficientt-Statistic
Sickness Benefits - Lagged 0.39 5.37 **Employer's Payroll Tax 0.05 0.25% of Workforce Employed in Services -0.07 -0.71Investment Openness 0.01 1.00Trade Openness -0.43 -1.20Enabling Institutions 0.00 -0.11Disabling Institutions -0.16 -1.68 *Social Corporatism -0.02 -0.78Employer's Payroll Tax * Enabling Institutions 0.00 0.02Employer's Payroll Tax * Disabling Institutions 0.20 1.55Employer's Payroll Tax * Social Corporatism 0.00 0.02Investment Openness * Enabling Institutions 0.00 -0.29Investment Openness * Disabling Institutions 0.02 1.82 *Investment Openness * Social Corporatism 0.00 -0.58Trade Openness * Enabling Institutions 0.12 0.55Trade Openness * Disabling Institutions 0.78 1.67 *Trade Openness * Social Corporatism 0.33 1.61Christian Democrats -0.03 -0.36Left 0.02 0.53Secular Center 0.07 1.91 *Employer's Payroll Tax * Christian Democrats 0.09 0.33Employer's Payroll Tax * Left -0.07 -0.41Employer's Payroll Tax * Secular Center -0.17 -0.85Investment Openness * Christian Democrats -0.02 -1.43Investment Openness * Left 0.00 -0.16Investment Openness * Secular Center -0.03 -1.79 *Trade Openness * Christian Democrats 0.56 0.86Trade Openness * Left 0.23 0.61Trade Openness * Secular Center -0.92 -1.20** Significant at .05.* Significant at .10.
176

Figure A-10, continued
Fixed Effects
AustriaBelgium 0.24Canada 0.42Denmark 0.16Finland 0.45France 0.35Germany 0.25Italy 0.70Japan 0.22Netherlands 0.36Norway 0.52Sweden 0.48United Kingdom 0.58United States 0.00
Weighted Statistics
R-squared 1.00 Mean dependent var 1.10Adjusted R-squared 0.99 S.D. dependent var 0.70S.E. of regression 0.06 Sum squared resid 0.34F-statistic 741.74 Durbin-Watson stat 1.99Prob(F-statistic) 0.00
Unweighted Statistics
R-squared 0.93 Mean dependent var 0.54Adjusted R-squared 0.91 S.D. dependent var 0.26S.E. of regression 0.08 Sum squared resid 0.63Durbin-Watson stat 1.95
177

Figure A-11: Unemployment Benefits – Test for Linear Relationship
Sample: 1975 - 1995 (odd years)Included observations: 11Number of cross-sections used: 14Total panel (balanced) observations: 154
Variable Coefficientt-Statistic
Unemployment Benefits - lagged 0.50 8.62 **Employer's Payroll Tax -0.44 -1.61% Workforce Employed in Services -0.04 -0.33Outward FDI - % of Total FDI -0.01 -0.21Imports - % of Total Trade -0.61 -2.16 **Enabling Institutions 0.03 0.19Disabling Institutions -0.01 -0.05Social Corporatism 0.27 1.58Employer's Payroll Tax * Enabling 0.09 0.74Employer's Payroll Tax * Disabling Institutions -0.08 -0.46Employer's Payroll Tax * Social Corporatism -0.28 -2.46 **Outward FDI - % of Total FDI * Enabling -0.03 -0.55Outward FDI - % of Total FDI * Disabling Institutions -0.06 -1.42Outward FDI - % of Total FDI * Social Corporatism -0.07 -1.23Imports - % of Total Trade * Enabling Institutions -0.11 -0.35Imports - % of Total Trade * Disabling Institutions -0.25 -1.03Imports - % of Total Trade * Social Corporatism -0.31 -1.03Christian Democrats 0.37 0.96Left -0.24 -0.92Secular Center 0.42 1.66Employer's Payroll Tax * Christian Democrats 0.09 0.20Employer's Payroll Tax * Left 0.11 0.52Employer's Payroll Tax * Secular Center 0.78 2.51 **Outward FDI - % of Total FDI * Christian Democrats 0.01 0.07Outward FDI - % of Total FDI * Left 0.19 2.19 **Outward FDI - % of Total FDI * Secular Center -0.08 -0.96Imports - % of Total Trade * Christian Democrats -0.78 -1.17Imports - % of Total Trade * Left 0.27 0.59Imports - % of Total Trade * Secular Center -0.86 -1.79 *** Significant at .05.* Significant at .10.
178

Figure A-11, continued
Fixed Effects
Austria 0.53Belgium 0.61Canada 0.65Denmark 0.53Finland 0.45France 0.53Germany 0.84Italy 0.51Japan 0.47Netherlands 0.74Norway 0.50Sweden 0.63United Kingdom 0.32United States 0.89
Weighted Statistics
R-squared 0.98 Mean dependent var 0.46Adjusted R-squared 0.98 S.D. dependent var 0.30S.E. of regression 0.05 Sum squared resid 0.23F-statistic 239.52 Durbin-Watson stat 2.39Prob(F-statistic) 0.00
Unweighted Statistics
R-squared 0.96 Mean dependent var 0.39Adjusted R-squared 0.94 S.D. dependent var 0.21S.E. of regression 0.05 Sum squared resid 0.26Durbin-Watson stat 1.99
179

Figure A-12: Old Age Pensions – Test for Linear Relationship
Sample: 1975 - 1995 (odd years)Included observations: 11Number of cross-sections used: 14Total panel (balanced) observations: 154
Variable Coefficientt-Statistic
Old Age Pensions - lagged 0.67 9.53 **Elderly - % of Population -1.01 -2.21 **Employer's Payroll Tax -0.17 -0.97% Workforce Employed in Services 0.07 0.68Outward FDI - % of Total FDI 0.01 0.24Imports - % of Total Trade 0.08 0.35Enabling Institutions 0.19 1.31Disabling Institutions 0.16 1.04Social Corporatism 0.11 1.04Employer's Payroll Tax * Enabling 0.04 0.41Employer's Payroll Tax * Disabling Institutions -0.10 -0.58Employer's Payroll Tax * Social Corporatism 0.02 0.23Outward FDI - % of Total FDI * Enabling -0.01 -0.31Outward FDI - % of Total FDI * Disabling Institutions 0.01 0.13Outward FDI - % of Total FDI * Social Corporatism 0.01 0.23Imports - % of Total Trade * Enabling Institutions -0.40 -1.64Imports - % of Total Trade * Disabling Institutions -0.41 -1.51Imports - % of Total Trade * Social Corporatism -0.27 -1.36Christian Democrats -0.44 -1.54Left -0.17 -1.07Secular Center 0.08 0.43Employer's Payroll Tax * Christian Democrats 0.22 0.65Employer's Payroll Tax * Left 0.20 1.57Employer's Payroll Tax * Secular Center 0.09 0.65Outward FDI - % of Total FDI * Christian Democrats 0.01 0.13Outward FDI - % of Total FDI * Left -0.03 -0.57Outward FDI - % of Total FDI * Secular Center 0.01 0.11Imports - % of Total Trade * Christian Democrats 0.82 1.61Imports - % of Total Trade * Left 0.30 1.02Imports - % of Total Trade * Secular Center -0.22 -0.66** Significant at .05.* Significant at .10.
180

Figure A-12, continued
Fixed Effects
Austria 0.21Belgium 0.22Canada 0.11Denmark 0.16Finland 0.23France 0.13Germany 0.35Italy 0.29Japan 0.17Netherlands 0.04Norway 0.19Sweden 0.31United Kingdom -0.05United States 0.22
Weighted Statistics
R-squared 1.00 Mean dependent var 0.63Adjusted R-squared 1.00 S.D. dependent var 0.54S.E. of regression 0.04 Sum squared resid 0.14F-statistic 1230.03 Durbin-Watson stat 2.17Prob(F-statistic) 0.00
Unweighted Statistics
R-squared 0.97 Mean dependent var 0.38Adjusted R-squared 0.96 S.D. dependent var 0.22S.E. of regression 0.05 Sum squared resid 0.23Durbin-Watson stat 1.87
181
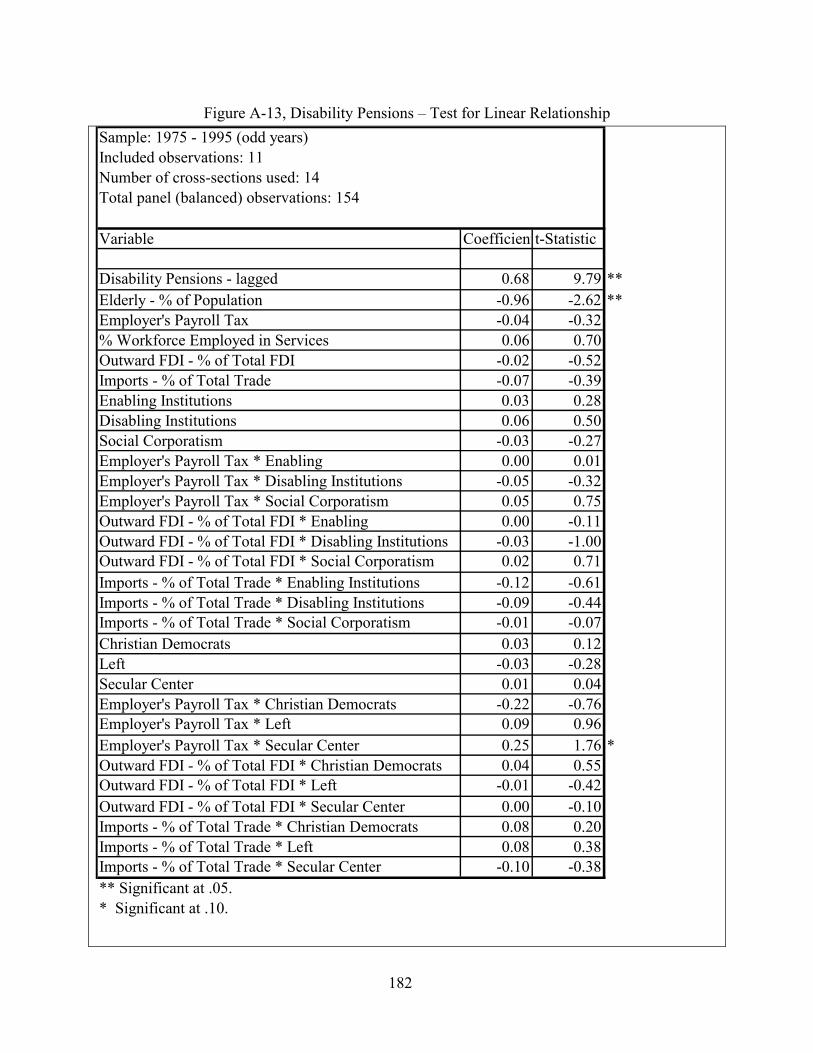
Figure A-13, Disability Pensions – Test for Linear Relationship
Sample: 1975 - 1995 (odd years)Included observations: 11Number of cross-sections used: 14Total panel (balanced) observations: 154
Variable Coefficientt-Statistic
Disability Pensions - lagged 0.68 9.79 **Elderly - % of Population -0.96 -2.62 **Employer's Payroll Tax -0.04 -0.32% Workforce Employed in Services 0.06 0.70Outward FDI - % of Total FDI -0.02 -0.52Imports - % of Total Trade -0.07 -0.39Enabling Institutions 0.03 0.28Disabling Institutions 0.06 0.50Social Corporatism -0.03 -0.27Employer's Payroll Tax * Enabling 0.00 0.01Employer's Payroll Tax * Disabling Institutions -0.05 -0.32Employer's Payroll Tax * Social Corporatism 0.05 0.75Outward FDI - % of Total FDI * Enabling 0.00 -0.11Outward FDI - % of Total FDI * Disabling Institutions -0.03 -1.00Outward FDI - % of Total FDI * Social Corporatism 0.02 0.71Imports - % of Total Trade * Enabling Institutions -0.12 -0.61Imports - % of Total Trade * Disabling Institutions -0.09 -0.44Imports - % of Total Trade * Social Corporatism -0.01 -0.07Christian Democrats 0.03 0.12Left -0.03 -0.28Secular Center 0.01 0.04Employer's Payroll Tax * Christian Democrats -0.22 -0.76Employer's Payroll Tax * Left 0.09 0.96Employer's Payroll Tax * Secular Center 0.25 1.76 *Outward FDI - % of Total FDI * Christian Democrats 0.04 0.55Outward FDI - % of Total FDI * Left -0.01 -0.42Outward FDI - % of Total FDI * Secular Center 0.00 -0.10Imports - % of Total Trade * Christian Democrats 0.08 0.20Imports - % of Total Trade * Left 0.08 0.38Imports - % of Total Trade * Secular Center -0.10 -0.38** Significant at .05.* Significant at .10.
182

Figure A-13, continued
Fixed Effects
Austria 0.31Belgium 0.29Canada 0.18Denmark 0.34Finland 0.34France 0.24Germany 0.36Italy 0.39Japan 0.26Netherlands 0.26Norway 0.34Sweden 0.40United Kingdom 0.16United States 0.23
Weighted Statistics
R-squared 1.00 Mean dependent var 0.80Adjusted R-squared 1.00 S.D. dependent var 0.48S.E. of regression 0.03 Sum squared resid 0.11F-statistic 1273.47 Durbin-Watson stat 1.97Prob(F-statistic) 0.00
Unweighted Statistics
R-squared 0.96 Mean dependent var 0.50Adjusted R-squared 0.94 S.D. dependent var 0.16S.E. of regression 0.04 Sum squared resid 0.17Durbin-Watson stat 1.58
183
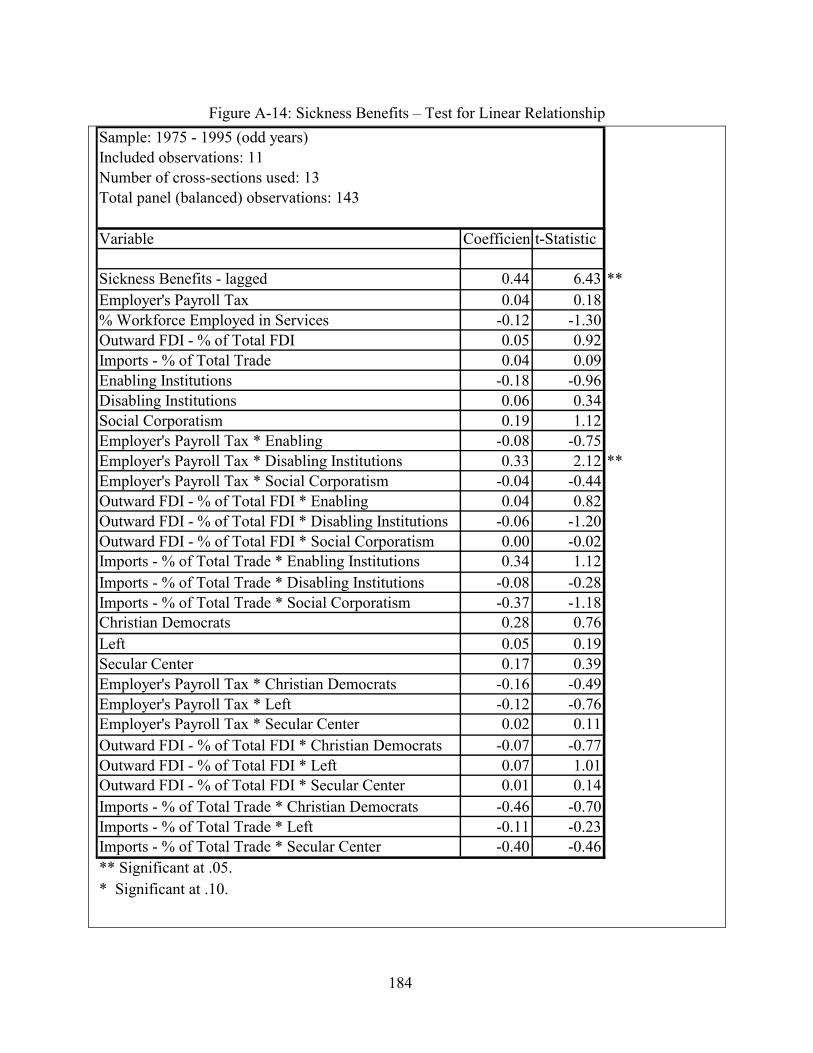
Figure A-14: Sickness Benefits – Test for Linear Relationship
Sample: 1975 - 1995 (odd years)Included observations: 11Number of cross-sections used: 13Total panel (balanced) observations: 143
Variable Coefficientt-Statistic
Sickness Benefits - lagged 0.44 6.43 **Employer's Payroll Tax 0.04 0.18% Workforce Employed in Services -0.12 -1.30Outward FDI - % of Total FDI 0.05 0.92Imports - % of Total Trade 0.04 0.09Enabling Institutions -0.18 -0.96Disabling Institutions 0.06 0.34Social Corporatism 0.19 1.12Employer's Payroll Tax * Enabling -0.08 -0.75Employer's Payroll Tax * Disabling Institutions 0.33 2.12 **Employer's Payroll Tax * Social Corporatism -0.04 -0.44Outward FDI - % of Total FDI * Enabling 0.04 0.82Outward FDI - % of Total FDI * Disabling Institutions -0.06 -1.20Outward FDI - % of Total FDI * Social Corporatism 0.00 -0.02Imports - % of Total Trade * Enabling Institutions 0.34 1.12Imports - % of Total Trade * Disabling Institutions -0.08 -0.28Imports - % of Total Trade * Social Corporatism -0.37 -1.18Christian Democrats 0.28 0.76Left 0.05 0.19Secular Center 0.17 0.39Employer's Payroll Tax * Christian Democrats -0.16 -0.49Employer's Payroll Tax * Left -0.12 -0.76Employer's Payroll Tax * Secular Center 0.02 0.11Outward FDI - % of Total FDI * Christian Democrats -0.07 -0.77Outward FDI - % of Total FDI * Left 0.07 1.01Outward FDI - % of Total FDI * Secular Center 0.01 0.14Imports - % of Total Trade * Christian Democrats -0.46 -0.70Imports - % of Total Trade * Left -0.11 -0.23Imports - % of Total Trade * Secular Center -0.40 -0.46** Significant at .05.* Significant at .10.
184
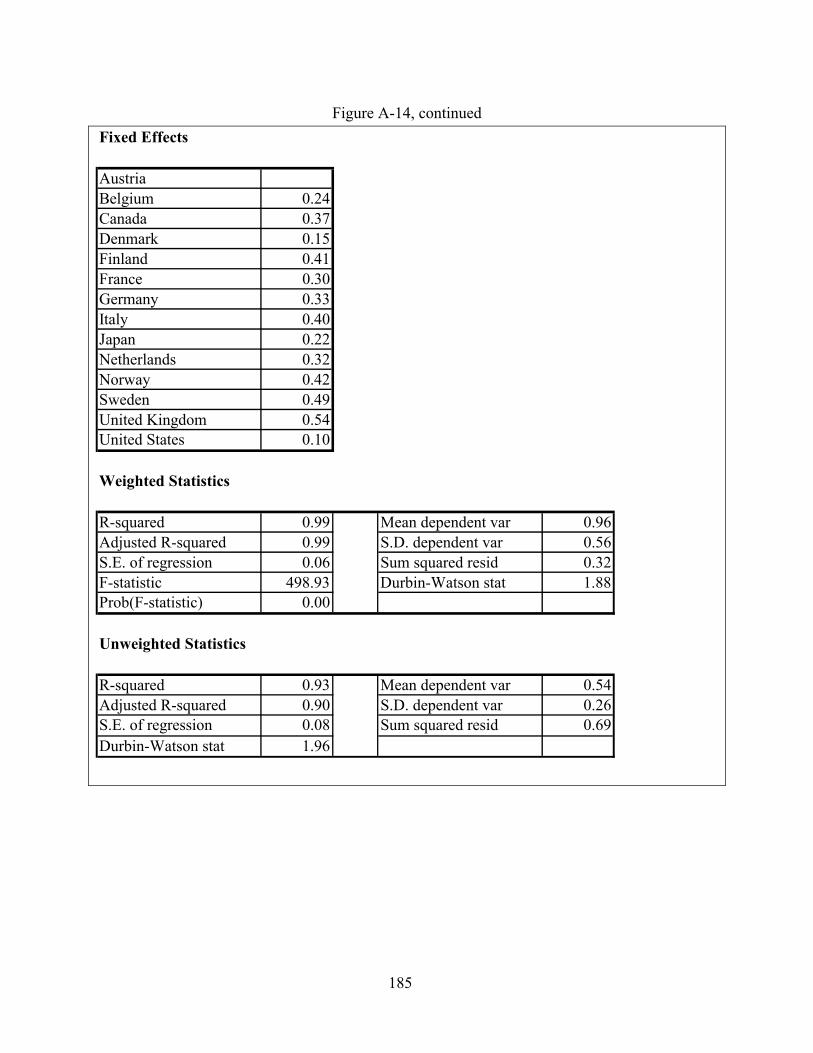
Figure A-14, continued
Fixed Effects
AustriaBelgium 0.24Canada 0.37Denmark 0.15Finland 0.41France 0.30Germany 0.33Italy 0.40Japan 0.22Netherlands 0.32Norway 0.42Sweden 0.49United Kingdom 0.54United States 0.10
Weighted Statistics
R-squared 0.99 Mean dependent var 0.96Adjusted R-squared 0.99 S.D. dependent var 0.56S.E. of regression 0.06 Sum squared resid 0.32F-statistic 498.93 Durbin-Watson stat 1.88Prob(F-statistic) 0.00
Unweighted Statistics
R-squared 0.93 Mean dependent var 0.54Adjusted R-squared 0.90 S.D. dependent var 0.26S.E. of regression 0.08 Sum squared resid 0.69Durbin-Watson stat 1.96
185
BIBLIOGRAPHY
Andrews, David. 1994. “Capital Mobility and State Autonomy: Toward a Structural Theory of International Monetary Relations,” International Studies Quarterly. v38 n3, 193-218 Barr, Nicholas. 1992. “Economic Theory and the Welfare State: A Survey and Interpretation,” Journal of Economic Literature. vol. XXX, pp. 741-82 Bertola, Giuseppi, 1993. “Market Structure and Income Distribution in Endogenous Growth Models,” American Economic Review. 83: 1184-99. Birchfield, Vicki, and Crepaz, Markus, 1998. “The Impact of Constitutional Structures and Collective and Competitive Veto Points on Income Inequality in Industrialized Democracies,” European Journal of Political Research. 34: 175-200. Boix, Charles. 1997. “Political Parties and the Supply Side of the Economy: The Provision of Physical and Human Capital in Advanced Economies, 1960-1990,” American Journal of Political Science, (July) v41n3: 814-845. Cameron, David. 1978. “The Expansion of the Public Economy: A Comparative Analysis.” American Political Science Review. 72: 1243-1261. Castles, Francis. 1982. The Impact of Parties. Beverly Hills, CA: Sage Publications.
Clayton, Richard, and Pontusson, Jonas, 1998. “Welfare-State Retrenchment Revisited: Entitlement Cuts, Public Sector Restructuring, and Inegalitarian Trends in Advanced Capitalist Societies,” World Politics. (October) 51: 67-98. Compston, Hugh. 1997. “Union Power, Policy Making, and Unemployment in Western Europe, 1972-1993,” Comparative Political Studies v30n6: 732-751 Crepaz, Markus, 1998. “Inclusion vs. Exclusion: Political Institutions and the Welfare State.” Comparative Politics. 31:61-80. Esping-Andersen, Gosta. 1996. Welfare States in Transition: National Adaptations in Global Economies. London: Sage Publications. ____________. 1990. The Three Worlds of Welfare Capitalism. Princeton: Princeton University Press. ____________. 1989. “Three Political Economies of the Welfare State,” Canadian Review of Sociology and Anthropology, v26 n1: 10-36. ____________. 1985. Politics Against Markets: The Social Democratic Road to Power Princeton, NJ: Princeton University Press
186
Falkner, Gerda, and Emmerich Talos, 1994. “The Role of the State Within Social Policy,” West European Politics (July 1994) v17n3: 52-76. Flora, P. and Alber, J., 1981. “Modernization, Democratization, and the Development of Welfare States in Europe,” in P. Flora and A. Heidenheimer (eds) The Development of Welfare States in Europe and America. London: Transaction Books. Frieden, Jeffry. 1991. “Invested Interests: The Politics of National Economic Policies in a World of Global Finance,” International Organization. v45 n4: 425-451. Frieden, Jeffry, and Rogowski, Ronald. 1996. in Keohane and Milner (eds) Interntaionalization and Domestic Politics. Cambridge: Cambridge Press. Furniss, Norman and Timothy Tilton, 1977. The Case for the Welfare State. Bloomington: Indiana University Press Garrett, Goeffrey and Deborah Mitchell. 1999. “International Risk and Social Insurance: Reassessing the Globalization-Welfare State Nexus,” The original version of this paper was presented at the 1996 APSA Annual Meeting, August 31-September 2, San Fransisco Garrett, Geoffrey and Lange, Peter. 1996. in Keohane and Milner (eds) Interntaionalization and Domestic Politicis. Cambridge: Cambridge Press. ____________. 1991. “Political Responses to Interdependence: What’s Left for the Left?” International Organization. v45 n4: 539-64. Golden, Miriam; Lange, Peter; and Michael Wallerstein. 1997. "Union Centralization Among Advanced Industrial Societies: An Empirical Study." Dataset available at http://www.shelley.polisci.ucla.edu/data. Goodin, Robert E. 1996. The theory of institutional design New York: Cambridge University Press. Gough, Ian. 1996. “Social Welfare and Competitiveness” New Political Economy v1 n2: 209–32. ____________. The Political Economy of the Welfare State. London : Macmillan Hicks, Alexander. 1999. Social Democracy and Welfare Capitalism in a Century of Income Security Policies. Ithica: Cornell University Press. Hicks, Alexander, and Duane Swank. 1992. “Politics, Institutions, and Welfare Spending in Industrialized Democracies, 1960-1982” American Political ScienceReview 86:658-74.
187
Hicks, Alexander, and Joya Misra. 1993. “Political Resources and the Growth of Welfare in Affluent Capitalist Democracies, 1960-1982,” American Journal of Sociology (Nov.) v99n3: 668-710. Hirst, Paul, and Grahame Thompson. 1999. Globalization in Question : The International Economy and the Possibilities of Governance. Cambridge : Polity Press Huber, Evelyne, and Stephens, John D. 2001. “Welfare State and production Regimes in the Era of Retrenchment,” in Paul Pierson (ed.) The New Politics of the Welfare State. New York: Oxford University Press. pp. 107-145. Dataset available at http://lissy.ceps.lu/compwsp.htm. ____________. 1993. “Political Parties and Public Pensions: A Quantitative Analysis,” Acta Sociologica no. 4: 309-325. Huber, Evelyn, Charles Ragin, and John D. Stephens, 1993. “Social Democracy, Christian Democracy, Constitutional Structure, and the Welfare State,” American Journal of Sociology (Nov.) v99n3: 711-749. Huber, John D. and Powell, G. Bingham, 1994. “Congruence Between Citizens and Policymakers in Two Visions of Democracy,” World Politics, (April) v46 n3: 291-326. Immergut, Ellen M., 1992. Health Politics: Interests and Institutions in Western Europe, Cambridge: Cambridge University Press. International Labor Organization. 1995. World Employment: An ILO Report Iversen, Torben, 1998. "Wage Bargaining, Central Bank Independence, and the Real Effects of Money," International Organization. 52, summer 1998 Iversen, Torben and Thomas Cusack, "The Causes of Welfare State Expansion: Deindustrialization or Globalization?" World Politics. 52, April 2000, 313-349. International Monetary Fund. 1998. International Financial Statistics International Monetary Fund. 1998. Balance of Payments Statistics Yearbook. Jordan, Bill. 1998. The New Politics of Welfare: Social Justice in a Global Context. London: SAGE. Kangas, Olli. 1991. “The Bigger, the Better? On the Dimensions of Welfare State Development: Social Expenditures Versus Social Rights,” Acta Sociologica. v34 n1: 33-44. Katzenstein, Peter. 1985. Small States in World Markets. Ithaca: Cornell University Press. Keohane, Robert O. and Milner, Helen V. 1996. in Keohane and Milner (eds) Interntaionalization and Domestic Politicis. Cambridge: Cambridge Press.
188
Kitschelt, Herbert. 2001. “Partisan Competition and Welfare State Retrenchment: When do Politicians Choose Unpopular Policies?” in Paul Pierson (ed.) The New Politics of the Welfare State. New York: Oxford University Press. pp. 265-302. Korpi, Walter. 1985. “Power Resources Approach vs. Action and Conflict: On Causal and Intentional Explanations in the Study of Power.” Sociological Theory v2 n3:31-35. ____________. 1983. The Democratic Class Struggle. London: Routledge & Kegan Paul. Kurzer, Paulette. 1993. Business and Banking : Political Change and Economic Integration in Western Europe. Ithica: Cornell University Press. ____________. 1991. “The Internationalization of business and domestic class compromises,” West European Politics, v14 n4: 1- 24. Lewis-Beck, Michael. 1988. Economic and Elections: The Major Western Democracies. Ann Arbor: University of Michigan Press. Lijphart, Arend. 1984. Democracies; Patterns of Majoritarian and Consensus Government in Twenty-One Countries. New Haven : Yale University Press. Lijphart, Arend, and Crepaz, Markus. 1991. “Corporatism and Consensus Democracy in Eighteen Countries: Conceptual and Empirical Linkages” British Journal of Political Science, 21:235-246. Lindblom, Charles E., 1977. Politics and Markets. New York : Basic Books. McDermott, C. John and Wescott, Robert F, 1996. “An Empirical Analysis of Fiscal Adjustments,” International Monetary Fund Staff Papers. Mishra, Ramesh, 1993. “Social Policy in the Postmodern World,” in Catherine Jones (ed) New Perspectives on the Welfare State in Europe. London: Routledge. pp. 18-42 ____________. 1990. The Welfare State in Capitalist Society: Policies of Retrenchment and Maintenance in Europe, North America, and Australia. Toronto: University of Toronto Press. ____________. 1984. The Welfare State in Crisis : Social Thought and Social Change. New York : St. Martin's Press. Myles, John. 1989. Old Age in the Welfare State. Lawrence, KS: University Press of Kansas. Moene, Karl O., Robert Flanagan and Michael Wallerstein. 1993. Trade Union Behavior, Pay Bargaining, and Economic Performance. Oxford: Clarendon Press.
189
O’Connor, Julia S. and Olsen, Gregg M. 1998. Power Resources Theory and the Welfare State. Toronto: University of Toronto Press. O’ Connor, Julia S. 1989. “Welfare Expenditures and Policy Orientation in Canada in Comparative Perspective,” Canadian Review of Sociology and Anthropology, v26 n1: 127-150. OECD. 1998. International Direct Investment Statistics Yearbook. Paris: OECD. OECD. 1997. Historical Statistics, 1960 – 1995. Paris: OECD. OECD, 1996a. Growth, Equity, and Distribution. Paris: OECD. OECD, 1996b. Employment Outlook. July, 1996. Paris: OECD. OECD, 1996c. Social Expenditure Statistics of OECD Member Countries. Labour Market and Social Policy Occasional Papers, No. 17. Paris: OECD. OECD, 1994. The OECD Jobs Study: Evidence and Explanations. Paris: OECD. Olsen, Gregg M. 1996. “Re-modelling Sweden: The Rise and Decline of the Comparative Global Economy,” Social Problems, v43 n1:1-20. ____________. 1994. “Locating the Canadian Welfare State: Family Policy and Health Care in Canada, Sweden, and the United States,” The Canadian Journal of Sociology, v19 n1 Olson, Mancur. 1982. The Rise and Decline of Nations : Economic Growth, Stagflation, and Social Rigidities. New Haven : Yale University Press. Palme, Joakim. 1990. Pension Rights in Welfare Capitalism. The Development of Old-Age Pensions in 18 OECD Countries 1930 to 1985. Swedish Institute for Social Research, Stockholm University, Stockholm, Dissertation Series No. 14 Pampel, F. C. and Williamson, J. B. 1989. Age, Class, Politics, and the Welfare State. New York: Cambridge University Press. Persson, Torsten, and Guido Tabellini, 1992. “Is Inequality Harmful for Growth? Theory and Evidence,” University of California at Berkeley, Department of Economics, Berkeley, CA. Processed. Pierson, Paul. 2001. “Post-Industrial Pressures on the Mature Welfare States,” in Paul Pierson (ed.) The New Politics of the Welfare State. New York: Oxford University Press. pp. 80-104. ____________. 2001. “Coping with Permanent Austerity: Welfare State Restructuring in Affluent Democracies,” in Paul Pierson (ed.) The New Politics of the Welfare State. New York: Oxford University Press. pp. 410-456.
190
__________. 1996. “The New Politics of the Welfare State,” World Politics 48 (Jan.) 143-179. ____________. 1994. Dismantling the Welfare State? Reagan, Thatcher, and the Politics of Retrenchment. Cambridge: Cambridge University Press. Pfaller, Alfred, Ian Gough, and Goran Therborn. 1991. Can the Welfare State Compete? London: MacMillan. Pontusson, Jonas, and P. Swenson. 1996. “Labor Markets, Production Strategies, and Wage Bargaining Institutions – the Swedish Employer Offensive in Comparative Perspective,” Comparative Political Studies. 29 (2) 223-250. Pontusson, Jonas. 1995. “Explaining the Decline of European Social Democracy,” World Politics. v47 (July) 495-533. Powell, G. Bingham, and Guy D. Whitten, "A Cross-National Analysis of Economic Voting: Taking Account of the Political Context " American Journal of Political Science 37: 394-414 Quinn, Dennis P. and Carla Inclan, “The Origins of Financial Openness: A Study of Current and Capital Account Liberalization.” American Journal of Political Science. v41 n3. (July) 771-813. Rhodes, Martin. 2001. “The Political Economy of Social Pacts: ‘Competitive Corporatism’ and European Welfare Reform,” in Paul Pierson (ed.) The New Politics of the Welfare State. New York: Oxford University Press. pp. 165-194. ____________. 1998. “Introduction: Europe’s Social Contract under Stress,” in Rhodes, Martin and Yves Meny (eds.). 1998. The Future of the European Welfare State. New York: St. Martin’s Press. ____________. 1996. “Globalization and Western European Welfare States: A Critical Review of Recent Debates,” Journal of European Social Policy. v6 n4: 305 – 327. Rhodes, Martin, and Yves Meny. 1998. The Future of European Welfare. New York: St. Martin’s Press. Rodrik, Dani. 1997. Has Globalization Gone Too Far? Washington, DC: Institute for International Economics. Rogowski, Ronald. 1989. Commerce and Coalitions: How Trade Effects Domestic Political Alliance. Princeton: Princeton University Press. Rothstein, Bo. 1992. “Labour Market Institutions and Working Class Strength,” in Sven Steinmo, Kathleen Thelen, and Frank Longstreth, eds., Structuring Politics: Historical Institutionalism in Comparative Analysis, pp. 33-56 Cambridge: Cambridge University Press.
191
Ruggie, John G. 1983. The Antimonies of Interdependence. New York: Columbia University Press. Social Security Administration. 1997. Social Security Programs Throughout the World. (Washington: US Government Printing Office). Also years 1973, 1975, 1977, 1979, 1981, 1983, 1985, 1987, 1989, 1991, 1993, 1995 Schwartz, Herman. 2001. “Round up the Usual Suspects! Globalization, Domestic Politics, and Welfare State Change,” in Paul Pierson (ed.) The New Politics of the Welfare State. New York: Oxford University Press. pp. 17-44. ____________. 1994. “Small States in Big Trouble: State Reorganization in Australia, Denmark, New Zealand, and Sweden in the 1980s,” World Politics, (July) v46 n4: 527-55. Swank, Duane. 2001. “Political Institutions and Welfare State Restructuring: The Impact of Institutions on Social Policy Change in Developed Democracies,” in Paul Pierson (ed.) The New Politics of the Welfare State. New York: Oxford University Press. pp. 197-237. ____________. 1998. “Global Capital, Democracy, and the Welfare State,” University of California Center for German and European Studies Political Economy of European Integration Working Paper 1.66 ____________. 1992. “Politics and the Structural Dependence of the State in Democratic Capitalist Nations,” American Political Science Review. v86 n1: 38-54. Shugart, Matthew Soberg and John Carey, 1992. Presidents and Assemblies: Constitutional Design and Electoral Dynamics, Cambridge University Press. Taylor-Gooby, Peter. 1996. “Eurosclerosis in European Welfare States: Regime Theory and the Dynamics of Change,” Policy and Politics v4, n3: 109-123. Titmuss, R. 1964. Essays on the Welfare State. London: George, Allen & Unwin. United Nations. 1998. World Investment Report. Weir, Margaret, Ann Shola Orloff, and Theda Skocpol. 1988. "Introduction: Understanding American Social Politics." Pp. 1-37 in Margaret Weir, Ann Shola Orloff, and Theda Skocpol (eds.). The Politics of Social Policy in the United States. Princeton: Princeton University Press. Wennemo, Irene. 1992. “The Development of Family Policy: A Comparison of Family Benefits and Tax Reductions for Families of Eighteen OECD Countries,” Acta Sociologica n3 : 210-217. Wilensky, Harold. 1985. Comparative Social Policy: Theories, Methods, Findings. Berkeley : Institute of International Studies, University of California. ____________. The Welfare State and Equality. Berkeley: U. of CA Press.
192

Danzinger, Sheldon H., Gary Dandefur, and Daniel Weinberg. 1994. Confronting Poverty: Prescriptions for Change. Cambridge: Harvard University Press.
Wilensky, Harold, and C.N. Lebaux. 1964. Industrial Society and Social Welfare. New York: Free Press.
193
NOTES
1 The comparative literature on economic voting has found that voters’ assessments of the health of their national economies are strong determinants of their vote choices (Boix 1997; Kinder and Kiewiet 1981; Jacobson and Kernell 1983). Therefore, all governments regardless of partisanship must support economic growth if they are to remain in office (ibid; Hicks and Misra 1993). Scholars have also found that incomes are less evenly distributed than votes, and voters with incomes below the median tend to push for greater taxes and social welfare benefits to augment their earned incomes. Parties wishing to win or maintain government office will therefore be tempted to offer greater benefits in order to entice needed voters (Crepaz 1998; Persson and Tabellini 1994; Bertola 1993). 2 Some scholars disagree with the arguments above, claiming that welfare state expenditures can foster competitiveness by fostering the development of human capital and ensuring political stability that encourages capital investment (Barr 1992; Garrett 1998). 3 In his seminal work on the relationship between growth and (in)equality, Simon Kuznets’ U-curve hypothesis argues that while capital accumulation necessary for growth produces income inequality, those lacking capital will take advantage of the democratic process to vote for policies that redistribute income (1955). 4 This literature has also been called “Working Class Mobilization Model” and ‘Political Class Struggle” theory. 5 In a related work, Garrett does find negative relationships between capital mobility and total government consumption, as well as employer social security contributions. However, he does not find a negative relationship between capital mobility and social security transfer payments, as proponents of the efficiency thesis would expect. Also, Garrett’s results show that the combined influence of centrally organized labor unions and left wing parties more than offset these effects, indicating that these groups are still able to secure generous benefits despite open markets for goods and capital (Garrett 1998: 80-90). 6 Huber and Stephens do find what they claim to be a very indirect relationship between deregulation of domestic financial markets and unemployment. Deregulation can lead to higher interest rates, which may discourage capital investment, decreasing aggregate supplies of fixed capital and depressing demand for labor. Still, this indirect link between globalization diverges from the more common argument that generous welfare states discourage capital investment and depress export markets. 7 A few widely cited authors focus on the criteria that entitle an individual to welfare state benefits, rather than the aggregate level of benefits. Titmuss (1964), Furniss and Tilton (1977), and Esping-Andersen (1990) all discriminate among various classifications of welfare states. While these classifications differed on some finer points, the central criteria that distinguished them are the same. These classifications are determined according to whether individuals are entitled to welfare state benefits by virtue of their citizenship, in return for their participation in
194
the labor market, or as a last resort when reliance on earnings or privately secured insurance has failed. Despite the fact that these works are widely cited in the comparative literature examining changes to welfare state legislation, eligibility criteria are all but ignored in quantitative studies that test for evidence of retrenchment. 8 This latter relationship – the decline in exports to non-OECD countries – has been given scant attention in the scholarly literature. 9 Of course this line of reasoning overlooks domestic supplies of physical capital, and is therefore an oversimplification. However, I maintain that as the gap between stocks of outward and inward FDI continues to grow (indicating that outward flows continue to exceed inward flows), the total supply of physical capital available for production would still be below levels that would result if inward stocks exceeded outward stocks. Given high rates of unemployment among many OECD countries, policymakers must have incentives to reverse recent trends in outward foreign direct investment. 10 Specific data on unemployment rates, as well as measures of globalization, are presented in Chapter IV. 11 Mishra (1993) also argues that the mobility of capital undermines corporatist bargaining because the interests of capital are no longer confined to the nation-state. Actually, evidence presented in Chapter IV will show that labor unions have been weakened most signficantly where levels of union density and centralization were generally moderate or low in the first place. 12 In fact, as I argue below, cuts should be more likely in those countries in which labor unions remain strong and centrally organized, because they are more likely to consider the broader economic consequences of changes in social insurance policies. 13 The opportunity cost reflects the difference between profits that would be generated if invested elsewhere, versus current profits. As long as capital investment in OECD countries with relatively generous social welfare states is more profitable than investment in developing countries with less generous welfare states, the threat of capital exit is not credible. 14 See also Weaver (1986) and Arnold (1993) for discussions of ‘blame avoidance,’ which means that policymakers avoid blame for instituting unpopular decisions. 15 All data for Germany refer to West German prior to unification, and unified Germany thereafter. This includes economic and political “explanatory” variables, as well as the components of adjusted replacement rates for the four social insurance programs. 16 It is important to note that this measure does not include employer’s pensions or private savings for which constituents may receive financial incentives from their governments. Clearly, both of these would increase the amount of retirement income an individual receives. However, this is not important to the current project, because I am not interested in addressing issues of
195
income redistribution or equity. Instead, I focus on the extent to which global market integration prompts reforms of social insurance programs aimed at reducing aggregate expenditures. 17 Among the several measures that I created to capture the relationships between these economic variables, these are most appropriate for regression analysis. However, they do have one key drawback; they capture the relationship between imports and exports and between inward and outward FDI without capturing their directions. For example, if both imports and exports were rising but the growth in imports outpaced the growth of exports, the value of ImportProp would exceed 0.5, indicating a net trade deficit. The same value would result from falling imports and exports, if exports fell at a faster rate than imports. But this latter scenario is likely to have more deleterious effects on the demand for labor. Rising imports should threaten demand for labor in the same industries in which imports rise, but the relationship is indirect and less than perfect. In contrast, if exports fall the effect on demand for labor in heavily exporting industries would be direct and probably significant. 18 It is likely that globalization and deindustrialization are related. Open markets for trade and investment provide opportunities for developing and newly industrialized countries to produce labor-intensive industrial goods and export them to OECD countries. These OECD countries in turn specialize in services, which require more skilled workers. However, a thorough examination of this relationship is beyond the scope of this dissertation. In the concluding chapter I discuss the potential for this relationship as an opportunity for future research. 19 Data for Germany are for West Germany prior to 10-04-90, and for unified Germany thereafter. 20 Values for the measures of inclusive political institutions and decentralization of political authority that are also included in this table are discussed below. 21 It is surprising that the coefficient for the interaction of Social Corporatism and Services is positive as well, indicating that the effect of deindustrialization on unemployment rates is stronger in more corporatist countries. All else being equal, one would expect corporatist countries to coordinate economic and labor market policies and better respond to shifts in the labor market than those countries where corporatism is weak. 22 Again, I put aside my discussion of the influence of government partisanship until Chapter V. It is certainly plausible that government partisanship may affect the incidence of reform, and should certainly affect the timing of reforms if they are deemed necessary. For example, independent of the enabling effects of social and political institutions, left and Christian Democratic governments may be slow to reform these programs, in hopes that their economies might recovery, rendering these unpopular reforms unnecessary. In contrast, right party governments may seize upon opportunities to cut benefits for these programs – especially targeted benefits such as unemployment cash benefits – even if the economic imperative to do so is fairly weak.
196

23 In contrast, these parties may adopt waiting days or increase the number of waiting days prior to the receipt of sickness benefits. Waiting days are essentially and instrument to discourage fraudulent claims, rather than a means of “punishing” those who truly need these benefits.
197