Embed Size (px)
Citation preview

I N S U L A R L I F E
our themeReimagining toDAY Building the Future
We live in a unique time in history where everything we think we know is being challenged, where change has become a constant, and where the future is being shaped everyday. We see a world in which digital is
now woven into the fabric of our lives, enabling us to imagine, create, and build like never before.
These paradigm shifts require us at Insular Life to undergo the most transformative period in our 108-year history. In 2018, we took on a major brand refresh to represent the new realities in our millennial-dominated workforce, our products and services, and our distribution channels. This is depicted in our brand-new logo
that shows a colorful, youthful, and uncaged eagle; our shortened name, InLife; and our new tagline, “A Lifetime for Good.” Beyond the aesthetic change, the brand refresh is part of InLife’s dual transformation
strategy: to revitalize our operations today while we develop a business model for the future.
About the reportContentThis Insular Group 2018 Annual Report gives an update on the progress and priorities set out in our previous report in 2017. It contains data and information on various aspects of our business and operations. Our intention is to provide a holistic view of our financial and non-financial performance such as operational, social responsibility, and governance.
AuDienCeThis report aims to address the information needs of our policyholders and other stakeholders with an interest in both our financial and non-financial performance.
reporting CYCle AnD bounDArYThis report comes out annually and covers the performances of The Insular Life Group of Companies which is comprised of parent company, The Insular Life Assurance Company, Ltd. (a mutual company); its subsidiary, Insular Health Care and affiliate, Mapfre Insular.
DAtA ColleCtion AnD VAliDAtionIn order to obtain the relevant data for this report, consultations were made with our business units on the financial, social, and
operational topics that they deem most relevant to our business as an insurance company. Meanwhile, we engaged the services of SGV & Co. to audit our financial reports for the parent company, Insular Life, and the consolidated report of the Insular Group of Companies. Data are validated and processed by our Public Relations Staff. We have developed a basic reporting protocol and defined the requests for specific data in our collection tool to align the understanding of what data are required from our offices.
reporting CriteriAFor this report, we have aligned our disclosures in accordance with our commitment to the United Nations’ Sustainable Development Goals (SDG). Our goal is to eventually adopt the Reporting Standards of the Global Reporting Initiative (www.globalreporting.org). We will continue to closely track our sustainability performance and lay the groundwork for seeking independent assurance in the near future to be aligned with global best practices on sustainability and integrated reporting. This report is pursuant to the standards of the ASEAN Corporate Governance Scorecard (ACGS) as mandated by the Insurance Commission.
FeeDbACkWe welcome feedback from our stakeholders to improve our reporting process.
Please email Jude C. Galford III / Public Relations Staff at [email protected].
For other information, please contact:
AttY. renAto S. De JeSuS Senior Vice President Chief Legal Officer, Compliance Officer and Corporate SecretaryLegal & Corporate Services DivisionInsular Life Corporate CentreInsular Life Drive, Filinvest Corporate CityAlabang, Muntinlupa City, [email protected]
AnA mAriA r. SoriAnoVice PresidentPublic Relations StaffInsular Life Corporate CentreInsular Life Drive, Filinvest Corporate CityAlabang, Muntinlupa City, [email protected]
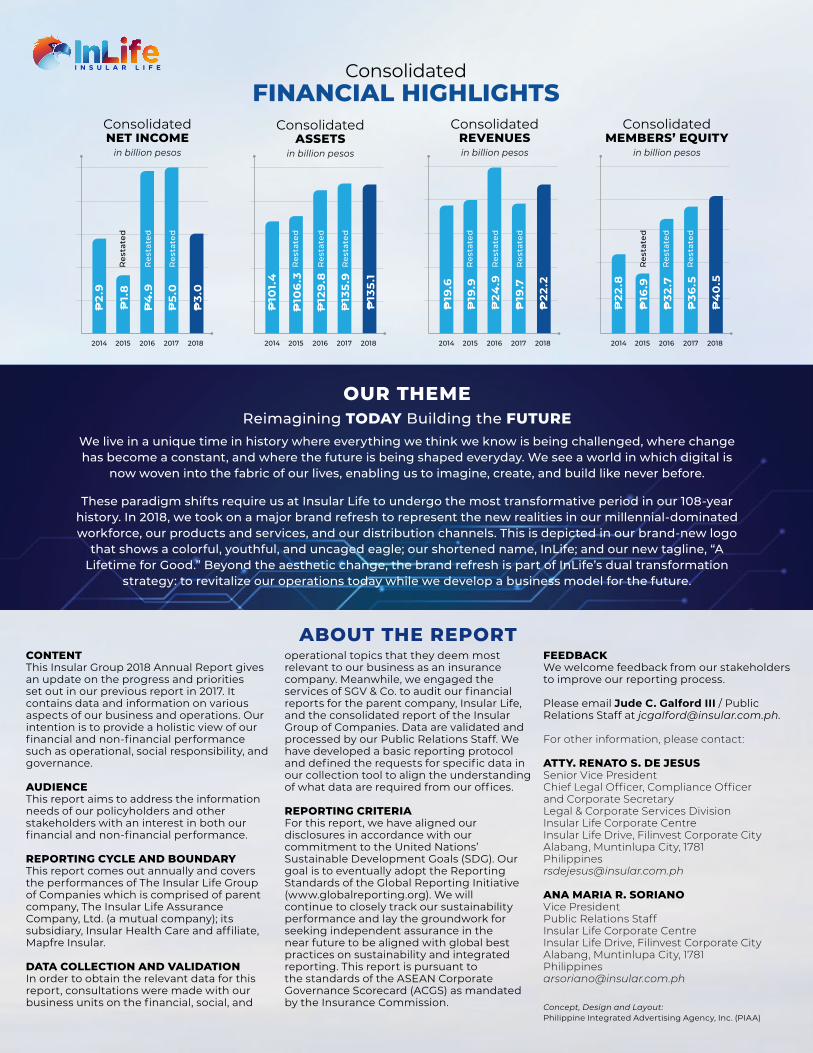
ConsolidatedFinAnCiAl highlightS
ConsolidatedASSetS
in billion pesos
2014 2015 2016 2017 2018
P2
.9
P3.
0
P1.
8
P4
.9
P5
.0
2014 2015 2016 2017 2018
P10
1.4
P10
6.3
P12
9.8
Res
tate
d
Res
tate
d
Res
tate
d
Res
tate
d
Res
tate
d
Res
tate
d
P13
5.9
P13
5.1
2014 2015 2016 2017 2018
P19
.6
P19
.9
P24
.9
P19
.7
P22
.2
2014 2015 2016 2017 2018
P22
.8
P16
.9
P32
.7
P36
.5
P4
0.5
ConsolidatedreVenueSin billion pesos
Consolidatednet inCome
in billion pesos
ConsolidatedmemberS’ equitY
in billion pesos
I N S U L A R L I F E
Concept, Design and Layout:Philippine Integrated Advertising Agency, Inc. (PIAA)
Res
tate
d
Res
tate
d
Res
tate
d
Res
tate
d
Res
tate
d
Res
tate
d
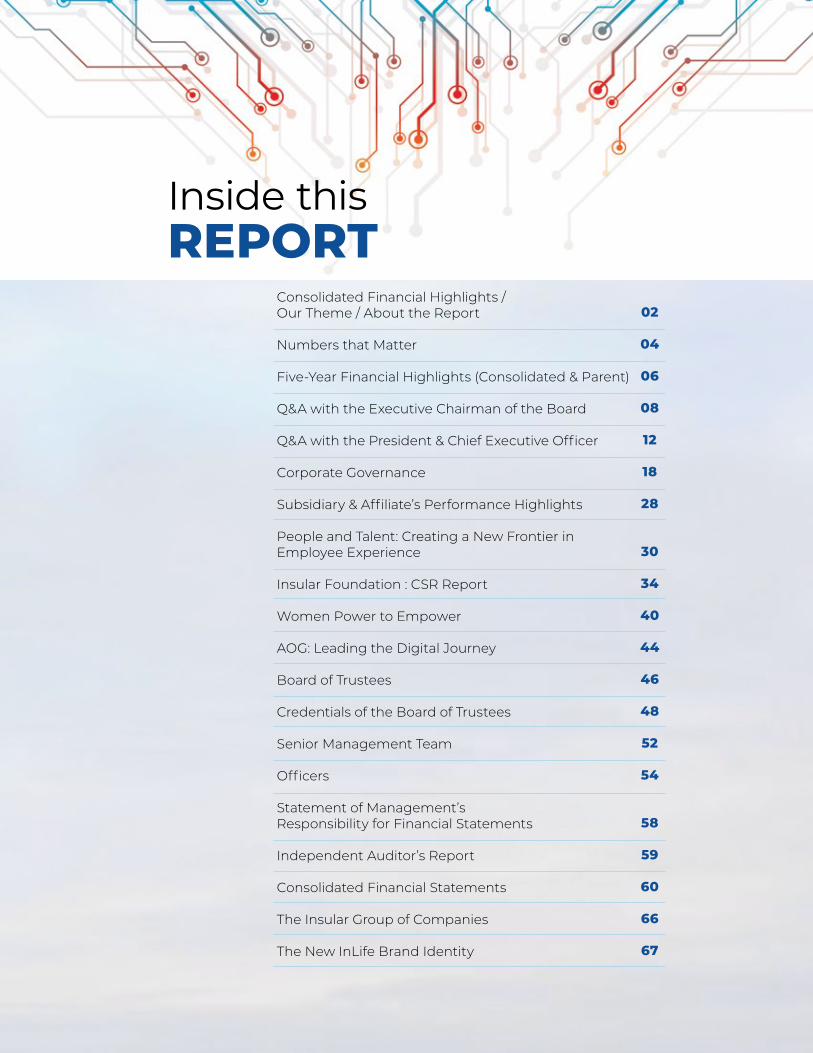
Inside thisreport
Consolidated Financial Highlights /Our Theme / About the Report
Numbers that Matter
Five-Year Financial Highlights (Consolidated & Parent)
Q&A with the Executive Chairman of the Board
Q&A with the President & Chief Executive Officer
Corporate Governance
Subsidiary & Affiliate’s Performance Highlights
People and Talent: Creating a New Frontier inEmployee Experience
Insular Foundation : CSR Report
Women Power to Empower
AOG: Leading the Digital Journey
Board of Trustees
Credentials of the Board of Trustees
Senior Management Team
Officers
Statement of Management’sResponsibility for Financial Statements
Independent Auditor’s Report
Consolidated Financial Statements
The Insular Group of Companies
The New InLife Brand Identity
02
04
06
08
12
18
28
30
34
40
44
46
48
52
54
58
59
60
66
67

104.53 points
2018 Asean Corporate Governance Scorecard
P54.4 billion
Legal Policy Reserves (Parent Company)
P356.1 billion
Business-in-Force (Parent company)
P39.1 billion
Net Worth (Parent Company)
Total Assets(Parent Company)
P133.3 billion
P
Numbers thatmAtter
P8.2 billion
Gross Benefitsand Claims Paid

18%Total PremiumGrowth
Equity FundOutperforms PSEi’s 10-year CAGR of 14.8%As of March 2019
16.2%47%Lease Revenue Growth
80%AuS AdoptionFull-year 2018 vs. 28% in 2017
37 years old
Average Age of InLifers
62%Female Employees
Numbers thatmAtter
P1 billion
Subscription to IFC’s Green Bond

6 Reimagining Today Building the FuTure
Restated Restated Restated 2018 2017 2016 2015 2014 Net Income per FS 2,998 5,016 4,933 1,769 2,949 Net Insurance Revenue per FS 14,381 12,201 12,929 13,587 12,784 Operating Revenue 7,828 7,508 11,978 6,348 6,846 Total Revenue per FS 22,209 19,708 24,907 19,935 19,630 (Net Insurance Revenue + Operating Revenue) Assets 135,055 135,902 129,792 106,293 101,354
Cash and Cash Equivalents 3,470 4,966 7,865 7,108 7,260
Cash on hand and in banks 661 628 549 584 1,108
Cash equivalents in commercial banks 2,809 4,338 7,315 6,524 6,152
Liabilities 94,544 99,422 97,079 89,441 78,505 Retained Earnings 29,529 26,239 21,428 16,949 20,442 Appropriated 550 550 550 250 250
Unappropriated 28,979 25,689 20,878 16,699 20,192 Member’s Equity 40,511 36,480 32,713 16,851 22,849 Total Liabilities and Member’s Equity 135,055 135,902 129,792 106,293 101,354
The Insular Life Assurance Co., Ltd.
ConsolidatedFiVe-YeAr FinAnCiAl highlightS
(In Millions)

72018 annual report
The Insular Life Assurance Co., Ltd.
Parent CompanyFiVe-YeAr FinAnCiAl highlightS
(In Millions)
Restated Restated Restated 2018 2017 2016 2015 2014
Net Income per FS 2,180 4,020 3,684 1,407 2,355 Net Insurance Revenue per FS 13,947 11,858 12,660 13,382 12,584 Operating Revenue 6,984 6,460 10,699 5,943 6,196 Total Revenue per FS 20,930 18,318 23,359 19,325 18,779 (Net Insurance Revenue + Operating Revenue) Assets 133,297 140,092 133,218 107,870 104,393 Cash and Cash Equivalents 2,837 4,297 7,256 6,618 6,861 Cash on hand and in banks 384 335 327 439 921 Cash equivalents in commercial banks 2,452 3,962 6,929 6,179 5,940 Liabilities 94,229 99,109 96,853 89,286 78,640 Retained Earnings 18,886 16,706 12,884 9,613 13,449 Appropriated 550 550 550 250 250 Unappropriated 18,336 16,156 12,334 9,363 13,199 Member’s Equity 39,069 40,983 36,365 18,584 25,753 Total Liabilities and Member’s Equity 133,297 140,092 133,218 107,870 104,393 New Business Premiums 8,729 7,053 7,786 8,490 7,865 Total Premiums 13,985 11,848 12,479 12,765 11,928 Gross Investment Income 5,342 4,748 4,606 4,254 4,223 Legal Policy Reserves 54,375 62,373 65,064 61,397 51,058 Net worth 39,069 40,983 36,365 18,584 25,753 Gross Benefits and Claims Paid 8,180 8,111 8,067 9,464 9,934

8 Reimagining Today Building the FuTure
We have made headways in transforming our company into the high-performing organization that we aim to be.
Message fromninA D. AguASExecutive Chairman of the Board

92018 annual report
For a 108-year-old institution, insular life sure looks like it’s getting reborn.
After undergoing a transformational makeover for its iconic Insular Life Building in Makati City, InLife also started brandishing a colorful eagle in its logo; a new tagline, “A Lifetime for Good”; and bolder fonts that mirror the bold direction of the company as it takes on the challenges of digital disruption and a growing millennial workforce and customer base.
In this interview, inlife Executive Chairman Nina D. Aguas talks about navigating a world that is growing in complexity and uncertainty every day, and how InLife is reimagining its business model, as well as its role in society, today and in the future.
2018 was marked with a lot of market volatility, as well as economic and political uncertainties here and around the world such as the u.S.-China trade war, the Brexit deal in the united Kingdom, the sudden rise in crude oil prices, higher inflation and interest rates, among others. Insular Life, however, defied the odds. How did the company manage to pull off a stellar performance?
2018 continued to be a pivotal year for InLife. The company breached the P5-billion mark in net income for the first time in its 107-year history in 2017. And now, on my first year as Executive Chairman, we grew faster than the local insurance industry; our top line or gross revenues rose by 18 percent and this is propelling us towards further growth. While inflation rose in 2018, it did not have a significant impact on our performance; if at all, it just tempered our growth.
How did we do it? There were a lot of factors:
The life insurance sector grew to about 17 percent year-on-year. Against the backdrop of a growing middle class and a booming economy, our strong performance in 2018 is only a reflection of our business environment.
There was a stronger push for agency recruitment and activation. Our bancassurance partnership with Union Bank of the Philippines has also started to bear fruit in 2018.
We reorganized and strengthened the accountability among our top executives to embody and deliver on our brand promise, “A Lifetime for Good.”
As part of our dual transformation, we refreshed our brand identity, starting with the name: inlife. The refreshed brand now represents the new realities of our workforce, our products and services, and our distribution channels. It will represent our dynamism and capability to deliver insurance and financial solutions appropriate for our market, in a manner that is most convenient for them.
How do you see the role of bancassurance in inlife’s digital transformation? We look at bancassurance as part of InLife’s business agenda, as well as an opportunity for the company to leverage on the sophistication of UnionBank when it comes to financial technology.
Beyond the numbers, we want to take advantage of UnionBank’s network of over 300 branches and
reimagining the Future of inlife

10 Reimagining Today Building the FuTure
offices to reach its more than six million customers nationwide. There are still a lot of Filipinos out there who are unprotected from life’s uncertainties.
If you look at insurance penetration in the Philippines, which is less than 2 percent, there’s still a lot of room for insurance players to cover. We all leverage and capitalize on our own strengths. It depends on what we really want for the business, and we like to march to the beat of our own drum.
Can you expound on the company’s new tagline, ‘A Lifetime for Good’? Our new tagline encapsulates our road map: who we are, our purpose as an institution, our mission, our commitment, and vision.
We define ourselves by the good we bring to our policyholders, the bigger community, and our country. As a life insurance company, we have products and services that inherently bring good to the individual and his/her family. As a Filipino institution that has been here for over a century, we have done good to the greater community and the country, beyond business considerations. Through our industry, our products and services, our innovation and transformation, we are and will be bringing the good today, and in the future. We are here for good, for life. Thus, our tagline.
How does ‘A Lifetime for Good’ relate to InLife’s digital transformation?InLife has been around for more than 108 years now — that is more than a lifetime for most of us. If I were to be forward-looking, I’d like the company to still be here for another 100 years, that is my. aspiration.
The 4th Industrial Revolution is bound to cause seismic, tech-driven shifts in everything, including the insurance business. Competition will continue to heat up and insurers like InLife are propelled to take a fresh look at their business models and customer experiences to stay in the game.
So our goal for the next three to five years is about “Reimagining Today, Building the Future.” We want to reset the way today looks like by harnessing and leading the changes rather than waiting for change to be done unto us. Out of this, we are developing our business model for the future. In two short years, we have made headways in transforming our company into the high-performing organization that we aim to be. This dual transformation strategy will
help increase our relevance and significance with our policyholders.
How do you make ‘A Lifetime for Good’ more than just a brand promise?
To me, “A Lifetime for Good” takes on many layers.
the first: the products and services of InLife should be good for everyone: for our employees, policyholders, communities, and the country as a whole. There’s a clear intent to make a lifetime for good for everyone — not just because we want to boost our bottom line. In everything we do, we want it to be financially relevant as well as socially responsible. If there is one company that has a heart for this country, it’s InLife. We’re completely Filipino owned, we’re a mutual company, and we’ve been here for more than 108 years.
the second layer is sustainability. In 2018, we made a significant move to insure the future of the planet by investing in the green bonds of the International Finance Corporation (IFC), a member of the World Bank Group It was also the year we earned a GOLD LEED (Leadership in Energy and Environmental Design) certification for our Insular Life Building in Makati City.
We are also sustaining the work of Insular Foundation in providing access to quality education for poor but deserving Filipino students. I’m a firm believer that education is a great equalizer. Many of us who came from humble beginnings realize that education gave us the leg up. We all worked hard to get here, and education is our common denominator.
In 2018, we embarked on supporting more first-grade pupils with their educational needs. We all know that while the tuition is free in public elementary schools, the way to is not. So we provide books, uniforms, and all the things they need to go to school. We continue to have scholarship programs for higher education in partnership with the University of Philippines and other state colleges and universities nationwide. This is all about providing a holistic lifetime for good to the country. But the most significant — and perhaps game-changing — program is the InLife Sheroes, the first of its kind in the market.

112018 annual report
As I said during the formal launch of InLife Sheroes, “the hand that rocks the cradle rules the world.” However, the woman today does so as if she has multiple hands. She’s at the center of everything: looking after her children, her husband, her elderly parents and in-laws, and even extended relations. If she’s lucky enough, she can send her siblings to school. At the same time, they are breadwinners. They take on jobs: they are engineers, nurses, astronauts, and all of that. They’re BPO and migrant workers contributing to the economy and helping their communities level up.
But what if something happens to them? What if there’s an unforeseen event that leads to a loss of income or loss of support? The situation recalibrates and goes back to ground zero. So there must be a way we can help protect women through insurance and other risk-mitigation measures.
What prompted InLife to take on this partnership with IFC?
We saw the results of the “She for Shield” study, a first-of-its-kind study focusing on the women’s insurance market in 10 emerging economies, and it made us realize that there’s a golden opportunity for InLife to take the lead. We’re a local company in a leadership position and our workforce is 60 percent female so it’s women serving the needs of women. When I saw the study and going for insurance for women, I realized it’s what we have always wanted to do: to go for “inclusive insurance,” which has never been considered before. We have always been delivering products and services for the general public, not really focusing on women’s needs.
The study also shows there’s a knowledge gap in financial literacy and understanding insurance, savings, and protection. If women will have insurance as a form of backup for loss of income or life, there will be a fallback. Even during their lifetime — considering their health risks — they can be covered as well. If we are able to find needs-based solutions, then we can help. Our ambition is to become the Filipino women’s insurer of choice. Beyond this, we want to empower one million Filipinas in three years to become financially smart and become economically capable to take on life’s challenges.
We’re dedicating a lot of people to InLife Sheroes, branding it, and making it a truly empowering
strategy. Aside from IFC and the World Bank, we also forged partnerships with various women’s organizations, namely the Philippine Commission on Women and the Philippine Business Coalition for Women Empowerment. Also supporting our program are Union Bank of the Philippines, its thrift subsidiary City Savings Bank, and New York-based digital platform provider Globelinker, its partner in bringing local micro, small and medium enterprises (MSMEs) to the e-commerce space. We intend to grow our partners as we move forward.
I also just got appointed as a member of the World Bank Group’s Advisory Council on Gender and Development, composed of distinguished representatives of government ministries, academia, the private sector and non-profit institutions around the world. As the only Filipino in the roster of Council members, I consider this an incredible honor, as well an opportunity for InLife to be on a global stage. More importantly, it gives me a seat at the table where women’s issues are discussed. We may not have the solution to everything but it’s always a step closer.
What are your plans and projections for 2019?
We will vigorously pursue our transformation and building a business model for the future. With the use of data analytics, we can further strengthen our capability as a lot of our processes and decisions will now be data-driven. We have a firmer strategy.
In 2019, we are anticipating global challenges to persist. Uncertainty is one certainty that will continue to impact the Philippines. Still, we train our sights on the future and we are still very positive about the prospects for growth in our economy. We want more Filipinos to partake of these economic gains by helping educate them and provide literacy programs.
In my whole career, I think about the bottom line all the time, being a CPA by profession. I want to do more and go beyond the numbers, make sure we have a corporate mission, as well as a purpose. Once you have those, the numbers will follow. You can have all the strategies you want, but if you’re not driven by a sense of purpose and mission, then it will just be about number crunching.

12 Reimagining Today Building the FuTure
Report to PolicyholdersmonA liSA b. DelA CruzPresident and Chief Executive Officer
Technology gives us plenty of opportunities to continually enhance
customer experience. Our goal is to continually
improve servicing digitally and automating
our processes to make them faster and more
convenient for our policyholders.

132018 annual report
With Big Data and the development of new technologies like artificial intelligence (AI) and robotics, today’s insurers face a major
challenge: how to stay relevant in a world where consumer preference and behavior are changing rapidly and risks are evolving as markets become more digitally connected.
Fortunately, Insular Life has a 108-year headstart when it comes to knowing and addressing the financial protection that Filipinos need. In this interview, InLife President and Chief Executive Officer Mona Lisa B. dela Cruz talks about the company’s digital strategy and its ongoing journey to stay agile and relevant.
How would you describe InLife’s performance in 2018?
Without doubt, it was a difficult year as there were a lot of disruptions. Particularly, Philippine economy was saddled by high inflation rates, ending the year with a 5.2% inflation average, the highest in 5 years. This also affected the country’s Gross Domestic Product (GDP) Growth of 6.2%, which was lower than the 6.7% - 7% growth rate forecasted in the beginning of the year.
Against this backdrop, InLife’s 2018 total premiums grew by 18% amounting to ₱13.98 billion compared with ₱11.85 billion in 2017. However, we ended the
Life insurance policy reserves are the money an insurance company must set aside today to pay expected future
life insurance claims.
Embracing the Futurewith teChnologY
year with a lower net income partly due to the new valuation method prescribed by the Insurance Commission.
How did the changes in the valuation of life insurance policy reserves affect your bottom line?
The new valuation method as prescribed by the Insurance Commission mandates that we set up reserves at a more conservative method. Policy reserves are the amount or percentage of liquid assets that the Company must have on hand to pay for a future claim or other benefits such as policy maturity and death benefits. Under the new Gross Premium Valuation method, other than the insured benefit payout and net premiums, we were required to also project future expenses, inflation, surrenders and gross premiums.
In January 1, 2017, we set our gross premium reserves using the expenses that were projected for the year, without taking into account the possible effects of the operational efficiencies we were putting in place. By end 2017, however, when we did a study on our expenses, we realized a reduction in per policy expense because of several initiatives e.g. stronger adoption of our Automated Underwriting System, less paper, streamlined operations etc. Because of this, per unit expenses went down and correspondingly our reserve outlook also went down. Thus we released reserves in 2017. For 2018, our

14 Reimagining Today Building the FuTure
expense assumptions remained stable, and hence there was no major change in reserves. Our income in 2018 therefore did not include the extraordinary release in reserves in 2017.
How did these financial reporting changes affect your targets?
While the shift to a new methodology seems complex and sophisticated, we welcome these adjustments as we move towards more market-based assumptions and enhance our valuation methods. It also does not derail us from our ambition to be No. 3 in the industry in terms of total full-year premium by 2022.
How do you plan to achieve this growth target?
Our strategy is three-pronged: 1) Accelerate revenue growth; 2) Improve customer experience; and 3) Digitalize our core functions to improve revenue growth, customer experience, and operational efficiencies. Our various units have been hard at work to fulfill these goals.
Let’s tackle them one by one. On “accelerating revenue growth”: how did you manage to do this in 2018?
We are pleased to report that both our agency force and bancassurance distribution channels did fairly well despite the intensifying competition in the local industry.
In 2018, our bancassurance channel grew by 53% versus 10% from year-ago levels.
Of course, 2018 was the first full year of operation of InLife’s bancassurance partnership with Union Bank of the Philippines. We spent the year putting in the necessary platform to have an efficient and effective sales team — from recruitment, training, marketing, performance and activity management, all the way to data and insights analysis.
Our agency force recorded a 19% growth in first year premium (FYP) posting ₱3.8 billion in 2018 from ₱3.2 billion in 2017. Policy count also grew 6% bringing in a total of 22,405 policies in 2018 vs. 21,224 policies in 2017.
Our investment income, on the other hand, amounted to ₱5 billion, 12.6% more than the ₱4.46 billion recorded in 2017. This includes dividend income of ₱1.67 billion derived from Pilipinas Shell Petroleum Corp. (₱1.31B) and UnionBank (₱326M).
In addition, the Company also generated revenues from its real property business. Our total lease revenues grew by 47% to ₱605.5 million in 2018 from 2017’s revenue of ₱412.7 million. We also sold ₱105.7 million worth of properties.
Our operation was also marked by other noteworthy milestones.
Our Insular Life building in Makati earned a Gold certification from the US Green Building Council under its Leadership for Energy and Environmental Design (LEED). This is the globally recognized green building rating system in the world that accredits buildings that follow a set of standards towards a more sustainable and greener Philippines.
152018 annual report
Our 2017 Calendar set and Hackathon event both received a Silver Anvil for excellence in communication from the Public Relations Society of the Philippines, the country’s premier organization of PR professionals.
Internationally, we also received the Trusted Brand Gold Award for Life Insurance Category given by Reader’s Digest Asia, as well as Domestic Life Insurer Award from the prestigious Insurance Asia Awards.
What were InLife’s 2018 initiatives on improving customer experience?
One of our main features in this report is a discussion on our digital journey spearheaded the Administrative Operations Group (AOG). In that article (pp. 42 – 43), we tackled the various initiatives and breakthroughs that improved customer experience through innovation and technology.
But briefly, I am proud to single out our Automated Underwriting System (AUS) and the Leads ARchiving Assistant (LARA), an app that enables our agency leaders to identify leads and set appointments, as our towering achievements in this front.
When we launched the AUS in 2015, we envisioned it to greatly help our financial advisors in sales activities, providing customers with convenience when applying for a policy and helping ease the workload of our underwriters. Today, we are seeing the results through its high adoption rate among our new and seasoned financial advisers and agency leaders.
In addition to these enhancements, InLife also launched a new equity-based VUL product: the Own the New Economy (ONE) fund. ONE Fund is an actively managed fund that rides on the Philippine economy’s growth as the individual stocks are focused on the sectors that drive the country’s GDP.
Also, we launched I-Peso ProEarn – a single pay product that matures in 7 years. Each year, as much as 3.75% of the single premium is given back to the policyholder every year starting on the second year until the seventh year. At maturity, 100% of the single premium is given back. This product generated premiums of ₱713 million in 2018.
Another milestone is our foray into digital selling. In 2018, we started offering complete life protection plans via Lazada, the leading e-commerce platform in Southeast Asia. Through this channel, we have exponentially expanded our reach so that more Filipinos will be able to enjoy InLife products, wherever they may be.
Through these initiatives, we were able to serve more clients in both offline and online environments.
Do you consider digital technology a major differentiation strategy for InLife?
Yes, our use of digital technology is enabling us to do so many things, including our sales engagement process. Our digital edge starts as early as client prospecting by our agents. We have the digital tools and systems to generate sales leads which come from various sources, such as bank branches, social media, and our own partnerships. Word of mouth is also just as strong, where existing customers refer their family members and friends, and if they have corporate accounts they seek us out for their personal needs as well. Other digital tools include field management reports for leaders, who need a good snapshot of their agents’ activities and performance, and I-Quote for generating agent proposals on

16 Reimagining Today Building the FuTure
demand. For our customers, we offer automated notifications – via email and SMS – so they’ll know as soon as their e-policy is issued. Customers can also explore many transactions on the InLife Customer Portal, including fund switch, fund withdrawal, premium redirection, dividend withdrawal, and policy loan application. They can submit paperwork everywhere and we can disburse funds everywhere, not necessarily where you submit your form.
We work hard in making every transaction faster and more convenient for everyone — may it be our agent or policyholder. We train our agents in using these new systems, and raise our customers’ awareness on these technologies via SMS and email alerts, in-office consultations, and announcements across our various touchpoints. While we still have a long way to go when it comes to adoption among our nearly 900,000 insured lives, we’re optimistic that these technologies can greatly benefit their experience with InLife.
We also use technology for e-learning. All our basic courses for our agents — e.g., review for Insurance Commission licensing, product knowledge, company information, and market conduct guidelines — are on demand online, and examinations are taken online as well. Some higher-level courses are still done face to face though. We’re heading in the direction of introducing a mobile app for e-learning so that’s something to look forward to.
Agile is a buzzword among organizations today. Are you on board the Agile Methodology?
Yes, and this is why we’re able to implement so many digital initiatives in 2018. We are also agile in the sense that as a Filipino company, our decision process is fast. This is because our parent company is close to where we operate which means that there are fewer layers in decision approvals.
We also have a very competent team to support the agile culture and infrastructure, as well as new tools and ways of doing things. We’re positioned well in this regard; we have cross-functional teams to speed things up.
What prompted InLife to create an Innovation team?
Our focus is on fostering a spirit of innovation and learning how we can apply practical and tech-based solutions to everyday challenges. This means out-of-the-box thinking and doing things differently. In 2018, we held Innovation Day events to raise awareness in the organization and challenge everyone to think up of ways to be innovative. We also held a Hackathon Competition where we formed teams and each was given a chance to cure old pain points using new techniques. We’re not yet in the stage where we can invent new things to save the world, but who knows what’s possible? We also partnered with fintech companies for learning and innovation activities such as product pitching. In 2018, we participated in Plug and Play Singapore, dubbed as “the ultimate innovation platform” that brings together the best startups and the world’s largest corporations.

172018 annual report
We are more deliberate today than ever to expose our people to an innovative culture. We are fully invested in efforts that will continue to build our premium generation capabilities, and improve customer experience and operational efficiency. We are espousing innovative thinking and technological literacy among our employees and agency force.
How do you imagine InLife looks like in the future?
We are “old” compared to most other players in the local industry. So a significant part of that future will be our ability to do things the way the younger ones do it. The false assumption is that elders cannot do new things, innovate, or go the digital path. InLife proves that it’s able to keep abreast of and keep up with the evolution of the insurance environment, the business community, and our customers. Our customers are getting younger; understandably because the demographics in the country are reflecting the same trends. We still have high birth rates, outnumbering mortalities. So we try to align ourselves to that future. We look at customers’ life journey, whether they are at a time of saving or building. We need to promote financial literacy regardless of the product we offer because it’s all about planning for the future and investing for that inevitability. When you consider Generation Z as one that’s poised to be more entrepreneurial, then you have a greater need for financial literacy. They will manage their own finances. For me, it’s not a question of “What can InLife offer?”, but what this next generation of customers would need. In a gig economy or an
entrepreneurial culture, who will provide for your retirement? No one. So this should be their priority as well. If they are going to have their own businesses, they need to take care of their own employees, too, so group insurance will also be important.
What will evolve will be the needs. Whatever the need is, we have the product. It’s a matter of what needs are dominant today and in the future.
What is your outlook for 2019?
We expect better results and a more stable environment. We expect interest rates to be more stable and the business environment to be more predictable. While we cannot be certain about the volatile, uncertain, complex, and ambiguous world we live in, I can tell you one thing that’s certain about InLife: far more exciting times are up ahead.
Our passion for growth and expansion can only be matched by our strong commitment to always work for the best interest of our policyholders.

18 Reimagining Today Building the FuTure
CorporategoVernAnCeAs the biggest Filipino life insurance company which has stood for over one hundred and eight years, Insular Life has been a partner in nation-building and in uplifting the lives of the Filipinos. As a major player in the industry, this position has been demanding us to do good and do the right thing.
our CompliAnCe with gooD CorporAte goVernAnCe
We confirm our full compliance with the principles of good Corporate Governance.
our boArD oF truSteeSINLIFE’s Board of Trustees sets the tone in fulfilling the Company’s commitment as it carries out its fiduciary duties. As Trustees, they exercise their responsibilities judicially and ensure good corporate governance is upheld across the organization.
Nominating and Selecting Board of Trustees
Members of the Company have a right to nominate candidates to the Board. Every December, the Company publishes a Notice to Members informing them that nominations are
open until the fourth Wednesday of January for the election of Trustees to replace those whose terms are expiring during the Annual Members’ Meetings in May of the ensuing year. The selection of members of the Board uses the following criteria:
• MemberoftheCompany;• Filipinocitizen;• ResidentofthePhilippines;• Possessesqualificationsthatarealignedwith
the strategic directions of the Company; and • Hasnoneoftheprescribeddisqualifications
enumerated in the Company’s By-Laws.
The Company promotes diversity and inclusion of all nominees (taking into account the minimum criteria above), regardless of age, gender orientation, disability, religion, cultural background, economic or other status.
Insular Life supports the following United Nations Sustainable
Development Goals:

192018 annual report
Board Selection Process and OrganizationAside from nominations from Members, the Company also makes use of professional search firms or other external sources when searching for individual candidates to the Board, if necessary. The Nominations Committee undertakes the process of identifying the qualities of Candidates to ensure that these are aligned with the Company’s strategic directions. As the Company moves towards digitization of its business, having members of the Board with experience and expertise in innovation and technology is crucial in the successful steering to this direction. This is complemented by the experience of other members being distinguished authorities in the insurance and banking sectors of the financial industry.
During the Annual Members’ Meetings, Trustees are elected to fill the post of those whose terms are expiring. Immediately after election, the Board of Trustees meet and elect among themselves, the Chairman of the Board, the Chairman of the Executive Board Committee, and members of other Board Committees.
Our current Board of Trustees is composed of nine (9) Trustees who are experts in their fields, have a strong sense of business ethics, and dedication to good
corporate governance. Their specific credentials and experience are disclosed in the Credentials of the Board of Trustees section of this Annual Report.
Majority of the Board is composed of Non-Executive and Independent Trustees. Three of the nine Trustees are women. None of the Independent, Non-executive Trustees occupy more than five (5) board seats in Publicly Listed Companies (PLCs). In the case of Executive Trustees, none of them occupy seats in more than two (2) PLCs. The Company requires Trustees to fully disclose any significant change in their directorships or other significant commitments outside Insular Life. It is also the Company’s policy to limit the term of Independent Trustees to a maximum term of nine (9) years.
The Board of Trustees and its Board-level Committees are tasked to review and decide on significant corporate actions that have not been otherwise delegated to Management. They likewise review key management decisions pertaining to strategic initiatives, investments, adoption of significant Company policies, and the like. The Board also monitors the implementation of Company’s business plan and strategy which includes annual review of the Company’s vision and mission.
tAble oF boArD Committee memberShipS As of 01 April 2019
Committee Chairman Vice Chairman Member/s
Executive Mona Lisa B. dela Cruz Luis C. la ÒNina D. Aguas
Francisco Ed. LimJusto A. Ortiz
Audit Luis Y. Benitez Gil B. Genio Marietta C. Gorrez
Finance, Budget and Investment Luis C. la Ò Nina D. Aguas
Gil B. GenioMona Lisa B. de la Cruz
Justo A. Ortiz
Governance Francisco Ed. Lim Luis Y. Benitez Luis C. la Ò
Innovation and Technology Gil B. Genio Justo A. Ortiz Nico Jose S. Nolledo
Nominations Luis Y. Benitez Gil B. Genio Nico Jose S. Nolledo
Personnel and Compensation Nina D. Aguas Luis C. la Ò Luis Y. Benitez
Related Party Transaction Gil B. Genio Marietta C. Gorrez Francisco Ed. Lim
Risk Management Luis Y. Benitez Marietta C. Gorrez Gil B. Genio

20 Reimagining Today Building the FuTure
Board Meeting Schedule and Attendance
In accordance with InLife’s Manual on Corporate Governance (MCG) and to ensure that each Trustee can provide sufficient time and availability for each meeting, schedules for Board meetings for the incoming year are set forth and approved during the last Board meeting of the prior year. The Board agenda and relevant papers are also forwarded to each Trustee by the Office of the Corporate Secretary (OCS) at least five (5) business days before each meeting. The Company requires and observes a minimum quorum of at least two-thirds (2/3) of the members of the Board for making Board decisions. A summary of attendance is disclosed below:
The Office of the Corporate Secretary (OCS)
The Corporate Secretary, Atty. Renato S. De Jesus, plays a significant role and provides administrative support for the discharge of responsibilities of the Board. The OCS assists the Chairman in providing orientation to new Trustees and in communicating to the Trustees relevant Board materials and other matters.
In 2018, OCS certified that Non-Executive Trustees met twice during the year, without any Executive Trustees present, to ensure consistent administration of the Company’s strategic plans.
Governance Policies and Practices
The Company’s governance principles, policies and practices are contained in the MCG and the Code of Conduct. The MCG also contains the roles and responsibilities of the Board, the Board Committee charters and the types of decisions requiring Board approvals. Compliance with these is a mandatory requirement on the part of Trustees and employees. Their compliance is assessed during their respective annual performance appraisals.
board Diversity
profile
Innovation &
TechnologyA
ud
it / A
ccounting
Innovation & Technology
InsuranceIn
suran
ce
Insurance
Female
Female
Non-Exec
Exec N
on-Exec,
Independent
Male
Male
Banking /
Innovation &
Tech
Ban
king
/
Acco
untin
g
Legal
Exec
Non-Exec
Independent
2018 tAble oF boArD AnD Committee meeting AttenDAnCe
Name of TrusteeBoard
Meetings (Regular/ Special)
Board Committee Meetings
Executive Audit
Finance, Budget and Investment Governance
Innovation &Technology Nominations
Personnel and Compensation
Risk Management RPT
Nina D. Aguas 8/9 5/5 -- 4/4 -- -- -- 3/5 -- --
Luis Y. Benitez 9/9 -- 8/8 -- 4/4 -- 2/2 5/5 2/2 --
Mona Lisa B. de la Cruz 9/9 5/5 -- 2/3 -- -- -- -- -- --
Gil B. Genio 8/8 -- 7/7 2/4 -- 1/1 1/1 -- 2/2 1/1
Marietta C. Gorrez 9/9 -- 8/8 -- -- 1/1 -- -- 2/2 1/1
Luis C. la Ò 9/9 5/5 -- 4/4 4/4 -- 1/1 5/5 -- --
Francisco Ed. Lim 9/9 5/5 -- 1/3 4/4 -- -- -- -- 1/1
Nico Jose S. Nolledo 6/9 -- -- -- -- 1/1 2/2 -- -- --
Justo A. Ortiz 7/8 5/5 -- 4/4 -- -- -- -- -- --
total no. of 2018 meetings held 9 5 8 4 4 1 2 5 2 1

212018 annual report
2018 Continuing Governance Education
It is the policy of the Company to encourage its Trustees to attend ongoing or continuous professional education programs. The Company also conducts an annual governance education session for Trustees and Officers to apprise them of the latest business developments and issues that could affect their governance and strategic direction setting. In 2018, Ret. Chief Justice Reynato S. Puno spoke at a half-day learning session entitled, “Philippine Constitution, Charter and Federalism.” In his talk, he discussed Federalism and its effect in the economy and why there is a need for constitutional change.
Annual Board Performance Assessment
Annually, an assessment is conducted on the performance of the 1) Board, 2) the individual Board Committees, and 3) individual Trustees. The assessments measure the effectiveness of the Company’s governance practices and solicit feedback for further improvement. The criteria for assessments are based on general responsibility of the Board, the respective Charters of each Committees and the individual roles and responsibilities of each Trustee. InLife conducted the 2018 performance assessment in accordance with these criteria. The Non-Executive Trustees also assessed the Executive Chairman while the performance of the President and CEO, and other Senior Management are reviewed and evaluated by the Personnel and Compensation Board Committee.
Remuneration Matters
Board Compensation Policy and Procedures for Executive Trustees
Executive Trustees are Members of the Board who are also Executives of the Company. They (including Chief Executive Officer) receive remuneration for their executive functions and do not receive separate remuneration for holding memberships to the Board. A portion of the remuneration of Executive Trustees may
be structured or be based on corporate and individual performance. The Personnel and Compensation Board Committee is responsible for reviewing and recommending to the Board the compensation and remuneration packages for Executive Trustees (including the CEO) and Senior Management (collectively called “Key Management Personnel”). The amount of compensation received by Key Management Personnel is disclosed in the Notes to the Financial Statements Section of this Report.
Board Compensation Policy and Procedures for Non-Executive Trustees
Non-Executive Trustees are Members of the Board who are not officers of the Company. They receive an annual basic remuneration of P25,000.00 for their membership to the Board and for membership to the Executive Board Committee. They also receive Per Diem of P30,000.00 for their attendance in each Board and Board Committee meetings.
22 Reimagining Today Building the FuTure
key risks
The Company believes that prudent risk management hinges on effective risk metrics for the proper risk identification and quantification of our exposure to such risks. To this end, the Company has identified the following major risk areas -- franchise; insurance and demographic; cybersecurity and Information Technology; legal, regulatory and compliance; market; investment; credit; liquidity; operational; and third party, in consideration of the Company’s business model, structure, operations, and industry affiliation. They are carefully studied, defined, and managed.
The Board has the ultimate responsibility for the Company’s risk management and material controls. The Board, through its various Committees, monitors and evaluates the Company’s total risk management systems and advises Management in the installation of appropriate control mechanisms. These controls are regularly audited to check their effectiveness and reliability. The Board reviewed the Company’s internal controls and Risk Management systems and found the same to be generally sufficient and adequate. The Company’s Risk Management systems are complemented by the Management and employees’ deep commitment to sustain a dynamic and transparent compliance environment.
our StAkeholDer relAtionShipS
We maintain a deep and meaningful relationship with our Members, Customers, InLifers, Agents, Partners, and community (“Stakeholders”). As we move forward, we ensure that no one is left behind. And in the future, we see everyone leading a lifetime for good.
Modes of Communication
•QuarterlyReporting •GroupInsurancePortal
•AnnualReporting •CustomerPortal
•CompanyWebsite •AgentPortal
•MediaBriefingsand Press Conferences
•SocialMediaPlatforms
•AnnualMembers’ Meeting
•Agents’SalesRallies, Conventions and Conferences
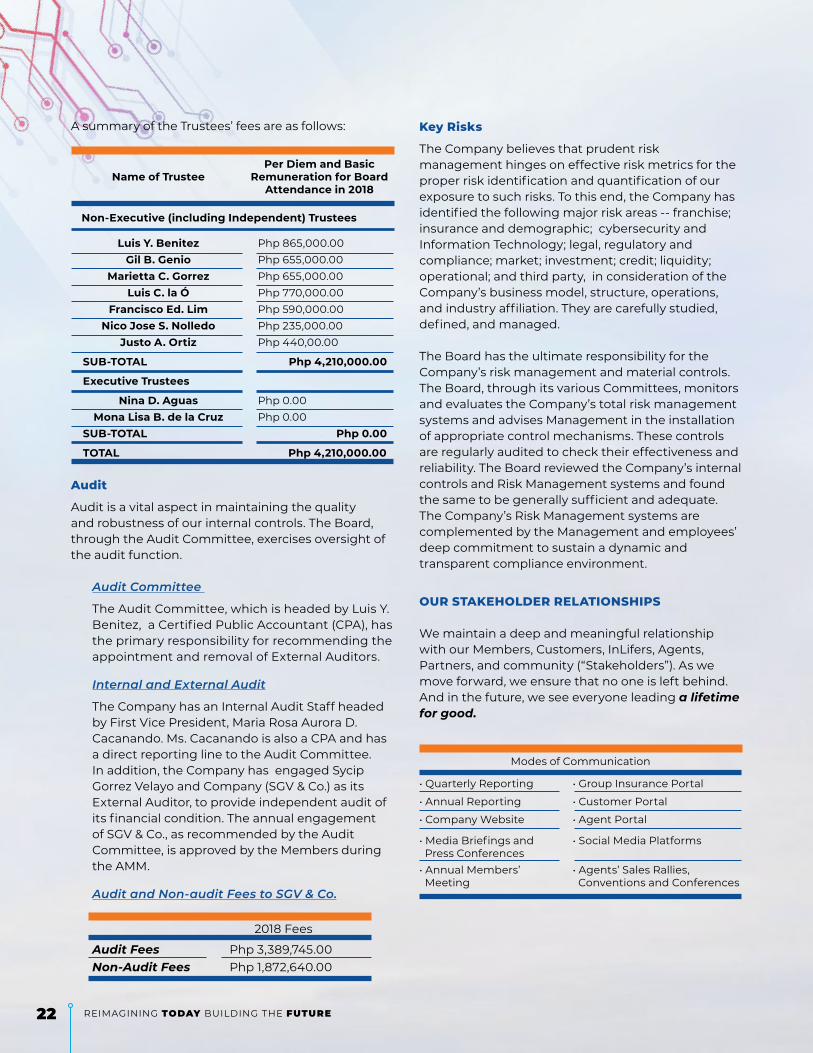
A summary of the Trustees’ fees are as follows:
Name of TrusteePer Diem and Basic
Remuneration for Board Attendance in 2018
Non-Executive (including Independent) Trustees
Luis Y. Benitez Php 865,000.00Gil B. Genio Php 655,000.00
Marietta C. Gorrez Php 655,000.00Luis C. la Ó Php 770,000.00
Francisco Ed. Lim Php 590,000.00Nico Jose S. Nolledo Php 235,000.00
Justo A. Ortiz Php 440,00.00
SuB-TOTAL Php 4,210,000.00
Executive Trustees
Nina D. Aguas Php 0.00Mona Lisa B. de la Cruz Php 0.00
SuB-TOTAL Php 0.00
TOTAL Php 4,210,000.00
Audit
Audit is a vital aspect in maintaining the quality and robustness of our internal controls. The Board, through the Audit Committee, exercises oversight of the audit function.
Audit Committee
The Audit Committee, which is headed by Luis Y. Benitez, a Certified Public Accountant (CPA), has the primary responsibility for recommending the appointment and removal of External Auditors.
Internal and External Audit
The Company has an Internal Audit Staff headed by First Vice President, Maria Rosa Aurora D. Cacanando. Ms. Cacanando is also a CPA and has a direct reporting line to the Audit Committee. In addition, the Company has engaged Sycip Gorrez Velayo and Company (SGV & Co.) as its External Auditor, to provide independent audit of its financial condition. The annual engagement of SGV & Co., as recommended by the Audit Committee, is approved by the Members during the AMM.
Audit and Non-audit Fees to SGV & Co.
2018 Fees
Audit Fees Php 3,389,745.00Non-Audit Fees Php 1,872,640.00
232018 annual report
memberS
The Company is a non-stock, mutual life insurance company in the Philippines. In lieu of stockholders, we have Policyholder-Members (“Members”) who are Members of the Company. Members consist of individual Policyholders of life, health or accident insurance or annuity contracts and the master policyholder of any group insurance policy or plan, excluding individual certificate holders under such master policy.
Our Members have the right to participate effectively and vote in General Members’ Meetings and be informed of the rules including voting procedure that govern it. Unlike in stock corporations, there is no differentiation of majority or minority ownership or control in the Company. During Regular or Special Members’ Meetings, Members who own an insurance policy or contract in force for at least one (1) year as of thirty days prior to the date of the meeting is entitled to one vote, regardless of the number of policies or amount of insurance owned (i.e., “one Member, one vote”).
Members’ Meetings
We highly encourage our Members to attend Regular
and Special Members’ Meetings and to vote on each of the agenda items for the said meetings. To do this, we publish in the Company website the Notice of the Meeting (“Notice”), with the agenda, at least 28 days prior to the date of the meeting. We also publish it in two newspapers of general circulation, once a week for four consecutive weeks prior to the meeting.
In 2018, voting was done in person or in absentia. We also enhanced our Members’ voting experience by allowing a Member or his Proxy to vote through a secured and automated voting system to cast their votes. Through this system, each Member was able to cast his vote - “for, against or abstain”- for each of the agenda items. This system is capable of providing immediate tabulation of votes. The results of the votes were shown on the floor as each agenda was taken up. Only the agenda items as published in the Notice of the AMM were taken up and upon proper motion, were approved. The nominated candidates for the Board of Trustees were also elected individually by the Members. The Chairman of the Board gave an opportunity for Members to ask questions which were answered and addressed by the Board of Trustees. All these were documented in the Minutes of the Meeting.
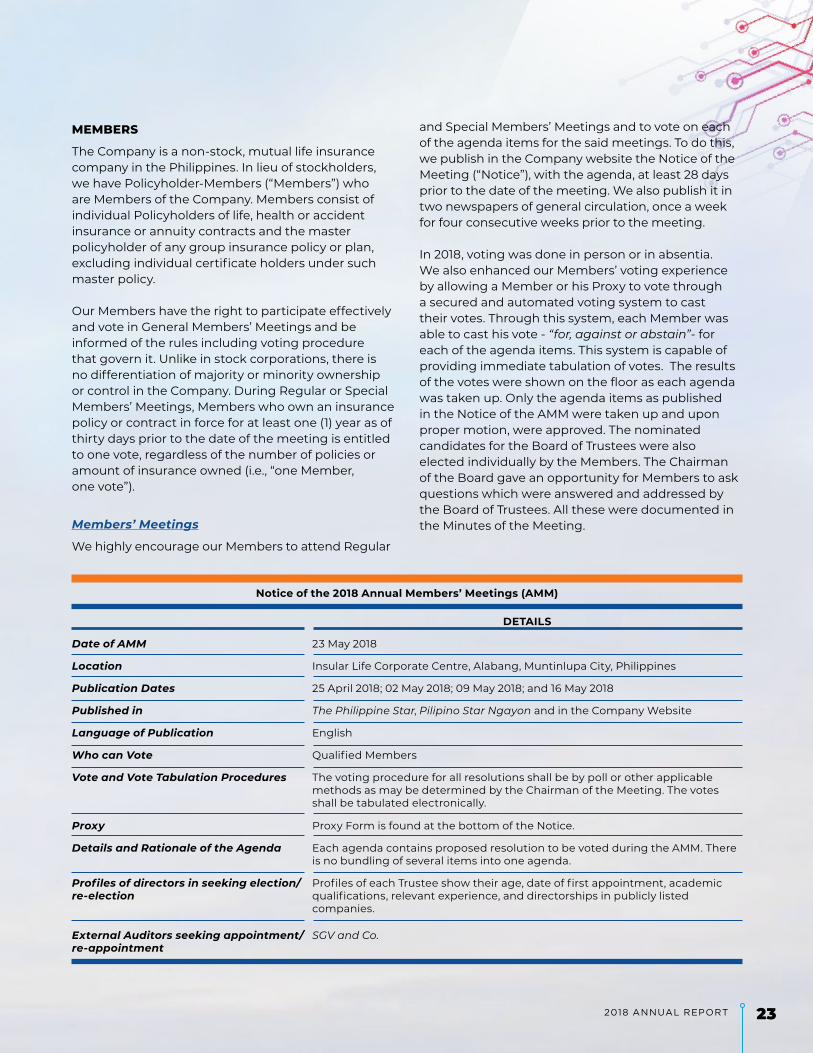
Notice of the 2018 Annual Members’ Meetings (AMM)
DETAILS
Date of AMM 23 May 2018
Location Insular Life Corporate Centre, Alabang, Muntinlupa City, Philippines
Publication Dates 25 April 2018; 02 May 2018; 09 May 2018; and 16 May 2018
Published in The Philippine Star, Pilipino Star Ngayon and in the Company Website
Language of Publication English
Who can Vote Qualified Members
Vote and Vote Tabulation Procedures The voting procedure for all resolutions shall be by poll or other applicable methods as may be determined by the Chairman of the Meeting. The votes shall be tabulated electronically.
Proxy Proxy Form is found at the bottom of the Notice.
Details and Rationale of the Agenda Each agenda contains proposed resolution to be voted during the AMM. There is no bundling of several items into one agenda.
Profiles of directors in seeking election/re-election
Profiles of each Trustee show their age, date of first appointment, academic qualifications, relevant experience, and directorships in publicly listed companies.
External Auditors seeking appointment/re-appointment
SGV and Co.
24 Reimagining Today Building the FuTure
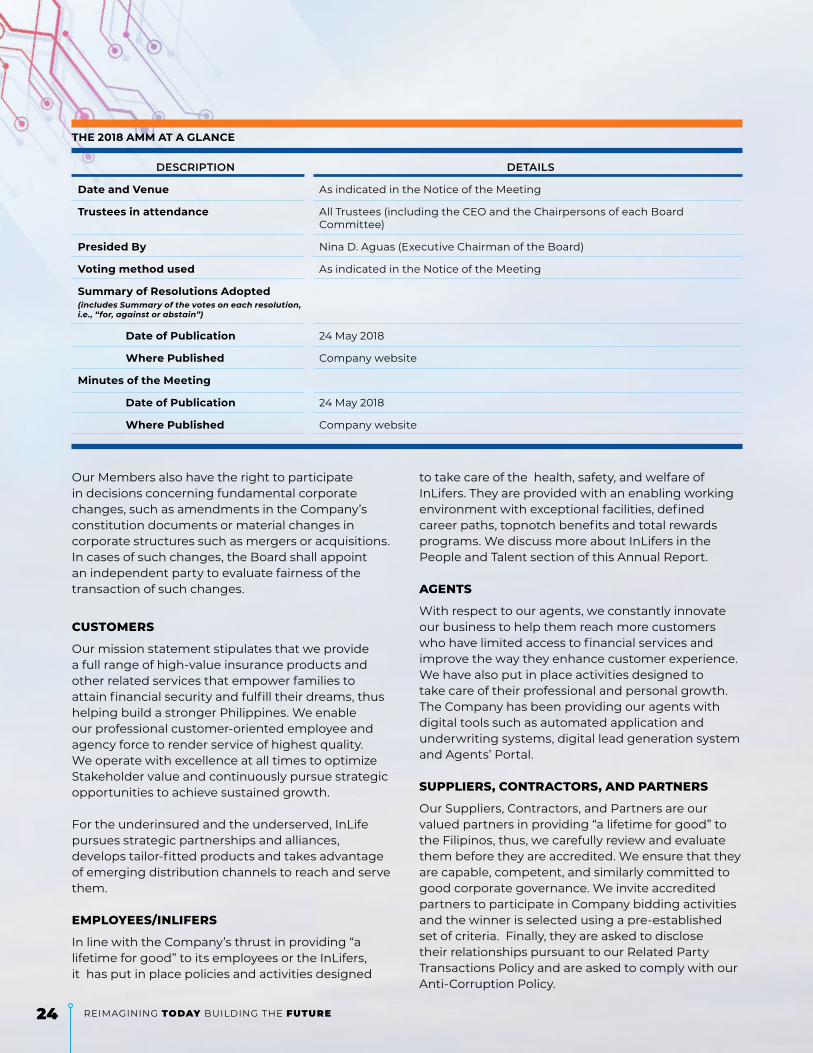
THE 2018 AMM AT A GLANCE
DESCRIPTION DETAILS
Date and Venue As indicated in the Notice of the Meeting
Trustees in attendance All Trustees (including the CEO and the Chairpersons of each Board Committee)
Presided By Nina D. Aguas (Executive Chairman of the Board)
Voting method used As indicated in the Notice of the Meeting
Summary of Resolutions Adopted(includes Summary of the votes on each resolution, i.e., “for, against or abstain”)
Date of Publication 24 May 2018
Where Published Company website
Minutes of the Meeting
Date of Publication 24 May 2018
Where Published Company website
Our Members also have the right to participate in decisions concerning fundamental corporate changes, such as amendments in the Company’s constitution documents or material changes in corporate structures such as mergers or acquisitions. In cases of such changes, the Board shall appoint an independent party to evaluate fairness of the transaction of such changes.
CuStomerS
Our mission statement stipulates that we provide a full range of high-value insurance products and other related services that empower families to attain financial security and fulfill their dreams, thus helping build a stronger Philippines. We enable our professional customer-oriented employee and agency force to render service of highest quality. We operate with excellence at all times to optimize Stakeholder value and continuously pursue strategic opportunities to achieve sustained growth.
For the underinsured and the underserved, InLife pursues strategic partnerships and alliances, develops tailor-fitted products and takes advantage of emerging distribution channels to reach and serve them.
emploYeeS/inliFerS
In line with the Company’s thrust in providing “a lifetime for good” to its employees or the InLifers, it has put in place policies and activities designed
to take care of the health, safety, and welfare of InLifers. They are provided with an enabling working environment with exceptional facilities, defined career paths, topnotch benefits and total rewards programs. We discuss more about InLifers in the People and Talent section of this Annual Report. AgentS
With respect to our agents, we constantly innovate our business to help them reach more customers who have limited access to financial services and improve the way they enhance customer experience. We have also put in place activities designed to take care of their professional and personal growth. The Company has been providing our agents with digital tools such as automated application and underwriting systems, digital lead generation system and Agents’ Portal.
SupplierS, ContrACtorS, AnD pArtnerS
Our Suppliers, Contractors, and Partners are our valued partners in providing “a lifetime for good” to the Filipinos, thus, we carefully review and evaluate them before they are accredited. We ensure that they are capable, competent, and similarly committed to good corporate governance. We invite accredited partners to participate in Company bidding activities and the winner is selected using a pre-established set of criteria. Finally, they are asked to disclose their relationships pursuant to our Related Party Transactions Policy and are asked to comply with our Anti-Corruption Policy.
252018 annual report
CommunitY AnD enVironment
InLife continues to serve and change the lives of millions of Filipinos through our core business and through our many philanthropic activities. As a 100% Filipino organization, we dedicate a great deal of our resources to giving back to the Filipino community through our subsidiary, Insular Foundation, Inc. The Foundation provides educational scholarships or grants, financial literacy programs, and rebuilding and rehabilitation programs for disaster-stricken communities. These projects are geared towards long-term sustainable development for the benefit of the community at large.
We also take care of our environment through employee volunteerism in green projects and investment in green bonds to finance eligible climate projects. The Foundation’s projects are also found in the CSR section of this Annual Report.
CreDitor’S rightS
It is the Company’s policy to respect and protect Creditor’s rights. These rights include the right to be paid on time, right to be promptly provided with information on the financial condition of the Company, and right to data privacy.
In delivering and fulfilling all our contractual obligations, our foremost concern is the continuous validity of InLife’s Certificate of Authority. We also make sure that we comply with all regulatory requirements, including requirements on Capitalization, amended Risk-Based Capital framework or RBC 2, solvency, liquidity, etc. We ensure that the true financial condition of the Company is fully, accurately, and timely disclosed through quarterly reports to the Insurance Commission (IC) and submission of Audited Financial Statements (AFS) to the Securities and Exchange Commission (SEC).
As a Creditor, we conduct proper screening of prospective Borrowers, ensure accurate and complete loan documentation and recording of loan repayments, and strictly observe legal and regulatory reporting on the same. We conduct collection activities without abuses and deceptive practices while enforcing our rights.
Currently, InLife has no Creditor. However, it is our policy that whenever we enter into a loan agreement where we are the Borrower, it shall be referred to the Board for approval. All our legal obligations and commitments under the loan agreement shall be monitored and complied with, subject to regulatory requirements.
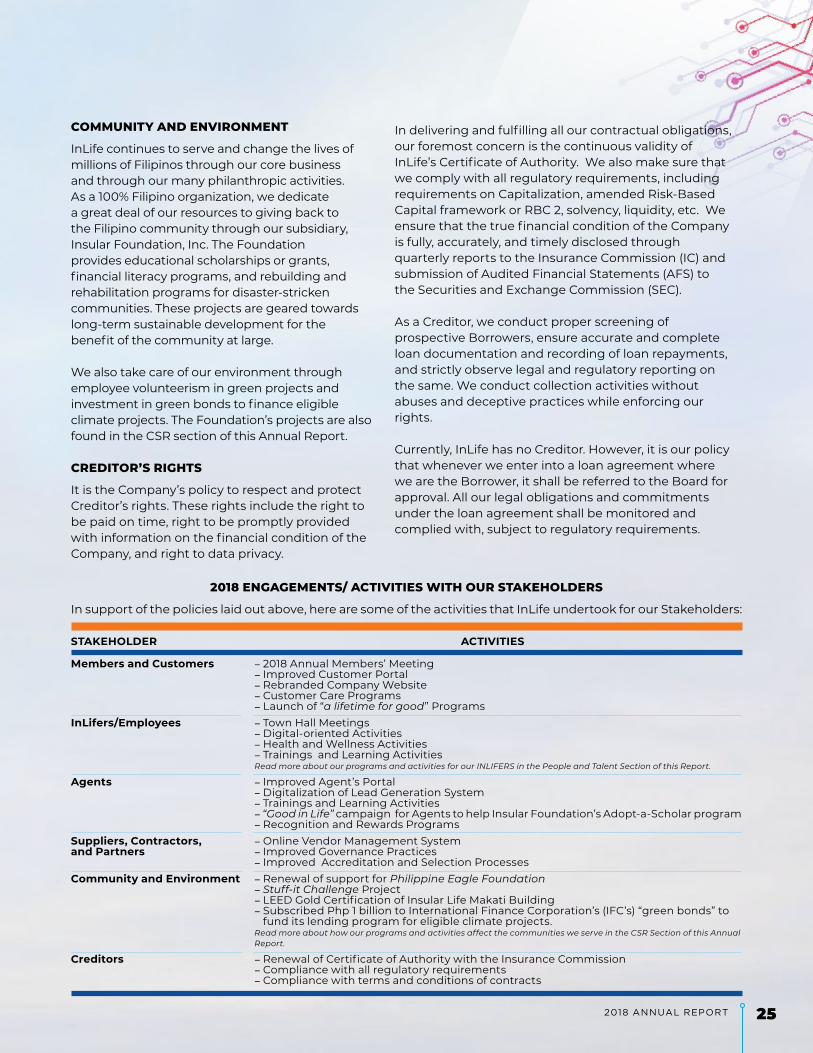
2018 engAgementS/ ACtiVitieS with our StAkeholDerS
In support of the policies laid out above, here are some of the activities that InLife undertook for our Stakeholders:
STAKEHOLDER ACTIVITIES
Members and Customers - 2018 Annual Members’ Meeting- Improved Customer Portal - Rebranded Company Website- Customer Care Programs- Launch of “a lifetime for good” Programs
InLifers/Employees - Town Hall Meetings- Digital-oriented Activities - Health and Wellness Activities - Trainings and Learning ActivitiesRead more about our programs and activities for our INLIFERS in the People and Talent Section of this Report.
Agents - Improved Agent’s Portal - Digitalization of Lead Generation System- Trainings and Learning Activities - “Good in Life” campaign for Agents to help Insular Foundation’s Adopt-a-Scholar program- Recognition and Rewards Programs
Suppliers, Contractors, and Partners
- Online Vendor Management System- Improved Governance Practices- Improved Accreditation and Selection Processes
Community and Environment - Renewal of support for Philippine Eagle Foundation- Stuff-it Challenge Project- LEED Gold Certification of Insular Life Makati Building- Subscribed Php 1 billion to International Finance Corporation’s (IFC’s) “green bonds” to fund its lending program for eligible climate projects.Read more about how our programs and activities affect the communities we serve in the CSR Section of this Annual Report.
Creditors - Renewal of Certificate of Authority with the Insurance Commission - Compliance with all regulatory requirements- Compliance with terms and conditions of contracts
26 Reimagining Today Building the FuTure
our Commitment to trAnSpArent DiSCloSureS
Performance Indicators
Financial Non-Financial
•FinancialCondition•PerformanceofFund
Values
• Customer Satisfaction• Talent Acquisition• Regulatory Compliance• Operational Efficiency• Corporate Social
Responsibility (CSR) Capability
Audited Annual/Financial Reports
The 2018 Annual Report (AR), which contained the Consolidated Audited Financial Statements, was published in the Company website on 26 April 2018, 116 days after end of financial year. This is one day earlier than the publishing of the 2017 AR last year.
Dividend Policy for Members
Our qualified Members receive policy dividends as returns of their premiums paid. The Company allocates and pays policy dividends as and when they are declared, and in such amounts as approved by the Board of Trustees. The amount of policy dividends is determined based on a three-factor formula which calculates the Company’s performance vis-a-vis assumptions on investment income, mortality, and expense loading, taking into consideration regulatory requirements and the Company’s capital and future operating needs. The provision for policy dividends for 2018 is P184,906,941.00.
Anti-Corruption Programs and Procedures
The Company ensures that all its business dealings are conducted honestly, above-board, transparent and in accordance with the law. We do our best to keep our Company free from any unethical or corrupt practices. These include:
Anti-Corruption Policy
The Company adopts a zero tolerance stand on Corruption across the organization. The policy prohibits the abuse of position or influence in exchange for undue gain or advantage. This policy applies to all Trustees, InLifers, Agents, Customers and Partners.
Related Party Transactions Policy
The Company’s Related Party Transactions (RPT) policy defines a Related Party and requires that all transactions of the Company with RPs are conducted fairly, at arm’s length and in the best interest of the Company and its Stakeholders.
Specific clearance is required for RPTs depending on the amount involved. If the transaction amount is material, then the RPT will be endorsed to the RPT Board Committee and/or Board for review and approval. The RPT Board Committee is composed of three (3) Trustees. Gil B. Genio, an Independent Trustee, currently serves as the Committee Chair. The Board ensures that all material RPTs are soundly and prudently managed, with integrity and in compliance with applicable laws rules, and regulations.
RPTs are disclosed in the Notes to the Consolidated Statements in this Annual Report. There is no RPT that can be classified as financial assistance to entities other than wholly-owned subsidiaries. In 2018, there is no case of non-compliance with laws, rules or regulations pertaining to material RPTs.
Conflict of Interest
It is the Company’s policy to ensure that any Trustee or InLifer declare potential or actual conflict of interest, and must abstain and/or inhibit themselves from participating in any material discussion or approval of the same. All Trustees and InLifers are required to disclose any conflict of interest as part of their respective annual performance assessments.
Whistleblowing Policy
The Company encourages free and open communication with our Stakeholders and the general public through our official websites, portals, and social media accounts. We believe that feedback from our Stakeholders are valuable considerations in our business growth. In line with this, the Company provides whistleblowing platforms to voice Stakeholder concerns and/or complaints for possible violations of their rights or violation of Company policies.

272018 annual report
A Stakeholder may choose from any of our Whistleblowing platforms:
option DetAilS
Meeting with Atty. Renato S. De JesusCompliance Officer Head Office, Insular Life
OR
Ms. Maria Aurora Cacanando Head of Audit StaffHead Office, Insular Life
Emailing our dedicated WB email address
Calling dedicated WB voicemail
+632 582-1818 local 1868Available 24/7, up to ten (10) minutes per recorded call.
inFormAtion loCAtion
Business Operations Website
NewsAbout us
Governance
https://www.insularlife.com.phhttps://www.insularlife.com.ph/news; https://www.insularlife.com.ph/about-insular-life?&scroll=milestones; https://www.insularlife.com.ph/governance-reports
Financial Statements/Reports https://www.insularlife.com.ph/about-insular-life?&scroll=insular-life-corporate&mode=collapse&target=collapse-about-6
Corporate Structure https://www.insularlife.com.ph/about-insular-life?&scroll=insular-life-corporate&mode=collapse&target=collapse-about-6
Downloadable Annual Reports https://www.insularlife.com.ph/about-insular-life?&scroll=insular-life-corporate&mode=collapse&target=collapse-about-6
Notice of Annual Members’ Meetings https://www.insularlife.com.ph/governance-reports
Minutes of the Annual Members’ Meetings https://www.insularlife.com.ph/governance-reports
Articles of Incorporation and By-Laws https://www.insularlife.com.ph/corporate-governance
We encourage reports to be done in good faith and to provide contact details of the Whistleblower so that we may be able to communicate with them and get more information when necessary. The Whistleblower may also report anonymously. All good faith reports received shall be kept confidential and will be protected from any form of retaliatory action, in accordance with the Company’s Whistleblowing Policy.
Company website
We disseminate all material financial and non-financial performance indicators about our Company in all available communication venues, whether digital or in print. We use various platforms for broadcasting the latest information about our Company, our Subsidiaries, our products and our Inlifers. In particular, we ensure that our Company website, including Customer and Agent Portals, convey updated and accurate information about operations and financial condition.
28 Reimagining Today Building the FuTure
Subsidiary and Affiliate’sperFormAnCe highlightS
inSulAr heAlth CAre, inC.
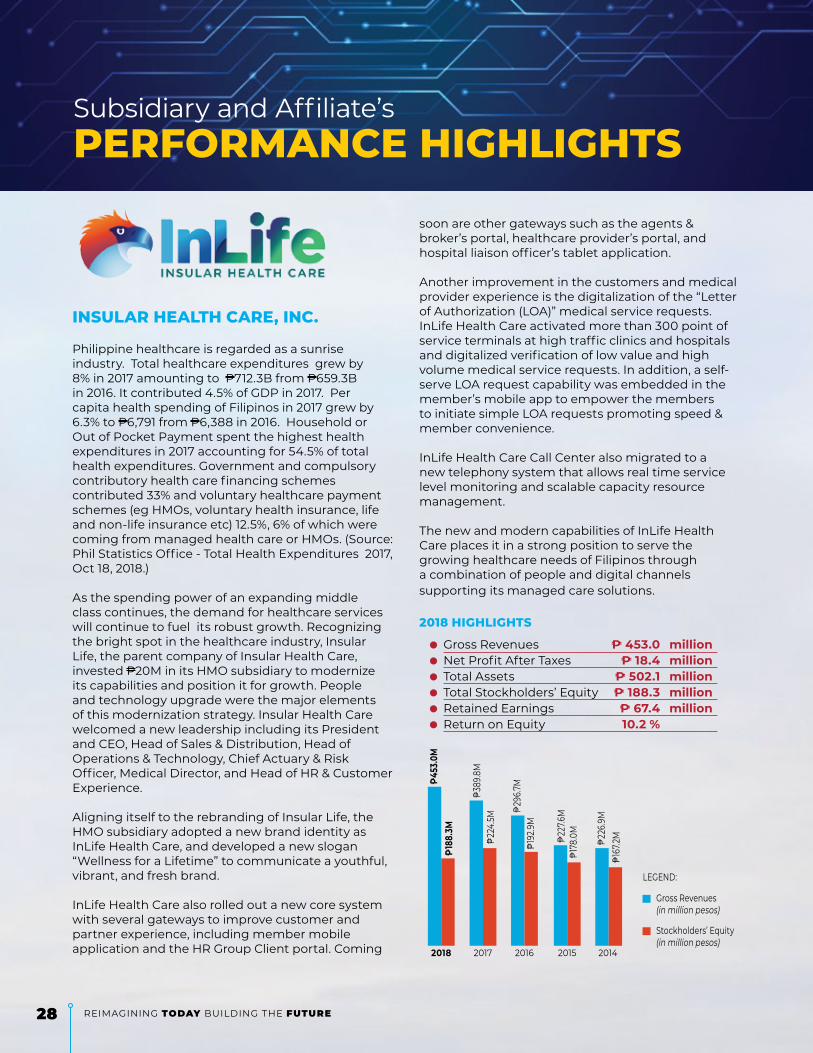
Philippine healthcare is regarded as a sunrise industry. Total healthcare expenditures grew by 8% in 2017 amounting to P712.3B from P659.3B in 2016. It contributed 4.5% of GDP in 2017. Per capita health spending of Filipinos in 2017 grew by 6.3% to P6,791 from P6,388 in 2016. Household or Out of Pocket Payment spent the highest health expenditures in 2017 accounting for 54.5% of total health expenditures. Government and compulsory contributory health care financing schemes contributed 33% and voluntary healthcare payment schemes (eg HMOs, voluntary health insurance, life and non-life insurance etc) 12.5%, 6% of which were coming from managed health care or HMOs. (Source: Phil Statistics Office - Total Health Expenditures 2017, Oct 18, 2018.)
As the spending power of an expanding middle class continues, the demand for healthcare services will continue to fuel its robust growth. Recognizing the bright spot in the healthcare industry, Insular Life, the parent company of Insular Health Care, invested P20M in its HMO subsidiary to modernize its capabilities and position it for growth. People and technology upgrade were the major elements of this modernization strategy. Insular Health Care welcomed a new leadership including its President and CEO, Head of Sales & Distribution, Head of Operations & Technology, Chief Actuary & Risk Officer, Medical Director, and Head of HR & Customer Experience.
Aligning itself to the rebranding of Insular Life, the HMO subsidiary adopted a new brand identity as InLife Health Care, and developed a new slogan “Wellness for a Lifetime” to communicate a youthful, vibrant, and fresh brand.
InLife Health Care also rolled out a new core system with several gateways to improve customer and partner experience, including member mobile application and the HR Group Client portal. Coming
soon are other gateways such as the agents & broker’s portal, healthcare provider’s portal, and hospital liaison officer’s tablet application.
Another improvement in the customers and medical provider experience is the digitalization of the “Letter of Authorization (LOA)” medical service requests. InLife Health Care activated more than 300 point of service terminals at high traffic clinics and hospitals and digitalized verification of low value and high volume medical service requests. In addition, a self-serve LOA request capability was embedded in the member’s mobile app to empower the members to initiate simple LOA requests promoting speed & member convenience.
InLife Health Care Call Center also migrated to a new telephony system that allows real time service level monitoring and scalable capacity resource management.
The new and modern capabilities of InLife Health Care places it in a strong position to serve the growing healthcare needs of Filipinos through a combination of people and digital channels supporting its managed care solutions.
2018 highlightS
Gross Revenues ₱ 453.0 million Net Profit After Taxes ₱ 18.4 million Total Assets ₱ 502.1 million Total Stockholders’ Equity ₱ 188.3 million Retained Earnings ₱ 67.4 million Return on Equity 10.2 %
₱389
.8M
Gross Revenues (in million pesos)
LEGEND:
Stockholders’ Equity (in million pesos)
₱453
.0M
₱296
.7M
₱227
.6M
₱226
.9M
₱224
.5M
₱18
8.3M
₱192
.9M
₱178
.0M
₱167
.2M
20172018 2016 2015 2014

292018 annual report
mApFre inSulAr
MAPFRE INSULAR emerged to surpass a very challenging 2018. The company withstood the continuing threat of a highly competitive non-life insurance market, the push-and-pull effect of TRAIN LAW implementation, the financial challenge brought by slowdown of Philippines’ investment market and peso depreciation, and the adverse effect of operational changes.
The company continued to transform the business into several areas of expertise that include: finance; issuance, claims, and delivery operations; technical underwriting; and commercial distribution and human capital, leveraging on technological advances to re-allocate and maximize resources. The centralization of key processes resulted in better management and improved quality of work and ultimately reduced administrative costs.
Technology has always been one of MAPFRE INSULAR’s strong points. Automation of repetitive tasks took place, MAPFRE Insular Virtual Office was reinforced in Q4 2018, and digital technology was seen to support non-digital, conventional, real-life channels. Two digital services were installed on its website, the CTPL Online (compulsory third party liability) Page which allows customers to apply for and process CTPL insurance online, and the Claims Upload Documents (UpDocs) Page which provides customers a convenient and hassle-free way to submit claims documents right from their home or wherever they are.
MAPFRE INSULAR’s commercial structure was also re-focused towards prioritized distribution channels. This meant the relocation of 10 offices and the opening of six new offices for a new sales team. This aided MAPFRE to enhance market reach; to shift to a production-based structure; to achieve organizational efficiency; and to increase profitability.
The continuing efforts to transform has redefined MAPFRE INSULAR from a provider into a partner to its customers and intermediaries. These led to
better claims experience, improved acquisition costs and managed expenses in 2018. And despite the combined impact of lower premiums written and a more challenging investment market, its overall performance resulted in a positive income, with a 98.7% combined ratio. Net result before taxes went up by 95.9% compared to 2017. Net results after taxes is P32.7M, higher by 69% compared to last year.
Key audited financial and solvency indicators that demonstrate the strength of MAPFRE INSULAR as one of the most relevant insurance companies in the country:
2018 highlightS
Total assets ₱ 4.84 billion Net worth ₱ 1.02 billion Cash and Financial Investments ₱ 1.24 billion Risk Based Capital (RBC II) Ratio 232%
Furthermore, based on submitted Year 2017 Annual statement, MAPFRE INSULAR ranks among the top 10 in the non-life insurance industry in terms of earned premiums and assets.
MAPFRE INSULAR will retain its position as among the highly capitalized and most solvent non-life insurance business in the country. The alliance of MAPFRE, a leading insurance company in Spain with more than 30 million customers worldwide and business activities in over 100 countries, and Insular Life Assurance Co., Ltd, the Philippines’ largest Filipino-owned insurer, will enable MAPFRE INSULAR to meet the new capitalization and reserve requirements set by the Insurance Commission.
Assets
LEGEND:
Gross Premiums Written
₱4.8
B
₱4.5B
₱1.7
B ₱2.2B
₱2.2B
2018 2017
₱5.8
B
2016
₱5.8
B
₱2.0
B
2015
₱5.9B
₱2.2B
2014
30 Reimagining Today Building the FuTure
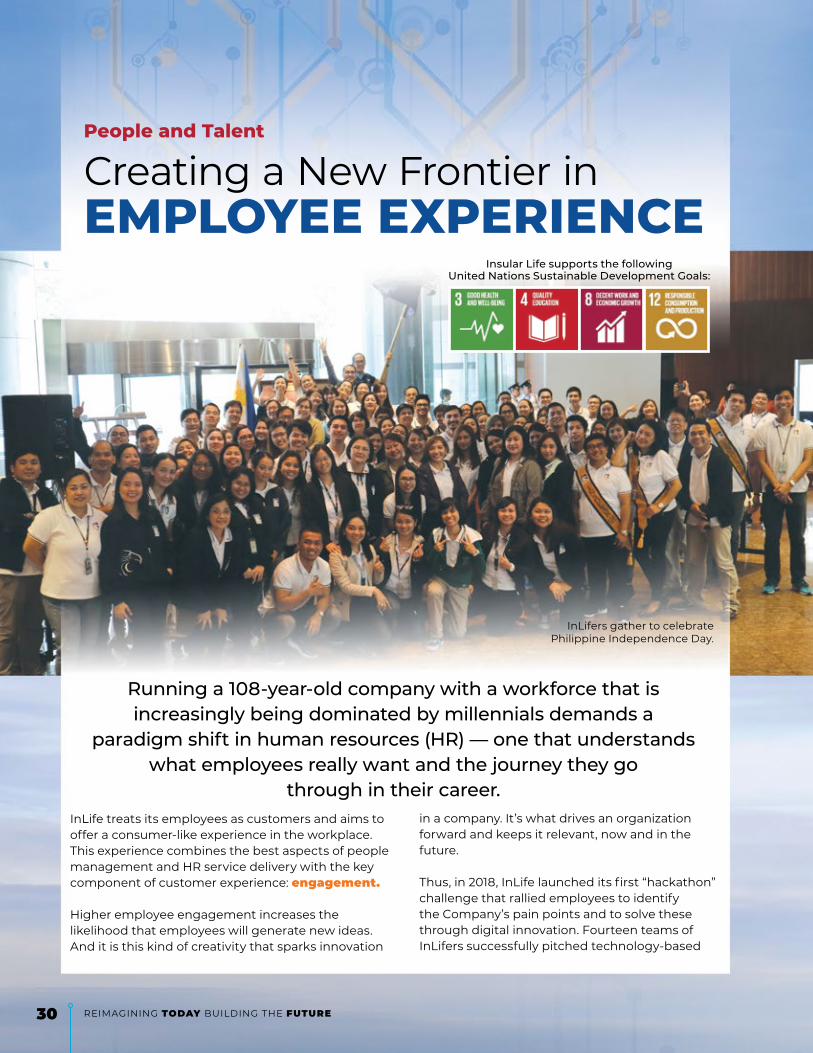
Running a 108-year-old company with a workforce that is increasingly being dominated by millennials demands a
paradigm shift in human resources (HR) — one that understands what employees really want and the journey they go
through in their career.
Creating a New Frontier inemploYee experienCe
people and talent
Insular Life supports the following United Nations Sustainable Development Goals:
InLife treats its employees as customers and aims to offer a consumer-like experience in the workplace. This experience combines the best aspects of people management and HR service delivery with the key component of customer experience: engagement.
Higher employee engagement increases the likelihood that employees will generate new ideas. And it is this kind of creativity that sparks innovation
in a company. It’s what drives an organization forward and keeps it relevant, now and in the future.
Thus, in 2018, InLife launched its first “hackathon” challenge that rallied employees to identify the Company’s pain points and to solve these through digital innovation. Fourteen teams of InLifers successfully pitched technology-based
InLifers gather to celebrate Philippine Independence Day.
30 REIMAGINING Today BUILDING THE FuTure

312018 annual report
Creating a New Frontier inemploYee experienCe
solutions to reduce paper-based processes in the Company. Today, some of these solutions are already being implemented, including a prototype of an app on handling purchase request forms which bagged for the Actuarial Division team the top prize in the 1st Hackathon Competition Finals held in October 2018. This demonstrated InLifers’ intuitive use of design thinking, user experience, and technology.
Digital inlifeSince 2017, the Company has also been embarking on HR initiatives that digitalize the employee experience journey. These include moving performance management, training, and talent acquisition, to name a few, towards automated, paperless platforms for increased operational efficiency and robust documentation. Along these lines, the following initiatives were launched or undertaken in 2018:
performance management HR deployed a new performance management tool to facilitate goal setting and increase focus on delivering results. Learning sessions for people managers were held to take advantage of digital technology and strengthen even more the accountability for performance outcomes. It also began to implement a mid-year performance review as a formal feedback mechanism between leaders and employees.
A blended approach to training called “70-20-10” was introduced. This is aligned with current trends and insights that employees learn 70% of the time from experience or project-based development action plans; 20% from relationship development plans such as coaching, mentoring, and shadowing; and only 10% from classroom training. Going by this rule, InLife encouraged managers to explore ways to close skills and competency gaps through experiential development action plans.
talent AcquisitionTalent acquisition in the Company was also digitalized for easy processing and monitoring. Requests for additional manpower or talent replacement are now made easier, faster, and more convenient using an online process that did away with the requirement to route papers.
training and DevelopmentTraining enrollment and evaluation have also been digitalized in 2018. Key competencies in a highly digital work environment were identified as priority in training. These skills are mostly centered on collaboration, such as developing personal excellence, managing change, and working with others. The IT Division of InLife also started to adopt the agile methodology, while the Operations Group increasingly incorporated agile thinking into its systems and processes.
InLife also started developing e-learning modules for mandatory courses or
industry-oriented skills such as information security and data privacy. InLife’s Compliance Division also continued to
cascade information on new insurance-related guidelines
and policies.
These boosted the Company’s training and development in 2018. Average training hours climbed to 26 hours from 19 hours in the previous year. External training rose to 18% from 11% year on year, with the average hours rising to eight hours.
In addition, InLife enhanced its Life Office Management Association (LOMA) designation program guidelines that allowed more employees to enroll in various courses while keeping within its budget. Enrollment in LOMA , the employee training and development program used by life insurance companies in over 70 countries worldwide, increased to 17% in 2018 from 11% in 2017.
Feedback mechanismThe Company continually solicited feedback on its training programs to ensure that they are relevant

32 Reimagining Today Building the FuTure
to business requirements as well as employees development needs. Training evaluations were used to improve and/or modify the training programs.
To foster an open work environment that is conducive to innovation and collaboration, it is expanding the employee feedback mechanism by conducting an employee satisfaction survey to allow employees to give their comments and inputs on every InLife employee event. Creative engagementIn addition to providing InLifers with a digital life to enhance their employee experience journey, the Company has also joined the growing number of companies that are shifting their focus from employee wellness programs to well-being initiatives. These include providing more comprehensive health and productivity programs that tackle emotional and mental health, social connectivity, financial education, sense of fulfillment on the job, and many other aspects.
InLife believes these initiatives can significantly raise employee engagement, cohesiveness, and
productivity. According to research, a healthy and happy workforce can reduce costs as employees reduce leave days caused by disability or unplanned sickness (Forbes magazine, July 5, 2017 article).
In 2018, the Company heightened its employee engagement, particularly in areas of innovation, strategy, information security, and bancassurance.
More than half of its 800-strong workforce is composed of millennials, who bring their digital mindset to the business. The following are the initiatives launched in 2018:
eventsThe Company mounted several themed parties and events in 2018 to provide a platform for solidarity and camaraderie within the organization. Its official Company Christmas party featured cross-functional team presentations that revolved around the theme,
InLife Christmas party with the theme “The Greatest Showman”
featured cross-functional team presentations.
Themed event provided a platform for camaraderie.
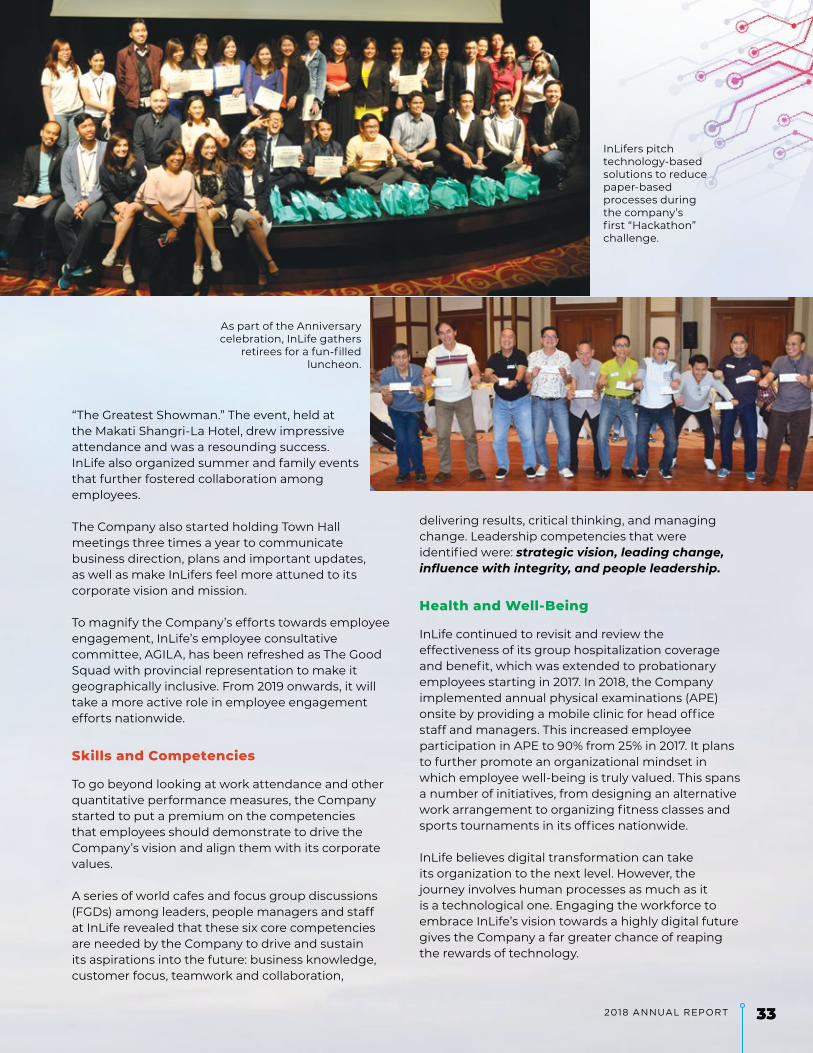
332018 annual report
“The Greatest Showman.” The event, held at the Makati Shangri-La Hotel, drew impressive attendance and was a resounding success. InLife also organized summer and family events that further fostered collaboration among employees.
The Company also started holding Town Hall meetings three times a year to communicate business direction, plans and important updates, as well as make InLifers feel more attuned to its corporate vision and mission.
To magnify the Company’s efforts towards employee engagement, InLife’s employee consultative committee, AGILA, has been refreshed as The Good Squad with provincial representation to make it geographically inclusive. From 2019 onwards, it will take a more active role in employee engagement efforts nationwide.
Skills and Competencies
To go beyond looking at work attendance and other quantitative performance measures, the Company started to put a premium on the competencies that employees should demonstrate to drive the Company’s vision and align them with its corporate values.
A series of world cafes and focus group discussions (FGDs) among leaders, people managers and staff at InLife revealed that these six core competencies are needed by the Company to drive and sustain its aspirations into the future: business knowledge, customer focus, teamwork and collaboration,
delivering results, critical thinking, and managing change. Leadership competencies that were identified were: strategic vision, leading change, influence with integrity, and people leadership.
health and well-being
InLife continued to revisit and review the effectiveness of its group hospitalization coverage and benefit, which was extended to probationary employees starting in 2017. In 2018, the Company implemented annual physical examinations (APE) onsite by providing a mobile clinic for head office staff and managers. This increased employee participation in APE to 90% from 25% in 2017. It plans to further promote an organizational mindset in which employee well-being is truly valued. This spans a number of initiatives, from designing an alternative work arrangement to organizing fitness classes and sports tournaments in its offices nationwide.
InLife believes digital transformation can take its organization to the next level. However, the journey involves human processes as much as it is a technological one. Engaging the workforce to embrace InLife’s vision towards a highly digital future gives the Company a far greater chance of reaping the rewards of technology.
InLifers pitch technology-based solutions to reduce paper-based processes during the company’s first “Hackathon” challenge.
As part of the Anniversary celebration, InLife gathers
retirees for a fun-filled luncheon.
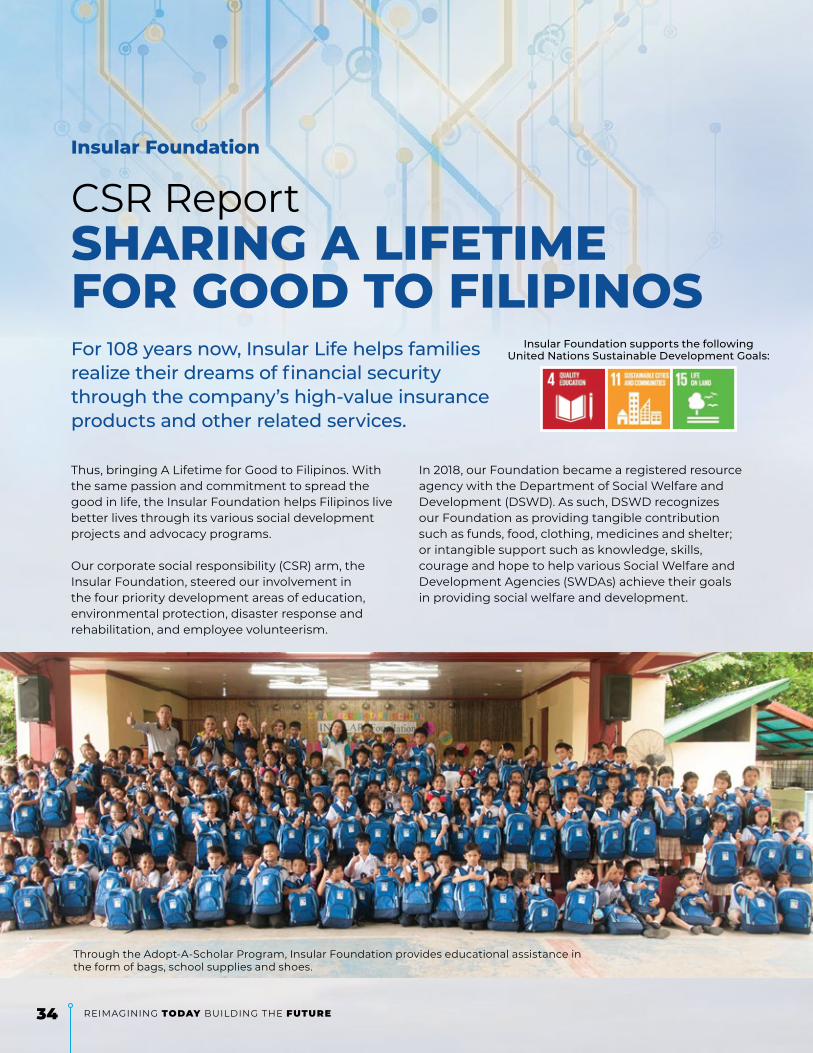
34 Reimagining Today Building the FuTure
CSR ReportShAring A liFetime For gooD to FilipinoS
insular Foundation
For 108 years now, Insular Life helps families realize their dreams of financial security through the company’s high-value insurance products and other related services. Thus, bringing A Lifetime for Good to Filipinos. With the same passion and commitment to spread the good in life, the Insular Foundation helps Filipinos live better lives through its various social development projects and advocacy programs.
Our corporate social responsibility (CSR) arm, the Insular Foundation, steered our involvement in the four priority development areas of education, environmental protection, disaster response and rehabilitation, and employee volunteerism.
In 2018, our Foundation became a registered resource agency with the Department of Social Welfare and Development (DSWD). As such, DSWD recognizes our Foundation as providing tangible contribution such as funds, food, clothing, medicines and shelter; or intangible support such as knowledge, skills, courage and hope to help various Social Welfare and Development Agencies (SWDAs) achieve their goals in providing social welfare and development.
Through the Adopt-A-Scholar Program, Insular Foundation provides educational assistance in the form of bags, school supplies and shoes.
Insular Foundation supports the following United Nations Sustainable Development Goals:

352018 annual report
Throughout the year, we strengthened our capacity-building programs, multiplied our program beneficiaries, and engaged with partner institutions to support high-impact and relevant social projects nationwide.
inVeSting in eDuCAtion
At the heart of our Foundation is the priority investment in education which is an enabler of opportunities for the less fortunate but determined young learners.
We strengthened our college scholarship program by adding BS Statistics in the qualified degree programs, and multiplied our student beneficiaries in public elementary schools by almost nine times.
Through the Adopt-A-Scholar Program, we provided P1,461,000 in total educational assistance in the form of bags, school supplies and shoes. And thanks to the “Good InLife” Campaign wherein our Foundation matched the donation of InLife employees and agents, we increased the total number of scholar-beneficiaries to 1,410 in 2018 from only 160 in 2017.
We turned over school supplies to student beneficiaries in nine partner schools, namely, Itaas Elementary School and Alabang Elementary School in Muntinlupa City, Balili Elementary School in Benguet, Wangan Elementary School in Davao, Patagueleg Elementary School in Cagayan, Bangar Elementary School in Ifugao, Inaad Elementary School in Ormoc, Old Kawayan Elementary School in Tacloban, and Tabok Elementary School in Cebu.
Our Gold Eagle College Scholars with InLife Executive Chairman Nina Aguas (standing, sixth from left), President and CEO Mona Lisa dela Cruz (standing, seventh from left), and Foundation Executive Director Ana Maria Soriano (standing, extreme right).
Our foundation joined hands with Save the Children to provide educational support to around 1,000 displaced children from Marawi through the Balik-Marawi, Balik-Eskwela Program.
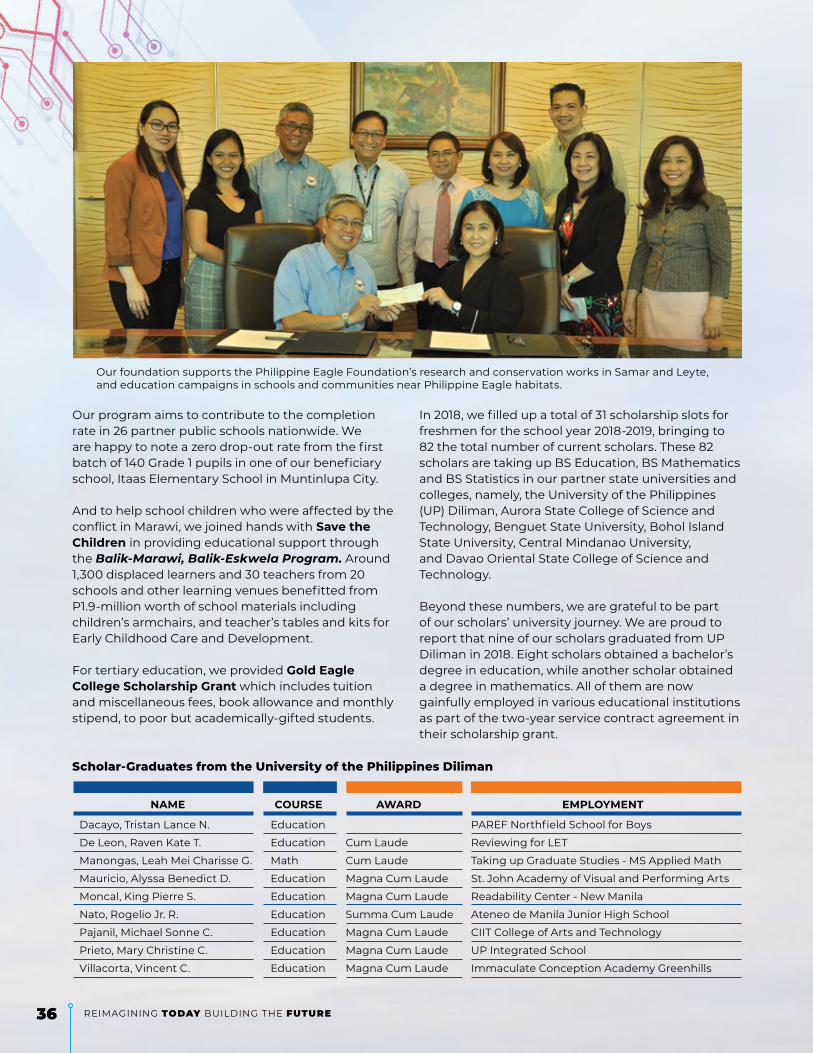
36 Reimagining Today Building the FuTure
In 2018, we filled up a total of 31 scholarship slots for freshmen for the school year 2018-2019, bringing to 82 the total number of current scholars. These 82 scholars are taking up BS Education, BS Mathematics and BS Statistics in our partner state universities and colleges, namely, the University of the Philippines (UP) Diliman, Aurora State College of Science and Technology, Benguet State University, Bohol Island State University, Central Mindanao University, and Davao Oriental State College of Science and Technology.
Beyond these numbers, we are grateful to be part of our scholars’ university journey. We are proud to report that nine of our scholars graduated from UP Diliman in 2018. Eight scholars obtained a bachelor’s degree in education, while another scholar obtained a degree in mathematics. All of them are now gainfully employed in various educational institutions as part of the two-year service contract agreement in their scholarship grant.
Scholar-graduates from the university of the philippines Diliman
NAME COuRSE AWARD EMPLOYMENT
Dacayo, Tristan Lance N. Education PAREF Northfield School for Boys
De Leon, Raven Kate T. Education Cum Laude Reviewing for LET
Manongas, Leah Mei Charisse G. Math Cum Laude Taking up Graduate Studies - MS Applied Math
Mauricio, Alyssa Benedict D. Education Magna Cum Laude St. John Academy of Visual and Performing Arts
Moncal, King Pierre S. Education Magna Cum Laude Readability Center - New Manila
Nato, Rogelio Jr. R. Education Summa Cum Laude Ateneo de Manila Junior High School
Pajanil, Michael Sonne C. Education Magna Cum Laude CIIT College of Arts and Technology
Prieto, Mary Christine C. Education Magna Cum Laude UP Integrated School
Villacorta, Vincent C. Education Magna Cum Laude Immaculate Conception Academy Greenhills
Our program aims to contribute to the completion rate in 26 partner public schools nationwide. We are happy to note a zero drop-out rate from the first batch of 140 Grade 1 pupils in one of our beneficiary school, Itaas Elementary School in Muntinlupa City.
And to help school children who were affected by the conflict in Marawi, we joined hands with Save the Children in providing educational support through the Balik-Marawi, Balik-Eskwela Program. Around 1,300 displaced learners and 30 teachers from 20 schools and other learning venues benefitted from P1.9-million worth of school materials including children’s armchairs, and teacher’s tables and kits for Early Childhood Care and Development.
For tertiary education, we provided Gold Eagle College Scholarship Grant which includes tuition and miscellaneous fees, book allowance and monthly stipend, to poor but academically-gifted students.
Our foundation supports the Philippine Eagle Foundation’s research and conservation works in Samar and Leyte, and education campaigns in schools and communities near Philippine Eagle habitats.

372018 annual report
Our Foundation, through our Company Scholarship for Employee Dependents, also provided scholarship grants to 16 dependents of InLife employees. One of the scholars, Alec Leviste, graduated Cum Laude from De La Salle University and passed the Certified Public Accountant licensure examination.
promoting FinAnCiAl literACY
Educating the youth on financial wellness early on is a concrete step towards encouraging intelligent consumers and contributors to the national economy. With this in mind, we collaborated with the Knowledge Channel for the release of two episodes of Estudyantipid financial literacy videos with teacher’s manual, for Grade 9 Araling Panlipunan – Macroeconomics subject.
These two videos featuring young actors Sharlene San Pedro and Jairus Aquino were expected to reach students from 3,300 public schools nationwide.
CAring For the enVironment
For us, the Philippine Eagle is not just our logo. We are involved in conscientious efforts to preserve our national bird, the biodiversity it represents, and the sustainable use of our forest resources for future generations. We found a most suitable partner in the Philippine Eagle Foundation (PEF). The PEF focuses on the great Philippine Eagle not only to recover its
Our Foundation turned over shelter repair kits and cash assistance to
families affected by typhoon Ompong in Baggao, Cagayan.
dwindling population but also to protect its forest habitats and ensure the sustainable use of the forests’ bounties for the people.
For a P3-million donation spread over three years,
we support PEF’s research and conservation works in Samar and Leyte, as well as
education and public awareness campaigns in schools and
communities near Philippine Eagle habitats.
Our support funding of P1 million in 2018 has already produced a very positive result when the PEF reported that they have finally located the first active eagle nest in the Visayas.

38 Reimagining Today Building the FuTure
Our employee volunteers take part in the monthly outreach activity in Gawad Kalinga.
pitChing in poSt-DiSASter rehAbilitAtion
The frequent calamities and disasters in the country all year round causes the displacement of families in affected communities. In the area of Disaster Response and Rehabilitation, we teamed up with the Philippine Business for Social Progress (PBSP) to reach out to Filipinos who have lost their homes due to typhoon Ompong in Baggao, Cagayan. We provided shelter repair kits and cash assistance to 20 families.
FoStering VolunteeriSm
At the core of our Foundation are our employee volunteers who contributed almost 700 hours in various outreach activities, including the monthly outreach activity in Gawad Kalinga. In 2018, our employee volunteers celebrated the sixth anniversary with our adopted village, the Gawad Kalinga Manggahan Village, by completing the repair and repainting of its Tambayani Center.
And reliving the spirit of Christmas, our employee volunteers conducted an immersion day or “pakikipamuhay” in SOS Village, an orphanage in Alabang, Muntinlupa.
One of our foundation volunteer, Gellyn Camalig, shared that in this memorable event, they were rewarded with the happy faces of the children. She added that through our Foundation activities, she is

392018 annual report
able to give back and share her knowledge, talent and time. “Volunteering brings fulfillment into my life. It reduces stress and provides sense of purpose.”
Indeed, 2018 is a demonstrates our strong commitment to serve students and teachers, help
At the core of our Foundation are our employee volunteers who contribute their time and talent.
communities in need, contribute to environmental protection programs, and encourage volunteerism. Our Foundation leads us in our mission to share A Lifetime for Good to Filipinos.
ESTU
DYA
NTIPID FINANCIAL LITERA
CY VIDEOS
ENV
IRONMENTAL CONSERVATIO
N
DIS
AST
ER R
ESPONSE AND REHABILITA
TION
AD
OPT
-A
-SCHOLAR PROGRAM
GOLD
EA
GLE
CO
LL
EGE SCHOLARSHIP GRAN
T
COM
PAN
Y SC
HOLA
RSHIP FOR EMPLOYEE DEP
END
ENTS
1,410Student-beneficiaries
26public elementary schools nationwide
82Scholars taking up
BS Education, BS Mathematicsand BS Statistics
16
3,300
Scholars
9graduates from the
University ofthe Philippines
1graduate from De La Salle
University (Cum Laude) andpasser of the Certified
Public AccountantLicensure
Examination
public schoolbeneficiariesnationwide
20families displaced
by typhoon Ompongin Baggao, Cagayan
Philippine EagleFoundation located
the first active eagle nestin VisayasPROGRAM
ANDBENEFICIARIES
OUTCOME

40 Reimagining Today Building the FuTure
Women hold up half the sky.
Women Power to empowerIn the Philippines, this centuries-old Chinese proverb could not be truer than today. Just consider the numbers: Filipino women comprise 40 percent of the workforce and more than 70 percent of secondary school graduates.
At InLife, women make up about 60 percent of the company, 61 percent of whom occupy senior management positions (Assistant Vice President and up), and 58 percent of its policyholders.
Being the largest 100-percent-owned Filipino insurance company (based on premium revenue and net income), InLife is uniquely positioned to champion the rights of women in the country, including their right to be financially independent.
“If there is any insurance company in the Philippines that will embrace this program, it is us,” said InLife Executive Chairman Nina D. Aguas. “We are privileged to be on the frontlines of helping women become self-reliant and financially independent, as they have been with us since day one of our rich 108-year history.”
InLife has taken on this responsibility as the first insurance company in Asia to partner with the International Finance Corporation (IFC), a member of
Insular Life, in collaboration with International Finance Corporation, launches InLife Sheroes. (From left) Deputy Insurance Commissioner Ferdinand George Florendo, InLife Executive Chairman Nina Aguas, IFC Gender Secretariat Head Henriette Kolb and Philippine Commission on Women Executive Director Emmeline Verzosa.
InLife President and CEO Mona Lisa dela Cruz (extreme right) introduces the InLife Sheroes influencers during the program launch in Makati City. They are (third to seventh from left): Amina Aranaz Alunan, Rose Fres Fausto, Sherill Quintana, and Negros Women for Tomorrow Foundation represented by Suzette Gaston and Cora Henares. Joining them are IFC Senior Operations Officer, Gender Secretariat Esther Dassanou and InLife Executive Vice President Noemi Azura (first and second from left).
40 REIMAGINING Today BUILDING THE FuTure
Insular Life supports the following United Nations Sustainable Development Goals:
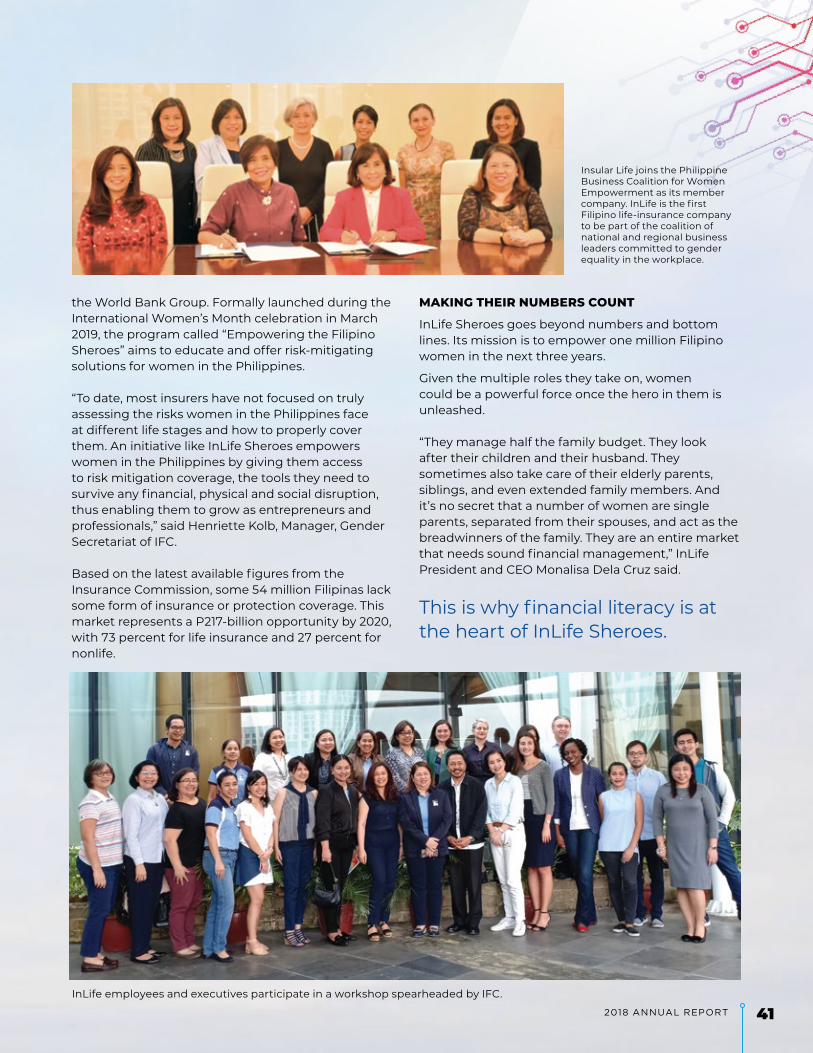
412018 annual report
the World Bank Group. Formally launched during the International Women’s Month celebration in March 2019, the program called “Empowering the Filipino Sheroes” aims to educate and offer risk-mitigating solutions for women in the Philippines.
“To date, most insurers have not focused on truly assessing the risks women in the Philippines face at different life stages and how to properly cover them. An initiative like InLife Sheroes empowers women in the Philippines by giving them access to risk mitigation coverage, the tools they need to survive any financial, physical and social disruption, thus enabling them to grow as entrepreneurs and professionals,” said Henriette Kolb, Manager, Gender Secretariat of IFC.
Based on the latest available figures from the Insurance Commission, some 54 million Filipinas lack some form of insurance or protection coverage. This market represents a P217-billion opportunity by 2020, with 73 percent for life insurance and 27 percent for nonlife.
Insular Life joins the Philippine Business Coalition for Women Empowerment as its member company. InLife is the first Filipino life-insurance company to be part of the coalition of national and regional business leaders committed to gender equality in the workplace.
InLife employees and executives participate in a workshop spearheaded by IFC.
mAking their numberS Count
InLife Sheroes goes beyond numbers and bottom lines. Its mission is to empower one million Filipino women in the next three years.
Given the multiple roles they take on, women could be a powerful force once the hero in them is unleashed.
“They manage half the family budget. They look after their children and their husband. They sometimes also take care of their elderly parents, siblings, and even extended family members. And it’s no secret that a number of women are single parents, separated from their spouses, and act as the breadwinners of the family. They are an entire market that needs sound financial management,” InLife President and CEO Monalisa Dela Cruz said.
This is why financial literacy is at the heart of InLife Sheroes.

42 Reimagining Today Building the FuTure
While a host of other women empowerment programs exists, what sets InLife Sheroes apart is its strategy on education, said project head Ma. Noemi G. Azura, InLife Chief Strategy Officer and President of Insular Health Care Inc. “We help women identify the risks they face at every life stage, the options available to them to manage these risks, and how to be empowered through informed decision-making. Our initial target is the broad middle class composed of professionals, entrepreneurs, OFWs, and millennials.”
InLife Sheroes will offer insurance products especially designed for women, including specific coverage, bundling of insurance products, awareness, campaigns, and add-on services. InLife is also enriching its women-targeted product roster to add value to the program. Its Entrepinay product carries a maternity-allowance component to help ease the financial burden during this critical life stage for Filipina entrepreneurs.
A healthy indicator that women are warming up to the idea is the overwhelming reception to InLife’s health care products. After just 37 days since the company launched an emergency care line, Ms. Azura said a significant 78 percent of the units were sold to female customers.
Beyond selling insurance products for women, InLife has also been mounting workshops and seminars, in addition to raising awareness and knowledge through digital platforms. An online portal, InLifeSheroes.com, serves as a safe space where women can gain the knowledge and wisdom, not just to live wealthier and healthier, but also to attain fulfillment in life. The site holds content on the four focus areas of InLife Sheroes: financial literacy, health and wellness, women-specific solutions, and connection to business and social networks. The growing community talks about love, family, health, career, finance, and everything in between, with every meaningful conversation raising women up and enabling every ‘Shero’ to be more, do more.
builDing momentum
More than a program that offers insurance products for women, InLife Sheroes is also creating a thriving community of women enabling other women in the world at large.
To spark inspiration from Filipina role models, InLife introduced a pioneer class of influencers who are a portrait of success and substance because of their grit, advocacy, and the drive to make a greater impact on the lives of others. They are:
• Amina Aranaz Alunan, an advocate of Filipino craftsmanship in the global fashion market, the creative force behind the eponymous fashion brand Aranaz, and founder of the first specialized design college in the country, SoFa Design Institute;
The InLife Sheroes program is expected to impact the lives of one million Filipino women. The program will provide risk mitigation solutions and educate them on financial management, health, and well-being.
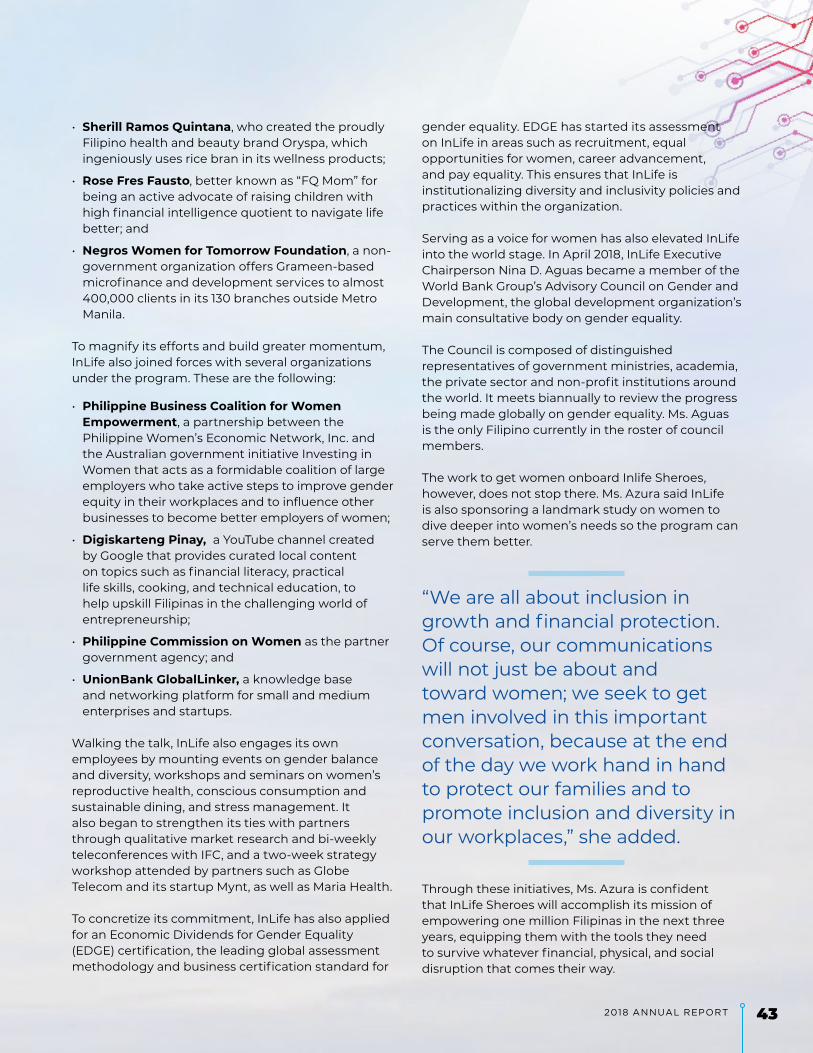
432018 annual report
• Sherill Ramos Quintana, who created the proudly Filipino health and beauty brand Oryspa, which ingeniously uses rice bran in its wellness products;
• Rose Fres Fausto, better known as “FQ Mom” for being an active advocate of raising children with high financial intelligence quotient to navigate life better; and
• Negros Women for Tomorrow Foundation, a non-government organization offers Grameen-based microfinance and development services to almost 400,000 clients in its 130 branches outside Metro Manila.
To magnify its efforts and build greater momentum, InLife also joined forces with several organizations under the program. These are the following:
• Philippine Business Coalition for Women Empowerment, a partnership between the Philippine Women’s Economic Network, Inc. and the Australian government initiative Investing in Women that acts as a formidable coalition of large employers who take active steps to improve gender equity in their workplaces and to influence other businesses to become better employers of women;
• Digiskarteng Pinay, a YouTube channel created by Google that provides curated local content on topics such as financial literacy, practical life skills, cooking, and technical education, to help upskill Filipinas in the challenging world of entrepreneurship;
• Philippine Commission on Women as the partner government agency; and
• unionBank GlobalLinker, a knowledge base and networking platform for small and medium enterprises and startups.
Walking the talk, InLife also engages its own employees by mounting events on gender balance and diversity, workshops and seminars on women’s reproductive health, conscious consumption and sustainable dining, and stress management. It also began to strengthen its ties with partners through qualitative market research and bi-weekly teleconferences with IFC, and a two-week strategy workshop attended by partners such as Globe Telecom and its startup Mynt, as well as Maria Health.
To concretize its commitment, InLife has also applied for an Economic Dividends for Gender Equality (EDGE) certification, the leading global assessment methodology and business certification standard for
gender equality. EDGE has started its assessment on InLife in areas such as recruitment, equal opportunities for women, career advancement, and pay equality. This ensures that InLife is institutionalizing diversity and inclusivity policies and practices within the organization.
Serving as a voice for women has also elevated InLife into the world stage. In April 2018, InLife Executive Chairperson Nina D. Aguas became a member of the World Bank Group’s Advisory Council on Gender and Development, the global development organization’s main consultative body on gender equality.
The Council is composed of distinguished representatives of government ministries, academia, the private sector and non-profit institutions around the world. It meets biannually to review the progress being made globally on gender equality. Ms. Aguas is the only Filipino currently in the roster of council members. The work to get women onboard Inlife Sheroes, however, does not stop there. Ms. Azura said InLife is also sponsoring a landmark study on women to dive deeper into women’s needs so the program can serve them better.
“We are all about inclusion in growth and financial protection. Of course, our communications will not just be about and toward women; we seek to get men involved in this important conversation, because at the end of the day we work hand in hand to protect our families and to promote inclusion and diversity in our workplaces,” she added.
Through these initiatives, Ms. Azura is confident that InLife Sheroes will accomplish its mission of empowering one million Filipinas in the next three years, equipping them with the tools they need to survive whatever financial, physical, and social disruption that comes their way.

44 Reimagining Today Building the FuTure
AOG: leADing the DigitAl JourneYFor Insular Life (InLife), aspiring to become the most digitally connected company in the life insurance sector takes more than just hitching its wagon to technology.
The Administrative Operations Group (AOG) heads led by Maria Edita C. Elicaño, Executive Vice President and Chief Actuary (seated, second from left). (Seated from left) Geraldine B. Alvarez, Branch Management Division; Ms. Elicaño; Maria Teresa L. Cruz, Information Services Division; and Dra. Eleanor G. Tañada, Head of Medical Division. (Standing from left) Roger N. Relucio, Data Analytics Division; Jesselyn V. Ocampo, Actuarial Division; Jocelyn B. Reyes, Policyholder Services Division; Diana Rose A. Tagra, New Business Division; and Lorenzo Luis B. Gallardo, Corporate Accounts Division.
While many have responded by offering customer-facing applications, InLife believes that going digital has to be much more than offering cool and convenient apps for customers.
To stay relevant to today’s customers who expect simple, transparent, and flexible products and services delivered anywhere, anytime, InLife started harnessing the full potential of digital technology.
Leading the charge in InLife’s digital transformation journey is the Administrative Operations Group (AOG). Since 2015, the Group has been transforming the Company’s entire value chain, from customer onboarding to underwriting, payment servicing, and claims management.
A poliCY in 30 minuteS or leSS
In October 2015, InLife became the first local insurer to have an Automated Underwriting System
Insular Life supports the following United Nations Sustainable
Development Goals:
452018 annual report
(AUS). This was envisioned to provide customers with added convenience when applying for a policy as well as help ease the workload of InLife’s underwriters.
After continuously fine-tuning the system for the past three years, AUS helped increase the efficiency of the underwriting team, enabling them to process over 1,000 underwriting activities in a day, or at a rate of 100 activities per underwriter. AOG was also able to fully automate the end-to-end online sales process — from application completion, underwriting decision, premium payment, and e-policy generation. With AUS, InLife agents can get an underwriting decision in as fast as 20 minutes. As of 2018, 80% of InLife’s agency force is already using the AUS and this is expected to hit to 100% full adoption by 2019.
To help reduce turnaround time and manpower costs, AOG also further streamlined service processing through the I-SERVE facility. This facility allows policyholders to perform online services on their traditional and Variable Unit Life (VUL) policies.
gooDbYe to pAper
Intensifying its efforts to provide a digital customer experience, AOG started rolling out electronic insurance policies (e-policies) for new InLife policyholders in 2018.
New clients with valid e-mail addresses can now access and review an advanced copy of their approved insurance contract in the InLife Customer Portal even before the agent delivers the printed policy to them. Clients can also access their details anywhere and anytime they have internet connection, making the e-policy an ideal option over paper-printed versions which can be easily be misplaced. In addition, the paperless system is more environment-friendly and less wasteful.
ACCeSS AnYwhere, AnYtime
Another pioneering AOG initiative in 2018 is the InLife Group portal to provide InLife’s corporate clients with ease of doing business.
Formally launched in January 2019, the portal enables the plan administrators to view their policy and members’ information, submit member movements, download forms, and submit servicing requirements. They can also receive and send
out communications to InLife using their central mailbox. Since the site is mobile-responsive, clients will be able to access their accounts using their mobile phones anywhere.
The portal marked InLife’s first venture in using a hybrid cloud and on-premise implementation. To complete the first version of the site, the development team applied an agile-scrum methodology, which leads to faster time-to-market for new insurance products and digital solutions.
AOG plans to introduce more exciting features of the portal such as a facility for group policyholders to update their corporate and member information, receive their billing statements, pay premiums, and chat with a customer care representative for any servicing requirement or concern.
e-CommerCe ChAnnel
Another significant milestone that AOG achieved in 2018 was the rapid development of InLife store in Lazada platform. This is in support of E-Commerce Marketing team’s thrust to establish InLife’s presence in the digital sales and marketing space.
With Lazada, Southeast Asia’s leading e-commerce platform, as an alternative distribution channel, InLife is able to reach out to more unbanked Filipinos to take charge of their life through easy-to-avail and easy-on-the-pocket insurance products.
For as low as P400, users can enjoy complete life protection for one year through any of the four available InLife Protect plans. The plans are offered exclusively to eligible Lazada members who reside in the Philippines, are between 18 and 64 years old, and are in good health at point of application.
Similar to all other Lazada transactions, one-time premium payments may be made via credit card, debit card or Lazada e-Wallet.
In the coming years, AOG will continue to roll out more digital initiatives to support InLife’s dual approach to transformation: to revitalize the business through innovation and build a business model with technology as an enabler. These initiatives are expected to transform the Company’s business model, aiding InLife’s digital journey well into the next century.

46 Reimagining Today Building the FuTure
BOARD OF truSteeS
luis y. beniTez, jr.INDEPENDENT TRUSTEE
jusTo anTonio a. orTizNON-ExECUTIVE TRUSTEE
nina d. aguasExECUTIVE CHAIRMAN
Francisco ed. lim INDEPENDENT TRUSTEE
46 REIMAGINING Today. BUILDING THE FuTure.

472018 annual report
BOARD OF truSteeS
luis c. la ÓVICE CHAIRMAN
nico jose s. nolledoINDEPENDENT TRUSTEE
gil b. genioINDEPENDENT TRUSTEE
mona lisa b. dela cruzTRUSTEE
marieTTa c. gorrezTRUSTEE
472018 annual report

48 Reimagining Today Building the FuTure
BOARD OF TRUSTEESCreDentiAlS
(As of 01 April 2019)
ninA D. AguASNina currently sits as the Company’s Executive Chairman of the Board and was first appointed to the Board on 24 May 2015. She is 66 years old.
Directorships and Experience: She is the Chairman of the Board of the following Insular Life subsidiaries: Insular Health Care, Inc., Insular Life Management & Development Corporation (ILMADECO), Insular Life Property Holdings, Inc., Insular Investment Corporation, and the Insular Foundation, Inc. Outside of Insular Life Group, she is also a Director of Union Bank of the Philippines (a Publicly Listed Company) and City Savings Bank. She is a member of the Board of Philippine Life Insurance Association (PLIA) and Insurance Institute for Asia and the Pacific (IIAP). She is also a member of the Advisory Council for Gender and Development of the World Bank Group. She was a Chief Executive Officer (CEO) of Insular Life from 2016 to 2017. Prior to joining Insular Life, Nina held various Senior Management positions in multinational financial institutions across Asia and the United States. She was a former Director, President and CEO of the Philippine Bank of Communications (PBCOM). Before PBCOM, she was a Managing Director and Head of Private Bank - Asia Pacific, and Managing Director and Retail Banking Head- Asia Pacific of the Australia and New Zealand (ANZ) Banking Group, Ltd. (ANZ Group); Managing Director and Head of Corporate Center Compliance in New York, Country Business Manager of Global Consumer Group in the Philippines, Regional Head of Audit and Risk in Asia Pacific, and as Regional Head, Quality and Re-Engineering of Asia Pacific of Citibank Group. She is a recipient of the 2013 Filipina Women Network (FWN) 100 Most Influential Filipina Women Leaders in the World™.
Academic Qualifications: Nina graduated Bachelor of Science degree in Commerce, major in Accounting, from the University of Santo Tomas. She is a Certified Public Accountant.
2018 Seminars attended: As Participant, Nina attended the following: Asia CEO Insurance Summit; Advisory Council on Gender and Development of the World Bank Group; World Bank’s “Disrupting the Gender Divide”; and Annual Meetings of the
International Monetary Fund & World Bank Group. She also attended the 2018 East Asian Insurance Congress entitled “Managing Disruptions, Driving Change” as a Panelist.
luiS Y. benitezLouie is an Independent Trustee of the Company and was first appointed to the Board on 24 January 2016. He is 71 years old.
Directorships and Experience: He was Vice Chairman and Senior Partner of SGV & Co., a Member firm of Ernst & Young Global Limited. He is a member of the Board of Directors of several private companies and serves as senior adviser to major companies. He specializes in banking and financial industry. He has extensive experience in public accounting and business advisory services.
Academic Qualifications: He received his Bachelor of Science degree in Business Administration, major in Accounting from the University of the Philippines. He has a Master’s degree in Business Administration from the Stern School of Business of New York University. He is also a graduate of the Pacific Rim Bankers Program from University of Washington. He is a Certified Public Accountant.
2018 Seminars Attended: Louie attended Advanced Corporate Governance Training Program.
monA liSA b. DelA CruzLisa is an Executive Trustee and was appointed as President and Chief Executive Officer (CEO) of the Company since 01 January 2018. She was first appointed to the Board on 27 January 2011. She is 61 years old.
Directorships and Experience: Lisa sits in the Board of the following Insular Life subsidiaries: Insular Health Care, Inc. (Vice-Chairman), Insular Investment Corporation, ILAC General Insurance Agency, Inc. (Chairman), Insular Life Property Holdings, Inc. (Vice-Chairman), Insular Life Management and Development Corporation or ILMADECO (Vice-Chairman), Insular Foundation, Inc. (Vice-

492018 annual report
Chairman), and Insular Life Employees’ Retirement Fund (Chairman). She is also a Director of MAPFRE INSULAR Insurance Corporation and Pilipinas Shell Petroleum Corporation (a Publicly Listed Company). Prior to her designation as CEO, she has held several key management positions in Insular Life since 1980, with her most recent position being the President and Chief Operating Officer (COO) from 2015 to 2017. She is a recipient of the 2016 Filipina Women Network’s (FWN’s) 100 Most Influential Filipina Women Leaders in the World ™. She is also a 2017 University of the Philippines Alumni Association (UPAA) Distinguished Alumni Awardee in Financial Management Excellence.
Academic Qualifications: She earned her Bachelor of Science degree in Statistics (cum laude) from the University of the Philippines. She finished her Master of Science degree in Mathematics, major in Actuarial Science, from University of Michigan. She is a Fellow of the Actuarial Society of the Philippines and an Associate of Society of Actuaries (USA).
2018 Seminars Attended: Advanced Corporate Governance Training Orientation; Anti-Money Laundering Act, as Amended (AMLA) Seminar; BSP Philippine Economic Briefing; MDRT Annual Meeting; Economic Briefing by Dr. Bernardo Villegas; Executive Breakfast Forum- “The Business Value of Recruitment Process Outsourcing as Key Advantage to Global Competitiveness”; SharePhil Forum on “Cryptocrurrency: the Truth and the Myth”; 18th Asia CEO Insurance Summit; The Manila Times’ Forum-“Philippine Economic Outlook for 2018”; and Finance Asia: “Belt and Road Connected Series: Invest Philippines”.
gil b. genioGil is an Independent Trustee of the Company and was first appointed to the Company on 01 January 2018. He is 59 years old.
Directorships and Experience: Gil is Globe Telecom’s Chief Technology and Information Officer (CTIO) and Chief Strategy Officer (CSO). He is the Chief Executive Officer (CEO) of Globe Capital Venture Holdings and holds directorships and management positions in a number of non-listed subsidiaries and affiliates under Globe (a Publicly Listed Company). He is also a Managing Director at Ayala Corporation (a Publicly Listed Company). Prior to joining Ayala, He exercised functions on financial control, risk management, product development, and audit and market risk management under Citibank in Philippines, Singapore, Japan and Hong Kong. He also served in a variety of industry associations. His past affiliations include being Vice Chairman and Chairman of the
GSM Association Asia Pacific (GSMA AP); member of the Advisory Board for Mobile World Capital Barcelona and member of the Board of Trustees of the IT and Business Process Association of the Philippines (iBPAP).
Academic Qualifications: Gil obtained his Master’s Degree in Business Management, with distinction, from the Asian Institute of Management. He is a graduate of Bachelor of Science degree in Physics, magna cum laude, from the University of the Philippines.
2018 Seminars Attended: As participant, he attended SAS Global Forum; SAS Executive Briefing Conference; Mobile World Congress-Globe- Huawei 5G FWA workshop; Singtel Group CIO CTO Regional Forum; Cloudera Executive Advisory Board Meeting; Corporate Governance Training; and Ayala Innovation Summit. He was also part of the 1st Global Forum on Infrastructure Strategies as a Panelist and IT Leaders’ Forum- SM Group of Companies as a Speaker.
mAriettA C. gorrezMayette is a Non-Executive Trustee of the Company and was first appointed to the Board on 27 January 2011. She is 65 years old.
Directorships and Experience: Mayette currently holds Directorships/Trusteeships in the following companies: Insular Health Care, Inc.; Foundation for Professional Training, Inc.; and Alliance for the Family Foundation of the Philippines, Inc. She was a former Senior Vice President of Insular Life and headed the following Groups: Business Support Group, Sales Operations Group, Corporate Operations Group and Administrative Operations Group. She was also a former President of ILAC General Insurance Agency, Inc. She previously held Board seats in the following Insular Life Subsidiaries: Insular Investment Corporation, Insular Life Management & Development Corporation or ILMADECO, Insular Life Property Holdings, Inc., Insular Life Employees’ Retirement Fund, Home Credit Mutual Building & Loan Association, Inc.; and Insular Foundation, Inc. She is a Professional Executive/Career/Life Coach & member of International Coach Federation and Vice President of International Coach Federation-Philippines Chapter.
Academic Qualifications: She obtained her Bachelor of Science degree in Mathematics from the University of Santo Tomas. She holds a Master’s degree in Business Administration from De La Salle University and is a candidate for a Master’s degree in Business Economics from University of Asia & the Pacific. She is also a graduate of Top Management Program of the
50 Reimagining Today Building the FuTure
Asian Institute of Management. She is a Registered Financial Consultant (RFC) and Registered Estate Planner of the International Association of Registered Financial Consultants (IARFC). She is a Fellow of Life Management Institute of Life Office Management Association (LOMA).
2018 Seminars Attended: Global Leaders’ Forum of the International Coach Federation and InLife’s 2018 Continuing Governance Education entitled “Philippine Constitution, Charter Change, and Federalism”.
luiS C. lA ÒLouie is a Non-Executive Trustee of the Company and was first appointed to the Board on 22 January 2015. He is 71 years old. He previously served as the Chairman of the Board in 2017.
Directorships and Experience: Louie previously served as an Independent Board Chairman of Insular Life from August 2016 to December 2017. He was also a former Chairman of the Board of MAPFRE INSULAR Insurance Corporation from 1986 to 2016, from which he now sits as its Vice-Chairman. He is Director of Pilipinas Shell Petroleum Corporation (a Publicly Listed Company). He formerly held the following management roles: Regional Vice President for Asia of the MAPFRE Group-Spain, President of Provident Insurance Corporation of the Soriano Group and Senior Vice President of Universal Reinsurance Corporation of the Ayala Group.
Academic Qualifications: Louie is a graduate of Bachelor of Science degree in Management at Ateneo de Manila University. He completed his Master’s degree in Business Management from De La Salle University. He also finished Course on General Insurance from the College of Insurance, Chartered Institute of London, United Kingdom.
2018 Seminars Attended: Corporate Governance Conference on Sustainability Training Program; InLife’s 2018 Continuing Governance Education entitled “Philippine Constitution, Charter Change, and Federalism”; and Anti-Money Laundering Act, as Amended (AMLA) seminar.
FrAnCiSCo eD. limFrancis is a Non-Executive Trustee of the Company and was first appointed to the Board on 27 January 2011. He is 63 years old.
Directorships and Experience: Francis is a Senior Partner and member of the Special Committee and
Executive Committee of the Angara Concepcion Regala & Cruz Law Offices (ACCRALAW). He is the incumbent President of the Shareholders’ Association of the Philippines (SharePHIL). He is an Independent Director of Energy Development Corporation (a Publicly Listed Company), and a Director of Alphaland Corporation (a Publicly Listed Company). He is also a director of private corporations like the Producers Savings Bank Corporation and Camerton, Inc. He is a member of the Board of Governors and Vice-President of the Management Association of the Philippines (MAP). He is also a trustee of the Financial Executives Institute of the Philippines (FINEx), CIBI Foundation, Inc. and the Judicial Reform Initiative, Inc. He is a Co-Chairperson of the Sub-Committee of the Philippine Supreme Court on E-Commerce Law and member of the Philippine Supreme Court Sub-Committee on Commercial Courts. He is the Vice-Chair of the Commercial Law Department and professorial lecturer of the Philippine Judicial Academy. He is also a Law Professor at the School of Law, Ateneo de Manila University and School of Law of San Beda University. He is a member of the Integrated Bar of the Philippines, Philippine Bar Association, New York State Bar Association, the American Bar Association, International Insolvency Institute (“III”), and Advisory Committee for the Asian Principles of Business Restructuring Project of the III and Asian Business Law Institute. He was a former President and Chief Executive Officer of the Philippine Stock Exchange, Inc., and Securities Clearing Corporation of the Philippines. He previously served as Chairman of the Philippine Stock Exchange Foundation, Inc. and Capital Market Development Center, Inc. He was also a former Director of The Philippine Stock Exchange, Inc., Securities Clearing Corporation of the Philippines, and Philippine Dealing & Exchange Corporation. He also previously served as a Trustee of Securities Investors Protection Fund. He was a former member of the Capital Market Development Council. Francis has received numerous awards and accolades during in his professional career. Among his most recent awards are: Deal Maker of the Year by Thomson Reuters Asian Legal Business Philippine Law Awards 2017; Commended External Counsel of the Year 2016 and 2017 by In-House Community Counsels; Punong Gabay Award from the Philippine Council of Deans and Educators (PCDEB); Professorial Chair in Commercial Law from the Philippine Supreme Court, Philippine Judicial Academy and the Metrobank Foundation, Inc.; Advocacy Management and Shareholder Rights Advocacy Awards from BizNewsAsia; Certificate of Commendation from the Supreme Court of the Philippines; Outstanding Alumnus, San Jacinto Seminary and San Jacinto Seminary Alumni Association and Certificate of Appreciation from Capital Market Institute of the Philippines.

512018 annual report
Academic Qualifications: Francis earned his Bachelor of Arts, cum laude, and Bachelor of Philosophy, magna cum laude, degrees from University of Santo Tomas. He finished his Bachelor of Laws (Second Honors) degree from the Ateneo de Manila University. He then graduated with Master of Laws from the University of Pennsylvania, USA. He is a member of the Integrated Bar of the Philippines, Philippine Bar Association, New York State Bar Association and the American Bar Association. He is a Fellow of the Institute of Corporate Directors (ICD).
2018 Seminars attended: InLife’s 2018 Continuing Governance Education entitled “Philippine Constitution, Charter Change, and Federalism” and ICD’s Annual Corporate Governance Training.
niCo JoSe S. nolleDoNix is an Independent Trustee of the Company and was first appointed to the Board on 22 January 2015. He is 42 years old.
Directorships and Experience: Nix is the Chairman of xurpas, Inc. and Chief Executive Officer of ODx Pte. Ltd. He is a member of the Entrepreneurs’ Organization (EO) - Philippine Chapter and the Founder and CEO of PinoyExchange. Aside from being Chairman of the Board of xurpas, Inc. (a Publicly Listed Company), he also sits as a Director of several non-listed companies: Eden Technology Inc.; Eden Holdings Philippines Inc.; Knots and Pans Registries Inc.; KlaseKo Web Enrollment Inc.; KlaseKo Enrollment Systems Inc.; The Forge Inc.; Cypher Digital Inc.; A-Solutions Online Stores Inc.; Omnimoda International, Inc.; CarbonDigital, Inc., Hatchd Group Inc.; Hatchd Inc.; AVA Online Group Inc, PurpleClick Philippines Inc.; Lendwell Solutions Inc.; Blue Aurora Solutions Inc.; Eden Tech Ventures Inc.; TripClub Inc.; Poyo Inc; Mountain high Ventures Pte Ltd.; Quanta Digital Inc.; Quanta Holdings Ltd.; Open Global Holdings Ltd.; Wi-Zone International Ltd.; xLD Pte LTd.; Goodwork Solutions Inc.; Cosmic force Solutions Inc.; xLD tech Labs Inc.; Fluid Stack Solutions Inc.; xurpas Enterprise, Inc. Yondu Inc.; Storm Technologies Inc.; Seer Technologies, Inc.; Altitude Games Inc.; Altitude Games Pte Ltd.; MatchMe Pte. Ltd.; Micro Benefits Limited; Art of Click Pte. Ltd.; Gurango Software Corporation; xeleb Technologies Inc.; Yondu Software Labs Inc.; and xeleb Inc. He is an awardee of the following prestigious titles: 2015 Ernst and Young (EY) Entrepreneur of the Year, 2015 The Outstanding Young Men (TOYM) and Endeavor Entrepreneur.
Academic Qualifications: Nix graduated with Bachelor of Science degree in Management from the Ateneo de Manila University.
2018 Seminars Attended: Entrepreneur’s Organization:Blockchain conference; Asia Business Council’s Spring Forum; Endeavor Scale-Up Asia 2018, Crypto Invest Summit 2018; Coin Agenda 2018; TokenPost’s 2018 Blockchain Open Forum; Synco Blockchain Symposium; Unilever Corporate Talk-Procurement Day; and JCash’ s Blockchain Festival 2018.
JuSto Antonio A. ortizTito is a Non-Executive Trustee of the Company and was first appointed to the Board on 23 November 2017. He is 61 years old.
Directorships and Experience: Tito is Chairman of the Board of Union Bank of the Philippines or UBP (a Publicly Listed Company), Blockchain Association of the Philippines, Union Properties, Inc. and Philippine Payments Management Inc. (PPMI). He is also a Director of City Savings Bank. He is a member of the Philippine Trade Foundation, Inc., World Presidents Organization/Young President Organization, and Children’s Hour of the Philippines. Prior to joining UBP, he worked with Citibank as Managing Partner for Global Finance and Country Executive for Investment Banking.
Academic Qualifications: He is a graduate of Bachelor of Arts in Economics - Honors Program, magna cum laude, from the Ateneo de Manila University. He was also conferred the degree of Doctor in Humanities - Honoris Causa, by the University of Santo Tomas (UST).
2018 Seminars Attended: As Participant, he attended the following- Blockchain Economic Forum Singapore; APAC Blockchain Conference; Philippine–Japan Cooperation Forum on Investment & Fintech; ASEAN Central Bank Governors – Financial Institution- CEOs Luncheon Dialogue; CoinDesk Consensus Annual Summit 2018.; CEZA Fintech Summit 2018; RBAP 65th Annual National Convention & General Membership Meeting “Rural Bank Leasing Onwards Development & Inclusion”; MAP General Membership Meeting; IFC Digilab Workshop; Tech conference DLD; ASEAN Agriculture Summit 2018; SM Group’s 1st GRI Sustainability Summit; Sibos 2018; Romulo Foundation conference; Singapore Fintech Festival 2018; Union Bank 31st Leaders Learning Circle – “Cracking Cryptos”; and BSP – 31st Environmental Scanning Exercise (ESE) Roundtable discussion on “Big Data Revolution in the Philippines”. He also attended the following as a Speaker- MAS Event in Manila; FINEx 7th General Membership Meeting; Insular Life Innovation Day 2018; The Asian Banker’s The Future of Finance-Philippines Forum; SM Group’s 1st GRI Sustainability Summit; Institute of Corporate Directors Philippines’ Fellowship Night; and PASIA World Conference (Logistics) Philippines.

52 Reimagining Today Building the FuTure
Senior mAnAgement TEAM
mona lisa b. dela cruzPRESIDENT AND CHIEF ExECUTIVE OFFICER
raoul anTonio e. liTTauaSENIOR ExECUTIVE VICE PRESIDENT CHIEF AGENCY DISTRIBUTION OFFICER AND HEAD OF AGENCY DISTRIBUTION GROUP
maria noemi g. azuraExECUTIVE VICE PRESIDENT AND SECONDED TO INSULAR HEALTH CARE, INC. AS PRESIDENT AND CEO
52 REIMAGINING Today. BUILDING THE FuTure.

532018 annual report
nina d. aguasExECUTIVE CHAIRMAN OF THE BOARD
ma. ediTa c. elicaÑoExECUTIVE VICE PRESIDENT CHIEF ACTUARY, AND HEAD OF ADMINISTRATIVE OPERATIONS GROUP
omar T. cruzSENIOR ExECUTIVE VICE PRESIDENT CHIEF BANCASSURANCE ExECUTIVE AND HEAD OF BANCASSURANCE OPERATIONS GROUP
532018 annual report

54 Reimagining Today Building the FuTure
Senior VICE PRESIDENTS
ramon m. cabreraHEAD OF AGENCY DEVELOPMENT DIVISION
maria Teresa l. cruzHEAD OF INFORMATION SERVICES DIVISION
54 REIMAGINING Today. BUILDING THE FuTure.

552018 annual report
renaTo s. de jesusCHIEF LEGAL OFFICER, COMPLIANCE OFFICER, CORPORATE SECRETARY AND HEAD OF LEGAL & CORPORATE SERVICES DIVISION
vera vicToria c. moralesCHIEF INVESTMENT OFFICER AND HEAD OF INVESTMENT MANAGEMENT DIVISION
noel andres m. perdigon CHIEF INFORMATION SECURITY OFFICER, DATA PROTECTION OFFICER, AND CHIEF ENTERPRISE RISK MANAGEMENT OFFICER
552018 annual report

56 Reimagining Today Building the FuTure
hecTor a. caunanHEAD OF REAL PROPERTY DIVISION
miriam z. choaCHIEF MARKETING OFFICER AND HEAD OF MARKETING DIVISION
maria rosa aurora d. cacanandoHEAD OF AUDIT STAFF (INTERNAL AUDIT)
diana rose a. TagraHEAD OF NEW BUSINESS DIVISION
FirSt VICE PRESIDENTS
VICE PRESIDENTS
SENIOR ASSISTANT VICE PRESIDENTS
Alan Joseph S. Amador
Arnaldo I. Aquino
Corazon S. Cruz
Ma. Carmela D. Francisco
Lorenzo Luis Liborio B. Gallardo II
Gwendolyn D. Kelley
Jesselyn V. Ocampo
Geraldine G. Pascual
Henry G. Balangatan II
Analyn S. Benito
Johanna C. Coronado
Roger N. Relucio
Tricci Rose A. Sadian
Armand P. Santos
Dominique C. Soliven
Ana Maria R. Soriano
Eleanor G. Tañada
Ruth R. Velasco
Peter Paul E. Esporlas
Laarni F. Garraton
Maria Rowena M. Rodriguez

572018 annual report
FirSt VICE PRESIDENTS
VICE PRESIDENTS
SENIOR ASSISTANT VICE PRESIDENTS
ASSISTANT VICE PRESIDENTSFamida A. Alonto
Iris S. Aman
Rene P. Asuncion
Angela A. Bien
Charito A. Brillo
Edward Dionie F. Capili
Pompeyo Nicholas E. Catindig
Johana B. De Jesus
Hilario C. Delos Santos
Michael Robert T. Dijamco
Jannette P. Domingo
Maria Celina H. Espinosa
Amado P. Garcia, Jr.
Isidra Josephine M. Gonzales
Sheila Marie D. Iglesia
Ma. Editha B. Mendiola
Rogie P. Niño
Herson S. Resurreccion
Maria Ritchie M. Reyes
Paulita A. Sioson
jocelyn b. reyesHEAD OF POLICYHOLDERS SERVICES DIVISION
Florian c. de leonHEAD OF HUMAN RESOURCES DIVISION
geraldine b. alvarezHEAD OF BRANCH MANAGEMENT DIVISION
percival cirilo s. FloresHEAD OF BANCASSURANCE BUSINESS ANALYTICS & STRATEGY MANAGEMENT
carliTo v. lucas HEAD OF CORPORATE SALES DIVISION
* As of March 31, 2019
58 Reimagining Today Building the FuTure
STATEMENT OF MANAGEMENT’S RESPONSIBILIT yFOR FINANCIAL STATEMENTSTHE INSuLAR LIFE ASSuRANCE COMPANY, LTD. AND SuBSIDIARIES(A Domestic Mutual Life Insurance Company)
I N S U L A R L I F E
The Management of The Insular Life Assurance Co., Ltd. and Subsidiaries is responsible for the preparation and fair presentation of the financial statements including the schedules attached therein, for years ended December 31, 2018 and 2017, in accordance with the prescribed financial reporting framework indicated therein, and for such internal control as Management determines is necessary to enable the preparation of the financial statements that are free from material misstatement, whether due to fraud or error.
In preparing the financial statements, Management is responsible for assessing the Company’s ability to continue as a going concern, disclosing, as applicable matters related to going concern and using the going concern basis of accounting unless Management either intends to liquidate the Company or to cease operations, or has no realistic alternative but to do so.
The Board of Trustees is responsible for overseeing the Company’s financial reporting process.
The Board of Trustees reviews and approves the financial statements including the schedules attached therein, and submits the same to the members.
SyCip Gorres Velayo & Co., the independent auditor appointed by the members, has audited the financial statements of the Company in accordance with Philippine Standards on Auditing, and in its report to the members, has expressed its opinion on the fairness of presentation upon completion of such audit.
Nina D. AguasExecutive Chairman of the Board
Mona Lisa B. de la CruzPresident and Chief Executive Officer
Angela A. BienOfficer-in-Charge, Finance
592018 annual report
INDEPENDENT AUDITOR’S REPORTTHE INSuLAR LIFE ASSuRANCE COMPANY, LTD. AND SuBSIDIARIES(A Domestic Mutual Life Insurance Company)
The Board of Trustees and MembersThe Insular Life Assurance Company, Ltd.
Opinion
We have audited the consolidated financial statements of The Insular Life Assurance Company, Ltd. and its subsidiaries (the Group), which comprise the consolidated statements of financial position as at December 31, 2018 and 2017, and the consolidated statements of income, consolidated statements of comprehensive income, consolidated statements of changes in equity, and consolidated statements of cash flows for the years then ended, and notes to the consolidated financial statements, including a summary of significant accounting policies.
In our opinion, the accompanying consolidated financial statements present fairly, in all material respects, the financial position of the Group as at December 31, 2018 and 2017, and its financial performance and its cash flows for the years then ended December 31, 2018 and 2017 in accordance with Philippine Financial Reporting Standards (PFRSs).
Basis for Opinion
We conducted our audits in accordance with Philippine Standards on Auditing (PSA). Our responsibilities under those standards are further described in the Auditor’s Responsibilities for the Audit of the Financial Statements section of our report. We are independent of the Group in accordance with the Code of Ethics for Professional Accountants in the Philippines (Code of Ethics) together with the ethical requirements that are relevant to our audit of the consolidated financial statements in the Philippines, and we have fulfilled our other ethical responsibilities in accordance with these requirements and the Code of Ethics. We believe that the audit evidence we have obtained is sufficient and appropriate to provide a basis for our opinion.
Responsibilities of Management and Those Charged with Governance for the Consolidated Financial Statements
Management is responsible for the preparation and fair presentation of the consolidated financial statements in accordance with PFRS, and for such internal control as management determines is necessary to enable the preparation of consolidated financial statements that are free from material misstatement, whether due to fraud or error.
In preparing the consolidated financial statements, management is responsible for assessing the Group’s ability to continue as a going concern, disclosing, as applicable, matters related to going concern and using the going concern basis of accounting unless management either intends to liquidate the Group or to cease operations, or has no realistic alternative but to do so.
Those charged with governance are responsible for overseeing the Group’s financial reporting process.
Auditor’s Responsibilities for the Audit of the Consolidated Financial Statements
Our objectives are to obtain reasonable assurance about whether the consolidated financial statements as a whole are free from material misstatement, whether due to fraud or error, and to issue an auditor’s report that includes our opinion. Reasonable assurance is a high level of assurance, but is not a guarantee that an audit conducted in accordance with PSA will always detect a material misstatement when it exists. Misstatements can arise
from fraud or error and are considered material if, individually or in the aggregate, they could reasonably be expected to influence the economic decisions of users taken on the basis of these consolidated financial statements.
As part of an audit in accordance with PSA, we exercise professional judgment and maintain professional skepticism throughout the audit. We also:
• Identifyandassesstherisksofmaterialmisstatementoftheconsolidated financial statements, whether due to fraud or error, design and perform audit procedures responsive to those risks, and obtain audit evidence that is sufficient and appropriate to provide a basis for our opinion. The risk of not detecting a material misstatement resulting from fraud is higher than for one resulting from error, as fraud may involve collusion, forgery, intentional omissions, misrepresentations, or the override of internal control.
• Obtainanunderstandingofinternalcontrolrelevanttotheauditin order to design audit procedures that are appropriate in the circumstances, but not for the purpose of expressing an opinion on the effectiveness of the Group’s internal control.
• Evaluatetheappropriatenessofaccountingpoliciesusedand the reasonableness of accounting estimates and related disclosures made by management.
• Concludeontheappropriatenessofmanagement’suseofthegoing concern basis of accounting and, based on the audit evidence obtained, whether a material uncertainty exists related to events or conditions that may cast significant doubt on the Group’s ability to continue as a going concern. If we conclude that a material uncertainty exists, we are required to draw attention in our auditor’s report to the related disclosures in the consolidated financial statements or, if such disclosures are inadequate, to modify our opinion. Our conclusions are based on the audit evidence obtained up to the date of our auditor’s report. However, future events or conditions may cause the Group to cease to continue as a going concern.
• Evaluatetheoverallpresentation,structureandcontentoftheconsolidated financial statements, including the disclosures, and whether the consolidated financial statements represent the underlying transactions and events in a manner that achieves fair presentation.
We communicate with those charged with governance regarding, among other matters, the planned scope and timing of the audit and significant audit findings, including any significant deficiencies in internal control that we identify during our audit.
SYCIP GORRES VELAYO & CO.
Janet A. ParaisoPartnerCPA Certificate No. 92305SEC Accreditation No. 0778-AR-3 (Group A), June 19, 2018, valid until June 18, 2021Tax Identification No. 193-975-241BIR Accreditation No. 08-001998-62-2018 February 26, 2018, valid until February 25, 2021PTR No. 7332517, January 3, 2019, Makati City
March 28, 2019
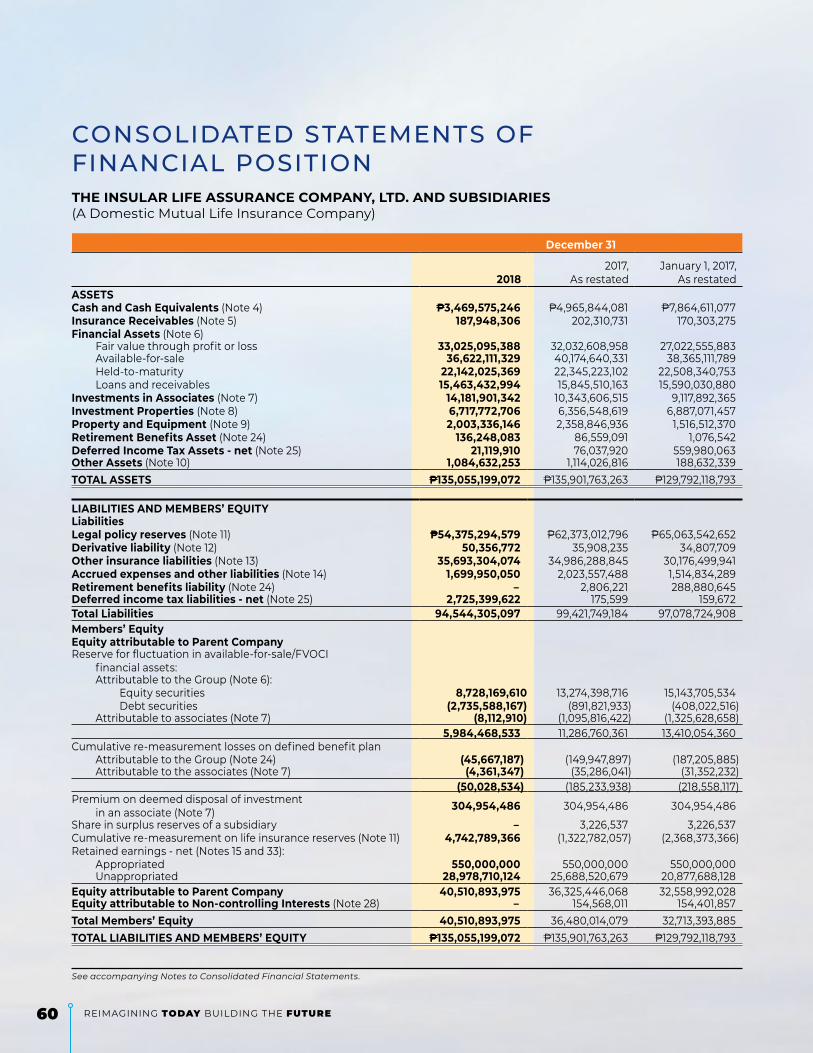
60 Reimagining Today Building the FuTure
CONSOLIDATED STATEMENTS OFFINANCIAL POSITIONTHE INSuLAR LIFE ASSuRANCE COMPANY, LTD. AND SuBSIDIARIES(A Domestic Mutual Life Insurance Company)
December 31
20182017,
As restatedJanuary 1, 2017,
As restatedASSETSCash and Cash Equivalents (Note 4) P3,469,575,246 P4,965,844,081 P7,864,611,077Insurance Receivables (Note 5) 187,948,306 202,310,731 170,303,275Financial Assets (Note 6) Fair value through profit or loss 33,025,095,388 32,032,608,958 27,022,555,883 Available-for-sale 36,622,111,329 40,174,640,331 38,365,111,789 Held-to-maturity 22,142,025,369 22,345,223,102 22,508,340,753 Loans and receivables 15,463,432,994 15,845,510,163 15,590,030,880Investments in Associates (Note 7) 14,181,901,342 10,343,606,515 9,117,892,365Investment Properties (Note 8) 6,717,772,706 6,356,548,619 6,887,071,457Property and Equipment (Note 9) 2,003,336,146 2,358,846,936 1,516,512,370Retirement Benefits Asset (Note 24) 136,248,083 86,559,091 1,076,542Deferred Income Tax Assets - net (Note 25) 21,119,910 76,037,920 559,980,063Other Assets (Note 10) 1,084,632,253 1,114,026,816 188,632,339TOTAL ASSETS P135,055,199,072 P135,901,763,263 P129,792,118,793
LIABILITIES AND MEMBERS’ EQuITYLiabilitiesLegal policy reserves (Note 11) P54,375,294,579 P62,373,012,796 P65,063,542,652Derivative liability (Note 12) 50,356,772 35,908,235 34,807,709Other insurance liabilities (Note 13) 35,693,304,074 34,986,288,845 30,176,499,941Accrued expenses and other liabilities (Note 14) 1,699,950,050 2,023,557,488 1,514,834,289Retirement benefits liability (Note 24) – 2,806,221 288,880,645Deferred income tax liabilities - net (Note 25) 2,725,399,622 175,599 159,672Total Liabilities 94,544,305,097 99,421,749,184 97,078,724,908Members’ EquityEquity attributable to Parent CompanyReserve for fluctuation in available-for-sale/FVOCI
financial assets: Attributable to the Group (Note 6): Equity securities 8,728,169,610 13,274,398,716 15,143,705,534 Debt securities (2,735,588,167) (891,821,933) (408,022,516) Attributable to associates (Note 7) (8,112,910) (1,095,816,422) (1,325,628,658)
5,984,468,533 11,286,760,361 13,410,054,360Cumulative re-measurement losses on defined benefit plan Attributable to the Group (Note 24) (45,667,187) (149,947,897) (187,205,885) Attributable to the associates (Note 7) (4,361,347) (35,286,041) (31,352,232)
(50,028,534) (185,233,938) (218,558,117)Premium on deemed disposal of investment
in an associate (Note 7) 304,954,486 304,954,486 304,954,486
Share in surplus reserves of a subsidiary – 3,226,537 3,226,537Cumulative re-measurement on life insurance reserves (Note 11) 4,742,789,366 (1,322,782,057) (2,368,373,366)Retained earnings - net (Notes 15 and 33): Appropriated 550,000,000 550,000,000 550,000,000 Unappropriated 28,978,710,124 25,688,520,679 20,877,688,128Equity attributable to Parent Company 40,510,893,975 36,325,446,068 32,558,992,028Equity attributable to Non-controlling Interests (Note 28) – 154,568,011 154,401,857Total Members’ Equity 40,510,893,975 36,480,014,079 32,713,393,885TOTAL LIABILITIES AND MEMBERS’ EQuITY P135,055,199,072 P135,901,763,263 P129,792,118,793
See accompanying Notes to Consolidated Financial Statements.

612018 annual report
CONSOLIDATED STATEMENTS OF INCOMETHE INSuLAR LIFE ASSuRANCE COMPANY, LTD. AND SuBSIDIARIES(A Domestic Mutual Life Insurance Company)
Years Ended December 31
20182017,
As restatedREVENuEInsurance Revenue (Note 16)Gross earned premiums on insurance contracts P14,573,372,128 P12,434,411,019Reinsurers’ share of premiums on insurance contracts (192,333,649) (233,571,026)Net Insurance Revenue 14,381,038,479 12,200,839,993Operating RevenueInvestment income (Note 17) 5,017,181,970 4,455,267,192Equity in net earnings of associates (Note 7) 1,061,082,132 1,325,871,193Rental income (Notes 8 and 27) 639,740,070 428,126,462Net realized gains (Note 18) 394,270,740 841,112,461Foreign exchange gain - net (Note 32) 187,488,167 -Other income (Note 29) 528,692,892 457,239,952Total Operating Revenue 7,828,455,971 7,507,617,260Total Revenue 22,209,494,450 19,708,457,253
INSuRANCE BENEFITS OPERATING EXPENSESInsurance Benefits Expenses (Note 19)Gross benefits and claims on insurance contracts 13,790,088,233 11,597,723,035Reinsurers’ share of benefits and claims on insurance contracts (56,475,863) (29,271,877)Net change in (Note 11): Legal policy reserves 691,161,898 (1,183,552,082) Reinsurers’ share in legal policy reserves (23,778,082) (13,275,905)Net Insurance Benefits Expenses 14,400,996,186 10,371,623,171Operating ExpensesGeneral insurance expenses (Note 20) 2,101,785,414 1,936,625,169Commissions and other acquisition expenses 1,754,871,769 1,571,092,910Investment expenses (Note 21) 235,301,563 168,731,544Other losses (Note 22) 60,293,960 45,043,804Total Operating Expenses 4,152,252,706 3,721,493,427Total Insurance Benefits and Operating Expenses 18,553,248,892 14,093,116,598INCOME BEFORE INCOME TAX 3,656,245,558 5,615,340,655PROVISION FOR INCOME TAX (Note 25) 658,255,859 599,760,605NET INCOME P2,997,989,699 P5,015,580,050
ATTRIBuTABLE TO:Parent Company P2,997,991,815 P5,015,586,984Non-controlling Interest (2,116) (6,934))
NET INCOME P2,997,989,699 P5,015,580,050
See accompanying Notes to Consolidated Financial Statements.
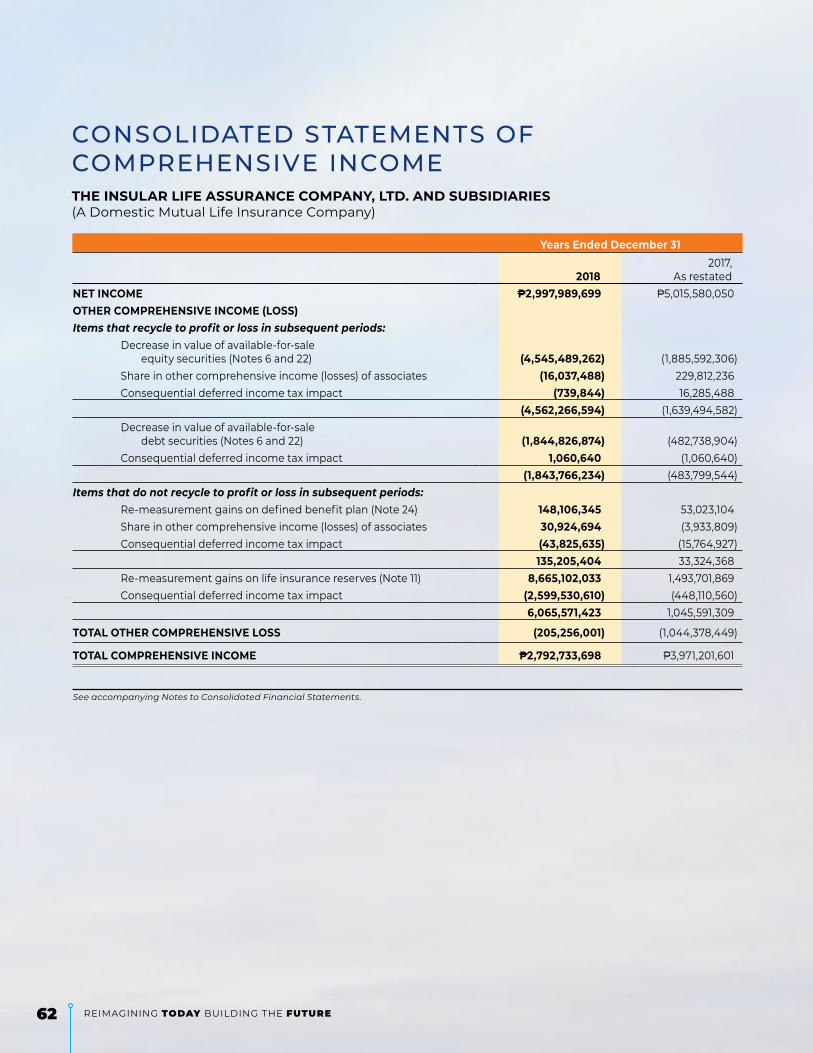
62 Reimagining Today Building the FuTure
CONSOLIDATED STATEMENTS OF COMPREHENSIVE INCOMETHE INSuLAR LIFE ASSuRANCE COMPANY, LTD. AND SuBSIDIARIES(A Domestic Mutual Life Insurance Company)
Years Ended December 31
20182017,
As restatedNET INCOME P2,997,989,699 P5,015,580,050OTHER COMPREHENSIVE INCOME (LOSS)Items that recycle to profit or loss in subsequent periods: Decrease in value of available-for-sale equity securities (Notes 6 and 22) (4,545,489,262) (1,885,592,306) Share in other comprehensive income (losses) of associates (16,037,488) 229,812,236 Consequential deferred income tax impact (739,844) 16,285,488
(4,562,266,594) (1,639,494,582) Decrease in value of available-for-sale debt securities (Notes 6 and 22) (1,844,826,874) (482,738,904) Consequential deferred income tax impact 1,060,640 (1,060,640)
(1,843,766,234) (483,799,544)Items that do not recycle to profit or loss in subsequent periods: Re-measurement gains on defined benefit plan (Note 24) 148,106,345 53,023,104 Share in other comprehensive income (losses) of associates 30,924,694 (3,933,809) Consequential deferred income tax impact (43,825,635) (15,764,927)
135,205,404 33,324,368 Re-measurement gains on life insurance reserves (Note 11) 8,665,102,033 1,493,701,869 Consequential deferred income tax impact (2,599,530,610) (448,110,560) 6,065,571,423 1,045,591,309
TOTAL OTHER COMPREHENSIVE LOSS (205,256,001) (1,044,378,449)
TOTAL COMPREHENSIVE INCOME P2,792,733,698 P3,971,201,601
See accompanying Notes to Consolidated Financial Statements.

632018 annual report
CO
NS
OL
IDA
TE
D S
TAT
EM
EN
TS
OF
CH
AN
GE
S I
N E
qU
ITy
THE
INSu
LAR
LIF
E A
SSu
RA
NC
E C
OM
PA
NY,
LTD
. AN
D S
uB
SID
IAR
IES
(A D
omes
tic
Mu
tual
Life
Insu
ran
ce C
omp
any)
Equi
ty A
ttrib
utab
le to
Gro
up C
ompa
ny
Rese
rve
for F
luct
uatio
n in
Ava
ilabl
e-fo
r-Sal
eCu
mul
ativ
e Re
-mea
sure
men
t Gai
n
Prem
ium
on
Dee
med
D
ispos
al o
fCu
mul
ativ
eFi
nanc
ial A
sset
s (l
osse
s) o
n D
efine
d Be
nefit
Pla
nIn
vest
men
tRe
-mea
sure
men
tEq
uity
Attr
ibut
able
to th
e Pa
rent
Com
pany
Attri
buta
ble
to th
eAt
trib
utab
leAt
trib
utab
le to
in a
ndSh
are
in S
urpl
usGa
ins (
Loss
es) o
nTo
tal E
quity
Attr
ibut
able
toEq
uity
Sec
uriti
esD
ebt S
ecur
ities
Asso
ciat
esto
the
Pare
ntth
e As
soci
ates
Asso
ciat
eRe
serv
es o
fLi
fe In
sura
nce
Reta
ined
Ear
ning
s (N
otes
15 a
nd 3
3)At
trib
utab
le to
Non
-con
trol
ling
(Not
e 6)
(Not
e 6)
(Not
e 7)
(Not
e 24
)(N
ote
7) (N
ote
7)Su
bsid
iary
Rese
rves
(Not
e 11)
Appr
opria
ted
Unap
prop
riate
dPa
rent
Com
pany
Inte
rest
(Not
e 28
)To
tal
BALA
NCES
AT
DEC
EMBE
R 31
, 201
6,
as p
revi
ousl
y pr
esen
ted
P15,
143,
705,
534
(P40
8,02
2,51
6)(P
1,325
,628
,658
)(P
187,
205,
885)
(P31
,352
,232
)P3
04,9
54,4
86P3
,226
,537
(P2,
368,
373,
366)
P550
,000
,000
P20,
910,
213,
218
P32,
591,5
17,11
8P1
54,4
01,8
57P3
2,74
5,91
8,97
5Ef
fect
of p
rior p
erio
d ad
just
men
ts–
––
––
––
––
(32,
525,
090)
(32,
525,
090)
–(3
2,52
5,09
0)BA
LANC
ES A
T D
ECEM
BER
31, 2
016,
as
rest
ated
P15,
143,
705,
534
(P40
8,02
2,51
6)(P
1,325
,628
,658
)(P
187,
205,
885)
(P31
,352
,232
)P3
04,9
54,4
86P3
,226
,537
(P2,
368,
373,
366)
P550
,000
,000
P20,
877,
688,
128
P32,
558,
992,
028
P154
,568
,011
P32,
713,
393,
885
Tota
l com
preh
ensiv
e in
com
e (lo
ss)
(1,86
9,30
6,81
8)(4
83,79
9,41
7)22
9,81
2,23
637
,257
,988
(3,9
33,8
09)
––
1,045
,591
,309
–5,
015,
586,
984
3,97
1,208
,473
(6,8
72)
3,97
1,201
,601
Reve
rsal
of p
revi
ous c
harg
es to
re
tain
ed e
arni
ngs o
n
polic
yhol
der’s
div
iden
ds–
––
––
––
––
(198,
057,0
36)
(198,
057,0
36)
–(19
8,05
7,036
)D
ivid
ends
to m
embe
rs (N
ote
28)
––
––
––
––
–(6
,697
,397
)(6
,697
,397
)–
(6,6
97,3
97)
Net
incr
ease
in p
refe
rred
shar
es–
––
––
––
––
––
173,
026
173,
026
BALA
NCES
AT
DEC
EMBE
R 31
, 201
7,
as re
stat
edP1
3,27
4,39
8,71
6(P
891,8
21,9
33)
(P1,0
95,8
16,4
22)
(P14
9,94
7,89
7)(P
35,2
86,0
41)
P304
,954
,486
P3,2
26,5
37(P
1,322
,782
,057
)P5
50,0
00,0
00P2
5,68
8,52
0,67
9P3
6,32
5,44
6,06
8P1
54,5
68,0
11P3
6,48
0,01
4,07
9 BA
LANC
ES A
T D
ECEM
BER
31, 2
017,
as
pre
viou
sly
pres
ente
dP1
3,27
4,39
8,71
6(P
891,8
21,9
33)
(P1,0
95,8
16,4
22)
(P14
9,94
7,89
7)(P
35,2
86,0
41)
P304
,954
,486
P3,2
26,5
37(P
1,322
,782
,057
)P5
50,0
00,0
00P2
5,73
9,38
6,09
2P3
6,37
6,31
1,481
P154
,568
,011
P36,
530,
879,
492
Effe
ct o
f prio
r per
iod
adju
stm
ents
––
––
––
––
–(5
0,86
5,41
3)(5
0,86
5,41
3)–
(50,
865,
413)
BALA
NCES
AT
DEC
EMBE
R 31
, 201
7,
as re
stat
edP1
3,27
4,39
8,71
6(P
891,8
21,9
33)
(P1,0
95,8
16,4
22)
(P14
9,94
7,89
7)(P
35,2
86,0
41)
P304
,954
,486
P3,2
26,5
37(P
1,322
,782
,057
)P5
50,0
00,0
00P2
5,68
8,52
0,67
9P3
6,32
5,44
6,06
8P1
54,5
68,0
11P3
6,48
0,01
4,07
9Ef
fect
of a
dopt
ion
of P
FRS
9
of a
n as
soci
ate
––
1,103
,741,0
00–
––
––
–30
4,79
6,00
01,4
08,5
37,0
00–
1,408
,537
,000
BALA
NCES
AT
JANu
ARY
1, 20
18,
as re
stat
edP1
3,27
4,39
8,71
6(P
891,8
21,9
33)
P7,9
24,5
78(P
149,
947,
897)
(P35
,286
,041
)P3
04,9
54,4
86P3
,226
,537
(P1,3
22,7
82,0
57)
P550
,000
,000
P25,
993,
316,
679
P37,
733,
983,
068
P154
,568
,011
P37,
888,
551,0
79To
tal c
ompr
ehen
sive
inco
me
(loss
)(4
,546
,229
,106)
(1,84
3,766
,234
)(16
,037
,488
)10
4,28
0,71
030
,924
,694
–
–6,
065,
571,4
23–
2,99
7,991
,815
2,792
,735
,814
(2,11
6)2,7
92,7
33,6
98D
econ
solid
atio
n of
a su
bsid
iary
(N
ote
28)
––
––
––
(3,2
26,5
37)
––
–(3
,226
,537
)(15
4,57
5,48
9)(15
7,802
,026
)D
ivid
ends
––
––
––
––
–(12
,598
,370
)(12
,598
,370
)–
(12,5
98,3
70)
Net
incr
ease
in p
refe
rred
shar
es–
––
––
––
––
––
9,59
49,
594
BALA
NCES
AT
DEC
EMBE
R 31
, 201
8P8
,728
,169,
610
(P2,
735,
588,
167)
(P8,
112,9
10)
(P45
,667
,187)
(P4,
361,3
47)
P304
,954
,486
P−P4
,742
,789
,366
P550
,000
,000
P28,
978,
710,
124
P40,
510,
893,
975
P−P4
0,51
0,89
3,97
5
See
acc
omp
an
yin
g N
otes
to
Con
solid
ate
d F
ina
nci
al S
tate
men
ts.
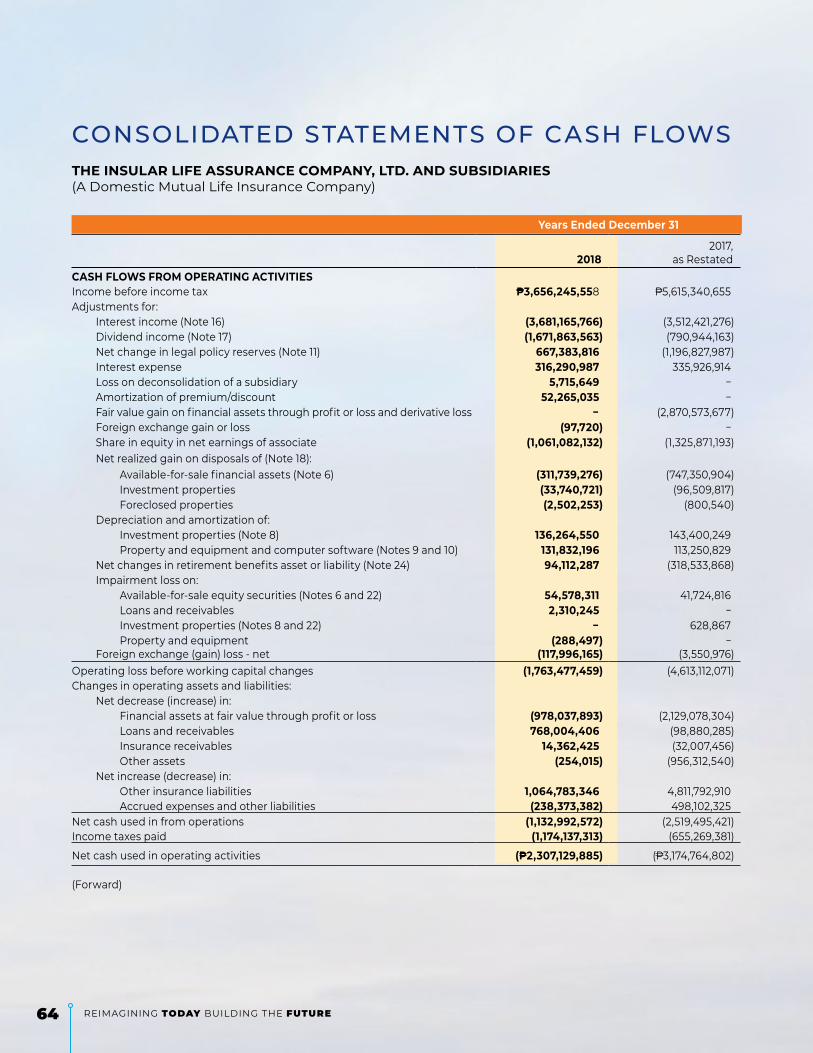
64 Reimagining Today Building the FuTure
CONSOLIDATED STATEMENTS OF CASH FLOWSTHE INSuLAR LIFE ASSuRANCE COMPANY, LTD. AND SuBSIDIARIES(A Domestic Mutual Life Insurance Company)
Years Ended December 31
20182017,
as RestatedCASH FLOWS FROM OPERATING ACTIVITIES Income before income tax P3,656,245,558 P5,615,340,655Adjustments for:
Interest income (Note 16) (3,681,165,766) (3,512,421,276)Dividend income (Note 17) (1,671,863,563) (790,944,163)Net change in legal policy reserves (Note 11) 667,383,816 (1,196,827,987)Interest expense 316,290,987 335,926,914Loss on deconsolidation of a subsidiary 5,715,649 −Amortization of premium/discount 52,265,035 −Fair value gain on financial assets through profit or loss and derivative loss − (2,870,573,677)Foreign exchange gain or loss (97,720) −Share in equity in net earnings of associate (1,061,082,132) (1,325,871,193)Net realized gain on disposals of (Note 18):
Available-for-sale financial assets (Note 6) (311,739,276) (747,350,904)Investment properties (33,740,721) (96,509,817)Foreclosed properties (2,502,253) (800,540)
Depreciation and amortization of: Investment properties (Note 8) 136,264,550 143,400,249Property and equipment and computer software (Notes 9 and 10) 131,832,196 113,250,829
Net changes in retirement benefits asset or liability (Note 24) 94,112,287 (318,533,868)Impairment loss on:
Available-for-sale equity securities (Notes 6 and 22) 54,578,311 41,724,816Loans and receivables 2,310,245 −Investment properties (Notes 8 and 22) − 628,867Property and equipment (288,497) −
Foreign exchange (gain) loss - net (117,996,165) (3,550,976)Operating loss before working capital changes (1,763,477,459) (4,613,112,071)Changes in operating assets and liabilities:
Net decrease (increase) in: Financial assets at fair value through profit or loss (978,037,893) (2,129,078,304)Loans and receivables 768,004,406 (98,880,285)Insurance receivables 14,362,425 (32,007,456)Other assets (254,015) (956,312,540)
Net increase (decrease) in: Other insurance liabilities 1,064,783,346 4,811,792,910Accrued expenses and other liabilities (238,373,382) 498,102,325
Net cash used in from operations (1,132,992,572) (2,519,495,421)Income taxes paid (1,174,137,313) (655,269,381)
Net cash used in operating activities (P2,307,129,885) (P3,174,764,802)
(Forward)

652018 annual report
Years Ended December 31
20182017,
as RestatedCASH FLOWS FROM INVESTING ACTIVITIES Interest income received P3,566,418,805 P3,488,838,340Collections of loans and receivable 1,218,906,471 −Proceeds from disposals and/or maturities of: Available-for-sale financial assets (Note 6) 812,991,935 1,973,862,116 Held-to-maturity financial assets (Note 6) 338,127,200 213,467,250 Investment properties 96,823,212 417,332,095 Property and equipment 9,637,118 18,723,065Dividends received 2,017,486,765 1,116,979,633Releases of loans and receivables (1,000,000,000)Deconsolidation of a subsidiary (Note 28) (2,187,857) −Additional (collection of) investments in:
Available-for-sale financial assets (Note 6) (5,009,935,765) (5,481,336,567)Investment properties (Note 8) (168,554,126) (446,824,059)Property and equipment and computer software (Notes 9 and 10) (161,744,146) (430,094,355)Held-to-maturity financial assets (Note 6) (132,449,040) (58,678,480)
Net cash generated from investing activities 1,585,520,572 812,269,038
CASH FLOWS FROM FINANCING ACTIVITIES Payments of dividends to members − (206,758,439)Interest paid to members (724,070,916) (335,926,914)Redemption of preferred shares (Note 28) (101,027,371) (64,724,438)Issuances of preferred shares (Note 28) 48,455,553 64,897,464Net cash used in financing activities (776,642,734) (542,512,327)
NET DECREASE IN CASH AND CASH EQuIVALENTS (1,498,252,047) (2,905,008,091)
NET FOREIGN EXCHANGE GAINS 1,983,212 6,241,095
CASH AND CASH EQuIVALENTS AT BEGINNING OF YEAR 4,965,844,081 7,864,611,077
CASH AND CASH EQuIVALENTS AT END OF YEAR (Note 4) P3,469,575,246 P4,965,844,081
See accompanying Notes to Consolidated Financial Statements.

66 Reimagining Today Building the FuTure *SGVFS034462*
THE INSULAR LIFE ASSURANCE COMPANY, LTD. AND SUBSIDIARIES (A Domestic Mutual Life Insurance Company) NOTES TO CONSOLIDATED FINANCIAL STATEMENTS 1. Corporate Information and Authorization for the Issuance of the Financial Statements
1.1. Corporate Information
The Insular Life Assurance Company, Ltd. (the “Parent Company”), a mutual life insurance company primarily engaged in the life insurance business, was incorporated in the Philippines and registered with the Philippine Securities and Exchange Commission (SEC) on November 25, 1910. The Parent Company will be celebrating its 109th year anniversary on November 25, 2019. On November 12, 2010, the SEC approved the amendment of the Company's Article of Incorporation to extend its corporate term for another 50 years or until November 26, 2060.
The registered business address of the Parent Company is Level 30 Insular Life Corporate Centre, Insular Life Drive, Filinvest Corporate City, Alabang, Muntinlupa City.
The Parent Company and its subsidiaries (collectively referred to as the “Group”) are primarily engaged in the business of life insurance, healthcare, lending, and investment management (Note 28).
1.2. Authorization for Issuance of the Financial Statements The consolidated financial statements of the Group were approved and authorized for issuance by the Board of Trustees (BOT) on March 28, 2019.
2. Summary of Significant Accounting and Financial Reporting Policies
2.1. Statement of Compliance
The consolidated financial statements have been prepared in compliance with Philippine Financial Reporting Standards (PFRS).
2.2. Basis of Preparation The consolidated financial statements have been prepared on a historical cost basis, except for financial assets at fair value through profit or loss (FVPL) and available-for-sale (AFS) financial assets that have been measured at fair value.
The financial statements are presented in Philippine Peso (Peso), which is the Group’s functional and presentation currency. All amounts were rounded to the nearest Peso, except when otherwise indicated.
2.3. Changes in Accounting Policies
2.3.1. New Standards and Interpretations Issued and Effective as at January 1, 2018
The accounting policies adopted are consistent with those of the previous financial year except for the following new pronouncements and amendments to existing PFRS that became effective beginning January 1, 2018 and which did not have any significant impact on the Group’s financial statements, unless otherwise stated. a. PAS 40, Investment Property, Transfers of Investment Property
b. PAS 28, Investment in Associate and Joint Venture - Measuring an associate or joint
venture at fair value

672018 annual report
- 2 -
*SGVFS034462*
c. PFRS 2, Share-based Payment, Classification and Measurement of Share based Payment Transactions
d. PFRS 4, Applying PFRS 9 Financial Instruments with PFRS 4 Insurance Contracts The amendments address concerns arising from implementing PFRS 9, the new financial instruments standard before implementing the new insurance contracts standard. The amendments introduce two options for entities issuing insurance contracts: a temporary exemption from applying PFRS 9 and an overlay approach. The temporary exemption permits eligible entities whose activities are predominantly connected with insurance to continue applying PAS39 rather than PFRS 9. The assessment for whether a reporting entity’s activities are predominantly connected with insurance is based on the liabilities connected with insurance in proportion to the entity’s total liabilities. The overlay approach allows an entity applying PFRS 9 from 2018 onwards to remove from profit or loss the effects of some of the accounting mismatches that may occur from applying PFRS 9 the adoption of IFRS 17, Insurance Contracts. The Group performed an assessment of the amendments and reached the conclusion that as of December 31, 2015, its activities are predominantly connected with insurance. As at December 31, 2015, the Group’s gross liabilities arising from the contracts within the scope of PFRS 4 represented 98.56% of the total carrying amount of all its liabilities. In 2018, there had been no significant change in the activities of the Group that requires reassessment. Hence, the Group opted to apply the temporary exemption from PFRS 9 and therefore continues to apply PAS 39, Financial Instruments: Recognition and Measurement, to its financial assets and financial liabilities until the Group applies the new standard on insurance contracts. In addition to the above, the Amendments to PFRS 4 also introduced additional disclosures to enable users of financial statements to make comparison of entities that applied temporary exemption from adopting PFRS 9 with those that adopted PFRS 9 starting 2018, including fair value disclosures (see Note 30) and credit risk information (see Note 31). The Amendments to PFRS 4 permits entities not to apply uniform accounting policies when the investee applies PFRS 9 and the investor applies PAS 39, or vice versa, when applying the equity method of accounting. The Group availed of such relief. Hence, while the Group continues to apply PAS 39 in accounting for its financial instruments, it retained the PFRS 9 accounting adopted by its associates in 2018 in applying the equity method of accounting for its investments in associates.
e. Philippine Interpretation IFRIC 22, Foreign Currency Transaction and Advance Consideration
f. PFRS 9, Financial Instruments
PFRS 9 reflects all phases of the financial instruments project and replaces PAS 39, Financial Instruments: Recognition and Measurement, and all previous versions of PFRS 9. The standard introduces new requirements for classification and measurement, impairment, and hedge accounting.
The adoption of PFRS 9 will have an effect on the classification and measurement of the Group’s financial assets and impairment methodology for financial assets, but will

68 Reimagining Today Building the FuTure
- 3 -
*SGVFS034462*
have no impact on the classification and measurement of the Group’s financial liabilities. The adoption will also have an effect on the Group’s amount of its credit losses.
The Group applies the temporary exemption from PFRS 9 as permitted by the Amendments to PFRS 4 Applying IFRS 9 Financial Instruments with IFRS 4 Insurance Contracts issued in September 2016 and continues to apply PAS 39 in accounting for its financial instruments. In 2018, the Group’s associates whose activities are not predominantly connected with insurance adopted the final version of PFRS 9 in their separate financial statements. For purposes of applying the equity method of accounting for its investment in associates, the Group availed of the relief not to adjust the PFRS 9 financial information of its associates to PAS 39. Hence, the Group accounted for the transition of its associates from PAS 39 to PFRS 9 for purposes of equity accounting as discussed in Note 2.6.
g. PFRS 15, Revenue from Contracts with Customers
PFRS 15 supersedes PAS 18, Revenue and related interpretations and it applies with limited exceptions, to all revenue from contracts with customers. PFRS 15 establishes a five-step model to account for revenue arising from contracts with customers and requires that revenue be recognized at an amount that reflects the consideration to which an entity expects to be entitled in exchange for transferring goods or services to customers.
PFRS 15 requires entities to exercise judgment, taking into consideration all of the relevant facts and circumstances when applying each step of the model to contracts with their customer. The standard also specifies the accounting for the incremental costs of obtaining a contract and the costs directly related to fulfilling a contract. In addition, the standard requires extensive disclosures.
The Group has adopted PFRS 15 effective January 1, 2018 using a modified retrospective approach.
The adoption of PFRS 15 has no significant impact on the Group’s financial statements since major sources of the Group’s revenue are outside the scope of PFRS 15. These include insurance revenue, investment income, rental income, net realized gains and foreign exchange gain. In addition, the Group assessed that the revenue recognition requirements for other sources of income such as management fees and policy administration included under ‘Other Income’ (see note 29) remain the same when they apply the five-step model under PFRS 15 (see detailed discussion in Revenue accounting policy).
2.3.2. Standards Issued but Not Yet Effective
Pronouncements issued but not yet effective are listed below. Unless otherwise indicated, the Group does not expect that the future adoption of the said pronouncements will have a significant impact on its consolidated financial statements. The Group intends to adopt the following pronouncements when they become effective.

692018 annual report
- 4 -
*SGVFS034462*
Effective beginning on or after January 1, 2019
PFRS 16, Leases Under the new standard, lessees will no longer classify their leases as either operating or finance leases in accordance with PAS 17, Leases. Rather, lessees will apply the single-asset model. Under this model, lessees will recognize the assets and related liabilities for most leases on their statements of financial position, and subsequently, will depreciate the lease assets and recognize interest on the lease liabilities in their profit or loss. Leases with a term of 12 months or less or for which the underlying asset is of low value are exempted from these requirements.
The accounting by lessors is substantially unchanged as the new standard carries forward the principles of lessor accounting under PAS 17. Lessors, however, will be required to disclose more information in their financial statements, particularly on the risk exposure to residual value. Entities may early adopt PFRS 16 but only if they have also adopted PFRS 15. When adopting PFRS 16, an entity is permitted to use either a full retrospective or a modified retrospective approach, with options to use certain transition reliefs.
The Group is currently assessing the impact of adopting PFRS 16. Upon adoption of this standard, the Group expects to recognize a right-of-use asset and lease liability for covered lease contracts. The Group will also recognize interest expense on the lease liability and a depreciation charge from the right-of-use asset.
Amendments to PFRS 9, Prepayment Features with Negative Compensation Amendments to PAS 19, Employee Benefits, Plan Amendment, Curtailment or
Settlement Amendments to PAS 28, Long-term Interests in Associates and Joint Ventures Philippine Interpretation IFRIC-23, Uncertainty over Income Tax Treatments Annual Improvements to PFRSs 2015-2017 Cycle
o Amendments to PFRS 3, Business Combinations, and PFRS 11, Joint
Arrangements, Previously Held Interest in a Joint Operation o Amendments to PAS 12, Income Tax Consequences of Payments on Financial
Instruments Classified as Equity o Amendments to PAS 23, Borrowing Costs, Borrowing Costs Eligible for
Capitalization Effective beginning on or after January 1, 2020 Amendments to PFRS 3, Definition of a Business Amendments to PAS 1, Presentation of Financial Statements, and PAS 8, Accounting
Policies, Changes in Accounting Estimates and Errors, Definition of Material
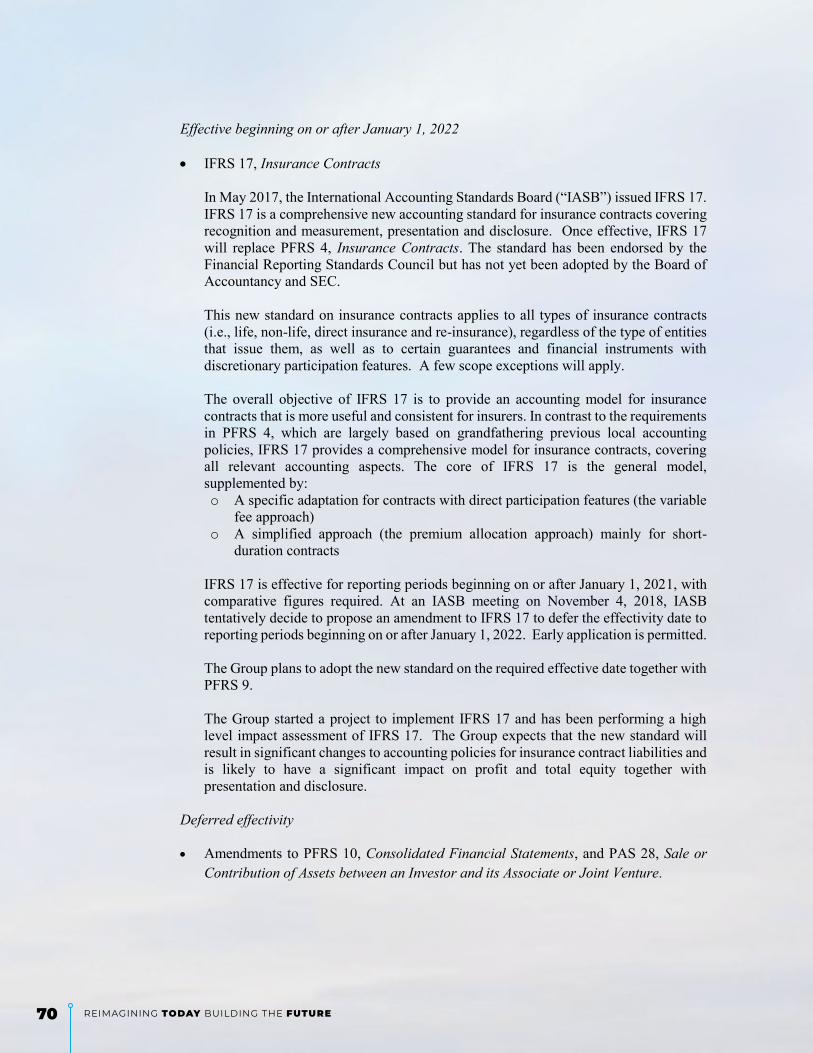
70 Reimagining Today Building the FuTure
- 5 -
*SGVFS034462*
Effective beginning on or after January 1, 2022 IFRS 17, Insurance Contracts
In May 2017, the International Accounting Standards Board (“IASB”) issued IFRS 17. IFRS 17 is a comprehensive new accounting standard for insurance contracts covering recognition and measurement, presentation and disclosure. Once effective, IFRS 17 will replace PFRS 4, Insurance Contracts. The standard has been endorsed by the Financial Reporting Standards Council but has not yet been adopted by the Board of Accountancy and SEC.
This new standard on insurance contracts applies to all types of insurance contracts (i.e., life, non-life, direct insurance and re-insurance), regardless of the type of entities that issue them, as well as to certain guarantees and financial instruments with discretionary participation features. A few scope exceptions will apply. The overall objective of IFRS 17 is to provide an accounting model for insurance contracts that is more useful and consistent for insurers. In contrast to the requirements in PFRS 4, which are largely based on grandfathering previous local accounting policies, IFRS 17 provides a comprehensive model for insurance contracts, covering all relevant accounting aspects. The core of IFRS 17 is the general model, supplemented by: o A specific adaptation for contracts with direct participation features (the variable
fee approach) o A simplified approach (the premium allocation approach) mainly for short-
duration contracts
IFRS 17 is effective for reporting periods beginning on or after January 1, 2021, with comparative figures required. At an IASB meeting on November 4, 2018, IASB tentatively decide to propose an amendment to IFRS 17 to defer the effectivity date to reporting periods beginning on or after January 1, 2022. Early application is permitted. The Group plans to adopt the new standard on the required effective date together with PFRS 9. The Group started a project to implement IFRS 17 and has been performing a high level impact assessment of IFRS 17. The Group expects that the new standard will result in significant changes to accounting policies for insurance contract liabilities and is likely to have a significant impact on profit and total equity together with presentation and disclosure.
Deferred effectivity Amendments to PFRS 10, Consolidated Financial Statements, and PAS 28, Sale or
Contribution of Assets between an Investor and its Associate or Joint Venture.

712018 annual report
- 6 -
*SGVFS034462*
2.4. Basis of Consolidation The consolidated financial statements comprise the financial statements of the Group and its associates as at December 31, 2018 and 2017.
Specifically, the Group controls an investee if and only if it has: Power over the investee (i.e., existing rights that give it the current ability to direct the
relevant activities of the investee); Exposure (or rights) to variable returns from its involvement with the investee; and The ability to use its power over the investee to affect its returns.
When the Group has less than a majority of the voting or similar rights of an investee, the Group considers all relevant facts and circumstances in assessing whether it has power over an investee, including: The contractual arrangement with the other vote holders of the investee; Rights arising from other contractual arrangements; and The Group’s voting rights and potential voting rights.
The Group reassesses whether or not it controls an investee if facts and circumstances indicate that there are changes to one or more of the three elements of control. A subsidiary is an entity that is controlled by the Parent Company (i.e., either directly or through intermediate parent companies within the Group). Consolidation of a subsidiary begins when the Parent Company obtains control over the subsidiary and ceases when the Parent Company loses control of the subsidiary. Assets, liabilities, income, and expenses of a subsidiary acquired or disposed of during the year are included in the consolidated statements of comprehensive income from the date the Parent Company gain control until the date the Parent Company ceases to control the subsidiary.
Following are the Parent Company’s subsidiaries and the corresponding percentages of ownership as of December 31:
Percentage of Ownership 2018 2017 Insular Investment Corporation (IIC) 100.00 100.00
● IITC Properties, Inc. 100.00 100.00 * ● Insular Property Ventures, Inc. 100.00 100.00 *
Insular Health Care Incorporated (I-Care) 100.00 100.00 Insular Life Management and Development Corporation (ILMADECO) 100.00 100.00
● ILAC General Insurance Agency, Inc. (ILAC-Gen) 100.00 100.00 ** Insular Life Property Holdings, Inc. (ILPHI) 100.00 100.00 Home Credit Mutual Building & Loan Association, Inc. (Home Credit) − 99.96 *Represents the Company’s ownership through IIC **Represents the Company’s ownership through ILMADECO
On December 19, 2018, the Parent Company sold all of its ownership interest in Home Credit with net assets of P=10,715,469 in the consolidated financial statements for a consideration of P=5,715,649.
Profit or loss and each component of other comprehensive income (OCI) are attributed to the equity holders of the Parent Company and to the non-controlling interests, even if this results in the non-controlling interests having a deficit balance. When necessary, adjustments are made to the financial statements of subsidiaries to bring their accounting policies in line with the Group’s
72 Reimagining Today Building the FuTure
- 7 -
*SGVFS034462*
accounting policies. All intra-group assets and liabilities, equity, income, expenses, and cash flows relating to transactions between members of the Group are eliminated in full on consolidation. The financial statements of the subsidiaries are prepared for the same reporting years as the Group, except for ILMADECO which is consolidated based on its financial statements as of March 31, 2019 and 2018 and for the years then ended, using consistent accounting principles and policies.
A change in the ownership interest of a subsidiary, without a loss of control, is accounted for as an equity transaction. If the Group loses control over a subsidiary, it: (a) derecognizes the assets and liabilities of the subsidiary; (b) derecognizes the carrying amounts of any non-controlling interest; (c) derecognizes the cumulative translation differences recorded in equity; (d) recognizes the fair value of consideration received; (e) recognizes the fair value of any investment retained; (f) recognizes any surplus or deficit in profit or loss; and (g) reclassifies the parent’s share of components previously recognized in OCI to profit or loss.
2.5. Non-controlling Interest Non-controlling interest represents the portion of income and expense, and net assets in Home Credit not held by the Parent Company and are presented separately in the consolidated statements of income and within members’ equity in the consolidated statements of financial position, separate from the members’ equity attributable to the Group.
2.6. Prior Period Adjustments and Associates’ Adoption of PFRS 9 2.6.1. Prior period adjustments
Revenue Recognition of I-Care In 2018, the Insurance Commission (IC) issued IC Circular Letter No. 2018-03 requiring Health Maintenance Organizations (HMOs) to recognize revenue from membership fee on a straight-line basis over the period of enrollment of the members. Previously, I-Care recognized as revenue 31%, 39% and 35% of the total membership fees upfront for corporate accounts, individual accounts and broker-driven accounts, respectively, to match the timing of revenue recognition with the upfront cost. The balance is then earned on a straight-line basis over the contract period when the Company provides assistance on claims processing. In 2018, I-Care has restated the comparative 2017 financial statements to comply with IC Circular Letter No. 2018-03.
Classification of dual-use properties The Group retroactively changed the classification of properties that are partly used or intended to be used to earn rentals and/or held for property appreciation and partly used or intended to be used for insurance operations, administrative functions or use by its employees (“dual-use” properties). Previously, the classification of dual-use properties depends on the majority use of the property’s usable area (e.g., a dual-use property where the use or intended use of majority of the property is to earn rentals was classified as investment property). To provide more reliable and relevant information about the condition and use or intended use of the Company’s properties, the owner-occupied and investment property portions are now accounted for separately and allocated between property and equipment and investment properties. There is no impact in the carrying amount of the properties upon reclassification as the properties continue to be carried at cost less accumulated depreciation and accumulated impairment loss.

732018 annual report
- 8 -
*SGVFS034462*
The effect of the aforementioned prior period adjustments on the statements of financial position follow:
January 1, 2017
As previously
reported Effect of
restatement As restated Statement of financial position Unappropriated retained earnings P=20,910,213,218 (P=32,525,090) P=20,877,688,128 Accrued expenses and other
liabilities 1,482,309,199 32,525,090 1,514,834,289 Investment properties 8,117,694,965 (1,230,623,508) 6,887,071,457 Property and equipment 285,888,862 1,230,623,508 1,516,512,370
December 31, 2017
As previously
reported Effect of
restatement As restated Statement of financial position Unappropriated retained earnings P=25,739,386,092 (P=50,865,413) P=25,688,520,679 Accrued expenses and other
liabilities 1,972,692,075 50,865,413 2,023,557,488 Investment properties 7,905,810,966 (1,549,262,347) 6,356,548,619 Property and equipment 809,584,589 1,549,262,347 2,358,846,936 Statement of income Gross earned premiums on
insurance contracts P=12,452,751,342 (P=18,340,323) P=12,434,411,019 Net income 5,033,920,373 (18,340,323) 5,015,580,050
2.6.2. Associates’ adoption of PFRS 9 On January 1, 2018, the Group’s associates adopted the final version of PFRS 9 in their separate financial statements. PFRS 9 affected the way associates, particularly Union Bank of the Philippines, account for their financial instruments. Since UBP is an early adopter of an earlier version of PFRS 9 covering classification and measurement of financial assets, the PFRS 9 financial information of UBP was converted to PAS 39 for purposes of the application of the equity method in previous years. Upon the effectivity of the Amendments to PFRS 4 in 2018, the Group opted for the temporary exemption approach and continued to apply PAS 39 while UBP adopted the final version of PFRS 9, including the expected credit loss model of provisioning for financial assets. The Group also availed of the relief not to adjust the PFRS 9 financial information of its associates, particularly UBP, to PAS 39 in applying the equity method. Accordingly, the Group accounted for the transition of UBP from PAS 39 to PFRS 9 as of January 1, 2018 for purposes of equity accounting.
January 1, 2018
As previously
reported Effect of associates’ adoption of PFRS 9 As adjusted
Statement of financial position Investments in associates P=10,343,606,515 P=1,408,537,000 P=11,752,143,515 Reserve for fluctuation of
available-for-sale financial assets attributable to associates (1,095,816,422) 1,103,741,000 7,924,578
Unappropriated retained earnings 25,688,520,679* 304,796,000 25,993,316,679 *Amount as restated for prior period adjustments discussed above

74 Reimagining Today Building the FuTure
- 9 -
*SGVFS034462*
UBP applied the modified retrospective approach in adopting PFRS 9, which allowed UBP not to restate the comparative period for the effect of the adoption. Hence, the impact of PFRS 9 adoption to the Group’s financial statements was reflected as of January 1, 2018.
The combined impact of the aforementioned prior period adjustments and the associates’ adoption of PFRS 9 as of December 31, 2017/January 1, 2018 follow:
December 31, 2017/January 1, 2018
As previously
reported
Effect of restatement/ adjustment As restated
Statement of financial position Investments in associates P=10,343,606,515 P=1,408,537,000 P=11,752,143,515 Reserve for fluctuation of in
available-for-sale financial assets (1,095,816,422) 1,103,741,000 7,924,578
Unappropriated retained earnings 25,739,386,092 253,930,587 25,993,316,679 Accrued expenses and other
liabilities 1,972,692,075 50,865,413 2,023,557,488 Investment properties 7,905,810,966 (1,549,262,347) 6,356,548,619 Property and equipment 809,584,589 1,549,262,347 2,358,846,936
2.7. Fair Value Measurement The Group measures its financial assets at FVPL and AFS at fair value at each reporting date. Also, the fair values of held-to-maturity (HTM) securities, and other financial liabilities measured at amortized cost are disclosed in Note 30. Fair value is the price that would be received to sell an asset or paid to transfer a liability in an orderly transaction between market participants at the measurement date. The fair value measurement is based on the presumption that the transaction to sell the asset or transfer the liability takes place either: In the principal market for the asset or liability; or In the absence of a principal market, in the most advantageous market for the asset or liability.
The principal or the most advantageous market must be accessible to the Group. The fair value of an asset or a liability is measured using the assumptions that market participants would use when pricing the asset or liability, assuming that market participants act in their economic best interest. A fair value measurement of a non-financial asset takes into account a market participant's ability to generate economic benefits by using the asset in its highest and best use or by selling it to another market participant that would use the asset in its highest and best use. The Group uses valuation techniques that are appropriate in the circumstances and for which sufficient data are available to measure fair value, maximizing the use of relevant observable inputs and minimizing the use of unobservable inputs.
752018 annual report
- 10 -
*SGVFS034462*
All assets and liabilities for which fair value is measured or disclosed in the financial statements are categorized within the fair value hierarchy, described as follows, based on the lowest level input that is significant to the fair value measurement as a whole: Level 1 - Quoted (unadjusted) market prices in active markets for identical assets or
liabilities; Level 2 - Valuation techniques for which the lowest level input that is significant to the fair
value measurement is directly or indirectly observable; or Level 3 - Valuation techniques for which the lowest level input that is significant to the fair
value measurement is unobservable.
For assets and liabilities that are recognized in the consolidated financial statements on a recurring basis, the Group determines whether transfers have occurred between Levels in the hierarchy by re-assessing categorization (based on the lowest level input that is significant to the fair value measurement as a whole) at the end of each reporting period. The Group’s management determines the policies and procedures for both recurring and non-recurring fair value measurement. At each reporting date, the management analyzes the movements in the values of assets and liabilities which are required to be re-measured or re-assessed as per the Group’s accounting policies. For this analysis, management verifies the major inputs applied in the latest valuation by agreeing the information in the valuation computation to contracts and other relevant documents. For the purpose of fair value disclosures, the Group has determined classes of assets and liabilities on the basis of the nature, characteristics, and risks of the asset or liability, and the level of the fair value hierarchy as explained in previous page.
2.8. Cash and Cash Equivalents
Cash includes cash on hand and in banks. Cash equivalents are short-term, highly liquid investments that are readily convertible to known amounts of cash with original maturities of three months or less from the date of acquisition and that are subject to an insignificant risk of change in value.
2.9. Financial Instruments The Company recognizes a financial asset or a financial liability in the statements of financial position when it becomes a party to the contractual provisions of the instrument.
All regular way purchases and sales of financial assets are recognized on the trade date, i.e., the date the Group commits to purchase or sell the financial asset. Regular way purchases or sales of financial assets require delivery of financial assets within the time frame generally established by regulation or convention in the market place. Financial assets and financial liabilities are recognized initially at fair value. Transaction costs, if any, are included in the initial measurement of all financial assets and financial liabilities, except for financial instruments measured at FVPL.
The Group classifies its financial assets as financial assets at FVPL, HTM financial assets, loans and receivables, or AFS financial assets, as appropriate. Financial liabilities, on the other hand, are classified as either financial liabilities at FVPL or other financial liabilities, as appropriate. The classification depends on the purpose for which the financial instruments were acquired or originated. Management determines the classification of its financial instruments at initial recognition and, where allowed and appropriate, re-evaluates this designation at every reporting date.

76 Reimagining Today Building the FuTure
- 11 -
*SGVFS034462*
2.9.1. Financial Assets (a) Financial Assets at FVPL
Financial assets at FVPL include financial assets held-for-trading purposes or designated by management as financial asset at FVPL at initial recognition. Derivative instruments, except those covered by hedge accounting relationships, are classified under this category.
Financial assets are classified as held-for-trading if they are acquired for the purpose of selling in the near term. Financial assets are designated as at FVPL by management on initial recognition when any of the following is met:
i. The designation eliminates or significantly reduces the inconsistent treatment that would otherwise arise from measuring the financial assets or recognizing gains or losses on them on a different basis;
ii. The financial assets are part of a Group of financial assets which are managed and their performance evaluated on a fair value basis in accordance with a documented risk management or investment strategy; or
iii. The financial asset contains an embedded derivative, unless the embedded derivative does not significantly modify the cash flows or it is clear, with little or no analysis, that it would not be separately recorded.
These financial assets are subsequently measured at fair market value. Realized and unrealized gains and losses arising from changes in fair market value of financial assets at FVPL are recognized in the statements of income. Interest earned on debt securities is recognized as the interest accrues. Dividend income on equity securities is recognized according to the terms of the contract or when the right to receive payment has been established. The Group’s financial assets at FVPL amounting to P=29,335,874,588 and P=28,037,239,008 as of December 31, 2018 and 2017, respectively, are designated at FVPL by management at initial recognition (Note 6). These financial assets are part of a group of financial assets which are managed and their performance evaluated on a fair value basis in accordance with a documented investment strategy. The Group manages these financial assets in accordance with the investment strategy and valuation provisions of the Variable Unit-Linked (VUL) insurance contracts. Likewise, this is consistent with the valuation basis of the reserve for policies held by the policyholders. These financial assets consist primarily of quoted government and corporate debt securities with fixed interest rates, quoted equity securities, and structured notes. The Group also has investments in quoted preferred equity shares amounting to P=3,689,220,800 and P=3,995,369,950 as of December 31, 2018 and 2017, respectively, which are designated as at FVPL (Note 6).
(b) HTM Financial Assets
HTM financial assets are non-derivative financial assets that are quoted in the market, with fixed or determinable payments and fixed maturity which the Group has the positive intention and ability to hold to maturity. Financial assets intended to be held for an undefined period are not included in this classification. HTM financial assets are

772018 annual report
- 12 -
*SGVFS034462*
subsequently measured at amortized cost. The amortized cost is computed as the amount initially recognized minus principal repayments, plus or minus the cumulative amortization using the effective interest method of any difference between the initially recognized amount and the maturity amount. This calculation includes all fees paid or received between parties to the contract that are an integral part of the effective interest rate, transaction costs, and all other premiums and discounts. Gains and losses are recognized in the statements of income when the financial assets are derecognized, impaired, or amortized.
The Group’s HTM financial assets consist of quoted government and corporate debt securities with fixed interest rates (Note 6).
(c) Loans and Receivables
Loans and receivables are non-derivative financial assets with fixed or determinable payments that are not quoted in an active market. Loans and receivables are subsequently measured at amortized cost. The amortized cost is computed as the amount initially recognized minus principal repayments, plus or minus the cumulative amortization using the effective interest method of any difference between the initially recognized amount and the maturity amount. This calculation includes all fees paid or received between parties to the contract that are an integral part of the effective interest rate, transaction costs, and all other premiums and discounts. Gains and losses are recognized in the statements of income when the financial assets are derecognized, impaired, or amortized. The Group’s loans and receivables consist of cash and cash equivalents, insurance receivables, unquoted debt security, term loans, policy loans, accounts receivable, interest receivable, housing loans, car financing loans, mortgage loans, due from agents, and other receivables (Note 6).
(d) AFS Financial Assets
AFS financial assets are non-derivative financial assets which are designated as such or do not qualify to be classified as designated as at FVPL, HTM, or loans and receivables. Financial assets may be designated at initial recognition as AFS if they are purchased and held indefinitely and may be sold in response to liquidity requirements or changes in market conditions. AFS financial assets are subsequently measured at fair market value. When the fair value of AFS financial assets cannot be measured reliably because of lack of reliable estimates of future cash flows and discount rates necessary to calculate the fair value of unquoted equity securities, these financial assets are carried at cost, less any allowance for impairment losses. The effective yield component of AFS debt securities as well as the impact of translation of foreign currency-denominated AFS debt securities is reported in the consolidated statements of income. Interest earned on holding AFS financial assets is reported as interest income using the effective interest method. Dividends earned on holding AFS financial assets are recognized in the statements of income as investment income when the right to receive payment has been established. Unrealized gains and losses arising from changes in
78 Reimagining Today Building the FuTure
- 13 -
*SGVFS034462*
fair market value of AFS financial assets are reported in OCI until the financial asset is derecognized or as the financial asset is determined to be impaired. When the security is disposed of, the cumulative gain or loss previously recognized in OCI is recognized as realized gain in the consolidated statements of income. The Group’s AFS financial assets consist of quoted government and corporate debt securities with fixed interest rates, and quoted and unquoted equity securities (Note 6).
2.9.2. Financial Liabilities
Issued financial instruments or their components, which are not designated as at FVPL are classified as other financial liabilities, where the substance of the contractual arrangement results in the Group having an obligation either to deliver cash or another financial asset to the holder to satisfy the obligation other than by the exchange of a fixed amount of cash or another financial asset for a fixed number of own equity shares. Other financial liabilities are non-derivative financial liabilities with fixed or determinable payment that are not quoted in an active market.
Other financial liabilities are subsequently measured at amortized cost using the effective interest method. The amortized cost is computed as the amount initially recognized minus principal repayments, plus or minus the cumulative amortization using the effective interest method of any difference between the initially recognized amount and the maturity amount. This calculation includes all fees paid or received between parties to the contract that are an integral part of the effective interest rate, transaction costs, and all other premiums and discounts. Gains and losses are recognized in the statements of income when the financial liabilities are derecognized, impaired, or amortized. The Group’s other financial liabilities consist of accrued expenses and other liabilities except for provisions and statutory liabilities (Note 14).
2.9.3. Derivative financial instruments
Derivative financial instruments are initially recognized at fair value on the date in which a derivative transaction is entered into, and are subsequently re-measured at fair value. Any gains and losses from changes in fair value of these derivatives are recognized immediately to profit or loss, unless they are designated hedging instruments in effective cash flow hedges. Derivative financial instruments are carried as assets when the fair value is positive and as liabilities when the fair value is negative. The Company’s derivative liability consists of cross-currency swap (CCS) (Note 12).
2.9.4. Embedded Derivatives
The Group assesses whether embedded derivatives are required to be separated from the host contracts when the Group first becomes a party to the contract. Reassessment only occurs if there is a change in the terms of the contract that significantly modifies the cash flows that would otherwise be required.

792018 annual report
- 14 -
*SGVFS034462*
An embedded derivative is separated from the host financial or non-financial contract and accounted for as a derivative if all of the following conditions are met: • The economic characteristics and risks of the embedded derivative are not closely
related to the economic characteristic of the host contract; • A separate instrument with the same terms as the embedded derivative would meet the
definition of a derivative; and • The hybrid or combined instrument is not recognized as at FVPL.
Embedded derivatives that are bifurcated from the host contracts are accounted for as financial assets at FVPL. Changes in fair values are included in the consolidated statements of income.
2.9.5. Day 1 gain or loss Where the transaction price in a non-active market is different from the fair value of other observable current market transactions in the same instrument or based on a valuation technique whose variables include only data from observable market, the Group recognizes the difference between the transaction price and fair value (Day 1 gain or loss) in the consolidated statements of income unless it qualifies for recognition as some other type of asset. In cases where fair value is determined using data which is not observable, the difference between the transaction price and model value is only recognized in the consolidated statements of income when the inputs become observable or when the instrument is derecognized. For each transaction, the Group determines the appropriate method of recognizing the Day 1 amount.
2.9.6. Offsetting of Financial Instruments Financial assets and financial liabilities are offset and the net amount is reported in the consolidated statements of financial position if, and only if, there is a currently enforceable legal right to offset the recognized amounts and there is an intention to settle on a net basis, or to realize the asset and settle the liability simultaneously. This is not generally the case with master netting agreements and the related assets and liabilities are presented gross in the consolidated statements of financial position.
2.10. Classification of Financial Instruments Between Debt and Equity
A financial instrument is classified as debt if it provides for a contractual obligation to: deliver cash or another financial asset to another entity; exchange financial assets or financial liabilities with another entity under conditions that are
potentially unfavorable to the Group; or satisfy the obligation other than by the exchange of a fixed amount of cash or another financial
asset for a fixed number of own equity shares.
If the Group does not have an unconditional right to avoid delivering cash or another financial asset to settle its contractual obligation, the obligation meets the definition of a financial liability. The components of issued financial instruments that contain both liability and equity elements are accounted for separately, with the equity component being assigned the residual amount after deducting from the instruments as a whole the amount separately determined as the fair value of the liability component on the date of issue. Home Credit’s redeemable preferred shares which exhibit the characteristics of equity (i.e., Series A and Series B issued starting 2008), are presented under “Equity attributable to non-controlling interests” account in the consolidated statements of financial position. The corresponding dividends on those shares are presented as deduction from “Equity attributable to non-controlling interests” account in the consolidated statements of financial position.

80 Reimagining Today Building the FuTure
- 15 -
*SGVFS034462*
Derecognition of Financial Instruments 2.11.1 Financial Assets
A financial asset is derecognized when: the right to receive cash flows from the financial asset has expired; the Group retains the right to receive cash flows from the financial asset, but has
assumed an obligation to pay them in full without material delay to a third party under a “pass-through” arrangement; or
the Group has transferred its right to receive cash flows from the financial asset and either: (a) has transferred substantially all the risks and rewards of the financial asset; or (b) has neither transferred nor retained substantially all the risks and rewards of the financial asset, but has transferred control of the financial asset.
Where the Group has transferred its rights to receive cash flows from a financial asset and has neither transferred nor retained substantially all the risks and rewards of the financial asset nor transferred control of the financial asset, the financial asset is recognized to the extent of the Group’s continuing involvement in the financial asset.
2.11.2 Financial Liabilities A financial liability is derecognized when the obligation under the financial liability is extinguished, i.e., when discharged or cancelled or has expired. Where an existing financial liability is replaced by another from the same lender on substantially different terms, or the terms of an existing financial liability are substantially modified, such an exchange or modification is treated as a derecognition of the original financial liability and the recognition of a new financial liability and the difference in the respective carrying amounts is recognized in the statements of income.
2.11. Impairment of Financial Assets The Group assesses at each reporting date whether a financial asset or group of financial assets is impaired. A financial asset or a group of financial assets is deemed to be impaired if, and only if, there is objective evidence of impairment as a result of one or more events that has occurred after the initial recognition of the asset (an incurred ‘loss event’) and that loss event (or events) has an impact on the estimated future cash flows of the financial asset or the group of financial assets that can be reliably estimated.
Evidence of impairment may include indications that the borrower or a group of borrowers is experiencing significant financial difficulty, default, or delinquency in interest or principal payments, the probability that they will enter bankruptcy or other financial reorganization, and where observable data indicate that there is a measurable decrease in the estimated future cash flows, such as changes in arrears or economic conditions that correlate with defaults.
2.12.1 Financial Assets Carried at Amortized Cost
If there is objective evidence that an impairment loss on financial assets carried at amortized cost has been incurred, the amount of impairment loss is measured as the difference between the financial asset’s carrying amount and the present value of estimated future cash flows (excluding expected future credit losses that have not been incurred) discounted at the financial asset’s original effective interest rate, i.e., the effective interest rate computed at initial recognition. The carrying amount of the financial asset shall be reduced either directly or through the use of an allowance account. HTM financial assets and loans and receivables, together with the associated allowance accounts are written off when there is no realistic prospect of future recovery and all the collaterals have been realized. The amount of the loss shall be recognized in the consolidated statements of income.

812018 annual report
- 16 -
*SGVFS034462*
The Group first assesses whether objective evidence of impairment exists individually for financial assets that are individually significant and individually or collectively for financial assets that are not individually significant. Objective evidence includes observable data that comes to the attention of the Group about loss events such as but not limited to significant financial difficulty of the counterparty, a breach of contract, such as a default or delinquency in interest or principal payments, probability that the borrower will enter bankruptcy or other financial re-organization. If it is determined that no objective evidence of impairment exists for an individually assessed financial asset, whether significant or not, the financial asset is included in a group of financial assets with similar credit risk characteristics such as customer type, payment history, past due status and term, and that group of financial assets is collectively assessed for impairment. Those characteristics are relevant to the estimation of future cash flows for groups of such assets by being indicative of the debtor’s ability to pay all amounts due according to the contractual terms of the assets being evaluated. Financial assets that are individually assessed for impairment and for which an impairment loss is or continues to be recognized are not included in a collective assessment of impairment.
If, in a subsequent period, the amount of the impairment loss decreases and the decrease can be related objectively to an event occurring after the impairment was recognized, the previously recognized impairment loss is reversed. Any subsequent reversal of an impairment loss is recognized in the consolidated statements of income to the extent that the carrying value of the financial asset does not exceed its amortized cost at the reversal date. The Group performs a regular review of the age and status of these accounts, designed to identify accounts with objective evidence of impairment and provide the appropriate allowance for impairment loss. The review is accomplished using a combination of specific and collective assessment approaches, with the impairment loss being determined for each risk grouping identified by the Group.
2.12.2. AFS Financial Assets
If an AFS financial asset is impaired, an amount comprising the difference between its cost (net of any principal payment and amortization) and its current fair value, less any impairment loss previously recognized in the consolidated statements of income, is transferred from OCI to the consolidated statements of income. In the case of debt instruments classified as AFS financial assets, impairment is assessed based on the same criteria as financial assets carried at amortized cost. Future interest income is based on the reduced carrying amount and is accrued based on the rate of interest used to discount future cash flows for the purpose of measuring impairment loss. Such accrual is recorded as part of “Investment income” in the consolidated statements of income. If, in subsequent year, the fair value of a debt instrument increases and the increase can be objectively related to an event occurring after the impairment loss is recognized in the consolidated statements of income, the impairment loss is reversed through the consolidated statements of income. In case of equity securities classified as AFS financial assets, objective evidence would include a significant or prolonged decline in the fair value of the financial assets below its cost or where other objective evidence of impairment exists. Where there is evidence of impairment, the cumulative loss, measured as the difference between the acquisition cost and the current fair value, less any impairment loss on that financial asset previously recognized in the consolidated statements of income, is removed from OCI and recognized
82 Reimagining Today Building the FuTure
- 17 -
*SGVFS034462*
in the consolidated statements of income. Impairment losses on equity securities are not reversed through the consolidated statements of income. Increases in fair value after impairment and reversals of impairment losses on equity instruments are recognized directly in OCI.
2.12.3. Financial Assets Carried at Cost
If there is objective evidence that an impairment loss on an unquoted equity instrument that is not carried at fair value because its fair value cannot be reliably measured, or on a derivative asset that is linked to and must be settled by delivery of such an unquoted equity instrument has been incurred, the amount of the loss is measured as the difference between the financial asset’s carrying amount and the present value of estimated future cash flows discounted at the current market rate of return for a similar financial asset.
2.12. Investments in Associates The investments in associates are accounted for under the equity method. An associate is an entity in which the Group has significant influence.
The reporting dates of the associates and the Group are identical and the associates’ accounting policies conform to those used by the Group for like transactions and events in similar circumstances. The Group adjusts the equity and profit or loss of the associates, as applicable, for any significant difference in accounting policies for like transaction and similar circumstances except for the accounting for financial instruments starting 2018. Beginning January 1, 2018, the Group applies the temporary exemption from PFRS 9 but the associates apply PFRS 9 as permitted under the Amendments to PFRS 4 (Note 7).
The Group’s percentages of ownership in the shares of stock of associates as of December 31 are as follows:
Percentage of Ownership 2018 2017 PPI Prime Ventures, Inc. (PPVI) 30.00% 30.00% Mapfre Insular Insurance Corporation (MIIC) 25.00% 25.00% Union Bank of the Philippines (UBP) 16.29% 16.21%
Under the equity method, the investments in associates are carried in the consolidated statements of financial position at cost plus post-acquisition changes in the Group’s share of net assets of the associates adjusted for the financial impact of significant differences in accounting policies for like transactions and similar circumstances. The Group determines whether it is necessary to recognize any impairment loss in respect to the Group’s net investment in the associate. The consolidated statements of income reflect the share of the results of operations of the associate. Where there has been a change recognized directly in the equity of the associate, the Group recognizes its share on the said change and discloses this, when applicable, in the consolidated statements of changes in members’ equity. Profits or losses resulting from transactions between the Group and the associates are eliminated to the extent of the Group’s interest in the associate. The statement of income reflects the Parent Company’s share of the results of operations of the subsidiary, associate or joint venture. Any change in OCI of those investees is presented as part of the Parent Company’s OCI. In addition, when there has been a change recognized directly in the equity of the subsidiary, associate or joint venture, the Parent Company recognizes its share of any changes, when applicable, in the statement of changes in equity. Unrealized gains and losses resulting from transactions between the Parent Company and the subsidiary, associate or joint venture are eliminated to the extent of the interest in the subsidiary, associate or joint venture.

832018 annual report
- 18 -
*SGVFS034462*
The aggregate of the Parent Company’s share of profit or loss of subsidiaries, associates and a joint venture is shown on the face of the statement of income outside operating profit and represents share in the profit or loss after tax.
Reduction in investment in an associate deemed as disposal is accounted for using the entity concept method. Under the entity concept method, the Group should regard the deemed disposal of investment in an associate as an equity transaction. Gain or loss from the deemed disposal of investment in an associate is recognized as a separate component in the members’ equity section of the consolidated statements of financial position (Note 7).
2.13. Investment Properties Investment properties consist of land, buildings, and improvements (or portion of them) owned by the Group that are leased to others or held for capital appreciation or both. Investment properties are stated at cost, including transaction costs, less accumulated depreciation and amortization and any impairment in value. Depreciation of building and improvements is computed on a straight-line method over the estimated useful life of the properties of 40 years and 10 years, respectively. Investment properties are derecognized when they have been disposed, permanently withdrawn from use, or when no future economic benefit is expected from their disposal. Any gain or loss on the disposal of an investment property is recognized in the consolidated statements of income in the year of disposal. The investment properties’ use, estimated useful life, and method of depreciation and amortization are reviewed on a regular basis and transferred to other property accounts, if appropriate, upon determination of change in use. Transfers are made to investment property when, and only when, there is a change in use, evidenced by the end of owner-occupation or commencement of an operating lease to another party. Transfers are made from investment property when, and only when, there is a change in use, evidenced by commencement of owner-occupation or commencement of development with a view to sale. For a transfer from investment property to property and equipment and transfer of property and equipment to investment property, the Group accounts for such property in accordance with the policy stated under investment property and property and equipment, respectively, up to the date of change in use. Where a single property is partly held for use in the supply of services and partly for capital appreciation or rentals, the Group accounts for these portions separately if these portions could be separately sold or leased out under a finance lease. If these portions could not be sold separately, the property is considered by management as investment property only if an insignificant portion is held for use in the supply of services.
2.14. Property and Equipment
Property and equipment, including owner-occupied properties, except for land, are stated at cost, net of accumulated depreciation and amortization and any impairment in value. Land is stated at cost less any impairment in value. The initial cost of property and equipment consists of its purchase price and any directly attributable costs of bringing the asset to its working condition and location for its intended use.

84 Reimagining Today Building the FuTure
- 19 -
*SGVFS034462*
Expenditures incurred after the property and equipment have been put into operation, such as repairs and maintenance and overhaul costs, are normally charged to consolidated statements of income in the period in which the costs are incurred. In situations where it can be clearly demonstrated that the expenditures have resulted in an increase in the future economic benefits expected to be obtained from the use of an item of property and equipment beyond its originally assessed standard of performance, the expenditures are capitalized as an additional cost of the property and equipment. Depreciation and amortization of property and equipment commence, once the property and equipment are available for use and are computed using the straight-line method over the estimated useful lives (EUL) of the assets regardless of utilization.
The EUL of property and equipment of the Group follows:
Years Buildings 40 Building equipment 25 Furniture, fixtures, and equipment 3-10 Electronic and data processing equipment 2-5 Transportation equipment 4-5
Leasehold improvements are amortized over the term of the lease or the EUL of five years, whichever is shorter. Depreciation of an item of property and equipment begins when the asset becomes available for use, i.e., when it is in the location and condition necessary for it to be capable of operating in the manner intended by management. The assets’ residual values, estimated useful lives, and depreciation and amortization method are reviewed and adjusted, if appropriate, at each financial year-end. An item of property and equipment is derecognized upon disposal or when no further future economic benefits are expected from its use or disposal. Any gain or loss arising from its derecognition, calculated as the difference between the net disposal proceeds and the carrying amount of the property and equipment, is included in the consolidated statements of income in the year the property and equipment is derecognized.
2.15. Computer Software Computer software, included under “Other assets” in the consolidated statements of financial position, is carried at cost less accumulated amortization and impairment loss, if any. Costs incurred to acquire computer software (not an integral part of its related hardware) and bring it to its intended use and costs directly associated with the development of identifiable computer software that generate expected future benefits to the Group are capitalized. All other costs of developing and maintaining computer software programs are recognized as expenses as incurred. These costs are amortized over the EUL of five years. Subsequently, computer software is measured at cost, less any accumulated amortization and any accumulated impairment loss. Periods and method of amortization for computer software are reviewed annually or earlier when an indicator of impairment exists.
852018 annual report
- 20 -
*SGVFS034462*
2.16. Impairment of Nonfinancial Assets The Group’s nonfinancial assets consist of investments in associates, investment properties, property and equipment, and other assets. At each reporting date, the Group assesses whether there is any indication that its nonfinancial assets may be impaired. When an indicator of impairment exists or when an annual impairment testing for an asset is required, the Group makes a formal estimate of recoverable amount. Recoverable amount is the higher of an asset’s or cash-generating unit’s fair value less costs to sell and its value in use and is determined for an individual asset, unless the asset does not generate cash inflows that are largely independent of those from other assets or groups of assets, in which case the recoverable amount is assessed as part of the cash generating unit to which it belongs. Where the carrying amount of an asset (or cash generating unit) exceeds its recoverable amount, the asset (or cash generating unit) is considered impaired and is written down to its recoverable amount. In assessing value in use, the estimated future cash flows are discounted to their present value using a pre-tax discount rate that reflects current market assessments of the time value of money and the risks specific to the asset (or cash generating unit). An impairment loss is charged against operations in the year in which it arises, unless the asset is carried at a revalued amount, in which case the impairment loss is charged against the revaluation increment of the said asset. For nonfinancial assets excluding goodwill, an assessment is made at each reporting date as to whether there is any indication that previously recognized impairment losses may no longer exist or may have decreased. If such indication exists, the recoverable amount is estimated. A previously recognized impairment loss is reversed only if there has been a change in the estimates used to determine the asset’s recoverable amount since the last impairment loss was recognized. If that is the case, the carrying amount of the asset is increased to its recoverable amount. That increased amount cannot exceed the carrying amount that would have been determined, net of depreciation and amortization, had no impairment loss been recognized for the asset in prior years. Such reversal is recognized in profit and loss unless the asset is carried at a revalued amount, in which case the reversal is treated as a revaluation increase. After such reversal, the depreciation expense is adjusted in future years to allocate the asset’s revised carrying amount, less any residual value, on a systematic basis over its estimated remaining life.
2.17. Retained Earnings Retained earnings represent the cumulative balance of net income, dividend distributions, and other capital adjustments, including retrospective restatements. Retained earnings may be classified as unappropriated retained earnings and appropriated retained earnings. Unappropriated retained earnings represent that portion which is free and can be declared as dividends to members. Appropriated retained earnings represent that portion which is restricted and, therefore, not available for any dividend declaration.
2.18. Insurance Contracts
2.18.1. Product Classification
(a) Insurance and Investment Contracts
Insurance contracts are those contracts where the Group has accepted significant insurance risk from another party (the policyholders) by agreeing to compensate the policyholders if a specified uncertain future event (the insured event) adversely affects the policyholders. As a general guideline, the Group determines whether it has significant insurance risk by

86 Reimagining Today Building the FuTure
- 21 -
*SGVFS034462*
comparing benefits payable on occurrence of insured event with benefits payable on non-occurrence of insured event at inception. Insurance contracts can also transfer financial risk. Investment contracts are those contracts that transfer significant financial risk. Financial risk is the risk of a possible future change in one or more of a specified interest rate, security price, commodity price, foreign exchange rate, index or price or rates, a credit rating or credit index, or other variable. Once a contract has been classified as an insurance contract, it remains an insurance contract for the remainder of its lifetime, even if the insurance risk reduces significantly during this period, unless all rights and obligations have been extinguished or have expired. Investment contracts can, however, be reclassified as insurance contracts after inception if insurance risk becomes significant. Insurance and investment contracts are further classified as being either with or without discretionary participation features (DPF). DPF is a contractual right to receive, as a supplement to guaranteed benefits, additional benefits that are:
likely to be a significant portion of the total contractual benefits; whose amount or timing is contractually at the discretion of the issuer; and contractually based on the: (a) performance of a specified pool of contracts or a
specified type of contract; (b) realized and/or unrealized investment returns on a specified pool of assets held by the issuer; or (c) profit or loss of the Company, fund or other entity that issues the contract.
(b) Variable Unit-Linked (VUL) Insurance Contracts The Group issues VUL insurance contracts. In addition to providing life insurance coverage, a VUL insurance contract links payments to units of an investment fund set up by the Group with the consideration received from the policyholders. Premiums received from the issuance of VUL insurance contracts are recognized as premium revenue. As allowed by PFRS 4, Insurance Contracts, the Group chose not to unbundle the investment fund of its VUL insurance contracts. The liability for the investment portion of VUL insurance contracts is increased by additional deposits and changes in unit prices and is decreased by policy administration fees, fund charges, mortality and surrender charges, and any withdrawals. As of the reporting date, this liability is computed on the basis of the number of units allocated to the policyholders multiplied by the unit price of the underlying investment funds.
The fund assets and liabilities are separately administered by, under Separate Funds by the Parent Company’s trustee, a third party multinational bank accredited by the Bangko Sentral ng Pilipinas (BSP). The fund assets are designated as financial assets at FVPL and are valued on a basis consistent with the measurement basis in the consolidated statements of financial position. The fund liabilities are included in “Members’ deposits and other funds on deposit” under “Other insurance liabilities” (Note 13).
(c) Options and Guarantees Options and guarantees within insurance contracts are treated as derivative financial instruments which are clearly and closely related to the host contract and are, therefore, not accounted for separately.

872018 annual report
- 22 -
*SGVFS034462*
2.18.2. Recognition and Measurement
(a) Premiums
Premiums are recognized as revenue when they become due from the policyholders which, for single premium business, is the date from which the policy is effective. Due premiums which remain unpaid within the statutory defined limit are recognized as part of assets.
(b) Reinsurance Assets
The Group cedes insurance risk in the normal course of business. Reinsurance assets represent balances due from reinsurance companies. Ceded reinsurance arrangements do not relieve the Group from its obligations to policyholders. Recoverable amounts are estimated in a manner consistent with the outstanding claims provision and are in accordance with the reinsurance contract. The Group also assumes reinsurance risk in the normal course of business. Premiums and claims on assumed reinsurance are recognized in the consolidated statements of income in the same manner as they would be if the reinsurance were considered direct business, taking into account the product classification of the reinsured business. Reinsurance liabilities represent balances due to reinsurance companies. Amounts payable are estimated in a manner consistent with the associated reinsurance contract. Claims receivable from reinsurers on businesses ceded are offset against premiums payable to the reinsurers which is customary in the industry. An impairment review is performed on all due premiums and reinsurance assets whenever events or circumstances indicate that impairment loss occurs. Due premiums and reinsurance assets are impaired only if there is objective evidence that the Group may not receive all amounts due to it under the terms of the contract and that this can be measured reliably. If such evidence exists, impairment loss is recognized in the consolidated statements of income.
(c) Legal Policy Reserves
For traditional policies with coverages beyond one year, the liability is calculated based on the Gross Premium Valuation (“GPV”) method and is the sum of the present values of future benefits (including death, surrender, maturity, survivorship, dividends) and expenses (commissions, policy taxes, operational expenses), less the present value of future gross premiums arising from the policy discounted at the appropriate risk-free discount rate for policies with coverages beyond one year. These expected future cash flows are determined using best estimate assumptions with due regard to significant recent experience and margin for adverse deviation from the expected experience mandated by recent regulations. The GPV methodology, projecting all future cash flows that go with a policy and with margins for adverse deviation is deemed to result to acceptable sufficient levels of reserves per regulations. Thus, the GPV methodology is deemed to satisfy provisions of determining reserves sufficiency level under PFRS 4. For policies with coverages one year or less and for the risk portion of variable unit-linked policies, unearned premium reserves method is used.

88 Reimagining Today Building the FuTure
- 23 -
*SGVFS034462*
(d) Benefits and Claims Life insurance claims reflect the cost of all claims arising during the year. Death claims and surrenders are recorded on the basis of notifications received. Maturities and annuity payments are recorded when due.
(e) Incurred But Not Reported (IBNR) Claims
IBNR claims are based on the estimated ultimate cost of unreported claims incurred but not settled at the reporting date, together with related claims handling costs. These costs pertain to estimates of the Group’s obligations to the policyholders where the Group has not yet received notification. Delays can be experienced in the notification and settlement of obligations; therefore, the ultimate cost of which cannot be known with certainty at the reporting date. The Group develops estimates for IBNR taking into considerations the Group's prior experience.
2.19. Revenue recognition
The Group is primarily engaged in the business of insurance, leasing, investing in financial instruments and fund management. Insurance contracts, leasing agreements and financial instruments are within the scope of PFRS 4, Insurance Contracts, PAS 17, Leases and PAS 39, Financial Instruments: Recognition and Measurement, respectively. Hence, they are outside the scope of PFRS 15, Revenue from Contracts with Customers. Fund management is within the scope of PFRS 15. The revenue recognition policy for premiums is discussed in Note 2.18. Revenue recognition criteria for revenues outside the scope of PFRS 15 follow: 2.19.1. Interest Income
Interest income is recognized in the statements of income as it accrues, taking into account the effective interest rate of the related asset or an applicable floating rate. Interest income includes the amortization of any discount or premium or other differences between the initial carrying amount of an interest-bearing instrument and its amount at maturity calculated on an effective interest basis. Interest income on policy loans is earned over the term of the loan, normally over one year. The unearned portion of the interest on policy loans deducted in advance is presented as a contra asset in “Policy loans” under “Loans receivables.”
Interest income on impaired mortgage loans and collateral and guaranteed loans is recognized as cash is received
2.19.2. Dividend Income Dividend income is recognized when the right to receive the payment is established.
2.19.3. Rental Income
Rental income from investment properties is recognized on a straight-line basis over the lease term.
2.19.4. Trading gains and losses
Trading gains and losses arise from the buying and selling, and changes in fair value of financial assets and financial liabilities categorized upon initial recognition as at FVPL investments and disposal of AFS financial assets.

892018 annual report
- 24 -
*SGVFS034462*
For the accounting policy on foreign exchange gain, refer to Note 2.23. For revenues within the scope of PFRS 15 and PAS 18, the following specific recognition criteria must be met before revenue is recognized: Policy applicable beginning January 1, 2018 To account for the revenues arising from contracts with customers, the Group applies the following five step model.
a. Identify the contract(s) with a customer b. Identify the performance obligations in the contract c. Determine the transaction price d. Allocate the transaction price to the performance obligations in the contract e. Recognize revenue when (or as) the entity satisfies a performance obligation.
Revenue from contracts with customers is recognized when control of the goods or services are transferred to the customer at an amount that reflects the consideration to which the Group expects to be entitled in exchange for those goods or services. The Group concluded that it is acting as principal in all of its arrangements, because it typically controls the goods or services before transferring them to the customer. Management fees are earned for the provision of asset management services. These services represent a single performance obligation comprising of a series of distinct services which are substantially the same, being provided continuously over the contract period. Management fees are determined based on a fixed percentage of the net asset value of the funds under management at the end of each day. The Group recognizes management fees over time, using an output method to measure progress towards complete satisfaction of the service, because the customer simultaneously receives and consumes the benefits provided by the Group. Amendment fees, cancellation fees and handling fees are recognized as revenue at a point in time, generally upon billing wherein the performance obligation is substantially satisfied. Policy applicable prior to January 1, 2018 Revenue is recognized to the extent that it is probable that the economic benefits associated with the transaction will flow to the Group and the revenue can be reliably measured. Revenue is measured at the fair value of the consideration received, excluding discounts, returns, rebates and value-added taxes. or management fees charged for fund management and administration, the fees are recognized as revenue in the period in which the related services are rendered
2.20. Operating Expenses Operating expenses are charged to operations when incurred.
2.21. Retirement Benefit Costs The net retirement benefit liability or asset is the aggregate of the present value of the defined benefit obligation at the end of the reporting period reduced by the fair value of plan assets, adjusted for any effect of limiting a net defined benefit asset to the asset ceiling. The asset ceiling is the present value of any economic benefits available in the form of refunds from the plan or reductions in future contributions to the plan.
The cost of providing benefits under the defined benefit plans is actuarially determined using the projected unit credit method.

90 Reimagining Today Building the FuTure
- 25 -
*SGVFS034462*
Retirement benefit costs comprise the following: Service cost; and Net interest on the net defined benefit liability or asset.
Service costs (which include current service costs, past service costs, and gains or losses on non-routine settlements) are recognized as expense in the consolidated statements of income. Past service costs are recognized when plan amendment or curtailment occurs. Net interest on the net retirement benefit liability or asset is the change during the period in the net benefit liability or asset that arises from the passage of time which is determined by applying the discount rate based on risk free rates to the net defined pension liability or asset. Net interest on the net retirement benefit liability or asset is recognized as expense or income in the consolidated statements of income. Re-measurements comprising actuarial gains and losses, return on plan assets, and any change in the effect of the asset ceiling (excluding net interest on defined benefit liability) are recognized immediately in other comprehensive income in the period in which they arise. Re-measurements are not reclassified to profit or loss in subsequent periods.
2.22. Operating Leases Leases where the lessor retains substantially all the risks and benefits of ownership of the asset are classified as operating leases. Operating lease payments are recognized as an expense in the consolidated statements of income on a straight-line basis over the lease term. Rental income from investment properties is recognized on a straight-line basis.
2.23. Foreign Currency-Denominated Transactions and Translations Transactions in foreign currency are initially recorded at the exchange rate at the date of transaction. Foreign currency denominated monetary assets and liabilities are translated using the closing exchange rate at the reporting date. Exchange differences arising from translation of foreign currency monetary items at rates different from those at which they were originally recorded were recognized in the consolidated statements of income. Foreign exchange gains are presented in the consolidated statements of income under “Operating revenue,” and foreign exchange losses are presented as “Other losses” under “Operating expenses.” For income tax reporting purposes, foreign exchange gains or losses are treated as taxable income or deductible expenses, in the period these are realized.
2.24. Income tax 2.24.1. Final Tax
Final tax on interest and dividend income is presented in the consolidated statements of income at the time interest is earned.
2.24.2. Current Income Tax Current income tax assets and liabilities for the current and prior periods are measured at the amount expected to be recovered from or paid to the taxation authorities. The tax rates and tax laws used to compute the amount are those that have been enacted or substantively enacted at the reporting date.
912018 annual report
- 26 -
*SGVFS034462*
2.24.3. Deferred Income Tax Deferred income tax is provided, using balance sheet liability method, on all temporary differences at the reporting date between the tax bases of deferred income tax assets and liabilities and their carrying amounts for financial reporting purposes.
Deferred income tax liabilities are recognized for all taxable temporary differences, including asset revaluations. Deferred income tax assets are recognized for all deductible temporary differences, to the extent that it is probable that sufficient future taxable profits will be available against which the deductible temporary differences, net operating loss carry-over (NOLCO), and excess of minimum corporate income tax (MCIT) over regular corporate income tax (RCIT) can be utilized. The carrying amount of deferred income tax assets is reviewed at each reporting date and reduced to the extent that it is no longer probable that sufficient future taxable profits will be available to allow all or part of the deferred income tax assets to be utilized. Deferred income tax assets and liabilities are measured at the tax rate that is expected to apply to the period when the asset is realized or the liability is settled, based on tax rates and tax laws that have been enacted or substantively enacted at the reporting date. Unrecognized deferred income tax assets are reassessed at each reporting date and are recognized to the extent that it has become probable that sufficient future taxable profits will allow all or part of the deferred income tax assets to be recovered. Deferred income tax assets and liabilities are offset if a legally enforceable right exists to offset current income tax assets against current income tax liabilities and the deferred income taxes relate to the same taxable entity and the same taxation authority.
2.25. Provisions Provisions are recognized when: (a) the Group has a present obligation (legal or constructive) as a result of a past event; (b) it is probable that an outflow of resources embodying economic benefits will be required to settle the obligation; and (c) a reliable estimate can be made of the amount of the obligation. Provisions are reviewed at each reporting date and adjusted to reflect the current best estimate. If the effect of the time value of money is material, provisions are determined by discounting the expected future cash flows at a pre-tax rate that reflects current market assessments of the time value of money and, where appropriate, the risks specific to the liability. Where discounting is used, the increase in the provision due to the passage of time is recognized as interest expense. When the Group expects a provision or loss to be reimbursed, the reimbursement is recognized as a separate asset only when the reimbursement is virtually certain and its amount is estimable. The expense relating to any provision is presented in the consolidated statements of income, net of any reimbursement.
2.26. Contingencies Contingent liabilities are not recognized in the consolidated financial statements but are disclosed unless the possibility of an outflow of resources embodying economic benefits is remote. Contingent assets are not recognized in the consolidated financial statements but disclosed when an inflow of economic benefit is probable. Contingent assets are assessed continually to ensure that developments are appropriately reflected in the consolidated financial statements. If it has become virtually certain that an inflow of economic benefits will arise, the asset and the related income are recognized in the consolidated financial statements.

92 Reimagining Today Building the FuTure
- 27 -
*SGVFS034462*
2.27. Events After the Reporting date Post year-end events that provide additional information about the Group’s position at the reporting date (adjusting events) are reflected in the consolidated financial statements. Post year-end events that are non-adjusting events are disclosed in the notes to the consolidated financial statements when material.
3. Management’s Use of Significant Accounting Judgments and Estimates
The Group uses accounting judgments and estimates that affect the reported amounts of assets and liabilities at the reporting date, as well as, the reported income and expenses for the year. Although the judgments and estimates are based on management’s best knowledge and judgment of current facts as at the reporting date, the actual outcome may differ from these estimates, possibly significantly. The effects of any change in estimates are reflected in the consolidated financial statements as they become reasonably determinable. Judgments and estimates are continually evaluated based on historical experience and other factors, including expectations of future events that are believed to be reasonable under the circumstances. 3.1. Judgments
In the process of applying the Group’s accounting policies, management has made the following judgments, apart from those involving estimations, which have the most significant effect on amounts recognized in the consolidated financial statements: 3.1.1. Product Classification
The Group has determined that all the products including the VUL insurance contracts it issues that link the payments on the contract to units of an internal investment fund have significant insurance risk and, therefore, meet the definition of an insurance contract and should be accounted for as such. The significance of insurance risk is dependent on both the probability of an insured event and the magnitude of its potential effect.
3.1.2. Determination of Existence of Significant Influence The Group’s equity investment in Union Bank of the Philippines (UBP) is classified as an associate as the Company has established that it has significant influence over UBP through its representation in the Board of Directors of UBP, the existence of a material transaction between the Company and UBP, and active participation of the representatives of the Company’s BOT in the working committees of UBP (Note 7).
3.1.3. Distinction Between Property and Equipment and Investment Property
The Group determines whether a property qualifies as property and equipment or investment property. In making its judgment, the Group considers whether the property is held for use in the supply of services, or is held for capital appreciation, and to earn rentals, in which case the property shall be classified as property and equipment or investment property respectively, as the case may be. In 2018, the Company retroactively changed the classification of dual-use properties. Details on the nature and impact of the change are discussed in Note 2.6. In 2018, there was a net reclassification of property and equipment to investment properties amounting to P=399,204,175. Meanwhile, in 2017, the total carrying amount of investment properties reclassified to property and equipment amounted to P=513,296,043 (Notes 8 and 9).

932018 annual report
- 28 -
*SGVFS034462*
3.1.4. Distinction Between Debt and Equity Instrument The contributions of the members of Home Credit are classified by the Group into either liability or equity. Members’ contributions classified as liability takes the legal form of equity but the substance of these financial instruments takes the form of a liability since Home Credit does not have an unconditional right to avoid delivering cash or another financial asset to the members. Members’ contributions classified as equity are financial instruments issued by Home Credit wherein the right to redeem for the preferred shares are at the option/discretion of Home Credit. Preferred shares classified as equity amounted to nil and P=154,561,745 as of December 31, 2018 and 2017, respectively (Note 28).
3.2. Estimates
The key assumptions concerning the future and other key sources of estimation uncertainty at the reporting date that have a significant risk of causing a material adjustment to the carrying amounts of assets and liabilities follow:
3.2.1. Impairment of AFS Equity Securities
The Group determines AFS equity securities as impaired when there has been a significant or prolonged decline in the fair value of the financial assets below its cost or where other objective evidence of impairment exists. The determination of what is significant or prolonged requires judgment. In making this judgement, the Company considers, among other factors, the normal volatility in share price. In addition, the Company also considers the financial health of the investee, industry and sector performance, changes in technology, and operational and financing cash flows. The carrying value of the Group’s AFS equity securities amounted to P=18,276,972,718 and P=22,407,425,551 as of December 31, 2018 and 2017, respectively (Note 6).
3.2.2. Adequacy of Legal Policy Reserves In determining legal policy reserves, best estimates are made as to the policy expense, expected number of deaths, illness, or injury, and also on the number of withdrawing or lapsing policies for each of the years in which the Group is exposed to risk. These estimates are based on expense, mortality and morbidity, and persistency assumptions based on the Group’s actual experience from its latest studies. The estimated number of deaths, illness, or injury and withdrawing or lapsing policies determine the value of possible future benefits to be paid out, which will be factored into ensuring sufficiency of reserves, which in return is monitored against current and future premiums. Inclusive in the amount of calculated legal policy reserves are the non-guarantee benefits or the policy dividends. Mortality and lapse assumptions are also factored in the computation of the value of these benefits.
The interest rate used to discount these future cash flows are based on the risk-free discount rate, which are obtained from the following sources: (i) For Philippine Peso policies: PHP BVAL Reference rates from Bloomberg and
PDST-R2 rates as of December 31, 2018 and 2017, respectively; (ii) For US Dollar policies: International Yield Curve (IYC) from Bloomberg These yield curve and risk-free discount rates are provided by the IC.
94 Reimagining Today Building the FuTure
- 29 -
*SGVFS034462*
Such recent new regulations also mandate provision for Margins for Adverse Deviations (MfAD) to be applied to the above assumptions. As prescribed by IC, the fixed MfAD are subject to a minimum of:
(i) Interest: +/- 10% of discount rate; (ii) Expense: 10% of best estimate expense; (iii) Other assumptions including but not limited to mortality, morbidity, lapse and
conversion: +/- 10% of best estimate assumptions. The sign (positive or negative) of MfAD for mortality, lapse and interest assumptions are tested by product at the time of valuation. The sign that give higher reserves for a product is used in calculation of the liability. The carrying value of legal policy reserves amounted to P=54,375,294,579 and P=62,373,012,796 as of December 31, 2018 and 2017, respectively (Note 11).
3.2.3. Estimation of IBNR claims Estimates have to be made for the expected ultimate cost of IBNR. The Group develops estimates for the IBNR claims using an actuarial process that is centrally controlled. The actuarial models consider the time from the date the insured event occurred to the time the claim was filed. Total IBNR claims included under “Claims pending settlement” within “Other insurance liabilities” in the statements of financial position amounted to P=152,900,779 and P=91,725,473 as of December 31, 2018 and 2017, respectively (Note 13).
3.2.4. Estimation of Retirement Benefits Cost The cost of defined benefit plans, as well as, the present value of the retirement obligation are determined using actuarial valuations. The actuarial valuation involves making various assumptions. These include the determination of the discount rates, future salary increases, mortality rates, and future retirement increases. Due to the complexity of the valuation, the underlying assumptions and its long-term nature, defined benefit obligations are highly sensitive to changes in these assumptions. All assumptions are reviewed at each reporting date.
3.2.5. Realizability of Deferred Income Tax Assets
The carrying amount of deferred income tax assets recognized is reviewed at each reporting date and reduced to the extent that it is no longer probable that sufficient future taxable profits will be available to allow all or part of the deferred income tax assets to be utilized. However, if there is no assurance that the Group will generate sufficient future taxable profits to allow all or part of deferred income tax assets to be utilized, the assets are not recognized in the books.
The amount of NOLCO and excess of MCIT over RCIT for which no deferred income tax assets were recognized amounted to P=4,001,803,323 and P=2,260,749,015 as of December 31, 2018 and 2017, respectively (Note 25).
3.2.6. Contingencies
The Group is currently involved in various legal proceedings, including claims for punitive damages, in the normal course of its business. The Group, however, does not believe that such litigations, which are common in the insurance industry in general, will have a material effect on its operating results and financial condition.

952018 annual report
- 30 -
*SGVFS034462*
The Group is currently involved in various legal proceedings. The estimate of the probable costs for the resolution of these claims has been developed in consultation with the legal counsels and based upon an analysis of potential results. The Group currently does not believe these proceedings will have a material adverse effect on the Group’s financial position.
4. Cash and Cash Equivalents
2018 2017 Cash on hand P=713,350 P=1,189,388 Cash in banks 660,348,511 626,547,445 Cash equivalents 2,808,513,385 4,338,107,248 P=3,469,575,246 P=4,965,844,081
Cash in banks earn interest at the prevailing bank deposit rates. Cash equivalents are made for varying periods of between one day and three months depending on the immediate cash requirements of the Group and earn interest at the prevailing short-term deposit rates. Cash equivalents earn interest at rates ranging from 0.18% to 6.90% and from 0.18% to 4.13% in 2018 and 2017, respectively.
5. Insurance Receivables
2018 2017 Due premiums P=183,280,942 P=198,500,629 Reinsurance assets 4,667,364 3,810,102 P=187,948,306 P=202,310,731
Due premiums are premiums earned which remain unpaid within the Company’s grace period and the statutory defined limit.
Reinsurance assets arising from ceded reinsurance arrangements pertain to amounts recoverable from the reinsurers in respect of claims already paid by the Company which are due and demandable
6. Financial Assets
The Group’s financial assets, excluding cash and cash equivalents, are summarized by measurement categories below:
2018 2017 Financial assets at FVPL P=33,025,095,388 P=32,032,608,958 AFS financial assets 36,622,111,329 40,174,640,331 HTM financial assets 22,142,025,369 22,345,223,102 Loans and receivables 15,463,432,994 15,845,510,163 P=107,252,665,080 P=110,397,982,554

96 Reimagining Today Building the FuTure
- 31 -
*SGVFS034462*
The financial assets included in each of the categories above are detailed below:
6.1. Financial Assets at FVPL
2018 2017 Equity securities - quoted P=3,689,220,800 P=3,995,369,950 Under separate fund: Traditional VULs: Cash and cash equivalents 2,380,763,997 2,836,742,122 Equity securities - quoted 19,607,236,248 18,393,177,822 Debt securities - quoted Government: Local currency 1,795,658,346 1,821,846,029 Foreign currency 2,487,631,912 2,517,351,149 Corporate: Local currency 126,036,580 145,353,726 Foreign currency 137,166,393 135,357,725 Investment in Unit Investment Trust Fund (UITF) 800,437,109 398,561,064 Other receivables 259,221,110 136,793,924 Other payables (256,928,363) (297,311,366) Structured VULs: Local currency 698,526,102 702,944,015 Foreign currency 1,300,125,154 1,246,422,798 29,335,874,588 28,037,239,008 P=33,025,095,388 P=32,032,608,958
Quoted equity securities represent preferred shares listed in the stock exchange. Fair value gain (loss) on these equity securities amounted to (P=306,149,150) and P=582,640 in 2018 and 2017, respectively. Fair value gain (loss) from FVPL financial assets presented in the separate financial statements of VUL funds (i.e., inclusive of fair value gains and losses attributable to the Group and the policy holders) and included in the carrying amount FPVL financial assets amounted to (P=2,713,488,166) and P=2,880,392,131 as of December 31, 2018 and 2017, respectively. These financial assets are designated as FVPL in accordance with the investment strategy and valuation provisions of the VUL insurance contracts. Likewise, this is consistent with the valuation basis of the reserve for policies held by the policyholders. The financial asset at FVPL under separate fund is comprised of:
Traditional VULs Cash and cash equivalents Cash in banks earns interest at the prevailing bank deposit rates. Short-term deposits are made for varying periods not exceeding three months depending on the immediate cash requirements of the funds, and earn interest at the prevailing short-term deposit rates. Equity securities Equity securities under the separate fund are includes quoted equity securities traded in the Philippine Stock Exchange.
972018 annual report
- 32 -
*SGVFS034462*
Government debt securities In 2018 and 2017, interest rate of government debt securities under FVPL ranged from 3.25% to 10.63% and from 2.13% to 10.63% for both peso and dollar bonds, respectively. Corporate debt securities Corporate debt securities include bonds issued by reputable counterparties. Interest rate for peso corporate debt securities under FVPL was at 6.10% in 2018 and ranged from 5.05% to 6.10% in 2017. Interest rate for dollar bonds ranged from 4.25% to 7.25% for both in 2018 and 2017. Investment in Unit Investment Trust Fund Unit investment trust fund (UITF) is an open-ended pooled trust fund denominated in peso, operated and administered by a trust entity and made available by participation. Other receivables Other receivables are comprised of accrued interest income from government and corporate debt securities and accrued dividend income from equity securities. Other payables Other payables are comprised of custodial fee, fund administration fee, professional fees, and taxes that remain unpaid as of year-end. Structured VULs Structured VULs are senior notes issued by Global Issuers and constitute direct, unconditional, unsubordinated, and unsecured obligation of the Issuer.
6.2. AFS Financial Assets
2018 2017 Equity securities: Quoted P=18,257,015,647 P=22,388,131,569 Unquoted 19,957,071 19,293,982 18,276,972,718 22,407,425,551 Debt securities: Quoted: Government: Local currency 10,483,103,111 10,625,852,326 Foreign currency 1,077,308,475 961,368,389 Corporate: Local currency 6,498,631,568 5,893,252,827 Foreign currency 286,095,457 286,741,238 18,345,138,611 17,767,214,780 P=36,622,111,329 P=40,174,640,331
AFS financial assets are comprised of:
Equity securities Equity securities include quoted equity securities traded in the Philippine Stock Exchange. These likewise include quoted and unquoted club shares and other non-traded securities.
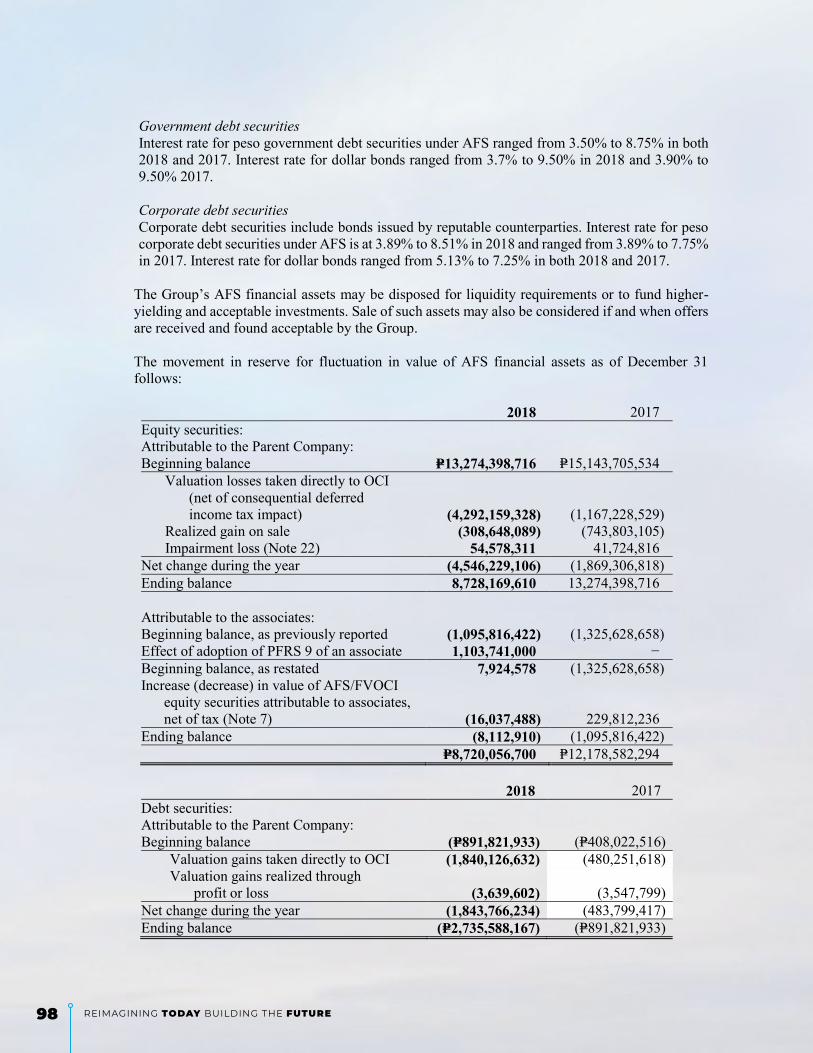
98 Reimagining Today Building the FuTure
- 33 -
*SGVFS034462*
Government debt securities Interest rate for peso government debt securities under AFS ranged from 3.50% to 8.75% in both 2018 and 2017. Interest rate for dollar bonds ranged from 3.7% to 9.50% in 2018 and 3.90% to 9.50% 2017.
Corporate debt securities Corporate debt securities include bonds issued by reputable counterparties. Interest rate for peso corporate debt securities under AFS is at 3.89% to 8.51% in 2018 and ranged from 3.89% to 7.75% in 2017. Interest rate for dollar bonds ranged from 5.13% to 7.25% in both 2018 and 2017.
The Group’s AFS financial assets may be disposed for liquidity requirements or to fund higher-yielding and acceptable investments. Sale of such assets may also be considered if and when offers are received and found acceptable by the Group. The movement in reserve for fluctuation in value of AFS financial assets as of December 31 follows: 2018 2017 Equity securities: Attributable to the Parent Company: Beginning balance P=13,274,398,716 P=15,143,705,534
Valuation losses taken directly to OCI (net of consequential deferred
income tax impact) (4,292,159,328) (1,167,228,529) Realized gain on sale (308,648,089) (743,803,105) Impairment loss (Note 22) 54,578,311 41,724,816
Net change during the year (4,546,229,106) (1,869,306,818) Ending balance 8,728,169,610 13,274,398,716 Attributable to the associates: Beginning balance, as previously reported (1,095,816,422) (1,325,628,658) Effect of adoption of PFRS 9 of an associate 1,103,741,000 − Beginning balance, as restated 7,924,578 (1,325,628,658) Increase (decrease) in value of AFS/FVOCI equity securities attributable to associates, net of tax (Note 7) (16,037,488) 229,812,236 Ending balance (8,112,910) (1,095,816,422) P=8,720,056,700 P=12,178,582,294
2018 2017 Debt securities: Attributable to the Parent Company: Beginning balance (P=891,821,933) (P=408,022,516)
Valuation gains taken directly to OCI (1,840,126,632) (480,251,618) Valuation gains realized through
profit or loss (3,639,602) (3,547,799) Net change during the year (1,843,766,234) (483,799,417) Ending balance (P=2,735,588,167) (P=891,821,933)

992018 annual report
- 34 -
*SGVFS034462*
6.3. HTM Financial Assets
The details of HTM financial assets as of December 31 follow:
2018 2017 Government:
Local currency P=14,171,131,381 P=14,389,383,053 Foreign currency 16,896,008 16,097,714
Corporate: Local currency 7,692,000,000 7,692,000,000 Foreign currency 261,997,980 247,742,335
P=22,142,025,369 P=22,345,223,102
As of December 31, 2018 and 2017, government securities under HTM financial assets totaling P=137,500,000 are deposited with the IC in accordance with the provision of the Insurance Code as security for the benefit of policyholders and creditors of the Company.
Reclassification from AFS Financial Assets to HTM Financial Assets On September 15, 2008, the Parent Company reclassified AFS debt securities with amortized cost amounting to P=283,501,557 to HTM financial assets. At the date of reclassification, fair market value of the debt securities amounted to P=343,106,120 which became the new amortized cost of HTM financial assets as of reclassification date. The difference of fair value and amortized cost as of date of reclassification amounting to P=59,604,563 was taken directly to equity and is to be amortized until maturity. The Parent Company expects to recover interests from the debt securities at an effective interest of 10.41%.
In 2010, the Parent Company reclassified AFS debt securities amounting to P=12,506,398 to HTM financial assets due to change in management’s intention. The Parent Company expects to recover interests from the debt securities at an effective interest of 1.71% to 1.96%. There were no reclassifications made in 2018 and 2017. As of December 31, 2018 and 2017, the carrying values of the debt securities reclassified in 2010 and 2008 had the debt securities not been reclassified to HTM financial assets follow:
2018 2017 Beginning balance P=319,993,590 P=339,200,803 Fair value loss (23,238,310) (12,216,719) Amortization (7,571,528) (6,990,494) Ending balance P=289,183,752 P=319,993,590
The amortized cost of the debt securities which are now included under HTM financial assets follows:
2018 2017 Beginning balance P=295,387,717 P=302,378,211 Amortization (7,571,528) (6,990,494) Ending balance P=287,816,189 P=295,387,717
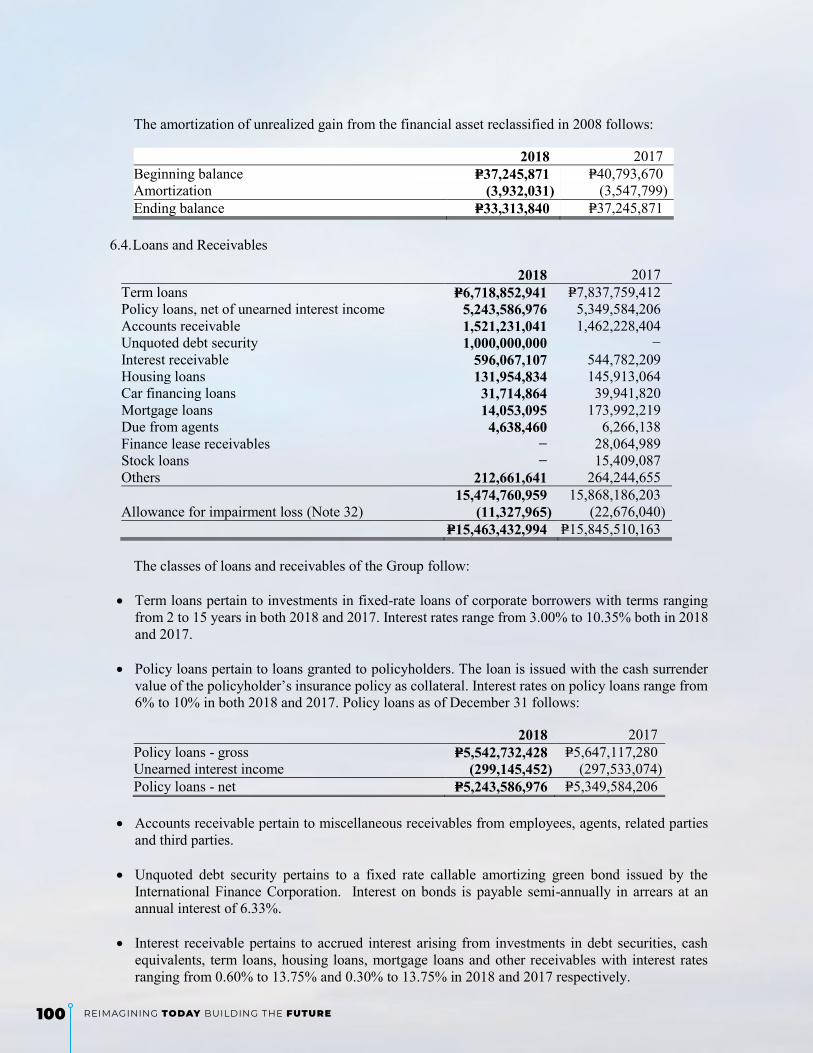
100 Reimagining Today Building the FuTure
- 35 -
*SGVFS034462*
The amortization of unrealized gain from the financial asset reclassified in 2008 follows:
2018 2017 Beginning balance P=37,245,871 P=40,793,670 Amortization (3,932,031) (3,547,799) Ending balance P=33,313,840 P=37,245,871
6.4. Loans and Receivables
The classes of loans and receivables of the Group follow:
Term loans pertain to investments in fixed-rate loans of corporate borrowers with terms ranging from 2 to 15 years in both 2018 and 2017. Interest rates range from 3.00% to 10.35% both in 2018 and 2017.
Policy loans pertain to loans granted to policyholders. The loan is issued with the cash surrender
value of the policyholder’s insurance policy as collateral. Interest rates on policy loans range from 6% to 10% in both 2018 and 2017. Policy loans as of December 31 follows: 2018 2017 Policy loans - gross P=5,542,732,428 P=5,647,117,280 Unearned interest income (299,145,452) (297,533,074)) Policy loans - net P=5,243,586,976 P=5,349,584,206
Accounts receivable pertain to miscellaneous receivables from employees, agents, related parties
and third parties.
Unquoted debt security pertains to a fixed rate callable amortizing green bond issued by the International Finance Corporation. Interest on bonds is payable semi-annually in arrears at an annual interest of 6.33%.
Interest receivable pertains to accrued interest arising from investments in debt securities, cash
equivalents, term loans, housing loans, mortgage loans and other receivables with interest rates ranging from 0.60% to 13.75% and 0.30% to 13.75% in 2018 and 2017 respectively.
2018 2017 Term loans P=6,718,852,941 P=7,837,759,412 Policy loans, net of unearned interest income 5,243,586,976 5,349,584,206 Accounts receivable 1,521,231,041 1,462,228,404 Unquoted debt security 1,000,000,000 − Interest receivable 596,067,107 544,782,209 Housing loans 131,954,834 145,913,064 Car financing loans 31,714,864 39,941,820 Mortgage loans 14,053,095 173,992,219 Due from agents 4,638,460 6,266,138 Finance lease receivables − 28,064,989 Stock loans − 15,409,087 Others 212,661,641 264,244,655 15,474,760,959 15,868,186,203 Allowance for impairment loss (Note 32) (11,327,965) (22,676,040) P=15,463,432,994 P=15,845,510,163

1012018 annual report
- 36 -
*SGVFS034462*
Housing loans pertain to long-term loans granted to employees at an annual interest of 8% payable semi-monthly with terms ranging from 5 to 20 years.
Car financing loans pertain to car loans granted to employees at an annual interest of 6% payable
semi-monthly and with terms ranging from 5 to 7 years. Mortgage loans pertain to housing loans granted to third parties and former employees with terms
ranging from 5 to 15 years. Interest rates on these loans range from 7.50% to 10.50% and 6.65% to 10.50% for 2018 and 2017 respectively.
Due from agents pertains to advances by agents, unremitted collections, and charges for
amendment/replacement of policies.
Day 1 loss was recognized on loans with off-market interest rates. The nominal amount of these loans as of December 31 follows:
2018 2017 Housing loans P=155,823,958 P=168,282,754 Less: unamortized deferred interest income 23,869,124 22,369,690 131,954,834 145,913,064 Car financing loans 38,813,713 46,996,800 Less: unamortized deferred interest income 7,098,849 7,054,980 31,714,864 39,941,820 P=163,669,698 P=185,854,884
The amortization of deferred interest income amounting to P=5,485,401 and P=5,359,512 in 2018 and 2017, respectively, is recognized as part of interest on loans and receivables included under “Investment income” in the statements of income (Note 17). The reconciliation of changes in allowance for impairment on loans and receivables follows:
2018
Accounts
receivable Mortgage
loans Finance
Leases Stock Loans Due from
agents Others Total Beginning balances P=14,625,647 P=936,328 P=99,701 P=1,998,474 P=2,783,226 P=2,232,664 P=22,676,040 Provision, net of reversal (341,086) 18,675 − − (97,571) 3,282,576 2,862,594 Write-off/recoveries (9,274,133) (869,495) (99,701) (1,998,474) (1,356,973) (611,893) (14,210,669) Ending balances P=5,010,428 P=85,508 P=− P=− P=1,328,682 P=4,903,347 P=11,327,965
2017
Accounts
receivable Mortgage
loans Finance Leases Stock Loans
Due from agents Others Total
Beginning balances P=14,539,353 P=412,517 P=352,614 P=2,838,909 P=4,352,635 P=1,350,487 P=23,846,515 Provision, net of reversal 590,285 523,811 – 1,225,565 4,836 882,177 3,226,674 Write-off/recoveries (503,991) – (252,913)) (2,066,000)) (1,574,245)) – (4,397,149)) Ending balances P=14,625,647 P=936,328 P=99,701 P=1,998,474 P=2,783,226 P=2,232,664 P=22,676,040
The allowance for impairment was determined by the Group using individual and collective impairment assessment.
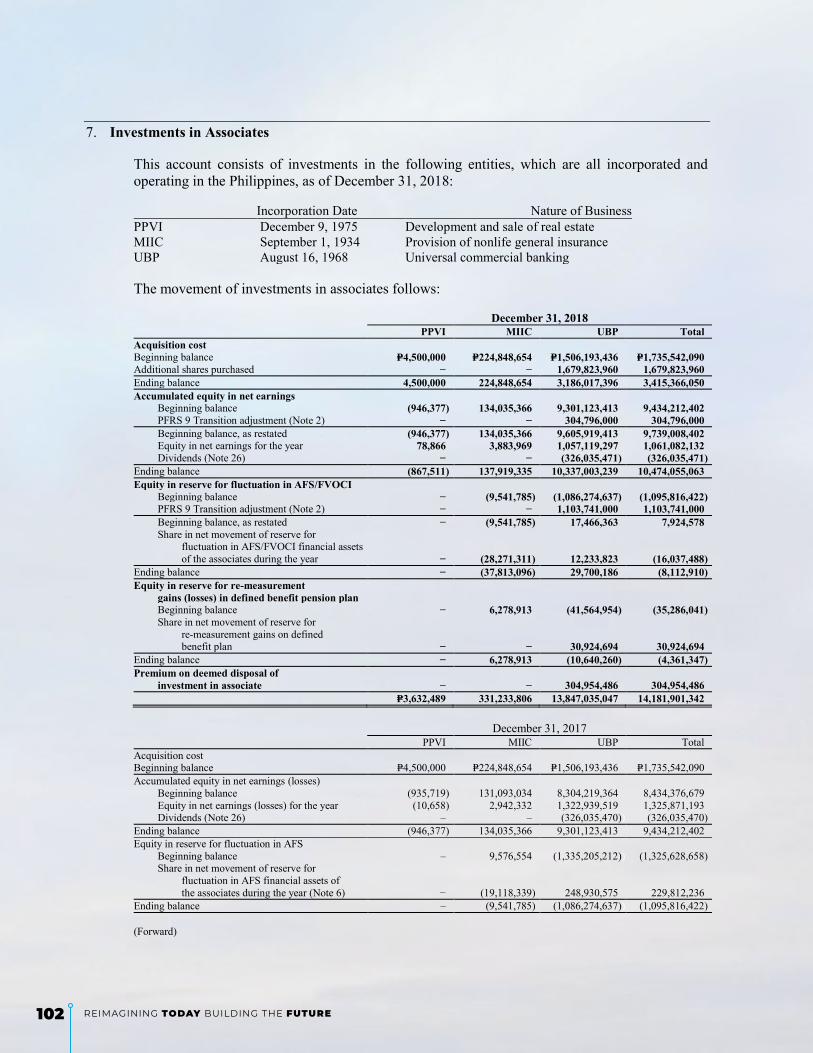
102 Reimagining Today Building the FuTure
- 37 -
*SGVFS034462*
7. Investments in Associates
This account consists of investments in the following entities, which are all incorporated and operating in the Philippines, as of December 31, 2018: Incorporation Date Nature of Business PPVI December 9, 1975 Development and sale of real estate MIIC September 1, 1934 Provision of nonlife general insurance UBP August 16, 1968 Universal commercial banking
The movement of investments in associates follows:
December 31, 2018 PPVI MIIC UBP Total Acquisition cost Beginning balance P=4,500,000 P=224,848,654 P=1,506,193,436 P=1,735,542,090 Additional shares purchased − − 1,679,823,960 1,679,823,960 Ending balance 4,500,000 224,848,654 3,186,017,396 3,415,366,050 Accumulated equity in net earnings Beginning balance (946,377) 134,035,366 9,301,123,413 9,434,212,402 PFRS 9 Transition adjustment (Note 2) − − 304,796,000 304,796,000 Beginning balance, as restated (946,377) 134,035,366 9,605,919,413 9,739,008,402 Equity in net earnings for the year 78,866 3,883,969 1,057,119,297 1,061,082,132 Dividends (Note 26) − − (326,035,471) (326,035,471) Ending balance (867,511) 137,919,335 10,337,003,239 10,474,055,063 Equity in reserve for fluctuation in AFS/FVOCI Beginning balance − (9,541,785) (1,086,274,637) (1,095,816,422) PFRS 9 Transition adjustment (Note 2) − − 1,103,741,000 1,103,741,000 Beginning balance, as restated − (9,541,785) 17,466,363 7,924,578 Share in net movement of reserve for
fluctuation in AFS/FVOCI financial assets of the associates during the year − (28,271,311) 12,233,823 (16,037,488) Ending balance − (37,813,096) 29,700,186 (8,112,910) Equity in reserve for re-measurement
gains (losses) in defined benefit pension plan Beginning balance − 6,278,913 (41,564,954) (35,286,041) Share in net movement of reserve for
re-measurement gains on defined benefit plan − − 30,924,694 30,924,694
Ending balance − 6,278,913 (10,640,260) (4,361,347) Premium on deemed disposal of
investment in associate − − 304,954,486 304,954,486 P=3,632,489 331,233,806 13,847,035,047 14,181,901,342
December 31, 2017 PPVI MIIC UBP Total Acquisition cost Beginning balance P=4,500,000 P=224,848,654 P=1,506,193,436 P=1,735,542,090 Accumulated equity in net earnings (losses) Beginning balance (935,719) 131,093,034 8,304,219,364 8,434,376,679 Equity in net earnings (losses) for the year (10,658) 2,942,332 1,322,939,519 1,325,871,193 Dividends (Note 26) – – (326,035,470)) (326,035,470) Ending balance (946,377) 134,035,366 9,301,123,413 9,434,212,402 Equity in reserve for fluctuation in AFS Beginning balance – 9,576,554 (1,335,205,212)) (1,325,628,658) Share in net movement of reserve for
fluctuation in AFS financial assets of the associates during the year (Note 6) − (19,118,339) 248,930,575 229,812,236
Ending balance – (9,541,785) (1,086,274,637)) (1,095,816,422) (Forward)

1032018 annual report
- 38 -
*SGVFS034462*
December 31, 2017 PPVI MIIC UBP Total Equity in reserve for re-measurement gains in defined benefit pension plan Beginning balance P=– P=4,430,562 (P=35,782,794) (P=31,352,232) Share in net movement of reserve for
re-measurement gains (losses) on defined benefit plan − 1,848,351 (5,782,160) (3,933,809)
Ending balance – 6,278,913 (41,564,954) (35,286,041) Premium on deemed disposal of investment in
associate − − 304,954,486 304,954,486 P=3,553,623 P=355,621,148 P=9,984,431,744 P=10,343,606,515
The shares of stock of UBP are traded in the local stock market. The fair value of the Group’s interest in the equity securities of UBP amounted to P=12,679,634,578 (i.e., P=63.95 per share) and P=14,868,933,426 (i.e., P=86.65 per share) as of December 31, 2018 and 2017, respectively.
On various dates in 2007, UBP issued a total number of 90,176,456 shares of stock to its equity holders. The Group did not subscribe for additional shares thereby reducing its interest in UBP from 18.74% to 16.11%. The reduction in interest in UBP deemed as disposal was accounted for using the entity concept method and recognized the deemed disposal of interest as an equity transaction. Thus, dilution gain arising from the deemed disposal of interest in UBP amounting to P=304,954,486 was recognized as “Premium on deemed disposal of investment in an associate” in the members’ equity section of the consolidated statements of financial position. On September 29, 2018, UBP issued new shares through stock rights offering. The total number of shares issued was 158,805,583 shares with par value of P=10.00 per share, issued at a price of P=62.97 per share. The Group purchased 26,676,576 shares for P=1,679,823,960, changing its percentage of interest in UBP from 16.21% in 2017 to 16.29% in 2018. Financial position (amounts in thousands)
December 31, 2018 MIIC UBP Financial assets P=2,208,997 P=626,870,936 Property and equipment 204,705 5,108,843 Investment properties 14,847 7,822,779 Deferred tax asset 112,066 2,198,055 Other assets 2,487,312 25,782,752 Accounts payable (351,861) − Other liabilities (3,685,570) (582,804,176) Equity P=990,496 P=84,979,189
December 31, 2017 MIIC UBP Financial assets P=2,320,904 P=575,909,925 Property and equipment 217,367 3,765,796 Investment properties 15,281 7,346,582 Deferred tax asset 205,774 2,588,602 Other assets 1,770,489 20,123,857 Accounts payable (437,920) – Other liabilities (2,970,603) (548,124,783) Equity P=1,121,292 P=61,609,979

104 Reimagining Today Building the FuTure
- 39 -
*SGVFS034462*
The difference between the carrying amount of the investment and the proportionate share in the current net equity of the associate represents movement in the associate’s net assets before acquisition.
Financial performance (amounts in thousands)
December 31, 2018 MIIC UBP Revenue P=1,354,000 P=31,629,220 Direct costs (855,839) (11,629,823) Operating expenses (482,961) (16,329,841) Other income 75,962 5,041,004 Impairment losses − (855,991) Profit before tax 91,162 7,854,569 Income tax expense (75,626) (1,182,758) Net profit for the year P=15,536 P=6,671,811 Group share in the net profit of the associate P=3,884 P=1,086,838
December 31, 2017 MIIC UBP Revenue P=1,462,168 P=24,586,366 Direct costs (1,068,422) (6,945,790) Operating expenses (488,061) (13,758,013) Other income 139,179 7,418,454 Impairment losses − (875,587) Profit before tax 44,864 10,425,430 Income tax expense (33,094) (2,266,080) Net profit for the year P=11,770 P=8,159,350 Group share in the net profit of the associate P=2,942 P=1,322,940
As discussed in Note 2.3.1, as allowed under Amendments to PFRS 4, the Group is allowed to continue to apply PAS 39 in accounting for financial instruments, and is permitted to apply equity method of accounting based on the financial statements of associates that applied PFRS 9. Beginning January 1, 2018, the associates adopted PFRS 9 which introduces new requirements for classification and measurement, impairment and hedge accounting. Under PFRS 9, the classification of financial assets is based on an entity’s business model for managing the financial assets; and whether the financial instrument’s contractual cash flows represent “solely payments of principal and interests” or “SPPI” on the principal amount outstanding. The adoption of PFRS 9 also fundamentally changed the associates’ measurement of impairment losses for financial assets – from PAS 39’s incurred loss approach to a forward-looking expected credit loss (ECL) approach. Under PFRS 9, entities are required to provide ECL for financial assets at AC, FVOCI and contract assets. The allowance is based on the ECLs associated with the risk of default in the next twelve months unless there has been a significant increase in credit risk since origination or the financial assets are impaired where lifetime ECL is provided. For trade receivables without significant financing component, the simplified approach is applied in calculating ECLs. Therefore, the associates no longer track changes in credit risk but instead recognizes an allowance based on lifetime ECL at each reporting period. Relevant forward-looking factors specific to the debtors and the economic environment are considered in developing the overlays in the ECL calculation. UBP has commitments and contingent accounts amounting to P=81.62 billion and P=64.04 billion as of December 31, 2018 and 2017 respectively. These primarily pertain to guarantees and commitments to extend credit which are part of the regular operations of a bank.

1052018 annual report
- 40 -
*SGVFS034462*
PPVI and MIIC have no contingent liabilities or capital commitments as of December 31, 2018 and 2017. PPVI and MIIC are not subject to restrictions (i.e., whether through legal, contractual, or discretionary restrictions) as to the use or transfer of their assets or settlement of liabilities as of December 31, 2018 and 2017. BSP, UBP’s lead regulator, sets and monitors the capital requirements of UBP. In implementing current capital requirements, the BSP requires UBP to maintain a minimum capital amount and a prescribed ratio of qualifying capital to risk-weighted assets, known as the “capital adequacy ratio.” Risk-weighted assets is the aggregate value of assets weighted by credit risk, market risk, and operational risk, based on BSP-prescribed formula provided under its circulars. These, among others, may impose significant restrictions as to the use or transfer of assets or the settlement of liabilities as of December 31, 2018 and 2017.
8. Investment Properties
The movements in carrying amounts of investment properties follow:
2018
Land Building and
Improvements Total Costs Beginning balances P=3,499,080,123 P=3,859,426,096 P=7,358,506,219 Additions 27,644,277 139,740,848 167,385,125 Reclassification (Note 9) 454,259,898 (9,967,128) 444,292,770 Disposals (24,021,276) (69,226,814) (93,248,090) Sale of a subsidiary (5,773,793) (7,006,546) (12,780,339) Ending balances 3,951,189,229 3,912,966,456 7,864,155,685 Accumulated Depreciation and Impairment Loss Beginning balances 156,116,205 845,841,395 1,001,957,600 Depreciation (Note 20) − 136,380,771 136,380,771 Reclassification (Note 9) − 45,088,595 45,088,595 Disposals − (33,604,878) (33,604,878) Sale of a subsidiary − (3,439,109) (3,439,109) Ending balances 156,116,205 990,266,774 1,146,382,979 Net Book Values P=3,795,073,024 P=2,922,699,682 P=6,717,772,706
2017, as restated
Land Building and
Improvements Total Costs Beginning balances P=4,195,528,259 P=3,775,145,218 P=7,970,673,477 Additions 1,623,600 445,200,459 446,824,059 Reclassification (Note 9) (391,686,407) (183,034,664) (574,721,071) Disposals (306,385,329) (177,884,917) (484,270,246) Ending balances 3,499,080,123 3,859,426,096 7,358,506,219 Accumulated Depreciation and Impairment Loss Beginning balances 156,116,205 927,485,815 1,083,602,020 Depreciation (Note 20) − 143,400,249 143,400,249 Reclassification (Note 9) − (61,425,028) (61,425,028) Impairment loss (Note 22) − 628,867 628,867 Disposals − (164,248,508) (164,248,508) Ending balances 156,116,205 845,841,395 1,001,957,600 Net Book Values P=3,342,963,918 P=3,013,584,701 P=6,356,548,619

106 Reimagining Today Building the FuTure
- 41 -
*SGVFS034462*
The total fair value of the investment properties amounted to P=10,611,450,124 and P=10,312,699,359 as of December 31, 2018 and 2017, respectively, based on independent appraiser valuation.
The fair value hierarchy of the investment properties is under Level 3 category. The fair value of the investment properties was arrived at using the following approaches:
Valuation Technique Significant Unobservable Inputs
Land Market Data Sales price
approach Location and proximity to important landmarks
Marketability and desirability Building and Cost approach Replacement cost or reproduction cost Improvements
Condition and economic life
Facilities and amenities
Market Data approach is a comparative approach that considers the sales of similar or substitute assets and other related market data. In general, an asset being valued is compared with similar items that have been transacted in the market or that are listed or offered for sale, with appropriate adjustment to reflect different properties or characteristics. Market data considered in the valuation includes location of the properties, size, shape and characteristics of the lot, desirability in the market and present and prospective use.
Cost approach is a comparative approach used to estimate the replacement cost or reproduction cost of the building and improvements, considering the prevailing market prices for material, labor, contractor’s overhead, profit and other charges, less allowance for physical depreciation and obsolescence.
Highest and best use is defined as the most probable use of a property, which is physically possible, appropriately justified, legally permissible, financially feasible, and which results in the highest value of the property being valued.
Movements in the significant unobservable inputs are positively correlated to the fair value of the properties subject to valuation.
The Group enters into operating leases for its investment properties (Note 27). Rental income amounted to P=639,740,070 in 2018 and P=428,126,462 in 2017 (Note 27). Direct expenses arising in respect of such investment properties amounted to P=186,996,627 in 2018 and P=140,987,726 in 2017 while indirect operating expenses amounted to P=46,008,305 in 2018 and P=23,810,580 in 2017 (Note 21).
Future minimum lease rentals receivable under non-cancellable operating leases are disclosed in Note 27.

1072018 annual report
- 42 -
*SGVFS034462*
9. Property and Equipment
The movement in carrying amount of property and equipment follows:
2018 Electronic
Furniture and Data Land and Fixtures and Processing Transportation Building Buildings Equipment Equipment Equipment Improvements Total
Costs Beginning balances P=2,683,897,377 P=199,940,962 P=215,135,170 P=97,716,887 P=96,427,663 P=3,293,118,059 Additions 51,001,989 16,649,945 51,817,645 30,253,383 3,461,849 153,184,811 Reclassification (Note 8) (444,292,770) (40,179) 65,322 (7,143) (18,000) (444,292,770) Retirements/disposals − (4,949,837) (1,100,593) (30,494,319) - (36,544,749) Sale of a subsidiary − (5,863,319) − (3,167,288) (2,692,922) (11,723,529) Ending balances 2,290,606,596 205,737,572 265,917,544 94,301,520 97,178,590 2,953,741,822 Accumulated Depreciation
and Amortization Beginning balances 555,980,842 82,146,445 159,805,325 55,096,489 81,242,022 934,271,123 Depreciation and amortization (Note 20) 36,949,744 16,756,730 23,332,963 17,650,709 4,008,986 98,699,132
Retirements/disposals (128,527) (1,270,301) (1,100,594) (24,355,410) − (26,854,832) Sale of a subsidiary − (5,544,809) − (2,835,982) (2,240,360) (10,621,151) Reclassification (Note 8) (45,088,596) − − − − (45,088,596) Ending balances 547,713,463 205,737,567 182,037,694 45,555,806 83,010,648 950,405,676 Net Book Values P=1,742,893,133 P=5 P=83,879,850 P=48,745,714 P=14,167,942 P=2,003,336,146
2017, as restated
Electronic Furniture and Data Land and Fixtures and Processing Transportation Building Buildings Equipment Equipment Equipment Improvements Total
Costs Beginning balances 1,803,553,679 179,707,218 189,124,274 86,855,079 92,863,964 2,352,104,214 Additions 333,077,820 21,535,262 30,589,303 33,275,390 3,563,699 422,041,474 Reclassification (Note 8) 574,721,072 − − − − 574,721,072 Retirements/disposals (27,455,194) (1,301,518) (4,578,407) (22,413,582) - (55,748,701) Ending balances 2,683,897,377 199,940,962 215,135,170 97,716,887 96,427,663 3,293,118,059 Accumulated Depreciation
and Amortization Beginning balances 494,162,392 67,585,511 144,087,287 54,453,456 75,303,199 835,591,845 Depreciation and amortization (Note 20) 15,615,800 15,440,492 20,136,938 17,147,833 5,938,823 74,279,886
Retirements/disposals (15,222,378) (879,558) (4,418,900) (16,504,800) − (37,025,636) Reclassification (Note 8) 61,425,028 − − − − 61,425,028 Ending balances 555,980,842 82,146,445 159,805,325 55,096,489 81,242,022 934,271,123 Net Book Values P=2,127,916,535 P=117,794,517 P=55,329,845 P=42,620,398 P=15,185,641 P=2,358,846,936
The cost of fully depreciated property and equipment that are still in use in the Group’s operations amounted to P=265,839,904 and P=316,873,975 as of December 31, 2018 and 2017, respectively.
10. Other Assets
2018 2017 Prepaid expenses (Note 26) P=1,005,839,987 P=1,022,633,671 Computer software 29,831,163 53,739,288 Others 48,961,103 37,653,857 P=1,084,632,253 P=1,114,026,816

108 Reimagining Today Building the FuTure
- 43 -
*SGVFS034462*
Computer Software The movements in the carrying amount of computer software follow: 2018 2017 Cost Beginning balance P=246,742,118 P=238,689,237 Additions 8,570,634 8,052,881 Retirements (25,149) − Ending balance 255,287,603 246,742,118 Accumulated Amortization Beginning balance 193,002,830 154,031,887 Amortization (Note 20) 32,454,867 38,970,943 Retirements (1,257) − Ending balance 225,456,440 193,002,830 Net Book Value P=29,831,163 P=53,739,288
Others Others include prepaid taxes and other current assets.
11. Legal Policy Reserves
2018 Legal policy
reserves Reinsurers’ share of
liabilities Net Aggregate reserves for:
Ordinary life policies P=51,452,044,280 P=75,296,690 P=51,376,747,590 Group life policies 2,292,408,589 12,462,560 2,279,946,029 Unit-linked policies 713,174,633 38,200,483 674,974,150 Accident and health policies 43,279,147 (347,663) 43,626,810
P=54,500,906,649 P=125,612,070 P=54,375,294,579
2017 Legal policy
reserves Reinsurers’ share of
liabilities Net Aggregate reserves for:
Ordinary life policies P=59,960,504,871 P=73,317,793 P=59,887,187,078 Group life policies 1,994,886,201 – 1,994,886,201 Accident and health policies 30,532,311 511,758 30,020,553 Unit-linked policies 488,923,402 28,004,438 460,918,964
P=62,474,846,785 P=101,833,989 P=62,373,012,796
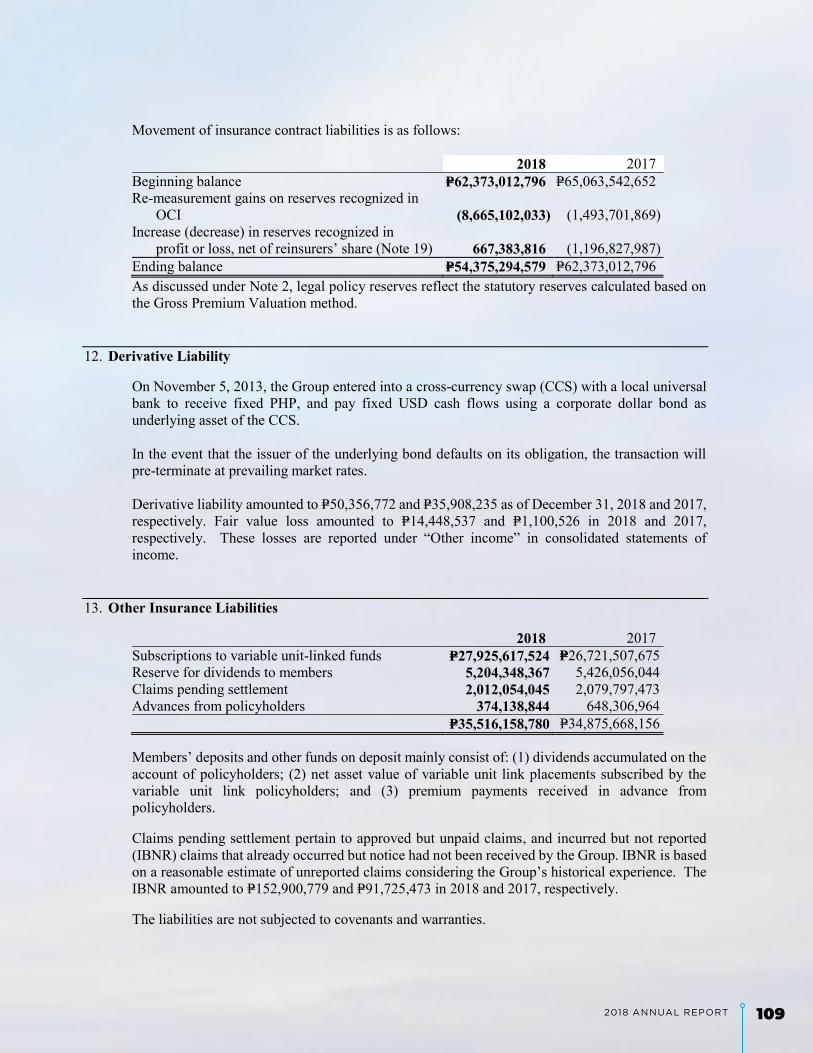
1092018 annual report
- 44 -
*SGVFS034462*
Movement of insurance contract liabilities is as follows:
2018 2017 Beginning balance P=62,373,012,796 P=65,063,542,652 Re-measurement gains on reserves recognized in
OCI (8,665,102,033) (1,493,701,869) Increase (decrease) in reserves recognized in
profit or loss, net of reinsurers’ share (Note 19) 667,383,816 (1,196,827,987) Ending balance P=54,375,294,579 P=62,373,012,796 As discussed under Note 2, legal policy reserves reflect the statutory reserves calculated based on the Gross Premium Valuation method.
12. Derivative Liability
On November 5, 2013, the Group entered into a cross-currency swap (CCS) with a local universal bank to receive fixed PHP, and pay fixed USD cash flows using a corporate dollar bond as underlying asset of the CCS.
In the event that the issuer of the underlying bond defaults on its obligation, the transaction will pre-terminate at prevailing market rates.
Derivative liability amounted to P=50,356,772 and P=35,908,235 as of December 31, 2018 and 2017, respectively. Fair value loss amounted to P=14,448,537 and P=1,100,526 in 2018 and 2017, respectively. These losses are reported under “Other income” in consolidated statements of income.
13. Other Insurance Liabilities
2018 2017 Subscriptions to variable unit-linked funds P=27,925,617,524 P=26,721,507,675 Reserve for dividends to members 5,204,348,367 5,426,056,044 Claims pending settlement 2,012,054,045 2,079,797,473 Advances from policyholders 374,138,844 648,306,964 P=35,516,158,780 P=34,875,668,156
Members’ deposits and other funds on deposit mainly consist of: (1) dividends accumulated on the account of policyholders; (2) net asset value of variable unit link placements subscribed by the variable unit link policyholders; and (3) premium payments received in advance from policyholders.
Claims pending settlement pertain to approved but unpaid claims, and incurred but not reported (IBNR) claims that already occurred but notice had not been received by the Group. IBNR is based on a reasonable estimate of unreported claims considering the Group’s historical experience. The IBNR amounted to P=152,900,779 and P=91,725,473 in 2018 and 2017, respectively.
The liabilities are not subjected to covenants and warranties.
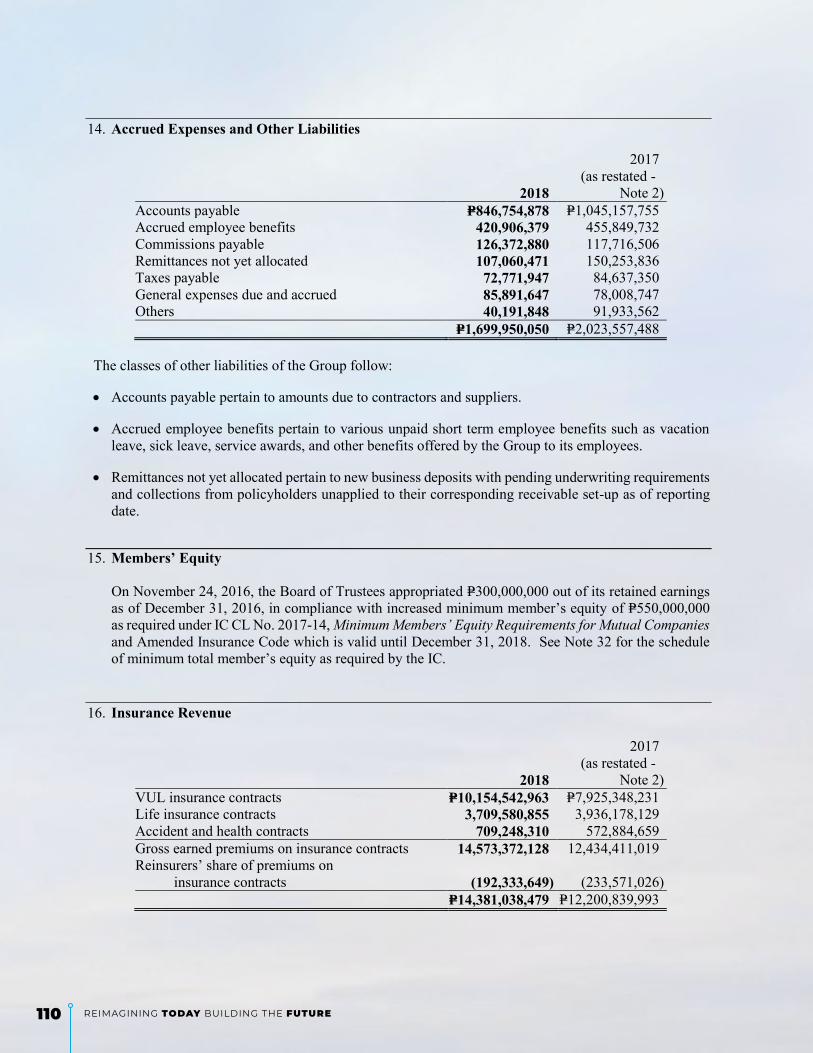
110 Reimagining Today Building the FuTure
- 45 -
*SGVFS034462*
14. Accrued Expenses and Other Liabilities
2018
2017 (as restated -
Note 2) Accounts payable P=846,754,878 P=1,045,157,755 Accrued employee benefits 420,906,379 455,849,732 Commissions payable 126,372,880 117,716,506 Remittances not yet allocated 107,060,471 150,253,836 Taxes payable 72,771,947 84,637,350 General expenses due and accrued 85,891,647 78,008,747 Others 40,191,848 91,933,562 P=1,699,950,050 P=2,023,557,488
The classes of other liabilities of the Group follow:
Accounts payable pertain to amounts due to contractors and suppliers. Accrued employee benefits pertain to various unpaid short term employee benefits such as vacation
leave, sick leave, service awards, and other benefits offered by the Group to its employees. Remittances not yet allocated pertain to new business deposits with pending underwriting requirements
and collections from policyholders unapplied to their corresponding receivable set-up as of reporting date.
15. Members’ Equity
On November 24, 2016, the Board of Trustees appropriated P=300,000,000 out of its retained earnings as of December 31, 2016, in compliance with increased minimum member’s equity of P=550,000,000 as required under IC CL No. 2017-14, Minimum Members’ Equity Requirements for Mutual Companies and Amended Insurance Code which is valid until December 31, 2018. See Note 32 for the schedule of minimum total member’s equity as required by the IC.
16. Insurance Revenue
2018
2017 (as restated -
Note 2) VUL insurance contracts P=10,154,542,963 P=7,925,348,231 Life insurance contracts 3,709,580,855 3,936,178,129 Accident and health contracts 709,248,310 572,884,659 Gross earned premiums on insurance contracts 14,573,372,128 12,434,411,019 Reinsurers’ share of premiums on
insurance contracts (192,333,649) (233,571,026) P=14,381,038,479 P=12,200,839,993

1112018 annual report
- 46 -
*SGVFS034462*
17. Investment Income 2018 2017 Interest income on: HTM financial assets P=1,539,229,128 P=1,557,735,755 Loans and receivables 1,205,774,920 1,211,634,676 AFS financial assets 945,806,586 741,215,943 Others 7,181,856 1,834,902 Dividend income 1,671,863,563 790,944,163 Trading gains (losses) from financial assets at FVPL (352,674,083) 151,901,753 P=5,017,181,970 P=4,455,267,192
18. Net Realized Gains
2018 2017 Net realized gains AFS financial assets P=358,027,766 P=743,802,104 Investment properties 34,014,646 96,509,817 Repossession 2,228,328 800,540 P=394,270,740 P=841,112,461
19. Insurance Benefits Expenses
2018 2017 VUL funds allocation P=7,704,555,030 P=6,512,711,711 Maturities 2,746,729,210 2,387,824,753 Death and hospitalization benefits 1,723,662,919 1,398,170,963 Surrenders 879,559,954 819,255,493 Interest on policy and contract funds 316,182,737 335,926,914 Payments on supplementary contracts 232,689,541 289,616,051 Decrease in reserve for supplementary contracts (64,298,846) (107,135,741) Others 251,007,688 (38,647,109) Total gross benefits and claims on
insurance contracts 13,790,088,233 11,597,723,035 Reinsurers’ share of benefits and
claims on insurance contracts (56,475,863) (29,271,877) Net change in (Note 11): Legal policy reserves 691,161,898 (1,183,552,082) Reinsurers’ share in legal policy reserves (23,778,082) (13,275,905) P=14,400,996,186 P=10,371,623,171
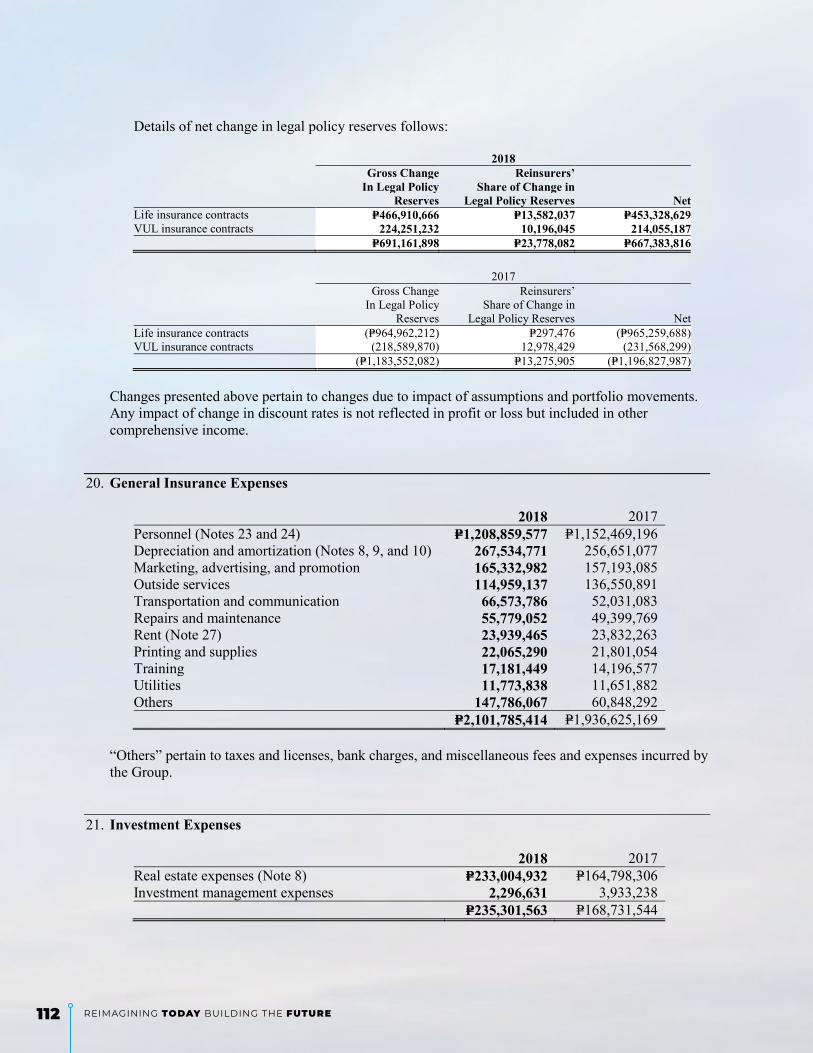
112 Reimagining Today Building the FuTure
- 47 -
*SGVFS034462*
Details of net change in legal policy reserves follows:
2018 Gross Change Reinsurers’
In Legal Policy Share of Change in
Reserves Legal Policy Reserves Net
Life insurance contracts P=466,910,666 P=13,582,037 P=453,328,629 VUL insurance contracts 224,251,232 10,196,045 214,055,187 P=691,161,898 P=23,778,082 P=667,383,816
2017
Gross Change Reinsurers’
In Legal Policy Share of Change in
Reserves Legal Policy Reserves Net Life insurance contracts (P=964,962,212) P=297,476 (P=965,259,688) VUL insurance contracts (218,589,870) 12,978,429 (231,568,299) (P=1,183,552,082) P=13,275,905 (P=1,196,827,987)
Changes presented above pertain to changes due to impact of assumptions and portfolio movements. Any impact of change in discount rates is not reflected in profit or loss but included in other comprehensive income.
20. General Insurance Expenses
2018 2017 Personnel (Notes 23 and 24) P=1,208,859,577 P=1,152,469,196 Depreciation and amortization (Notes 8, 9, and 10) 267,534,771 256,651,077 Marketing, advertising, and promotion 165,332,982 157,193,085 Outside services 114,959,137 136,550,891 Transportation and communication 66,573,786 52,031,083 Repairs and maintenance 55,779,052 49,399,769 Rent (Note 27) 23,939,465 23,832,263 Printing and supplies 22,065,290 21,801,054 Training 17,181,449 14,196,577 Utilities 11,773,838 11,651,882 Others 147,786,067 60,848,292 P=2,101,785,414 P=1,936,625,169
“Others” pertain to taxes and licenses, bank charges, and miscellaneous fees and expenses incurred by the Group.
21. Investment Expenses
2018 2017 Real estate expenses (Note 8) P=233,004,932 P=164,798,306 Investment management expenses 2,296,631 3,933,238 P=235,301,563 P=168,731,544

1132018 annual report
- 48 -
*SGVFS034462*
22. Other Losses 2018 2017 Impairment loss on:
AFS equity securities (Note 6) P=54,578,311 P=41,724,816 Investment properties (Note 8) − 628,867
Loss on deconsolidation of a subsidiary (Note 28) 5,715,649 − Foreign exchange loss − 2,690,121 P=60,293,960 P=45,043,804
23. Personnel Expenses
2018 2017 Salaries and bonuses P=978,093,037 P=894,773,217 Employee benefits 132,984,979 157,985,444 Retirement benefits expense (Note 24) 97,781,561 99,710,535 P=1,208,859,577 P=1,152,469,196
24. Retirement benefits
The Group accrues the provision for retirement benefits covering all of its regular employees based on the Group’s retirement plan that is compliant with the provision of Republic Act (RA) No. 7641. The benefits are based on the years of service and compensation of the employees.
The subsidiaries’ retirement funds are administered by UBP under the supervision of the BOT of the respective plans. The BOT of the subsidiaries’ plans is responsible for the investment strategy of the plans.
The retirement plan of the Parent Company is administered by its BOT consisting of its key officers. The Parent Company’s BOT has the following major responsibilities as provided in the declaration of trust:
1) Control and administration of the retirement plan for the accomplishment of the purpose for which
the Fund is intended in accordance with the plan; and 2) Receive and hold title to and ownership of the fund to be held in trust for the best interest of the
parties affected thereby in accordance with and for all the uses and purposes as stated in the plan and in the declaration of trust (with all the powers and duties as stated in the declaration of trust). The latest actuarial valuation of the defined benefit plans of the Parent Company, I-Care, and Home Credit was as of December 31, 2018. The tables below summarize the components of retirement benefits cost recognized in the consolidated statements of income and the funded status and amounts recognized in the consolidated statements of financial position for the retirement plans.
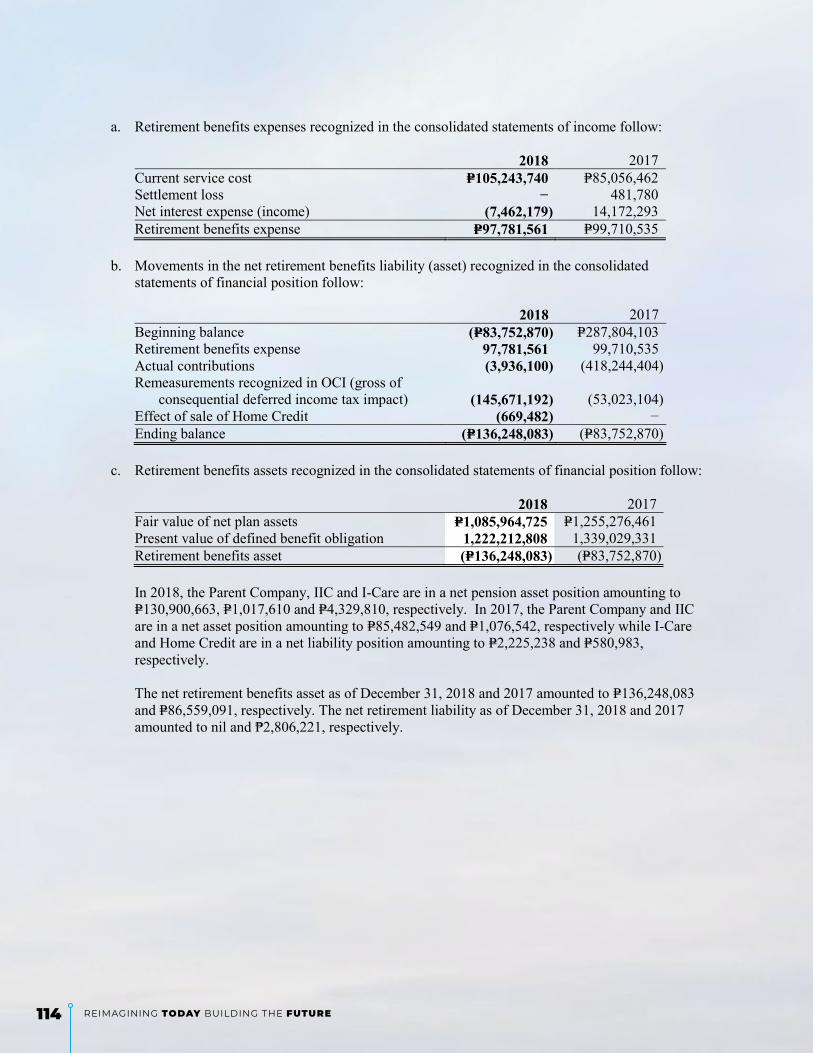
114 Reimagining Today Building the FuTure
- 49 -
*SGVFS034462*
a. Retirement benefits expenses recognized in the consolidated statements of income follow:
2018 2017 Current service cost P=105,243,740 P=85,056,462 Settlement loss − 481,780 Net interest expense (income) (7,462,179) 14,172,293 Retirement benefits expense P=97,781,561 P=99,710,535
b. Movements in the net retirement benefits liability (asset) recognized in the consolidated
statements of financial position follow: 2018 2017 Beginning balance (P=83,752,870) P=287,804,103 Retirement benefits expense 97,781,561 99,710,535 Actual contributions (3,936,100) (418,244,404) Remeasurements recognized in OCI (gross of
consequential deferred income tax impact) (145,671,192) (53,023,104) Effect of sale of Home Credit (669,482) − Ending balance (P=136,248,083) (P=83,752,870)
c. Retirement benefits assets recognized in the consolidated statements of financial position follow: 2018 2017 Fair value of net plan assets P=1,085,964,725 P=1,255,276,461 Present value of defined benefit obligation 1,222,212,808 1,339,029,331 Retirement benefits asset (P=136,248,083) (P=83,752,870) In 2018, the Parent Company, IIC and I-Care are in a net pension asset position amounting to P=130,900,663, P=1,017,610 and P=4,329,810, respectively. In 2017, the Parent Company and IIC are in a net asset position amounting to P=85,482,549 and P=1,076,542, respectively while I-Care and Home Credit are in a net liability position amounting to P=2,225,238 and P=580,983, respectively. The net retirement benefits asset as of December 31, 2018 and 2017 amounted to P=136,248,083 and P=86,559,091, respectively. The net retirement liability as of December 31, 2018 and 2017 amounted to nil and ₱2,806,221, respectively.

1152018 annual report
- 50 -
*SGVFS034462*
d. Changes in the present value of defined benefit obligation follow:
2018 2017
Beginning balance P=1,255,276,461 P=1,203,158,950 Current service cost 105,243,740 85,056,462 Interest cost on defined benefit obligation 69,974,074 60,988,151 Settlement loss − 481,780 Benefits paid (106,109,726) (34,776,390) Re-measurements on: Actuarial gains arising from changes in
financial assumptions (163,051,132) (132,642,858) Actuarial losses arising from changes in demographic assumptions − 12,229,201 Actuarial losses (gains) arising from experience adjustments (71,439,071) 60,781,165 Effect of sale of Home Credit (3,929,621) − Ending balance P=1,085,964,725 P=1,255,276,461
e. Changes in the fair value of net plan assets follow::
2018 2017 Beginning balance P=1,339,029,331 P=915,354,847 Actual contributions 3,936,100 418,244,404 Interest income 77,436,253 46,815,858 Actuarial losses excluding amount recognized
in net interest cost (88,819,011) (6,609,388) Benefits paid (106,109,726) (34,776,390) Effect of sale of Home Credit (3,260,139) − Ending balance P=1,222,212,808 P=1,339,029,331
The major categories of plan assets as a percentage of fair value of net plan assets of the Parent Company as of December 31 are as follows:
2018 2017 Loans and receivable: Cash and cash equivalents 7% 10% Receivables 5% 9% 12% 19% Equity securities: Food, beverage, and tobacco 5% 5% Telecommunications 5% 5% Others 2% 1% 12% 11% Debt securities: Government debt securities 66% 64% Private debt securities 10% 6% 76% 70% 100% 100%
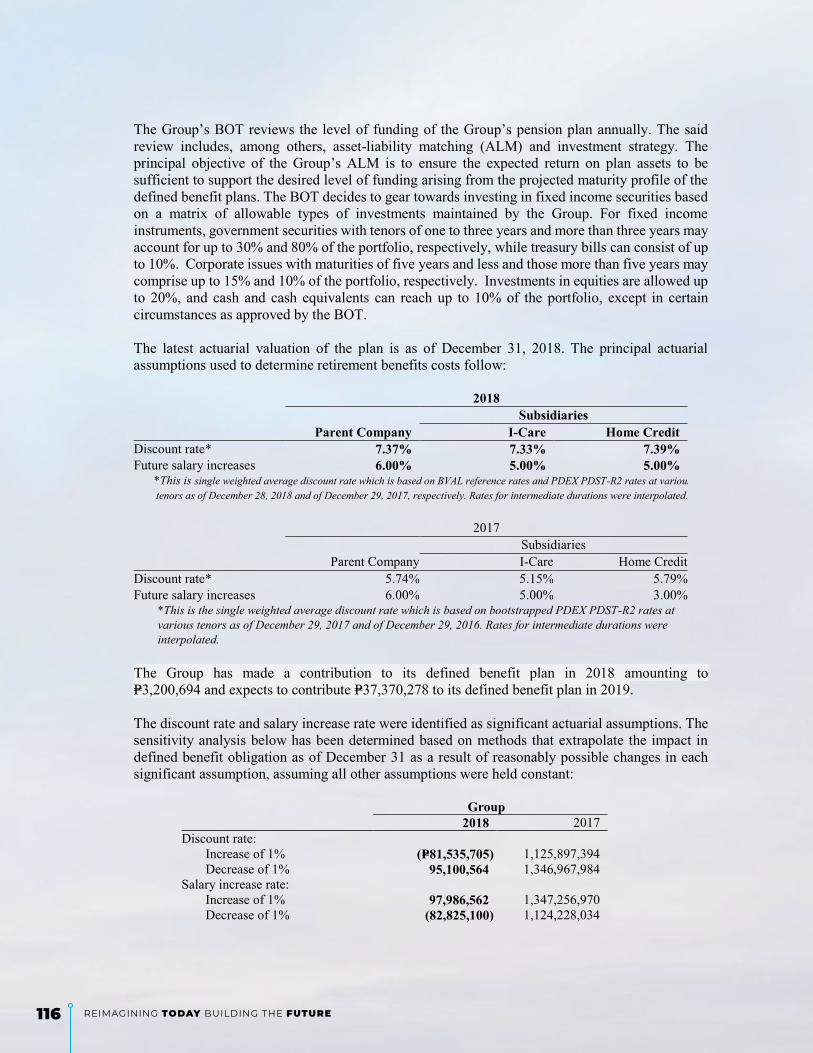
116 Reimagining Today Building the FuTure
- 51 -
*SGVFS034462*
The Group’s BOT reviews the level of funding of the Group’s pension plan annually. The said review includes, among others, asset-liability matching (ALM) and investment strategy. The principal objective of the Group’s ALM is to ensure the expected return on plan assets to be sufficient to support the desired level of funding arising from the projected maturity profile of the defined benefit plans. The BOT decides to gear towards investing in fixed income securities based on a matrix of allowable types of investments maintained by the Group. For fixed income instruments, government securities with tenors of one to three years and more than three years may account for up to 30% and 80% of the portfolio, respectively, while treasury bills can consist of up to 10%. Corporate issues with maturities of five years and less and those more than five years may comprise up to 15% and 10% of the portfolio, respectively. Investments in equities are allowed up to 20%, and cash and cash equivalents can reach up to 10% of the portfolio, except in certain circumstances as approved by the BOT.
The latest actuarial valuation of the plan is as of December 31, 2018. The principal actuarial assumptions used to determine retirement benefits costs follow: 2018 Subsidiaries Parent Company I-Care Home Credit Discount rate* 7.37% 7.33% 7.39% Future salary increases 6.00% 5.00% 5.00%
*This is single weighted average discount rate which is based on BVAL reference rates and PDEX PDST-R2 rates at various tenors as of December 28, 2018 and of December 29, 2017, respectively. Rates for intermediate durations were interpolated..
2017 Subsidiaries Parent Company I-Care Home Credit Discount rate* 5.74% 5.15% 5.79% Future salary increases 6.00% 5.00% 3.00%
*This is the single weighted average discount rate which is based on bootstrapped PDEX PDST-R2 rates at various tenors as of December 29, 2017 and of December 29, 2016. Rates for intermediate durations were interpolated.
The Group has made a contribution to its defined benefit plan in 2018 amounting to P=3,200,694 and expects to contribute P=37,370,278 to its defined benefit plan in 2019.
The discount rate and salary increase rate were identified as significant actuarial assumptions. The sensitivity analysis below has been determined based on methods that extrapolate the impact in defined benefit obligation as of December 31 as a result of reasonably possible changes in each significant assumption, assuming all other assumptions were held constant:
Group 2018 2017 Discount rate: Increase of 1% (P=81,535,705) 1,125,897,394 Decrease of 1% 95,100,564 1,346,967,984 Salary increase rate: Increase of 1% 97,986,562 1,347,256,970 Decrease of 1% (82,825,100) 1,124,228,034

1172018 annual report
- 52 -
*SGVFS034462*
Shown below is the maturity analysis of the undiscounted benefit payments as of:
Group 2018 2017 Less than 1 year P=58,543,045 P=72,978,840 More than 1 year to 5 years 441,301,524 432,882,805 More than 5 years to 10 years 632,757,458 655,597,482 More than 10 years 5,693,502,186 5,314,629,979
The average duration of the defined benefit obligation at the end of the reporting period is 21.48 years and 21.34 years in 2018 and 2017, respectively.
25. Income Taxes
a. The components of provision for income tax follow:
2018 2017 Current
Final tax P=516,329,150 P=499,077,854 Regular corporate income tax 4,114,828 17,091,753 Minimum corporate income tax 705,298 48,364,557
521,149,276 564,534,164 Deferred 137,106,583 35,226,441 P=658,255,859 P=599,760,605
b. The components of the Group’s net deferred income tax liabilities (assets) follow:
2018
Beginning
of Year
Provision for (benefit) from income tax
End of Year Charged
to profit or loss Charged
to OCI Deferred income tax liabilities: Loss on re-measurement on life insurance
reserves P=− P=− (P=2,032,624,014) (P=2,032,624,014) Revaluation increment in investment properties (1,015,473,917) 10,837,503 − (1,004,636,414) Retirement benefits asset (25,967,728) 25,816,092 (40,722,788) (40,874,425) Reserve for fluctuation in AFS financial assets (9,982,402) − 320,796 (9,661,606) Accrued rent income (14,222,256) (13,486,459) − (27,708,715) (1,065,646,303) (23,167,136) (2,073,026,006) (3,115,505,174) Deferred income tax assets: Accrued expenses not yet deductible 235,115,709 (90,094,164) − 145,021,545 Unamortized past service cost contributions 99,156,200 (13,367,859) − 85,788,341 Allowance for impairment on loans and
receivables 5,284,529 (2,222,801) − 3,061,728
Impairment of investment properties and property and equipment 6,843,543 − − 6,843,543
Unrealized foreign exchange difference 227,534,476 (57,024,171) − 170,510,305 Retirement benefits liability 667,571 2,435,276 (3,102,847) − Gain on re-measurement on life insurance
reserves 566,906,596 − (566,906,596) − Deferred income tax assets (1,065,646,303) 23,167,136 (2,073,026,006) (3,115,505,174) Net deferred income tax liability (asset) P=75,862,321 (P=137,106,583) (P=2,643,035,449) (P=2,704,279,712)

118 Reimagining Today Building the FuTure
- 53 -
*SGVFS034462*
2017
Beginning
of Year
Provision for (benefit) from income tax
End of Year Charged
to profit or loss Charged
to OCI Deferred income tax liabilities: Loss on re-measurement on life insurance reserves P=− P=− (P=2,032,624,014) (P=2,032,624,014) Revaluation increment in investment properties (1,015,473,917) 10,837,503 − (1,004,636,414) Retirement benefits asset (25,967,728) 25,816,092 (40,722,788) (40,874,425) Reserve for fluctuation in AFS financial assets (9,982,402) − 320,796 (9,661,606) Accrued rent income (14,222,256) (13,486,459) − (27,708,715) (1,065,646,303) (23,167,136) (2,073,026,006) (3,115,505,174) Deferred income tax assets: Accrued expenses not yet deductible 235,115,709 (90,094,164) − 145,021,545 Unamortized past service cost contributions 99,156,200 (13,367,859) − 85,788,341 Allowance for impairment on loans and receivables 5,284,529 (2,222,801) − 3,061,728 Impairment of investment properties and property
and equipment 6,843,543 − − 6,843,543
Unrealized foreign exchange difference 227,534,476 (57,024,171) − 170,510,305 Retirement benefits liability 667,571 2,435,276 (3,102,847) − Gain on re-measurement on life insurance reserves 566,906,596 − (566,906,596) − Deferred income tax assets (1,065,646,303) 23,167,136 (2,073,026,006) (3,115,505,174) Net deferred income tax liability (asset) P=75,862,321 (P=137,106,583) (P=2,643,035,449) (P=2,704,279,712)
In 2018, the Parent Company and IIC are in a net deferred tax liability position while I-Care is in a net deferred tax asset position. In 2017, the Parent Company and I-Care is in a net asset position while IIC is in a net deferred tax liability position.
c. Deferred income tax assets were not recognized on the following items since it is not expected that
sufficient future taxable profits will be available against which these items can be utilized prior to their expiration:
2018 2017
Tax effects of: NOLCO P=3,684,981,168 P=2,212,354,996 Excess of MCIT over RCIT 49,083,088 48,394,019
P=3,734,064,256 P=2,260,749,015 d. The Group’s NOLCO available for deduction from future taxable income follows:
Year January 1, December 31, Incurred Expiration 2018 Incurred Applied Expired 2018 2015 2018 P=304,557,827 P= P=– (P=304,557,827) P=– 2016 2019 1,905,531,240 – – − 1,905,531,240 2017 2020 2,265,929 – – – 2,265,929 2018 2021 − 1,777,183,999 – – 1,777,183,999 P=2,212,354,996 P=1,777,183,999 P=– (P=304,557,827) P=3,684,981,168
e. The Group’s unused excess of MCIT over RCIT follows:
Year January 1, December 31, Incurred Expiration 2018 Incurred Applied Expired 2018 2015 2018 P=16,229 P=– P=– (P=16,229) P=– 2016 2019 12,809 – – – 12,809 2017 2020 48,364,981 – − – 48,364,981 2018 2021 − 705,298 – – 705,298
P=48,394,019 P=705,298 P=– (P=16,229) P=49,083,088

1192018 annual report
- 54 -
*SGVFS034462*
f. The reconciliation of the provision for income tax at the statutory income tax rates to the provision for income tax shown in the statements of income is shown below.
2018
2017 (as restated -
Note 2) Provision for income tax at statutory income tax rates P=1,096,873,667 P=1,684,602,196 Adjustments for: Equity in net earnings of an associate (318,324,640) (397,761,358) Interests subjected to final tax at lower tax rates and dividends/interest exempt from tax (846,785,406) (193,730,985) Movement in NOLCO and excess MCIT over RCIT without deferred income tax asset set up 534,183,238 (270,900,169) Nontaxable income (107,873,774) (369,253,929) Nondeductible expenses 300,182,774 146,804,850 Provision for income tax P=658,255,859 P=599,760,605
26. Related Party Transactions
Enterprises and individuals that directly, or indirectly through one or more intermediaries, control or are controlled by or under common control with the Group, including holding companies and subsidiaries , are related parties of the Group. Associates and individuals owning, directly or indirectly, an interest in the voting power of the Group that gives them significant influence over the enterprise, key management personnel, including directors and officers of the Group and close members of the family of these individuals, and companies associated with these individuals also constitute related parties. In considering each possible related entity relationship, attention is directed to the substance of the relationship and not merely the legal form.
Transactions with related parties consist mainly of:
a. Lease of office spaces, cash advances, dividends, interests, and loans. The balances as of and for the years ended December 31, 2018 and 2017 are presented below:
Outstanding Balance
Amount of transaction
Cash and investment
Category Year during the year Due From Due to Accounts Terms and condition Subsidiaries*
Term Loan 2017 P=50,000,000 P=100,000,000 P=− P=− 2 years; 3% interest per annum
Interest on Term Loan
2017 2,766,667 1,416,667 − − Unsecured. unguaranteed; no impairment
Common Overhead
2018 11,560,505 − − − 30-day; noninterest-bearing; settled in cash;
2017 10,433,569 − − −
Rental Income 2018 12,751,031 168,451 − − One to three-year lease contract; 30-day; noninterest-bearing; settled in cash; unsecured, unguaranteed, no impairment
2017 11,820,761 118,202 − −
Rental deposits 2018 3,902,054 2,800 4,471,435 − noninterest-bearing; settled in cash; unguaranteed; unsecured; no impairment
2017 585,073 34,600 1,792,421 −
(Forward)

120 Reimagining Today Building the FuTure
- 55 -
*SGVFS034462*
Outstanding Balance
Amount of transaction
Cash and investment
Category Year during the year Due From Due to Accounts Terms and condition Dividends 2018 P=36,240,000 P=− P=− P=− noninterest-bearing; settled
in cash; unguaranteed; unsecured; no impairment
2017 6,500,000 − − −
Insurance revenue 2018 2,155,797 − − −
2017 2,110,190 − − −
Director's fee 2018 80,000 − − −
2017 280,000 − − −
Salaries and 2018 1,592,168 − − − compensation 2017 3,365,350 − − −
Association dues, 2018 4,286,159 106,848 10,824 − noninterest-bearing; settled in cash; unsecured utilities and others 2017 3,900,193 294,521 131,660 −
Associates
MIIC
Rental Income 2018 3,388,640 32,411 − − 30-day; noninterest-bearing; unsecured; unguaranteed; settled in cash
2017 3,434,104 − 312,810 −
Rental Deposits 2018 963,113 − 2,783,881 − noninterest-bearing; settled in cash; unguaranteed; unsecured; no impairment
2017 74,630 − 3,160,239 −
Insurance Revenue
2018 32,312,622 − − −
2017 66,119,356 − − −
Association dues, 2018 1,220,088 249,945 932,458 −
utilities and others 2017 1,322,659 361,244 57,843 −
UBP Stock Rights Offering (SRO) 2018 1,679,823,991 − − −
2017 − − − −
Service Fee 2018 178,664,224 − 12,298,401 − noninterest-bearing; unsecured; unguaranteed; settled in cash
2017 80,668,633 − 12,008,942 −
Access Fee, net of amortization during the year
2018 56,006,043 − − 920,083,643 noninterest bearing; settled in cash 2017 1,000,000,000 − − 976,089,686
Distribution Expense
2018 12,366,134 − 2,588,079 − noninterest bearing; settled in cash; unguaranteed; unsecured; no impairment
2017 10,576,397 − 5,279,397 −
Personnel Fee 2018 14,795,991 − − − 2017 5,191,060 − − −
Rental Income 2018 22,274,607 − 185,963 − 30-day; noninterest-bearing; unsecured; unguaranteed; settled in cash
2017 13,922,547 − 164,527 −
Rental Deposits 2018 381,652 − 17,910,724 − noninterest-bearing; settled in cash; unguaranteed; unsecured; no impairment
2017 3,055,918 7,500 16,534,600 −
Dividends 2018 326,035,470 − − −
2017 326,035,470 − − −
Insurance Revenue
2018 230,880,866 − − − 2017 111,040,221 − − −
Interest income 2018 16,248,015 2,506,348 − −
2017 41,933,966 1,869,568 − −
Saving and current accounts
2018 406,217,710 − − 1,159,895,969 noninterest-bearing; settled in cash; unguaranteed; unsecured, no impairment 2017 (2,061,279,232) − − 753,678,258
(Forward)

1212018 annual report
- 56 -
*SGVFS034462*
Outstanding Balance
Amount of transaction
Cash and investment
Category Year during the year Due From Due to Accounts Terms and condition HTM Financial Assets
2018 P=16,125,000 P=1,469,167 P=− P=300,000,000 interest-bearing, unguaranteed; unsecured; unrestricted
2017 16,125,000 1,469,167 − 300,000,000
Association Dues, 2018 3,569,776 320,251 44,828 − utilities and others 2017 3,814,928 558,889 1,598,052 −
Retirement plan Advances 2018 99,955,151 − − −
2017 32,482,381 − − −
Fixed Rate Bond 2018 50,000,000 − − 50,000,000 interest-bearing at 7.061% per annum; payable quarterly; two-year bond; unguaranteed; unsecured
TOTAL 2018 P=3,223,796,807 P=4,856,221 P=41,226,593 P=2,429,979,612 TOTAL 2017 (P=253,720,159) P=106,130,358 P=41,040,491 P=2,029,767,944 *The Parent Company’s subsidiaries are disclosed in Note 28..
Transactions and balances between the Parent Company and the subsidiaries have been eliminated in the consolidation.
b. On May 20, 2017, the Parent Company and UBP formally launched “Union for Life”, a unique bancassurance partnership, where UBP and its wholly-owned subsidiary, CitiSavings Bank, will distribute and sell the insurance products of the Parent Company to its bank clients.
c. Savings and current accounts and short-term investments maintained with UBP, an associate:
2018 2017 Savings and current accounts P=470,964,175 P=403,988,448 Special savings accounts 688,931,794 349,689,811 P=1,159,895,969 P=753,678,259
d. In November 2014, the Group availed of the subordinated notes issued by UBP. These investments,
classified as HTM financial assets, earned interests amounting to P=16,125,000 in both 2018 and 2017 respectively. The carrying value and fair value of these subordinated notes amounted to P=300,000,000 in both 2018 and 2017.
e. Key management personnel include all officers that have ranks of vice president and up.
Compensation of key management personnel is summarized below:
2018 2017 Salaries and other short-term employee benefits P=289,490,623 P=284,953,227 Post-employment and other long-term benefits 44,767,748 31,422,464 P=334,258,371 P=316,375,691

122 Reimagining Today Building the FuTure
- 57 -
*SGVFS034462*
27. Lease Commitments
The Group has entered into noncancelable leases with terms ranging between one month and fifteen years, both as lessee and as lessor. Most leases include a clause to enable upward revision of the rental charge on an annual basis based on contract.
a. Operating lease commitments - the Group as lessee
The future minimum rentals payable under non-cancelable operating leases follows:
2018 2017 Within one year P=14,636,339 P=12,869,594 After one year but not more than five years 19,900,357 24,375,000 More than five years 1,465,237 2,051,332 P=36,001,933 P=39,295,926
Rent expense recognized in 2018 and 2017 amounted to P23,939,465 and P23,832,263, respectively (Note 20).
b. Operating lease commitments - the Group as lessor
The future minimum rentals receivable under non-cancelable operating leases follows:
2018 2017 Within one year P=501,597,185 P=342,306,993 After one year but not more than five years 947,904,616 646,348,803 P=1,449,501,801 P=988,655,796
Rent income recognized in 2018 and 2017 amounted to P=639,740,070 and P=428,126,462, respectively.
28. Group Information and Non-controlling Interest
The Group comprises the Parent Company and its subsidiaries. Among the Group’s subsidiaries, IIC and ILMADECO are intermediate parents of their respective subsidiaries. IPI and IPVI are wholly-owned subsidiaries of IIC; while, ILACGA is a wholly-owned subsidiary of ILMADECO. The Parent Company’s subsidiaries are all incorporated and based in Philippines (i.e., principal place of business). The Parent Company’s subsidiaries are engaged in the following activities: Subsidiaries Date of Incorporation Nature of Business IIC September 5, 1989 Investment banking in the areas of corporate
finance, money market, and securities underwriting
IPI May 31, 1994 Development and sale of real estate IPVI May 31, 1994 -do-
I-Care October 14, 1991 Provision of medical and managed care services and facilities to its members
ILMADECO 1987 Holding organization of ILACGA ILACGA November 11, 2003 Provision of nonlife general insurance
(Forward)

1232018 annual report
- 58 -
*SGVFS034462*
Subsidiaries Date of Incorporation Nature of Business ILPHI March 23, 1998 Development and sale of real estate Home Credit April 1, 1932 Accumulation of savings of its stockholders and
members and lending of funds to them under a housing program
For the relevant corporate information of the Group’s associates, refer to Note 7. The Parent Company is subject to statutory regulations on Risk-Based Capital (RBC2) and other externally imposed capital requirements (Note 32). All asset investments of the Parent Company require approval from the IC. The Parent Company submits annual financial statements to the IC to determine adequacy of the Parent Company’s investments. IC classifies assets according to admitted and non-admitted assets for the purpose of calculating financial ratios that the Parent Company is required to maintain. These, among others, pose restrictions as to the use or transfer of assets within the Group, as well as, the settlement of liabilities as of December 31, 2018 and 2017.
The Parent Company is not subject (i.e., under guarantyship, suretyship, or other similar arrangements) to any contingent liability, or capital or purchase commitments as of December 31, 2018 and 2017.
The subsidiaries, except I-Care, have no contingent liabilities (other than disclosed in Note 32) or capital commitments as of December 31, 2018 and 2017 and are not subject to restrictions (i.e., whether through legal, contractual, or discretionary restrictions) as to the use or transfer of their assets within the Group, or settlement of liabilities. IC, I-Care’s lead regulator, sets and monitors the capital requirements of I-Care. In implementing current capital requirements, the IC requires I-Care to maintain a minimum capital amount, minimum deposit to IC, minimum net worth, prescribed acid test ratio and a prescribed ratio of qualifying capital to gross membership fees. These, among others, may impose significant restrictions as to the use or transfer of assets or the settlement of liabilities as of December 31, 2018 and 2017. While IIC is subject to the minimum capital requirements imposed by SEC, the compliance with the said regulation does not pose significant restrictions as the use or transfer of assets within the Group or the settlement of liabilities as of December 31, 2018 and 2017. The Group’s non-controlling interest as of December 31 pertains to the preferred and common shareholders of Home Credit as presented on the next page:
2018 2017 Preferred shareholders’ interest: Beginning balance P=154,561,745 P=154,388,719 Issuances during the year 9,594 64,897,464 Redemption during the year − (64,724,438) Sale of Home Credit (154,571,339) − − 154,561,745 Common shareholders’ interest Beginning balance 6,266 13,138 Share in the total comprehensive income
during the year
(2,116)
(6,872) Sale of Home Credit (4,150) − 6,266 P=− P=154,568,011

124 Reimagining Today Building the FuTure
- 59 -
*SGVFS034462*
Home Credit’s preferred stocks consist of Serial Preferred “A” shares, Serial Preferred “A-1” shares, Serial Preferred “B” shares and Serial Preferred “C” shares. Serial Preferred A shares and Serial Preferred A-1 shares are entitled to cumulative dividend per annum at the rate of not more than 20% payable quarterly before any dividends are paid to the common shares, but shall not participate in any further dividends declared by Home Credit. Prior to 2008, all Serial Preferred B shares are redeemable at any time at the option of the holders. Under PAS 32, the redeemable preferred shares qualify as a financial liability and are included as part of “Accrued expenses and other liabilities” account in the consolidated statements of financial position. In 2008, Home Credit amended the features of the Serial Preferred B shares to provide that the right to redeem for the preferred shares were at the discretion of Home Credit. With the foregoing change, the preferred shares subscribed subsequently qualify as equity instruments under PAS 32 and are included as part of “Equity attributable to non-controlling interest” in the consolidated statements of financial position. The following are the features of Home Credit’s Serial Preferred B shares:
a. Has a par value of 200 per share; b. Payable in installments over a period of not more than 7 years, subject to forfeiture if in arrears
for more than six months and when approved by the BOD; c. Non-voting except in cases outlined by the Corporation Code of the Philippines; d. Non-transferable except for Home Credit; e. Redeemable at the option of Home Credit; and f. Entitled to cumulative dividends as determined and approved by the BOD.
Dividends declared to the preferred shareholders of Home credit amounted to P=12,598,370 and P=6,697,397 in 2018 and 2017, respectively. On December 19, 2018, the Company entered into a Share Purchase Agreement with Fountel Corp. for the sale of Company’s holdings in Home Credit for a consideration of P=5 million. On the same date, the Parent Company losses its control over Home Credit. The loss on deconsolidation amounted to P=5,715,649 under other losses (Note 22).
29. Other Income
Other income includes management fees, amendment fees, cancellation fees, handling fees and reinsurance fees.
1252018 annual report
- 60 -
*SGVFS034462*
30. Fair Value Measurement
The following methods and assumptions were used to estimate the fair value of each class of financial instruments: The following are short term in nature; hence, the carrying value approximates the fair value: Cash and cash equivalents; Short term investments; Insurance receivable; Loans and receivable under “Financial assets” account including:
Policy loans; Accounts receivable; Interest receivable; Due from agents; and Other receivables;
Other insurance liabilities; and Accrued expenses and other liabilities excluding taxes and other statutory liabilities.
Equity Securities The fair values of equity securities are based on closing prices as published by the PSE. Fair value of the unquoted equity security was valued using the adjusted net asset value method.
Debt Securities The fair values of debt securities are based on quoted prices. For unquoted debt securities, where fair value is not reasonably determinable, fair values are estimated using the discounted cash flow technique that makes use of market rates. Structured VULs The fair value of structured notes has been computed by counterparties using present value calculations and option pricing models as applicable. The valuation requires management to make certain assumptions about the model inputs particularly the credit spread of the issuer. Term, Mortgage, Housing and Car Financing Loans For disclosure purposes, fair values of these loans are estimated using the discounted cash flow technique that makes use of the Group’s incremental lending rates for similar types of instruments. Market rates for term and mortgage loans ranged from 6.66% to 7.25% and from 2.60% to 5.57% in 2018 and 2017, respectively, while the market rates for housing and car financing loans ranged from 13.33% to 17.41% in 2018 and from 8.53% to 15.33% in 2017. Legal Policy Reserves The carrying amounts of legal policy reserves reflect the statutory reserves. Derivative Liability The fair value of the derivative liability is calculated by the issuer through valuation models, including present value calculations and option pricing models, that incorporate various observable market inputs including interest rate curves and foreign exchange rates prevailing at financial reporting date. The following tables show analysis of financial instruments at fair value by level of the fair value hierarchy as of December 31:
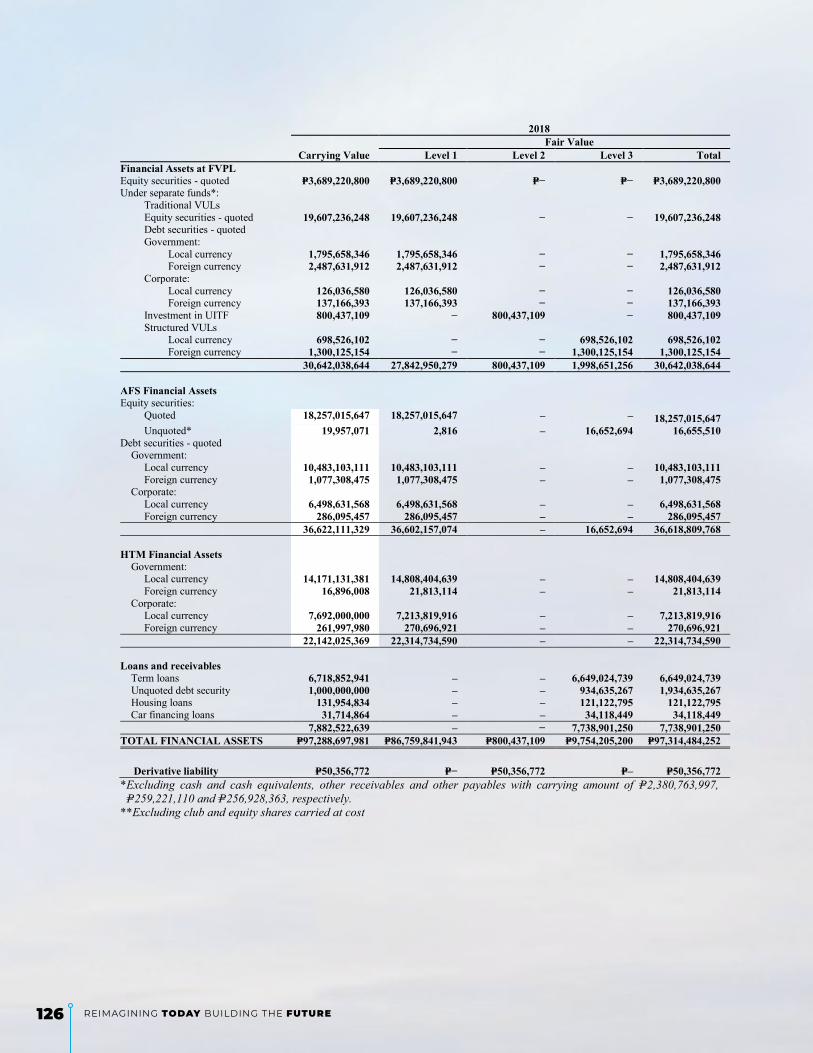
126 Reimagining Today Building the FuTure
- 61 -
*SGVFS034462*
2018 Fair Value Carrying Value Level 1 Level 2 Level 3 Total Financial Assets at FVPL Equity securities - quoted P=3,689,220,800 P=3,689,220,800 P=− P=− P=3,689,220,800 Under separate funds*: Traditional VULs Equity securities - quoted 19,607,236,248 19,607,236,248 − − 19,607,236,248 Debt securities - quoted Government: Local currency 1,795,658,346 1,795,658,346 − − 1,795,658,346 Foreign currency 2,487,631,912 2,487,631,912 − − 2,487,631,912 Corporate: Local currency 126,036,580 126,036,580 − − 126,036,580
Foreign currency 137,166,393 137,166,393 − − 137,166,393 Investment in UITF 800,437,109 − 800,437,109 − 800,437,109 Structured VULs Local currency 698,526,102 − − 698,526,102 698,526,102 Foreign currency 1,300,125,154 − − 1,300,125,154 1,300,125,154 30,642,038,644 27,842,950,279 800,437,109 1,998,651,256 30,642,038,644 AFS Financial Assets Equity securities: Quoted 18,257,015,647 18,257,015,647 – – 18,257,015,647 Unquoted* 19,957,071 2,816 – 16,652,694 16,655,510 Debt securities - quoted Government: Local currency 10,483,103,111 10,483,103,111 – – 10,483,103,111 Foreign currency 1,077,308,475 1,077,308,475 – – 1,077,308,475 Corporate: Local currency 6,498,631,568 6,498,631,568 – – 6,498,631,568 Foreign currency 286,095,457 286,095,457 – – 286,095,457 36,622,111,329 36,602,157,074 – 16,652,694 36,618,809,768 HTM Financial Assets Government: Local currency 14,171,131,381 14,808,404,639 – – 14,808,404,639 Foreign currency 16,896,008 21,813,114 – – 21,813,114 Corporate: Local currency 7,692,000,000 7,213,819,916 – – 7,213,819,916 Foreign currency 261,997,980 270,696,921 – – 270,696,921 22,142,025,369 22,314,734,590 – – 22,314,734,590 Loans and receivables Term loans 6,718,852,941 – – 6,649,024,739 6,649,024,739 Unquoted debt security 1,000,000,000 – – 934,635,267 1,934,635,267 Housing loans 131,954,834 – – 121,122,795 121,122,795 Car financing loans 31,714,864 – – 34,118,449 34,118,449 7,882,522,639 – − 7,738,901,250 7,738,901,250 TOTAL FINANCIAL ASSETS P=97,288,697,981 P=86,759,841,943 P=800,437,109 P=9,754,205,200 P=97,314,484,252
Derivative liability P=50,356,772 P=− P=50,356,772 P=– P=50,356,772 *Excluding cash and cash equivalents, other receivables and other payables with carrying amount of P=2,380,763,997, P=259,221,110 and P=256,928,363, respectively. **Excluding club and equity shares carried at cost

1272018 annual report
- 62 -
*SGVFS034462*
2017 Fair Value Carrying Value Level 1 Level 2 Level 3 Total Financial Assets at FVPL Equity securities - quoted P=3,995,369,950 P=3,995,369,950 P=– P=– P=3,995,369,950 Under separate fund*: Traditional VUL Equity securities - quoted 18,393,177,822 18,393,177,822 – 18,393,177,822 Debt securities - quoted Government: Local currency 1,821,846,029 1,821,846,029 – – 1,821,846,029 Foreign currency 2,517,351,149 2,517,351,149 – – 2,517,351,149 Corporate: Local currency 145,353,726 145,353,726 – – 145,353,726 Foreign currency 135,357,725 135,357,725 – – 135,357,725 Investment in UITF 398,561,064 398,561,064 398,561,064 Structured VULs Local currency 702,944,015 – – 702,944,015 702,944,015 Foreign currency 1,246,422,798 – – 1,246,422,798 1,246,422,798 29,356,384,278 27,008,456,401 398,561,064 1,949,366,813 29,356,384,278 AFS Financial Assets Equity securities: Quoted 22,388,131,569 22,388,131,569 – – 22,388,131,569 Unquoted** 19,293,982 – – 15,586,606 15,586,606 Debt securities - quoted Government: Local currency 10,625,852,326 10,625,852,326 – – 10,625,852,326 Foreign currency 961,368,389 961,368,389 – – 961,368,389 Corporate: Local currency 5,893,252,827 5,893,252,827 – – 5,893,252,827 Foreign currency 286,741,238 286,741,238 – – 286,741,238 40,174,640,331 40,155,346,349 − 15,586,606 40,170,932,955 HTM Financial Assets Government: Local currency 14,389,383,053 16,948,204,515 – – 16,948,204,515 Foreign currency 16,097,714 21,345,078 – – 21,345,078 Corporate: Local currency 7,692,000,000 7,755,822,474 – – 7,755,822,474 Foreign currency 247,742,335 255,698,118 – – 255,698,118 22,345,223,102 24,981,070,185 – – 24,981,070,185 Loans and receivables Term loans 7,837,759,412 – – 8,271,267,689 8,271,267,689 Housing loans 145,913,064 – – 133,008,320 133,008,320 Car financing loans 39,941,820 – – 39,747,048 39,747,048 8,023,614,296 – – 8,444,023,057 8,444,023,057 TOTAL FINANCIAL ASSETS P=99,899,862,007 P=92,144,872,935 P=398,561,064 P=10,408,976,476 P=102,952,410,475 Derivative financial liability P=35,908,235 P=– P=35,908,235 P=– P=35,908,235 *Excluding cash and cash equivalents, other receivables and other payables with carrying amount of P=2,836,742,122, P=136,793,924 and P=297,311,366, respectively. **Excluding club and equity shares carried at cost
The following table shows the reconciliation of the beginning and ending balances of Level 3 AFS financial assets and financial assets at FVPL as of December 31:
Financial assets at FVPL Peso Beginning balance P=702,944,015 P=667,239,570 Fair value gain (loss) (4,417,913) 35,704,445 Ending balance 698,526,102 702,944,015

128 Reimagining Today Building the FuTure
- 63 -
*SGVFS034462*
USD Beginning balance 1,246,422,798 1,194,709,761 Fair value gain (loss) 50,923,716 48,966,679 Foreign exchange adjustments 2,778,640 2,746,358 Ending balance 1,300,125,154 1,246,422,798 Total financial assets at FVPL P=1,998,651,256 P=1,949,366,813
2018 2017 AFS financial assets: Beginning balance P=15,586,606 P=32,730,339 Fair value gain (loss) 663,088 (17,143,733) Ending balance 16,249,694 15,586,606
In 2018 and 2017, no transfers were made among the three levels in the fair value hierarchy.
Structured VULs Fair value of structured notes has been computed by counterparties using present value calculations and option pricing models as applicable. The management performs an independent testing to validate the reasonableness of counterparty values. The sensitivity analysis requires management to make certain assumptions about the model inputs particularly the credit spread of the issuer. Market observable inputs used in the sensitivity analysis include credit default swap (CDS) of the Republic of the Philippines, USD interest rate swap rates (IRS) (for the USD denominated issuances) and USD/PHP cross currency swap rates (for the PHP-denominated issuances).
The sensitivity analysis of the fair market value of the structured notes as of December 31 is performed for the reasonable possible movement in the significant inputs with all other variables held constant, showing the impact to profit and loss in the table below:
Significant observable input
other than quoted prices Range level Sensitivity of the included within Level 1 at yearend input to fair value 2018 ROP CDS level 88 basis points 50 basis points increase or decrease in ROP CDS
would result in the decrease and increase in market value of the note by P=11,704,273 and P=11,923,512, respectively.
(3yrs-8yrs)
USD IRS 255-259 basis
points 50 basis points increase or decrease in USD IRS would result in the decrease and increase in market value of the note by P=12,459,183 and P=12,684,129, respectively.
(3yrs-8yrs)
PHP IRS 543-560 basis
points 50 basis points increase or decrease in PHP IRS would result in the decrease and increase in market value of the note by P=5,532,261 and P=5,608,461, respectively.
(1yr-6yrs)
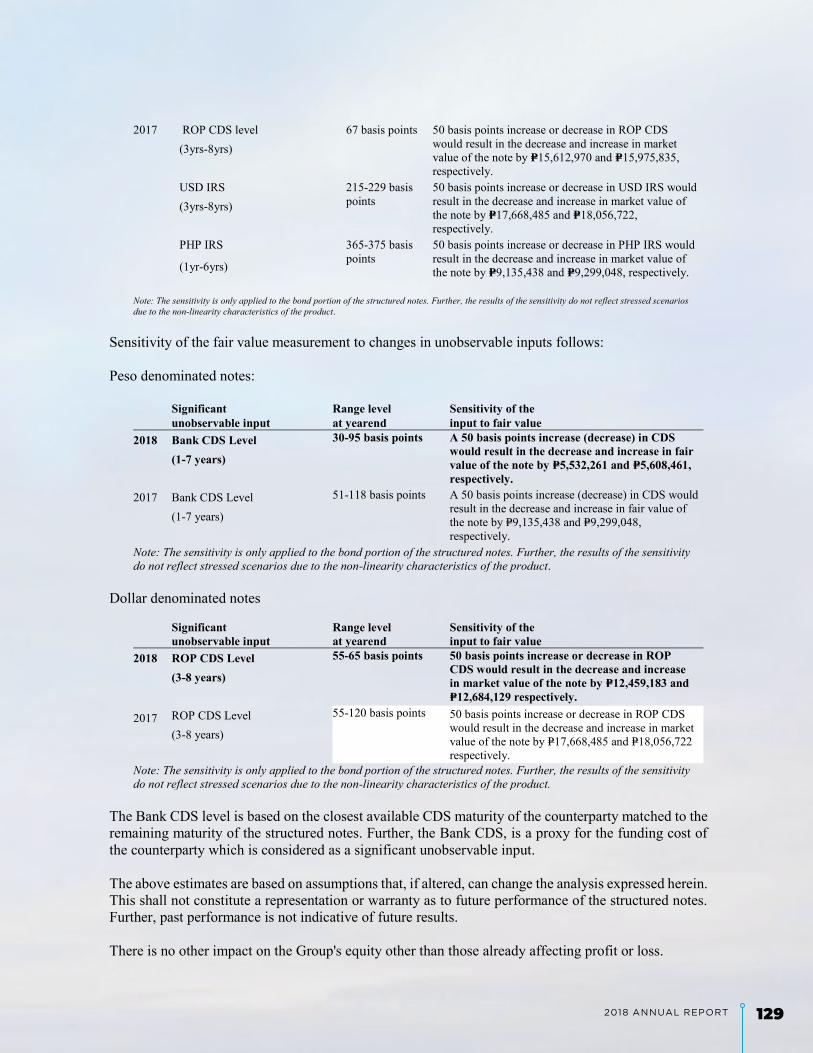
1292018 annual report
- 64 -
*SGVFS034462*
2017 ROP CDS level 67 basis points 50 basis points increase or decrease in ROP CDS
would result in the decrease and increase in market value of the note by P=15,612,970 and P=15,975,835, respectively.
(3yrs-8yrs)
USD IRS 215-229 basis
points 50 basis points increase or decrease in USD IRS would result in the decrease and increase in market value of the note by P=17,668,485 and P=18,056,722, respectively.
(3yrs-8yrs)
PHP IRS 365-375 basis
points 50 basis points increase or decrease in PHP IRS would result in the decrease and increase in market value of the note by P=9,135,438 and P=9,299,048, respectively.
(1yr-6yrs) Note: The sensitivity is only applied to the bond portion of the structured notes. Further, the results of the sensitivity do not reflect stressed scenarios due to the non-linearity characteristics of the product.
Sensitivity of the fair value measurement to changes in unobservable inputs follows: Peso denominated notes:
Significant Range level Sensitivity of the unobservable input at yearend input to fair value 2018 Bank CDS Level 30-95 basis points A 50 basis points increase (decrease) in CDS
would result in the decrease and increase in fair value of the note by P=5,532,261 and P=5,608,461, respectively.
(1-7 years)
2017 Bank CDS Level 51-118 basis points A 50 basis points increase (decrease) in CDS would result in the decrease and increase in fair value of the note by P=9,135,438 and P=9,299,048, respectively.
(1-7 years)
Note: The sensitivity is only applied to the bond portion of the structured notes. Further, the results of the sensitivity do not reflect stressed scenarios due to the non-linearity characteristics of the product.
Dollar denominated notes
Significant Range level Sensitivity of the unobservable input at yearend input to fair value 2018 ROP CDS Level 55-65 basis points 50 basis points increase or decrease in ROP
CDS would result in the decrease and increase in market value of the note by P=12,459,183 and P=12,684,129 respectively.
(3-8 years)
2017 ROP CDS Level 55-120 basis points 50 basis points increase or decrease in ROP CDS would result in the decrease and increase in market value of the note by P=17,668,485 and P=18,056,722 respectively.
(3-8 years)
Note: The sensitivity is only applied to the bond portion of the structured notes. Further, the results of the sensitivity do not reflect stressed scenarios due to the non-linearity characteristics of the product.
The Bank CDS level is based on the closest available CDS maturity of the counterparty matched to the remaining maturity of the structured notes. Further, the Bank CDS, is a proxy for the funding cost of the counterparty which is considered as a significant unobservable input. The above estimates are based on assumptions that, if altered, can change the analysis expressed herein. This shall not constitute a representation or warranty as to future performance of the structured notes. Further, past performance is not indicative of future results.
There is no other impact on the Group's equity other than those already affecting profit or loss.

130 Reimagining Today Building the FuTure
- 65 -
*SGVFS034462*
Investment in a holding company The Company has investments in a holding company’s (the “investee-holding company”) shares of stock included in available-for-sale investments which are not quoted in the market as of December 31, 2018 and 2017. The investee-holding company was valued using adjusted net asset method in 2018 and 2017 since majority of its net assets are carried at fair value. The carrying value of the investment in a holding company amounted to P=16,249,694 and P=15,586,606 as of December 31, 2018 and 2017, respectively. Increases (decreases) in the net book value per share would result in a higher (lower) fair value measurement. Fair value disclosure under the Amendments to PFRS 4 The table below presents an analysis of the fair value of classes of financial assets of the Group as of December 31, 2018, as well as the corresponding change in fair value for the year then ended. The financial assets are divided into two categories:
Assets for which their contractual cash flows represent solely payments of principal and interest
(SPPI), excluding any financial assets that are held for trading or that are managed and whose performance is evaluated on a fair value basis; and
All financial assets other than those specified in SPPI above (i.e. those for which contractual cash
flows do not represent SPPI, assets that are held for trading and assets that are managed and whose performance is evaluated on a fair value basis).
SPPI financial assets Other financial assets Fair value Fair value change Fair value Fair value change Financial assets at FVPL Equity securities - quoted P=− P=− P=3,689,220,800 (P=306,149,150) Under separate fund: Traditional VULs: Cash and cash equivalents* − − 2,652,349,383 − Equity securities − − 20,407,673,357 (2,726,214,322) Debt securities − − 4,546,493,231 (174,379,616) Other receivables − − 259,221,110 − Other payables − − (256,928,363) − Structured VULs − − 1,998,651,256 49,284,442 Available-for-sale financial assets Equity securities − − 18,276,972,718 (8,414,992,243) Debt securities 18,345,138,611 (1,844,058,663) − − Held-to-maturity financial assets 22,314,734,590 (2,793,786,549) − − Loans and receivables Cash and cash equivalents 2,836,737,443 − − − Term loans 6,649,024,739 (551,683,038) − − Policy loans 5,243,586,976 − − − Unquoted debt securities 934,635,267 (65,364,733) − − Housing loans 121,122,795 (11,910,693) − − Car financing loans 34,118,449 (4,767,870) − − Others 2,337,323,379 − − − P=58,816,422,249 (P=5,271,571,546) P=51,573,653,492 (11,572,450,889)
All financial assets under VULs are managed on a fair value basis. Accordingly, these are all presented under “Other financial assets” in the above table. For disclosures related to credit quality of SPPI financial assets, refer to Note 29

1312018 annual report
- 66 -
*SGVFS034462*
31. Insurance and Financial Risk Management
The primary objective of the Group’s risk and financial management framework is to protect the Group’s policyholders from events that hinder the sustainable achievement of financial performance objectives, including failing to exploit opportunities. Key management recognizes the critical importance of having efficient and effective risk management systems in place. The Group has established a risk management function with clear terms of reference from the BOT, its committees, and the associated executive management committees. This is supplemented with a clear organizational structure with documented delegated authorities and responsibilities from the BOT to executive management committees and senior managers. Lastly, a group policy framework which sets out the risk profiles for the Group, risk management, control, and business conduct standards for the Group’s operations has been put in place. Each policy has a member of senior management charged with overseeing compliance with the policy throughout the Group. The BOT approves the Group risk management policies and meets regularly to approve any commercial, regulatory, and organizational requirements of such policies. These policies define the Group’s identification of risk and its interpretation, limit structure to ensure the appropriate quality and diversification of assets, align underwriting and reinsurance strategy to the corporate goals, and specify reporting requirements. Regulatory Framework A substantial portion of the Group’s long term insurance business comprises policies where the investment risk is borne by policyholders. Risk attributable to policyholders is actively managed keeping in view their investment objectives and constraints. IC, the Group’s leading regulator, is interested in protecting the rights of the policyholders and maintains close vigil to ensure that the Group is satisfactorily managing its affairs for their benefit. At the same time, the IC is also interested in ensuring that the Group maintains an appropriate solvency position to meet liabilities arising from claims and that the risks are at acceptable levels. The operations of the Group are also subject to the regulatory requirements of the IC. Such regulations not only prescribe approval and monitoring of activities but also impose certain restrictive provisions, e.g., capital adequacy, to minimize the risk of default and insolvency on the part of the insurance companies to meet the unforeseen liabilities as these arise.
31.1. Insurance Risk
The risk under an insurance contract is the possibility of occurrence of an insured event and uncertainty of the amount and timing of the resulting claim. The principal risk the Group faces under such contracts is that the actual claims and benefit payments exceed the carrying amount of insurance liabilities. The risks associated with the life insurance contracts are underwriting risk and investment risk.

132 Reimagining Today Building the FuTure
- 67 -
*SGVFS034462*
31.1.1. Underwriting risk Underwriting risk represents the exposure to loss resulting from actual policy experience adversely deviating from assumptions made in the product pricing. Underwriting risks are brought about by a combination of the following: • Mortality risk - risk of loss arising due to policyholder death experience being
different than expected; and • Morbidity risk - risk of loss arising due to policyholder health experience being
different than expected.
The variability of risks is improved by diversification of risk of loss to a large portfolio of insurance contracts as a more diversified portfolio is less likely to be affected across the board by a change in any subset of the portfolio. The variability of risks is also improved by careful selection and implementation of underwriting strategies and guidelines. The business of the Group primarily comprises life insurance contracts. For contracts where death is the insured risk, the significant factors that could increase the overall frequency of claims are epidemics, widespread changes in lifestyle, and natural disasters, thus resulting in earlier or more claims than expected. These risks currently do not vary significantly in relation to the location of the risk insured by the Group while undue concentration by amounts could have an impact on the severity of benefit payments on a portfolio basis. There are no mitigating terms and conditions that reduce the insured risk accepted for contracts with fixed and guaranteed benefits and fixed future premiums.
The Group has an objective to control and minimize insurance risk and to reduce volatility of operating profits. The Group manages insurance risk through the following mechanism: the use and maintenance of management information systems that provide up to date,
accurate and reliable data on risk exposure at any point in time; actuarial models based on past experience and statistical techniques aid in pricing
decisions and monitoring claims patterns; guidelines are issued for concluding insurance contracts and assuming insurance risks; pro-active claims handling procedures are followed to investigate and adjust claims,
thereby preventing settlement of dubious or fraudulent claims; reinsurance is used to limit the Group’s exposure to large claims by placing risk with
reinsurers providing high security; diversification is accomplished by achieving sufficiently large population of risks to
reduce the variability of the expected outcome. The diversification strategy seeks to ensure that underwritten risks are well diversified in terms of type and amount of risk, industry and geography; and
the mix of insurance assets is driven by the nature and term of insurance liabilities. The management of assets and liabilities is closely monitored to attempt to match the expected pattern of claim payments with the maturity dates of assets.
Insurance risk is also affected by the policyholders’ rights to terminate the contract, pay reduced premiums, refuse to pay premiums, or avail of the guaranteed annuity option. Thus, the resultant insurance risk is subject to the policyholders’ behavior and decisions.

1332018 annual report
- 68 -
*SGVFS034462*
The Group’s concentration of insurance risk before and after reinsurance in relation to the type of insurance contract based on sum assured is as follows:
2018 2017 Whole Life Gross P=89,927,538,362 P=92,107,078,066 Net 80,327,013,560 82,091,383,960 Endowment Gross 24,510,668,857 24,992,460,199 Net 22,916,273,521 23,308,985,645 Term Insurance Gross 6,603,343,328 7,578,250,273 Net 6,459,407,306 7,364,850,845 Group Insurance Gross P=144,043,301,292 P=83,212,537,280 Net 120,104,381,830 59,923,598,078 Variable Life Gross 95,157,133,998 71,446,279,552 Net 77,361,316,612 58,989,386,073 Total Gross 360,241,985,837 P=279,336,605,370 Net P=307,168,392,829 P=231,678,204,601
31.1.2. Life Insurance Contracts
a. Assumptions Material judgment is required in determining the liabilities and in the choice of assumptions relating to insurance contracts. Assumptions in use are based on past experience, current internal data and conditions, and external market indices and benchmarks, which reflect current observable market prices and other published information. Such assumptions are determined as appropriate at inception of the contract. Assumptions are further evaluated on a continuous basis in order to ensure realistic and reasonable valuations. Assumptions are subject to the provisions of the Code and guidelines set forth by the IC.
b. Terms
Life insurance contracts offered by the Group mainly include whole life, endowments, term insurance, group insurance, and variable insurance.
Whole life and term insurance are conventional products where lump sum benefits are payable upon death of insured. Endowment products are investments/savings products where lump sum benefits are payable after a fixed period or upon death before the period is completed.
Group insurance policies are yearly renewable life plan products issued to corporate accounts that provide the beneficiaries of the insured employee cash proceeds in the event of the employee’s death.
Variable life products provide, in addition to life insurance coverage, living benefit where payments are linked to units of an investment fund set up by the Company from the premiums paid by the policyholders.
134 Reimagining Today Building the FuTure
- 69 -
*SGVFS034462*
For legal policy reserves, the following assumptions are used:
a. Mortality and morbidity rates Assumptions on mortality and morbidity are based on the Group’s actual experience. Rates are differentiated by age, underwriting class and product type. For life insurance policies, increased mortality rates would lead to larger number of claims and claims occurring sooner than anticipated, increasing the expenditure and reducing profits for stakeholders.
b. Discount rates
Discount rates relate to the time value of money. These are based on the risk-free discount rates prescribed by IC. An increase (decrease) in discount rate would result in decrease (increase) in liability that needs to be set up to meet obligations to policyholders.
c. Expenses
Operating expense assumptions reflect the projected costs of maintaining and servicing in force policies and associated overhead expenses. The current level of expense is adjusted for inflation in the future. An increase in the level of expense would result in an increase in expenditure thereby reducing profits for the stakeholders.
d. Lapses rates
Assumptions on lapse are based on the Group’s actual experience. These are differentiated by product type, annual premium level and duration of the policy. Higher lapse rates on lapse-supported products would translate to a decrease in the reserves that needs to be set-up.
31.1.3. Reinsurance Contracts
a. Terms and Assumptions The Group limits its exposure to loss within insurance operations through participation in reinsurance arrangements. The majority of the business ceded is placed on excess share basis with retention limits varying by issue age and underwriting classification.
Even though the Group may have reinsurance arrangements, it is not relieved of its direct obligation to its policyholders. Thus, a credit exposure exists with respect to reinsurance ceded, to the extent that any reinsurer is unable to meet its obligations assumed under such reinsurance agreements.
The Group is neither dependent on a single reinsurer nor are the operations of the Group substantially dependent upon any reinsurance contract.
b. Sensitivities The application of the MfAD in the assumptions ensure that the resulting legal policy reserves will be sufficient. The scenarios tested involved increasing and decreasing one type of assumption by the recommended minimum MfAD while retaining the others constant at the original base run results.
31.2. Financial Risk
The Group is exposed to financial risk through its financial assets, financial liabilities, insurance assets, and insurance liabilities. In particular, the key financial risk that the Group is exposed to is that proceeds from its financial assets are not sufficient to fund the obligations arising from

1352018 annual report
- 70 -
*SGVFS034462*
its insurance contracts. The most important components of this financial risk are credit risk, liquidity risk, and market risk.
These risks arise from open positions in interest rate, currency, and equity products, all of which are exposed to general and specific market movements.
The Group has guidelines and procedures on fixed and equity investments. On fixed investments, the Group has to place its investment portfolio in negotiable instruments that will give high-yield, low-risks return without sacrificing the IC and the Group’s requirements. The IC requirements state that the investment in fixed instruments shall only come from financial institutions or corporate entities with acceptable ratings from PhilRatings, or at least the rank is within the top 15, in case of banks. Meanwhile, investment in negotiable instruments involving reserve and surplus investments shall follow the guidelines set by the Code (Note 32). On equity investments, the Group has to place its investment portfolio in equity market that will give high-yield, low-risks return taking into account the IC and Group’s requirements.
31.2.1. Credit risk
Credit risk is the risk that one party to a financial instrument will fail to discharge an obligation and cause the other party to incur a financial loss.
Key areas where the Group is exposed to credit risk pertain to the amounts due from the following:
Reinsurers in respect of unpaid claims; Reinsurers in respect of claims already paid; Financial assets at FVPL; AFS financial assets; Loans and receivables; HTM financial assets;and Counterparty bank default on CCS agreement.
Risk Concentrations of the Maximum Exposure to Credit Risk The Group structures the levels of credit risk it accepts by placing limits on its exposure to a single counterparty, or groups of counterparty, and to geographical and industry segments. Such risks are subject to an annual or more frequent review. Limits on the level of credit risk by category and territory are approved by the Division Heads. The following table analyses the Group’s concentration of credit risk in the Group’s debt securities portfolio by industrial distribution as percentage of total debt securities:
2018 2017 Property 32% 32% Holding firms 25% 24% Electricity, energy, power, and water 16% 15% Financial institutions 13% 10% Telecommunications 8% 8% Tollways operation and maintenance 3% 8% Food, beverage, and tobacco 2% 2% Others 1% 1% Total 100% 100%
136 Reimagining Today Building the FuTure
- 71 -
*SGVFS034462*
The Group has a significant concentration of credit risk with counterparties under the “Property” industry as of December 31, 2018 and 2017. Concentrations indicate the relative sensitivity of the Company’s performance to developments affecting a particular industry. Reinsurance is used to manage insurance risk. This does not, however, discharge the Group’s liability as primary insurer. If a reinsurer fails to pay a claim for any reason, the Group remains liable for the payment to the policyholder. The creditworthiness of reinsurers is considered on an annual basis by reviewing their financial strength prior to finalization of any contract. Reinsurance is placed with high rated counterparties and concentration of risk is avoided by following policy guidelines in respect of counterparties’ limits that are set each year and are subject to regular reviews. At each year-end, management performs assessment of creditworthiness of reinsurers to update reinsurance purchase strategies and ascertain a suitable allowance for impairment of reinsurance assets.
Individual operating units maintain records of the payment history for significant contract holders with whom they conduct regular business. The exposure to individual counterparties is also managed by other mechanisms, such as the right of offset where counterparties are both debtors and creditors of the Group. Internal audit makes regular reviews to assess the degree of compliance with the Group procedures on credit. Exposures to individual policyholders and groups of policyholders are collected within the ongoing monitoring of the controls associated with regulatory solvency. The Group manages the level of credit risk it accepts through a comprehensive group credit risk policy setting out the assessment and determination of what constitutes credit risk for the Group; setting up of exposure limits by each counterparty or group of counterparties, industry segments; right of offset where counterparties are both debtors and creditors; guidelines on obtaining collateral and guarantees; reporting of credit risk exposures and breaches to the monitoring authority; monitoring compliance with credit risk policy and review of credit risk policy for pertinence and changing environment.
Loans to policyholders, which are granted at amount not to exceed the policyholder’s cash surrender value, are netted off against the cash surrender values of policies and carry substantially no credit risk.
In respect of investment securities, the Group secures satisfactory credit quality by setting maximum limits of portfolio securities with a single issuer or group of issuers and setting the minimum ratings for each issuer or group of issuers.
The Group sets the maximum amounts and limits that may be advanced to/placed with individual corporate counterparties which are set by reference to their long term ratings.
Credit risk exposure in respect of all other counterparties is managed by setting standard business terms that are required to be met by all counterparties. Commissions due to intermediaries are netted off against amounts receivable from them to reduce the risk of doubtful debts. The credit risk in respect of customer balances, incurred on nonpayment of premiums or contributions, will only persist during the grace period specified in the policy document or trust deed on the expiry of which the policy is either paid up or terminated.

1372018 annual report
- 72 -
*SGVFS034462*
The maximum credit exposure of the financial assets of the Group is equal to their carrying value except for the following financial assets with collaterals (e.g., equity value, real estate), the financial effects of which are presented on the next below:
2018 2017 Housing loans P=115,484,289 P=102,948,059 Mortgage loans 22,761,821 195,653,816 Finance leases − 27,965,288 Stock loans − 13,410,613 Total P=138,246,110 P=339,977,776 Financial effect is the lower of the carrying value of the financial asset or the fair value of the collateral for each financial asset.
Collaterals obtained by the Group are investment properties upon default on mortgage loans and housing loans. The fair value of the collaterals obtained where the Group has the right by contract or custom to sell the assets amounted to P=281,511,263 and P=304,248,983 for housing loans and mortgage loans as of December 31, 2018 and 2017, respectively.
The Group uses a credit rating concept based on the borrowers’ and counterparties’ overall creditworthiness, as follows:
i. Investment grade - rating given to borrowers and counterparties who possess
strong to very strong capacity to meet their obligations. ii. Non-investment grade - rating given to borrowers and counterparties who possess
above average capacity to meet their obligations.
The tables below provide the credit quality of the Group's financial assets that are neither past due nor impaired as of December 31.
2018 Neither past due nor impaired
Investment
Grade Non-investment
Grade Past due but not
impaired Impaired Total Insurance receivables: Due premiums P=183,280,942 P=− P=− P=− P=183,280,942 Reinsurance assets − 4,667,364 − − 4,667,364 183,280,942 4,667,364 − − 187,948,306 Financial assets at FVPL: Quoted equity securities 19,607,236,248 − − − 19,607,236,248 Equity securities – quoted 3,689,220,800 − − − 3,689,220,800 Under separate fund: Traditional VULs: Cash and cash equivalents 2,380,763,997 − − − 2,380,763,997 Quoted debt securities Government: Local currency 1,795,658,346 − − − 1,795,658,346 Foreign currency 2,487,631,912 − − − 2,487,631,912 Corporate: Local currency 126,036,580 − − − 126,036,580 Foreign currency 137,166,393 − − − 137,166,393 Investment in UITF 800,437,109 − − − 800,437,109 Other receivables 259,221,110 − − − 259,221,110 Structured VULs: Local currency 698,526,102 − − − 698,526,102 Foreign currency 1,300,125,154 − − − 1,300,125,154 33,282,023,751 − − − 33,282,023,751 (Forward)

138 Reimagining Today Building the FuTure
- 73 -
*SGVFS034462*
2018 Neither past due nor impaired
Investment
Grade Non-investment
Grade Past due but not
impaired Impaired Total AFS financial assets: Equity securities: Quoted P=18,257,015,647 P=− P=− P=− P=18,257,015,647 Unquoted 19,957,071 − − − 19,957,071 Debt securities - fixed rates: Quoted: Government: Local currency 10,483,103,111 − − − P=10,483,103,111 Foreign currency 1,077,308,475 − − − 1,077,308,475 Corporate: Local currency 6,498,631,568 − − − 6,498,631,568 Foreign currency 286,095,457 − − − 286,095,457 36,622,111,329 − − − 36,622,111,329 HTM financial assets Government: Local currency 14,171,131,381 − − − 14,171,131,381 Foreign currency P=16,896,008 P=− P=− P=− P=16,896,008 Corporate: Local currency 7,692,000,000 − − − 7,692,000,000 Foreign currency 261,997,980 − − − 261,997,980 22,142,025,369 − − − 22,142,025,369 Loans and receivables: Cash and cash equivalents* 3,468,861,896 − − − 3,468,861,896 Term loans 6,718,852,941 − − − 6,718,852,941 Policy loans 5,243,586,976 − − − 5,243,586,976 Accounts receivable − 1,510,564,348 5,656,265 5,010,428 1,521,231,041 Unquoted bonds 1,000,000,000 1,000,000,000 Interest receivable 596,067,107 − − − 596,067,107 Housing loans 131,954,834 − − − 131,954,834 Car financing loans 31,714,864 − − − 31,714,864 Mortgage loans 1,878,772 11,505,628 583,189 85,506 14,053,095 Due from agents − 3,309,777 − 1,328,683 4,638,460 Others 1,209,218 187,083,596 18,589,403 5,779,423 212,661,640 17,194,126,608 1,712,463,349 24,828,857 12,204,040 18,943,622,854 P=109,423,567,999 P=1,717,130,713 P=24,828,857 P=12,204,040 P=111,177,731,609
*Excluding cash on hand as of December 31, 2018.
2017 Neither past due nor impaired
Investment
Grade Non-investment
Grade Past due but not
impaired Impaired Total Insurance receivables: Due premiums P=198,500,629 P=− P=− P=− P=198,500,629 Reinsurance assets − 3,810,102 − − 3,810,102 198,500,629 3,810,102 − − 202,310,731 Financial assets at FVPL: Quoted equity securities 18,393,177,822 − − − 18,393,177,822 Equity securities – quoted 3,995,369,950 − − − 3,995,369,950 Under separate fund: Traditional VULs: Cash and cash equivalents 2,836,742,122 − − − 2,836,742,122 Quoted debt securities Government: Local currency 1,821,846,029 − − − 1,821,846,029 Foreign currency 2,517,351,149 − − − 2,517,351,149 Corporate: Local currency 145,353,726 − − − 145,353,726 Foreign currency 135,357,725 − − − 135,357,725 Investment in UITF 398,561,064 − − − 398,561,064 Other receivables 136,793,924 − − − 136,793,924 Structured VULs: Local currency 702,944,015 − − − 702,944,015 Foreign currency 1,246,422,798 − − − 1,246,422,798 32,329,920,324 − − − 32,329,920,324 (Forward)
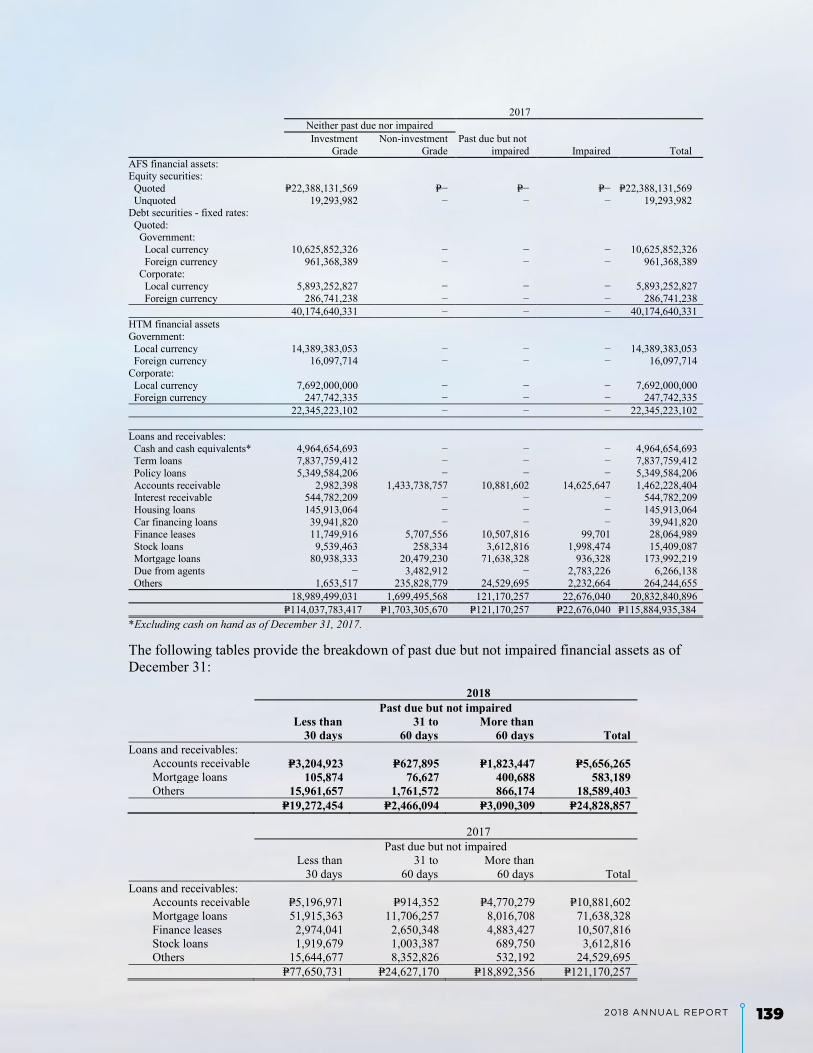
1392018 annual report
- 74 -
*SGVFS034462*
2017 Neither past due nor impaired
Investment
Grade Non-investment
Grade Past due but not
impaired Impaired Total AFS financial assets: Equity securities: Quoted P=22,388,131,569 P=− P=− P=− P=22,388,131,569 Unquoted 19,293,982 − − − 19,293,982 Debt securities - fixed rates: Quoted: Government: Local currency 10,625,852,326 − − − 10,625,852,326 Foreign currency 961,368,389 − − − 961,368,389 Corporate: Local currency 5,893,252,827 − − − 5,893,252,827 Foreign currency 286,741,238 − − − 286,741,238 40,174,640,331 − − − 40,174,640,331 HTM financial assets Government: Local currency 14,389,383,053 − − − 14,389,383,053 Foreign currency 16,097,714 − − − 16,097,714 Corporate: Local currency 7,692,000,000 − − − 7,692,000,000 Foreign currency 247,742,335 − − − 247,742,335 22,345,223,102 − − − 22,345,223,102 Loans and receivables: Cash and cash equivalents* 4,964,654,693 − − − 4,964,654,693 Term loans 7,837,759,412 − − − 7,837,759,412 Policy loans 5,349,584,206 − − − 5,349,584,206 Accounts receivable 2,982,398 1,433,738,757 10,881,602 14,625,647 1,462,228,404 Interest receivable 544,782,209 − − − 544,782,209 Housing loans 145,913,064 − − − 145,913,064 Car financing loans 39,941,820 − − − 39,941,820 Finance leases 11,749,916 5,707,556 10,507,816 99,701 28,064,989 Stock loans 9,539,463 258,334 3,612,816 1,998,474 15,409,087 Mortgage loans 80,938,333 20,479,230 71,638,328 936,328 173,992,219 Due from agents − 3,482,912 − 2,783,226 6,266,138 Others 1,653,517 235,828,779 24,529,695 2,232,664 264,244,655 18,989,499,031 1,699,495,568 121,170,257 22,676,040 20,832,840,896 P=114,037,783,417 P=1,703,305,670 P=121,170,257 P=22,676,040 P=115,884,935,384 *Excluding cash on hand as of December 31, 2017.
The following tables provide the breakdown of past due but not impaired financial assets as of December 31:
2018 Past due but not impaired
Less than
30 days 31 to
60 days More than
60 days Total Loans and receivables: Accounts receivable P=3,204,923 P=627,895 P=1,823,447 P=5,656,265 Mortgage loans 105,874 76,627 400,688 583,189 Others 15,961,657 1,761,572 866,174 18,589,403 P=19,272,454 P=2,466,094 P=3,090,309 P=24,828,857
2017 Past due but not impaired
Less than
30 days 31 to
60 days More than
60 days Total Loans and receivables: Accounts receivable P=5,196,971 P=914,352 P=4,770,279 P=10,881,602 Mortgage loans 51,915,363 11,706,257 8,016,708 71,638,328 Finance leases 2,974,041 2,650,348 4,883,427 10,507,816 Stock loans 1,919,679 1,003,387 689,750 3,612,816 Others 15,644,677 8,352,826 532,192 24,529,695 P=77,650,731 P=24,627,170 P=18,892,356 P=121,170,257

140 Reimagining Today Building the FuTure
- 75 -
*SGVFS034462*
For assets to be classified as “past due and impaired,” contractual payments in arrears are more than 90 days. Allowance is recognized in the statements of income for these assets. When credit exposure is adequately secured, arrears of more than 90 days might still be classified as “past due but not impaired,” with no impairment adjustment recorded. The Group operates mainly on a “neither past due nor impaired basis” and when evidence of impairment is available, an impairment assessment is performed if applicable.
The amount and type of collateral required depends on an assessment of the credit risk of the counterparty. Guidelines are implemented regarding the acceptability of types of collateral and the valuation parameters. Collateral is mainly obtained for securities lending. Credit risk is also mitigated by entering into collateral agreements. Management monitors the market value of the collateral, requests additional collateral when needed and performs an impairment valuation when applicable. Collaterals obtained by the Group are investment properties upon default on mortgage loans and housing loans. The fair value of the collaterals obtained where the Company has the right by contract or custom to sell the assets amounted to P=281,511,263 and P=304,248,983 for housing loans and mortgage loans as of December 31, 2018 and 2017, respectively.
Credit risk disclosures under the Amendments to PFRS 4 The table below shows the carrying amounts of the SPPI assets in accordance with PAS 39 categories by credit risk rating grades reported to key management personnel. The carrying amounts are measured in accordance with PAS 39. For assets measured at amortized cost, the carrying amount shown is before any allowance for impairment loss.
Credit Rating Total AAA BBB PRSAaa Unrated Available-for-sale debt securities 18,345,138,611 − 11,560,411,586 6,784,727,025 − Held-to-maturity financial assets 21,142,025,369 − 14,619,642,082 7,522,383,287 − Loans and receivables Cash and cash equivalents 3,469,575,246 − 3,469,575,246 − − Term loans 6,718,852,941 − − 1,911,000,000 4,807,852,941 Unquoted debt securities 1,000,000,000 1,000,000,000 − − − Housing loans 131,954,834 − − − 131,954,834 Car financing loans 31,714,864 − − − 31,714,864 Others 6,961,356,982 − − − 6,961,356,982 P=57,800,618,847 P=1,000,000,000 P=29,649,628,914 P=16,218,110,312 P=11,932,879,621
The following table provides information on the fair value and carrying amount under PAS 39 for those SPPI assets that do not have low credit risk as determined by the Group. The carrying amounts are measured in accordance with PAS 39. For assets measured at amortized cost, the carrying amount shown is before any allowance for impairment loss.
Fair value Carrying
amount Financial assets at FVTPL Other receivables P=259,221,110 P=259,221,110 Loans and receivables Term loans 6,649,024,739 6,718,852,941 Housing loans 121,122,795 131,954,834 Car financing loans 34,118,449 31,714,864 Others 7,822,310,638 7,580,910,353 P=14,885,797,731 P=14,964,054,387

1412018 annual report
- 76 -
*SGVFS034462*
For the fair value disclosures required by the Amendments to PFRS 4, refer to Note 28.
Liquidity Risk Liquidity or funding risk is the risk that an entity will encounter difficulty in raising funds to meet commitments associated with financial instruments. Liquidity risk may result from either the inability to sell financial assets quickly at their fair values, or failing on repayment of a contractual obligation, or insurance liability falling due for payment earlier than expected or inability to generate cash inflows as anticipated. The major liquidity risk confronting the Group is the matching of available cash resources in respect of claims arising from insurance contracts.
The Group manages liquidity through a group liquidity risk policy which determines what constitutes liquidity risk for the Group, specifies minimum proportion of funds to meet emergency calls, sets up contingency funding plans, specifies the sources of funding and the events that would trigger the plan, determines concentration of funding sources, reports of liquidity risk exposures and breaches to the monitoring authority, monitors compliance with liquidity risk policy, and reviews liquidity risk policy for pertinence and changing environment. The amounts disclosed in the maturity analysis of financial assets used to manage liquidity, insurance liabilities, and financial liabilities of the Company are the contractual undiscounted cash flows based on the remaining period at the reporting date to their contractual maturities or in the case of financial assets at FVPL and legal policy reserves, the expected repayment dates detailed as follows: 2018 Up to a year 1-3 years 3-5 years Over 5 years Total Financial assets: Cash and cash equivalents P=3,468,861,896 P=– P=– P=– P=3,468,861,896 Insurance Receivables 187,948,307 – – – 187,948,307 Financial assets at FVPL 27,253,323,852 2,746,895,897 1,356,402,945 4,006,300,905 35,362,923,599 AFS financial assets 34,343,131,922 2,689,236,584 2,209,512,994 12,721,868,898 51,963,750,398 HTM financial assets 2,469,332,328 5,705,671,155 3,520,849,468 27,328,188,742 39,024,041,693 Loans and receivables 1,333,131,837 4,250,862,967 3,114,139,318 8,708,273,330 17,406,407,452 Total financial assets 69,055,730,142 15,392,666,603 10,200,904,725 52,764,631,875 147,413,933,345 Financial liabilities: Insurance liabilities: Legal policy reserves 5,625,275,563 4,879,632,210 1,441,488,038 42,428,898,767 54,375,294,578 Derivative liability 50,356,772 – – – 50,356,772 Other insurance liabilities: Members’ deposits and other funds on deposit 27,642,478,451 1,118,646,999 310,793,678 4,609,330,900 33,681,250,028 Claims pending settlement 2,012,054,045 – – – 2,012,054,045 35,330,164,831 5,998,279,209 1,752,281,716 47,038,229,667 90,118,955,423 Other financial liabilities: Accrued expenses and other liabilities: Accounts payable 61,037,251 43,861,816 315,290,109 – 420,189,176 Accrued employee benefits 522,279,173 36,489,558 347,557,899 – 906,326,630 Commissions payable 126,372,879 – – – 126,372,879 General expenses due and accrued 65,532,959 20,621,222 – – 86,154,181 Others 3,984,755 5,768,745 – – 9,753,500 779,207,017 106,741,341 662,848,008 − 1,548,796,366 Total financial liabilities 36,109,371,848 6,105,020,550 2,415,129,724 47,038,229,667 91,667,751,789 Liquidity position P=32,946,358,294 P=9,287,646,053 P=7,785,775,001 P=5,726,402,208 P=55,746,181,556 *Excluding unearned membership fees of I-Care amounting to P=177,145,294
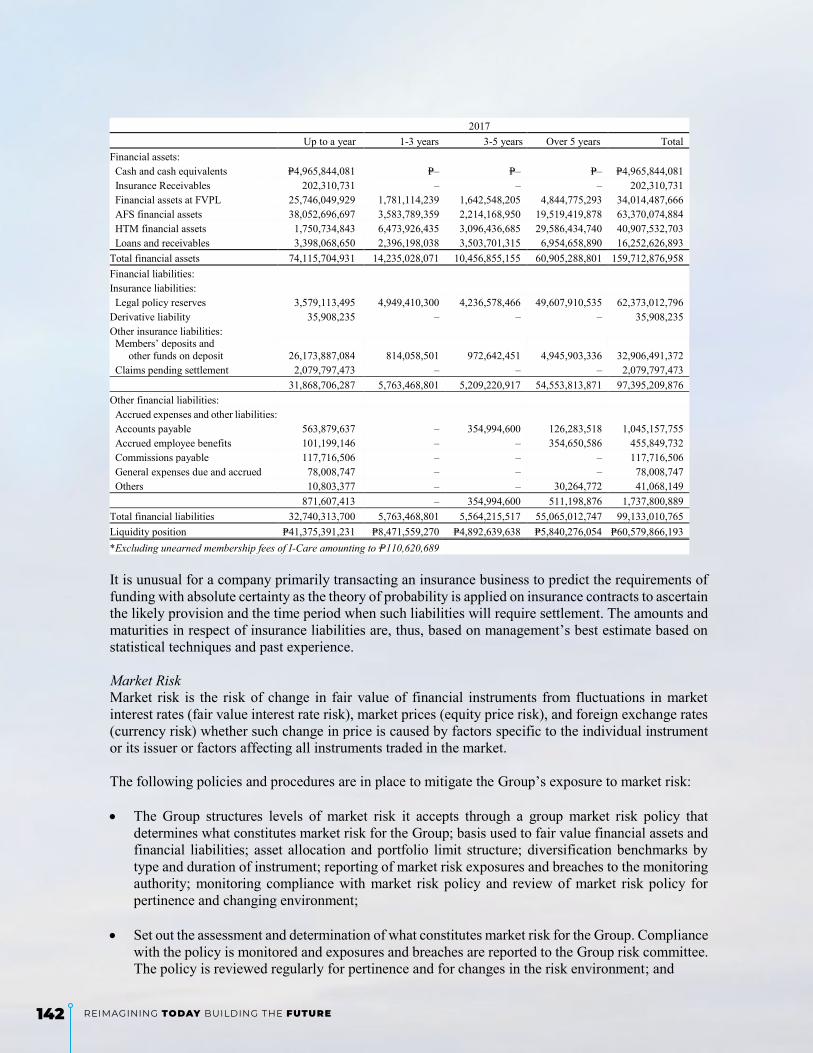
142 Reimagining Today Building the FuTure
- 77 -
*SGVFS034462*
2017 Up to a year 1-3 years 3-5 years Over 5 years Total Financial assets: Cash and cash equivalents P=4,965,844,081 P=– P=– P=– P=4,965,844,081 Insurance Receivables 202,310,731 – – – 202,310,731 Financial assets at FVPL 25,746,049,929 1,781,114,239 1,642,548,205 4,844,775,293 34,014,487,666 AFS financial assets 38,052,696,697 3,583,789,359 2,214,168,950 19,519,419,878 63,370,074,884 HTM financial assets 1,750,734,843 6,473,926,435 3,096,436,685 29,586,434,740 40,907,532,703 Loans and receivables 3,398,068,650 2,396,198,038 3,503,701,315 6,954,658,890 16,252,626,893 Total financial assets 74,115,704,931 14,235,028,071 10,456,855,155 60,905,288,801 159,712,876,958 Financial liabilities: Insurance liabilities: Legal policy reserves 3,579,113,495 4,949,410,300 4,236,578,466 49,607,910,535 62,373,012,796 Derivative liability 35,908,235 – – – 35,908,235 Other insurance liabilities: Members’ deposits and other funds on deposit 26,173,887,084 814,058,501 972,642,451 4,945,903,336 32,906,491,372 Claims pending settlement 2,079,797,473 – – – 2,079,797,473 31,868,706,287 5,763,468,801 5,209,220,917 54,553,813,871 97,395,209,876 Other financial liabilities: Accrued expenses and other liabilities: Accounts payable 563,879,637 – 354,994,600 126,283,518 1,045,157,755 Accrued employee benefits 101,199,146 – – 354,650,586 455,849,732 Commissions payable 117,716,506 – – – 117,716,506 General expenses due and accrued 78,008,747 – – – 78,008,747 Others 10,803,377 – – 30,264,772 41,068,149 871,607,413 – 354,994,600 511,198,876 1,737,800,889 Total financial liabilities 32,740,313,700 5,763,468,801 5,564,215,517 55,065,012,747 99,133,010,765 Liquidity position P=41,375,391,231 P=8,471,559,270 P=4,892,639,638 P=5,840,276,054 P=60,579,866,193 *Excluding unearned membership fees of I-Care amounting to P=110,620,689
It is unusual for a company primarily transacting an insurance business to predict the requirements of funding with absolute certainty as the theory of probability is applied on insurance contracts to ascertain the likely provision and the time period when such liabilities will require settlement. The amounts and maturities in respect of insurance liabilities are, thus, based on management’s best estimate based on statistical techniques and past experience.
Market Risk Market risk is the risk of change in fair value of financial instruments from fluctuations in market interest rates (fair value interest rate risk), market prices (equity price risk), and foreign exchange rates (currency risk) whether such change in price is caused by factors specific to the individual instrument or its issuer or factors affecting all instruments traded in the market.
The following policies and procedures are in place to mitigate the Group’s exposure to market risk:
The Group structures levels of market risk it accepts through a group market risk policy that
determines what constitutes market risk for the Group; basis used to fair value financial assets and financial liabilities; asset allocation and portfolio limit structure; diversification benchmarks by type and duration of instrument; reporting of market risk exposures and breaches to the monitoring authority; monitoring compliance with market risk policy and review of market risk policy for pertinence and changing environment;
Set out the assessment and determination of what constitutes market risk for the Group. Compliance
with the policy is monitored and exposures and breaches are reported to the Group risk committee. The policy is reviewed regularly for pertinence and for changes in the risk environment; and

1432018 annual report
- 78 -
*SGVFS034462*
Establish asset allocation and portfolio limit structure, to ensure that assets back specific policyholders’ liabilities and that assets are held to deliver income and gains for policyholders which are in line with expectations of the policyholders.
a. Fair Value Interest Rate Risk Fair value interest rate risk is the risk that the value of a financial instrument will fluctuate because of changes in market interest rates. The Group’s fixed rate investments in particular are exposed to such risk. The following tables show the information relating to the Group’s exposure to fair value interest rate risk:
2018 Maturity
Fixed Rate Instruments
Effective Interest Rate
In 1 year or less
More than 1 year but not 2
years
More than 2 years but not 3
years
More than 3 years but not 4
years
More than 4 years but not 5
years
More than 5 years Total
Financial assets at FVPL - debt securities
Government: Local currency 3.25% - 8.0% P=89,089,387 P=214,462,729 P=182,774,504 P=289,814,408 P=320,581,398 P=698,935,920 P=1,795,658,346 Foreign currency 3.7% - 10.6% 96,457,747 70,865,326 69,045,742 − − 2,251,263,097 2,487,631,912
Corporate: Local currency 5.0% - 6.1% − − − − 89,802,387 36,234,193 126,036,580 Foreign currency 4.3% - 7.3% 42,795,493 52,718,285 - − 41,652,615 - 137,166,393
Structured VULs: Local currency 1.5% 280,289,102 - 418,237,000 − - - 698,526,102 Foreign currency 1.5% - 2.5% 297,245,257 151,383,077 371,651,740 − 479,845,080 - 1,300,125,154
AFS debt securities: Quoted:
Government: Local currency 6.9% - 7.9% 2,002,318,846 − − 46,771,879 − 8,434,012,386 10,483,103,111 Foreign currency 3.5% - 6.1% – − − 103,889,826 − 973,418,649 1,077,308,475
Corporate : Local currency 5.0% - 8.7% – 142,315,142 597,797,463 309,178,505 2,640,415,722 2,808,924,736 6,498,631,568 Foreign currency 4.0% - 4.1% 286,095,457 – – – – – 286,095,457
P=3,094,291,289 P=631,744,559 P=1,639,506,449 P=749,654,618 P=3,572,297,202 P=15,202,788,981 P=24,890,283,098
2017 Maturity
Fixed Rate Instruments
Effective Interest Rate
In 1 year or less
More than 1 year but not 2
years
More than 2 years but not 3
years
More than 3 years but not 4
years
More than 4 years but not 5
years More than 5 years Total
Financial assets at FVPL - debt securities
Government: Local currency 2.1% - 8.0% P=49,855,822 P=91,600,538 P=201,549,027 P=160,285,135 P=197,889,896 P=1,120,665,611 P=1,821,846,029 Foreign currency 3.7% - 10.6% – 97,870,595 70,751,273 68,155,926 – 2,280,573,355 2,517,351,149
Corporate: Local currency 5.0% - 6.1% – – – – – 145,353,726 145,353,726 Foreign currency 4.3% - 7.3% – 42,670,185 51,249,452 – – 41,438,088 135,357,725
Structured VULs: Local currency 1.5% – 281,415,515 – 421,528,500 – – 702,944,015 Foreign currency 1.5% - 2.5% – 278,993,437 146,354,267 364,329,567 456,745,527 – 1,246,422,798
AFS debt securities: Quoted:
Government: Local currency 6.9% - 7.9% – 1,048,269,493 1,006,031,349 – 154,211,276 8,417,340,208 10,625,852,326 Foreign currency 3.5% - 6.1% – – – – – 961,368,389 961,368,389
Corporate : Local currency 5.0% - 8.7% – – − 490,200,858 298,674,399 5,104,377,570 5,893,252,827 Foreign currency 4.0% - 4.1% – 31,944,230 – – – 254,797,008 286,741,238
P=49,855,822 P=1,872,763,993 P=1,475,935,368 P=1,504,499,986 P=1,107,521,098 P=18,325,913,955 P=24,336,490,222
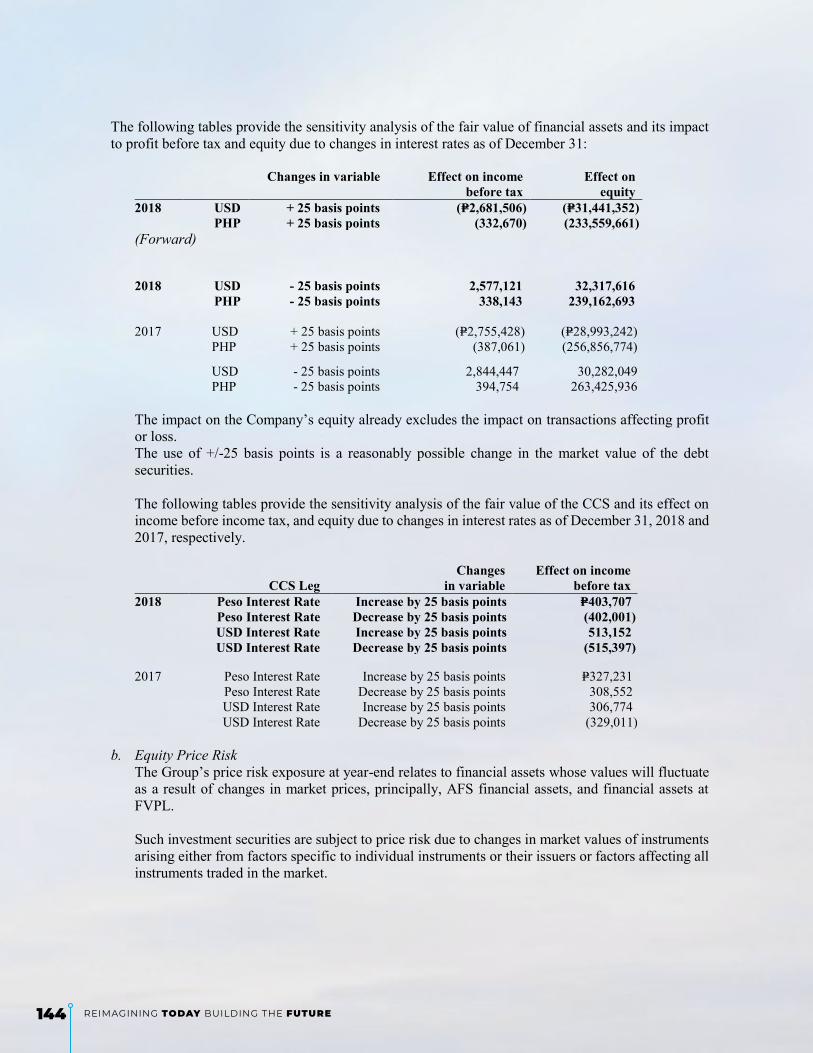
144 Reimagining Today Building the FuTure
- 79 -
*SGVFS034462*
The following tables provide the sensitivity analysis of the fair value of financial assets and its impact to profit before tax and equity due to changes in interest rates as of December 31:
Changes in variable Effect on income
before tax Effect on
equity 2018 USD + 25 basis points (P=2,681,506) (P=31,441,352) PHP + 25 basis points (332,670) (233,559,661) (Forward)
2018 USD - 25 basis points 2,577,121 32,317,616 PHP - 25 basis points 338,143 239,162,693 2017 USD + 25 basis points (P=2,755,428) (P=28,993,242) PHP + 25 basis points (387,061) (256,856,774)
USD - 25 basis points 2,844,447 30,282,049 PHP - 25 basis points 394,754 263,425,936
The impact on the Company’s equity already excludes the impact on transactions affecting profit or loss. The use of +/-25 basis points is a reasonably possible change in the market value of the debt securities.
The following tables provide the sensitivity analysis of the fair value of the CCS and its effect on income before income tax, and equity due to changes in interest rates as of December 31, 2018 and 2017, respectively.
CCS Leg Changes
in variable Effect on income
before tax 2018 Peso Interest Rate Increase by 25 basis points P=403,707 Peso Interest Rate Decrease by 25 basis points (402,001) USD Interest Rate Increase by 25 basis points 513,152 USD Interest Rate Decrease by 25 basis points (515,397) 2017 Peso Interest Rate Increase by 25 basis points P=327,231 Peso Interest Rate Decrease by 25 basis points 308,552 USD Interest Rate Increase by 25 basis points 306,774 USD Interest Rate Decrease by 25 basis points (329,011)
b. Equity Price Risk
The Group’s price risk exposure at year-end relates to financial assets whose values will fluctuate as a result of changes in market prices, principally, AFS financial assets, and financial assets at FVPL.
Such investment securities are subject to price risk due to changes in market values of instruments arising either from factors specific to individual instruments or their issuers or factors affecting all instruments traded in the market.

1452018 annual report
- 80 -
*SGVFS034462*
The analysis below is performed for reasonably possible movements in key variables with all other variables held constant, showing the impact on profit before tax (due to changes in fair value of financial assets whose fair values are recorded in the statements of income and statements of changes in members’ equity).
Change in
PSEi index Effect on income
before tax Effect
on Equity 2018 Increase by 5% P=901,786,722 P=1,636,155,700 Decrease by 5% (901,786,722) (1,636,155,700) 2017 Increase by 5% P=866,609,907 P=1,756,087,259 Decrease by 5% (866,609,907) (1,756,087,259)
The impact on the Group’s equity already excludes the impact on transactions affecting profit or loss. Risk Concentrations of the Maximum Exposure to Equity Price Risk The Group’s market risk policy requires it to manage such risks by setting and monitoring objectives and constraints on investments; diversification plan; and limits on investment in each industry or sector.
The table below analyses the Group’s concentration of equity price risk in the Group’s equity portfolio by industrial distribution as percentage of total equity securities.
2018 2017 Electricity, energy, power, and water 29% 32% Financial institutions 30% 30% Holding firms 13% 11% Food, beverage, and tobacco 6% 8% Property 7% 7% Telecommunications 5% 4% Others 10% 8% Total 100% 100%
c. Currency Risk
Currency risk is the risk that the fair value of future cash flows of a financial instrument will fluctuate because of changes in foreign exchange rates.
The Group’s foreign currency-denominated assets and liability as of December 31 consist of the following:
2018 2017
United States Dollar Value
Peso Equivalent
United States Dollar Value
Peso Equivalent
Assets Cash and cash equivalent $13,551,863 P=712,556,957 $18,687,372 P=932,929,672 Financial assets at FVPL 84,017,393 4,417,634,524 86,784,184 4,332,526,807 AFS financial assets 25,930,086 1,363,403,922 39,449,707 1,969,447,714 HTM financial assets 5,304,184 278,893,995 5,284,940 263,840,049 $128,803,526 P=6,772,489,398 $150,206,203 P=7,498,744,242 Liability Derivative liability $957,717 ₱50,356,772 $719,272 P=35,908,235 Legal policy reserves 368,917 19,397,635 397,736 19,856,174 $1,326,634 69,754,407 $1,117,008 P=55,764,409

146 Reimagining Today Building the FuTure
- 81 -
*SGVFS034462*
The foregoing United States Dollar amounts have been restated to their Peso equivalents using the exchange rate of P=52.580 and P=49.923 to US$1, as recommended by IC, as of December 31, 2018 and 2017, respectively. Net foreign exchange gain (loss) amounted to P=187,488,167 in 2018 and (P=2,690,121) in 2017. The analysis below is performed for reasonably possible movements in key variables with all other variables held constant, showing the impact on income before tax (due to changes in fair value of currency sensitive monetary assets and liabilities).
Change in
USD - PHP exchange rate Effect on income
before tax 2018 Increase by 3.47% P=232,584,903 Decrease by 3.47% (232,584,903) 2017 Increase by 4.03% P=270,783,463 Decrease by 4.03% (270,783,463)
There is no other impact on the Group’s equity other than those already affecting profit or loss.
The table below provide the sensitivity analysis of the fair value of the CCS and its effect on income before income tax, and equity due to changes in foreign currency rates as of December 31, 2018 and 2017, respectively.
Change in
PSEi index Effect on income
before tax Effect on Equity 2018 Increase by 3.47% (P=1,747,380) (P=1,747,380) Decrease by 3.47% 1,747,380 1,747,380 2017 Increase by 4.03% (P=1,447,101) (P=1,447,101) Decrease by 4.03% 1,447,101 1,447,101
32. Capital Management and Regulatory Requirements
Capital Management Framework The Group manages its capital through its compliance with the statutory requirements on minimum members' equity. The Parent Company is also complying with the statutory regulations on Amended Risk-Based Capital (RBC2) Framework to measure the adequacy of its statutory surplus in relation to the risks inherent in its business. The RBC2 method involves developing a risk-adjusted target level of statutory surplus by applying certain factors to various asset, premium, and reserve items. Higher factors are applied to more risky items and lower factors are applied to less risky items. The target level of statutory surplus varies not only as a result of the insurer’s size, but also on the risk profile of the insurer’s operations.
The Group considers its total retained earnings amounting to P=29,528,710,124 and P=26,238,520,679 as of December 31, 2018 and 2017 (as restated), respectively, as its capital.
The Group manages its capital requirements by assessing shortfalls between reported and required capital levels on a regular basis. Adjustments to current capital levels are made in light of changes in economic conditions and risk characteristics of the Group’s activities. In order to maintain or adjust the capital structure, the Group may adjust the amount of dividends paid to policyholders.
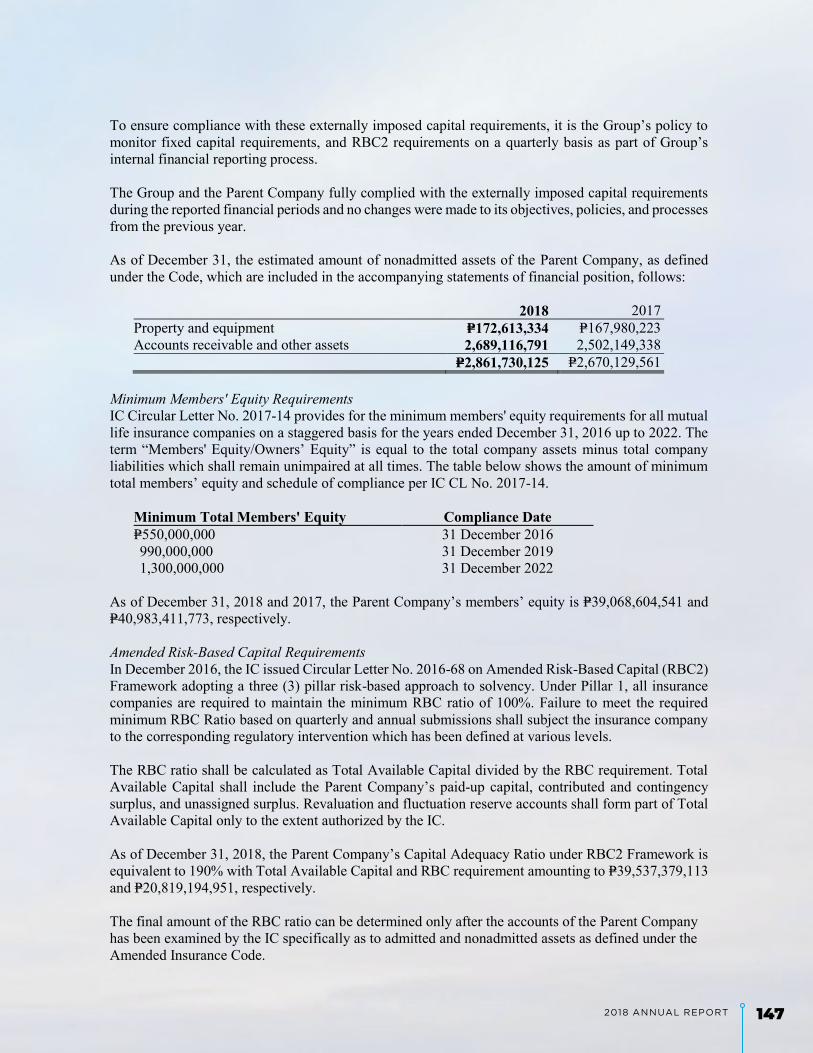
1472018 annual report
- 82 -
*SGVFS034462*
To ensure compliance with these externally imposed capital requirements, it is the Group’s policy to monitor fixed capital requirements, and RBC2 requirements on a quarterly basis as part of Group’s internal financial reporting process.
The Group and the Parent Company fully complied with the externally imposed capital requirements during the reported financial periods and no changes were made to its objectives, policies, and processes from the previous year.
As of December 31, the estimated amount of nonadmitted assets of the Parent Company, as defined under the Code, which are included in the accompanying statements of financial position, follows:
2018 2017 Property and equipment P=172,613,334 P=167,980,223 Accounts receivable and other assets 2,689,116,791 2,502,149,338 P=2,861,730,125 P=2,670,129,561
Minimum Members' Equity Requirements IC Circular Letter No. 2017-14 provides for the minimum members' equity requirements for all mutual life insurance companies on a staggered basis for the years ended December 31, 2016 up to 2022. The term “Members' Equity/Owners’ Equity” is equal to the total company assets minus total company liabilities which shall remain unimpaired at all times. The table below shows the amount of minimum total members’ equity and schedule of compliance per IC CL No. 2017-14.
Minimum Total Members' Equity Compliance Date P=550,000,000 31 December 2016 990,000,000 31 December 2019 1,300,000,000 31 December 2022
As of December 31, 2018 and 2017, the Parent Company’s members’ equity is P=39,068,604,541 and P=40,983,411,773, respectively.
Amended Risk-Based Capital Requirements In December 2016, the IC issued Circular Letter No. 2016-68 on Amended Risk-Based Capital (RBC2) Framework adopting a three (3) pillar risk-based approach to solvency. Under Pillar 1, all insurance companies are required to maintain the minimum RBC ratio of 100%. Failure to meet the required minimum RBC Ratio based on quarterly and annual submissions shall subject the insurance company to the corresponding regulatory intervention which has been defined at various levels.
The RBC ratio shall be calculated as Total Available Capital divided by the RBC requirement. Total Available Capital shall include the Parent Company’s paid-up capital, contributed and contingency surplus, and unassigned surplus. Revaluation and fluctuation reserve accounts shall form part of Total Available Capital only to the extent authorized by the IC.
As of December 31, 2018, the Parent Company’s Capital Adequacy Ratio under RBC2 Framework is equivalent to 190% with Total Available Capital and RBC requirement amounting to P=39,537,379,113 and P=20,819,194,951, respectively.
The final amount of the RBC ratio can be determined only after the accounts of the Parent Company has been examined by the IC specifically as to admitted and nonadmitted assets as defined under the Amended Insurance Code.
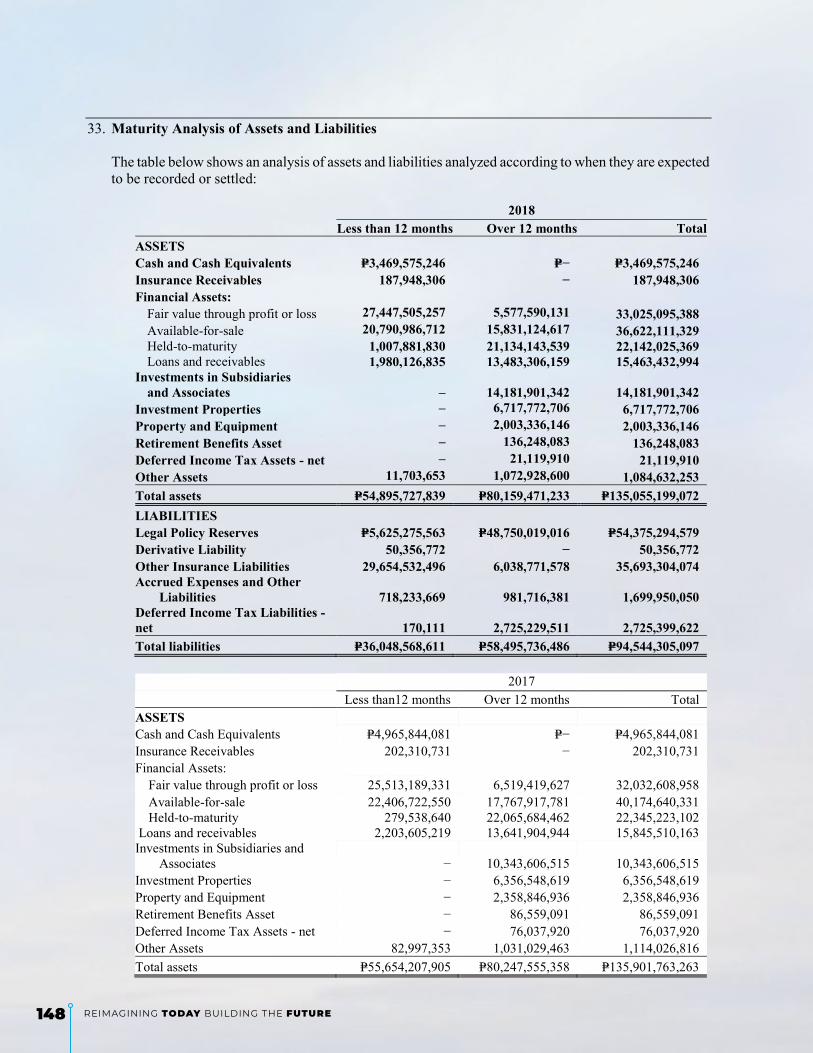
148 Reimagining Today Building the FuTure
- 83 -
*SGVFS034462*
33. Maturity Analysis of Assets and Liabilities
The table below shows an analysis of assets and liabilities analyzed according to when they are expected to be recorded or settled:
2018
Less than 12 months Over 12 months Total ASSETS Cash and Cash Equivalents P=3,469,575,246 P=− P=3,469,575,246 Insurance Receivables 187,948,306 − 187,948,306 Financial Assets:
Fair value through profit or loss 27,447,505,257 5,577,590,131 33,025,095,388 Available-for-sale 20,790,986,712 15,831,124,617 36,622,111,329 Held-to-maturity 1,007,881,830 21,134,143,539 22,142,025,369 Loans and receivables 1,980,126,835 13,483,306,159 15,463,432,994
Investments in Subsidiaries and Associates – 14,181,901,342 14,181,901,342
Investment Properties – 6,717,772,706 6,717,772,706 Property and Equipment – 2,003,336,146 2,003,336,146 Retirement Benefits Asset – 136,248,083 136,248,083 Deferred Income Tax Assets - net – 21,119,910 21,119,910 Other Assets 11,703,653 1,072,928,600 1,084,632,253 Total assets P=54,895,727,839 P=80,159,471,233 P=135,055,199,072 LIABILITIES Legal Policy Reserves P=5,625,275,563 P=48,750,019,016 P=54,375,294,579 Derivative Liability 50,356,772 − 50,356,772 Other Insurance Liabilities 29,654,532,496 6,038,771,578 35,693,304,074 Accrued Expenses and Other Liabilities 718,233,669 981,716,381 1,699,950,050 Deferred Income Tax Liabilities - net 170,111 2,725,229,511 2,725,399,622 Total liabilities P=36,048,568,611 P=58,495,736,486 P=94,544,305,097
2017
Less than12 months Over 12 months Total ASSETS Cash and Cash Equivalents P=4,965,844,081 P=− P=4,965,844,081 Insurance Receivables 202,310,731 − 202,310,731 Financial Assets:
Fair value through profit or loss 25,513,189,331 6,519,419,627 32,032,608,958 Available-for-sale 22,406,722,550 17,767,917,781 40,174,640,331 Held-to-maturity 279,538,640 22,065,684,462 22,345,223,102
Loans and receivables 2,203,605,219 13,641,904,944 15,845,510,163 Investments in Subsidiaries and Associates − 10,343,606,515 10,343,606,515 Investment Properties − 6,356,548,619 6,356,548,619 Property and Equipment − 2,358,846,936 2,358,846,936 Retirement Benefits Asset − 86,559,091 86,559,091 Deferred Income Tax Assets - net − 76,037,920 76,037,920 Other Assets 82,997,353 1,031,029,463 1,114,026,816 Total assets P=55,654,207,905 P=80,247,555,358 P=135,901,763,263

1492018 annual report
- 84 -
*SGVFS034462*
2017
Less than12 months Over 12 months Total LIABILITIES Legal Policy Reserves P=3,579,113,495 P=58,793,899,301 P=62,373,012,796 Derivative Liability 35,908,235 − 35,908,235 Other Insurance Liabilities 28,253,684,557 6,732,604,288 34,986,288,845 Accrued Expenses and Other Liabilities 922,472,826 1,101,084,662 2,023,557,488 Retirement Benefits Liability − 2,806,221 2,806,221 Deferred Income Tax Liabilities - net − 175,599 175,599 Total Liabilities P=32,791,179,113 P=66,630,570,071 P=99,421,749,184
34. Other Matters
Insular Investment Corporation (IIC) entered into certain prearranged transactions involving a series of mutual sale and purchase transactions of treasury bills with two financial institutions in 1994. The transactions led to a case filed against the Group that involves a complaint for specific performance and sum of money amounting to P=90.00 million. As counterclaims, the Group seeks the award of P=21.10 million. The main case was dismissed on August 28, 2008 for failure of the other party to file a Pre-trial Brief within the prescribed period. The Group was allowed to present evidence on its counterclaims on September 9, 2008. The other party filed a motion for reconsideration which the court denied on January 26, 2009. The other party then appealed the case to the Court of Appeals on March 2, 2009. On March 23, 2012, the Court of Appeals rendered a decision denying the other party’s appeal. The Motion for Reconsideration filed by the other party was likewise denied by the Court of Appeals on June 27, 2012. The other party appealed the Court of Appeals’ decision to the Supreme Court. Last February 11, 2013, the Supreme Court decided to reinstate the case before the Regional Trial Court (RTC) of Manila, Branch 28. On February 1, 2019, the Group received notice from RTC granting the motion to withdraw Notice of Appeal filed by plaintiff on January 28, 2019. As of March 28, 2019, the case is still pending at the RTC Manila, Branch 28.
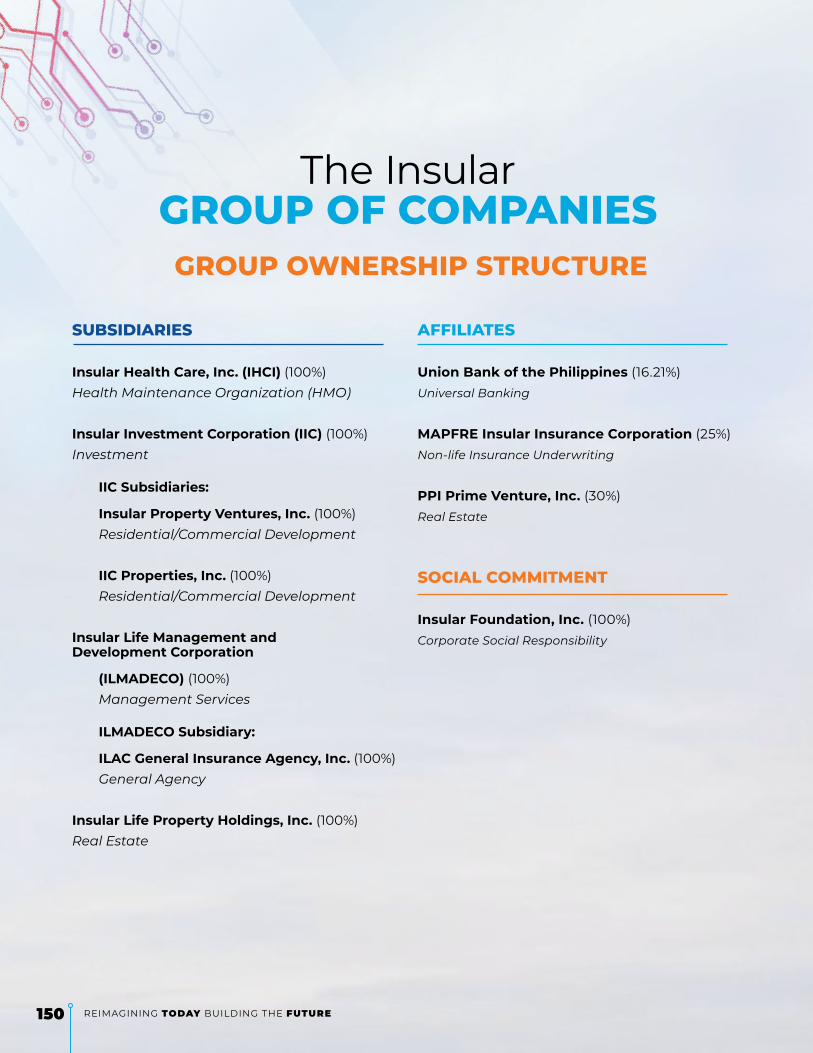
150 Reimagining Today Building the FuTure
The Insulargroup oF CompAnieS group ownerShip StruCture
SubSiDiArieS
Insular Health Care, Inc. (IHCI) (100%)Health Maintenance Organization (HMO)
Insular Investment Corporation (IIC) (100%)Investment
IIC Subsidiaries:
Insular Property Ventures, Inc. (100%) Residential/Commercial Development
IIC Properties, Inc. (100%) Residential/Commercial Development
Insular Life Management and Development Corporation
(ILMADECO) (100%) Management Services
ILMADECO Subsidiary:
ILAC General Insurance Agency, Inc. (100%) General Agency
Insular Life Property Holdings, Inc. (100%)Real Estate
AFFiliAteS
union Bank of the Philippines (16.21%)Universal Banking
MAPFRE Insular Insurance Corporation (25%)Non-life Insurance Underwriting
PPI Prime Venture, Inc. (30%)Real Estate
SoCiAl Commitment
Insular Foundation, Inc. (100%)Corporate Social Responsibility

I N S U L A R L I F E
Our eAgle is no longer confined within its borders, dramatizing an expansion in our reach across horizons as we evolve to become
a fully digitized company.
bolder fonts mirror the bold direction our company is moving towards as it navigates through the digital age. Gradients symbolize dynamism, showing
our flexibility to move with the times.
The eagle’s new look is inspired by the intersecting circles of The Seed of Life, a universal symbol of creation and new beginnings.
blue represents trust and dependability
orAnge emulates warmth and care

The insular liFe assurance company, lTd.Insular Life Corporate CentreInsular Life Drive, Filinvest Corporate CityAlabang, Muntinlupa City, 1781 Metro Manila, Philippines Tel. No. : (632) 582-1818Fax. No. : (632) 771-1717Email : [email protected] : www.insularlife.com.phFacebook : www.facebook.com/InsularLifePHTwitter : @InsularEagleInstagram : @Insular_LifeyouTube : www.youtube.com/Insularlifecomph