Embed Size (px)
Citation preview

Santini-Bell et al - TRB 2010 1 of 16
Instrumentation, Modeling and Monitoring of a Concrete
Bridge from Construction through Service
Erin Santini Bell, Ph.D., P.E. Department of Civil Engineering
University of New Hampshire
W141 Kingsbury Hall
Durham, NH 03824
Phone: (603) 862-3850
Email: [email protected]
Jesse D. Sipple
Department of Civil and Environmental Engineering
Tufts University
308 Anderson Hall
Medford, MA 02155
Email: [email protected]
Paul J. Lefebvre
Department of Civil Engineering
University of New Hampshire
W141 Kingsbury Hall
Durham, NH 03824
Email: [email protected]
John E. Phelps
Department of Civil and Environmental Engineering
Tufts University
308 Anderson Hall
Medford, MA 02155
Email: [email protected]
Brian Brenner, P.E.
Vice President
Fay, Spofford & Thorndike, INC
5 Burlington Wood
Burlington, MA
Email: [email protected]
Masoud Sanayei, Ph.D.
Department of Civil and Environmental Engineering
Tufts University
308 Anderson Hall
Medford, MA 02155
Email: [email protected]
November 15, 2009
Word count: 4,916 words (18 figures, 4 tables)
Adjusted word count: including figures and tables: 5,265
with footnotes & endnotes: 5,810

Santini-Bell et al - TRB 2010 2 of 16
Abstract
Instrumentation, structural modeling, monitoring and nondestructive testing are significant components to a comprehensive structural health monitoring program. Another key component of structural health monitoring is a model updating protocol that links the structural model with the collected data for evaluation of both the analytical and measured responses. Recent advancement in sensors technology had increased the popularity of instrumentation however the installation of gauges on an in-service bridge can be costly in terms of manpower and traffic delays. The development of a baseline structural model of the bridge during the design phase would capture all of the design intelligence that is needed for effective condition assessment. A comprehensive monitoring and testing program will be a basis for updating the structural model to truly reflect the condition of the bridge and provide bridge owners with an invaluable management tool for maintenance, load rating and repair scheduling. The most effective deployment of this structural health monitoring scenario is to create the structural model and instrumentation plan during the design phase with input from the bridge designer, bridge manager and instrumentation specialist, to installation the sensors and data acquisition system during construction, monitoring the bridge element during construction and perform a nondestructive test prior to bridge commissioning. This will provide a foundation for the baseline structural model and basis for comparison of future data sets. This procedure is currently being deployed at the Vernon Avenue Bridge in Barre, Massachusetts. This paper presents a collaborative research project currently funded by the Partnership for Innovation and the CAREER programs at the National Science Foundation to develop a framework for bridge condition assessment integrating instrumentation and structural modeling for highway bridge decision-making and management.

Santini-Bell et al - TRB 2010 3 of 16
1.0 INTRODUCTION
1.1 Current state of affairs - why the time is right. The 1956 Interstate Highway Program expanded the U.S. highway system to include over 500,000 bridges. This unprecedented period of infrastructure construction was arguably the greatest single coordinated building effort (Gifford, 2006). There was no monitoring or condition assessment component included in this initial design and building effort. After 50 years of service, many bridges are approaching the end of their design life, and require repair or replacement. From a perspective of infrastructure system performance and management, the situation is critical (Chase, 2006). A modern society cannot function with inadequate infrastructure, and thus the U.S. faces a monumental task of repair and reconstruction. Travel on this system increased by 38% from 1990 to 2004 while capacity grew 6%, according to TRIP (The Road Information Project). TRIP predicts interstate travel will increase an additional 60% by 2026 (Copeland, 2006). According to the American Association of State Highway and Transportation Officials (AASHTO) Bridging the Gap report, 12% of U.S. bridges are functionally obsolete, while 13% are rated as structurally deficient (AASHTO, 2008). Many states are implementing structural health monitoring (SHM) programs to manage their aging infrastructure. The goal of the SHM system is to employ sensing instruments to provide information pertaining to the condition of the structure (Chang 2003). The safety and mobility of the traveling population is dependent on the structural integrity of U.S. highway bridges. The structural health and condition of in-service bridges is usually assessed through visual inspection and nondestructive testing & evaluation (NDT/NDE) conducted on a pre-set maintenance schedule. Recent advancements in technology have made bridge structure instrumentation very popular and relatively easy to implement (Cuelho et al, 2006 and Riad et al, 2006). FHWA envisions sensing and measurement capabilities fully integrated into the design, construction, and operation of the bridge of the future (ISHMII, 2004). In January 2008, the National Science Foundation (NSF) selected a team of researchers from Tufts University, the University of New Hampshire, Fay Spofford & Thorndike, and Geocomp, to participate in a project, “Whatever Happened to Long Term Bridge Design”. The goals of the project include evaluation of bridge design procedures to facilitate long term monitoring and development of structural health monitoring systems. To help achieve these goals, the research team, working in cooperation with highway departments in New England, proposed to develop a “baseline” analytical model of a highway bridge. This model would be as close as possible to a “perfect” analytical representation of the bridge structure, in contrast to the typical AASHTO analysis model with its appropriately conservative assumptions and elemental design approach. The baseline model will be updated with collected field data from the sensors installed on the bridge during construction. The comparison between analytical predictions and collected field data will facilitate the evaluation of bridge performance over its design life. The research project will build on previous work in the areas of instrumentation and structural modeling of bridges (Lennett et al., 2001, Padur et al., 2002 and Kangas et al., 2003). It will advance the development of procedures for deployment of a structural health monitoring program for bridges, leading to better and more cost effective bridge maintenance and management programs. In support of the NSF project, the Massachusetts Highway Department has granted the research team access to Bridge #B-02-012, Vernon Avenue over the Ware River in Barre, Massachusetts. The research project includes the development of a structural baseline model of the bridge, instrumentation plan and monitoring program.

Santini-Bell et al - TRB 2010 4 of 16
1.2 Current state of the art of bridge design and structural health monitoring Current design methods explicitly account for “opening day” conditions. The bridge design code specifies rigorous, mathematical treatment of initial state requirements. Long term requirements such as future inspection, corrosion, and reconstruction are not generally treated as part of the rigorous design matrix approach. These issues are either dealt with subjectively by the design code or not at all. As a result, long term issues need to be dealt with over the bridge’s life without the benefit of a rigorous design approach prior to construction, often leading to a “reactive” mode by the responsibility of the over-taxed bridge management team. In the current design process, the design essentially ends at opening day. The analysis and decision-making process that comprises the initial design is completed and filed away, typically in a format that is difficult for subsequent interpretation and use. Prior to developing an integrated framework for structural condition assessment, the current bridge design paradigm must be changed. In current AASHTO design practices, bridges are designed on an elemental basis meaning each structural element is to be designed for the loads it will experience during the life of the bridge. This research project includes the development of a “baseline” structural model that takes advantage of modern computing capabilities to create a refined baseline model. This baseline model is an analytical model accounting for the full system behavior of the structure, as opposed to the traditional elemental approach which envelopes loads and conditions to individually evaluate bridge structural components, thus changing the current bridge design paradigm. This model will be updated throughout the life of the bridge for design verification (Myroll et al, 2001), long-term structural health monitoring and potential rehabilitations (Feng et al, 2004) using collected data from instruments deployed during construction. Two infrastructure trends support and encourage this type of approach: Repair needs make it imperative that long-term conditions be better considered in the
design process. Current technology for data management and field sensors make it increasingly feasible
to design new bridges more rigorously for long term conditions and performance. 1.3 Closing the Design Loop The process of bridge design today, regardless of the method of project procurement, is for a designer to prepare a set of construction documents which include drawings, specifications, calculations, and special reports. In a design-bid-build project, typical of U.S. public works construction, these construction documents are included in the bid documents. On the day of delivery, the analytical process largely stops, i.e. it is considered “complete”. The graphic drawings may be updated to form an as-built set of documents. However, unless there is an extreme variation between design conditions and as-built field conditions, usually the analysis and design calculations are not updated. So in most projects, there is no feedback mechanism between what was designed and how it performed. This is essential information that the original designer usually never receives. For most projects, the only feedback will occur in the unfortunate case of a structural failure, but in this situation of forensic engineering with its reactive, defensive atmosphere, useful design feedback is difficult to achieve.

Santini-Bell et al - TRB 2010 5 of 16
In the past, design calculations were prepared manually. The calculations represent documentation of the analytical design process that formed the decision making basis for the nature of the bridge- what type of beams, what size deck, and so on. Many state departments of transportation (DOTs) have vast storage sites full of calculation files. Some organizations have used data processing methods to better record the information. The design calculations could be submitted in the form of a “baseline” model accompanied by a prescribed, transparent documentation. Such a baseline model would be invaluable to future maintenance and evaluation of the bridge. Engineers could use the model to more easily and accurately perform load rating of the bridge and evaluate its structural health. Consider the example of distribution of live load to bridge stringers. The traditional design method has been to calculate a percentage of wheel loads from the design truck applied on the deck. Recent work as part of AASHTO LRFD code has added terms and complexity to the traditional equations, which in the past were as simple as to be dependent only stringer spacing (S) (Brenner, 2003 and AASHTO, 2004) Research to further define stinger spacing has been based on analytical models and scale testing of physical models. A great deal of work has been done to instrument actual bridge structures, considered as part of an overall system (Linzell et al, 2003), but little research has been done to use that data to revisit the original analysis and design based on the Non-Destructive Testing (NDT) data. NDT data can be used to verify design assumptions and the data is available for revisiting analytical models and updating, for the purpose of using them for future structural evaluation. Structural parameter estimation can serve as a platform for the correlation between the “baseline” model and NDT data. One of the problems facing bridges owners is the large amount of structural health monitoring data that is collected for each instrumented bridge (Cuelho, 2006 and Riad, 2006). This “baseline” model will provide bridge owners a platform to translate the collected field data into decision-making information that is directly related to the components of the bridge structure. 2.0 Case Study: Vernon Avenue Bridge in Barre, Massachusetts
2.1 Bridge properties
The Vernon Avenue Bridge was constructed during the summer of 2009 and will be open to traffic in September 2009. This bridge was constructed by the Massachusetts Highway Administration for the Town of Barre. This bridge is a 150 foot three-span continuous bridge. It is comprised of a concrete deck supported by six steel girders, as shown in Figure 1. This three-span continuous bridge spans the Ware River, which at a maximum depth of approximately 10 feet. The eight inch (203.2 mm) concrete deck was cast-in-place (CIP) during a single continuous pour. The construction included seven diaphragms along the length of the bridge and a Town of Barre water line running underneath the bridge deck. Capturing the behavior of this bridge required an extensive instrumentation plan with various types of sensors, data acquisition boxes, data transfer devices, and data

Santini-Bell et al - TRB 2010 6 of 16
storage devices. This instrumentation plan was deployed during the construction process to be able to capture the full strain history of the bridge. The instrumentation plan of the Vernon Ave Bridge includes 100 strain gauges, 36 girder thermistors, 30 concrete thermistors, , 4 bi-axial abutment tiltmeters, and 16 bi-axial accelerometers at 13 station across the span of the bridge, as shown in Figure 2 and detailed in Table 1. These data sets will be collected using iSite® data acquisition boxes provided by Geocomp, INC.
FIGURE 1: TYPICAL PROFILE OF THE VERNON AVENUE BRIDGE
FIGURE 2: PLAN VIEW OF VERNON AVENUE BRIDGE WITH INSTRUMENTATION STATION
Santini-Bell et al - TRB 2010 7 of 16
TABLE 1: DETAILS OF INSTRUMENTATION PLAN FOR EACH GIRDER OF THE VERNON AVENUE
BRIDGE
Key: - bi-axial tiltmeter - strain gauge, A - Accelerometer and T - thermistor Station 0 1 2 3 4 5 6 7 8 9 10 11 12 Girder
1 1-A 2- 2-T
1- 2-
1-A 2-
2-T 1-A
2-
1- 2- 2-T
1-A
2 1- 1-A 2- 2-T
1- 2-
1-A 2-
2-T 1-A
2-
1- 2- 2-T
1-A 1-
3 1-A 2- 2-T
2-
1-A 2-
2-T 1-A
2-
2- 2-T
1-A
4 2- 2-T
2-
2- 2-T
2-
2- 2-T
5 1- 2- 2-T
1- 2-
2- 2-T
2-
1-
2- 2-T
1-
6 1-A 2- 2-T
1- 2-
1-A
2- 2-T
1-A 2-
1-
2- 2-T
1-A
Abut-ment 1- 1-
Pier Cap
1- 1-
2.2 Instrumentation details
By design, all sensors installed in the bridge were calibrated to a ±0.002% accuracy. Strain sensors and thermistors are distributed along the length of each girder on both sides of the web with the exception of the exterior girder, which only have instrumentation in the exterior face, Figure 3 show the instrumentation for Girder 3, which is typical for all girders. Each girder was fabricated in two parts with a splice located at the middle of the center span. The wires for data acquisition of the strain gauges were wrapped at the south end of each girder and secured to the bearing plate or splice plates. All data acquisition modules were clustered on the south abutment for access to a power supply. Each station was selected to provide maximum information relating to the bridge performance. A detailed structural model and engineering judgment were used to predict the location of inflection for static deflection, induced by a truck load, see Figure 4 and modes of vibration, see Figure 5. These locations were selected by the research team and then review by the bridge designers and management team. It was vital to get the input from all parties related to the life-cycle of the bridge in order to maximize the future benefit of this instrumentation plan.

Santini-Bell et al - TRB 2010 8 of 16
Instrumentation Key
Strain Gauge
Thermistor
Bi-Axial Accelerometer
Bi-Aixial Tiltmeter
FIGURE 3: SELECTION OF STRAIN GAUGE LOCATIONS DIAGRAM FOR INSTRUMENTATION
PLAN FOR GIRDER 3 OF THE VERNON AVENUE BRIDGE
Figure 4: SELECTION OF STRAIN GAUGE LOCATIONS DIAGRAM USING PREDICTED
DEFLECTION FOR INSTRUMENTATION PLAN FOR GIRDER 3 OF THE VERNON AVENUE
BRIDGE

Santini-Bell et al - TRB 2010 9 of 16
Figure 5: SELECTION OF ACCELEROMETER LOCATIONS DIAGRAM USING PREDICTED
MODE SHAPES FOR INSTRUMENTATION PLAN FOR GIRDER 3 OF THE VERNON AVENUE
BRIDGE All of the strain sensors presented in the research were manufactured by Omega technologies. The strain gauges and thermistors were installed at the steel fabricator yard of High Steel, INC. in Lancaster, Pennsylvania after fabrication was complete and prior to delivery to the construction site. Each gauge was environmentally protected and the wires were wrapped for transportation, see Figure 6. The concrete thermistors were tied to the reinforcing bars prior to the deck pour, see Figure 6. The tiltmeters and accelerometers were installed at the bridge site after girder erection and deck casting but prior to commissioning.

Santini-Bell et al - TRB 2010 10 of 16
(A) (B)
(C) (D)
FIGURE 6: INSTRUMENTATION OF THE VERNON AVENUE BRIDGE (A) STRAIN GAUGE
PRIOR TO ENVIRONMENTAL PROTECTION (B) ENVIRONMENTALLY PROTECTED STRAIN
GAUGE (C) FINAL CONFIGURATION FOR STRAIN GAUGE AND THERMISTER AND (D)
CONCRETE THERMISTERS INSTALLED PRIOR TO DECK POUR
3.0 Data Collection During Construction and Beyond Monitoring and recording of measurements from instrumentation shall be performed
remotely, with wireless transmission of data from on-site DAQ boxes to a receiver in
Boxborough, Massachusetts. Data shall be collected periodically at key milestone during
construction. The first milestone was the erection of the steel girders. Since the girders were
instrumented prior to delivery at the construction site, see Figure 7. Figure 7 also shows a
pattern of white magnets on the exterior face of the eastern-most girder. These magnets were
used as a contrast pattern for digital image correlation to collected deflection measurements.
The reason for installing instrumentation on the girder prior to steel erection was to be able to
capture the strain values of the girders due solely to their own self weight. This loading
condition is very easy to determine and calculate strain values using basic and widely
accepted mechanics equations. These initial strain measurements will give researchers

Santini-Bell et al - TRB 2010 11 of 16
insight into the change in strain history during the entire life of the bridge, from the initial,
self weight condition. Having these initial strain values opens up many doors to look at not
only change in strain values from a loaded to an unloaded condition, but change in strain
during the curing of the concrete deck, onset of composite action, strain due to environmental
effects, and overall progress of the bridge throughout repairs and modifications during the
bridge life.
FIGURE 7: VERNON AVE BRIDGE AFTER STEEL ERECTION, PRIOR TO CONCRETE DECK
FORMWORK PLACEMENT
Since the instrumentation was installed prior to steel erection, this allowed researchers the
time to capture data during several milestones in the construction process including the
continuous concrete deck pour. The concrete pour was the first major data collection,
however there were times during the rebar cage installation where strain values were taken.
Since the concrete deck was poured, data has been continuously collected every 5 minutes to
capture the onset of composite action and initial strain values of the bridge as a whole.
4.0 Structural Model Creation considering SHM and Condition Assessment Creating a model considering SHM and condition assessment requirements is much different than creating a model for design purposes. For example, boundary conditions, commonly considered as “fixed” or “pinned” in a design model, must be modeled with more accuracy for SHM and condition assessment. Stanton et al (2008) acknowledges that AASHTO design specifications for elastomeric bearing pads are highly conservative and not experimentally verified. There has been recent research on how to more accurately capture the rotational and axial stiffness for steel reinforced bearing pads, which will be used in the modeling of the Vernon Avenue Bridge (Stanton, 2008). Structural design uses modeling techniques as an aid in the design process along with the AASHTO code to ensure the safety of the bridge, which is typically and rightly so conservative compared with the actual structural response as is the nature of civil structure design.
Santini-Bell et al - TRB 2010 12 of 16
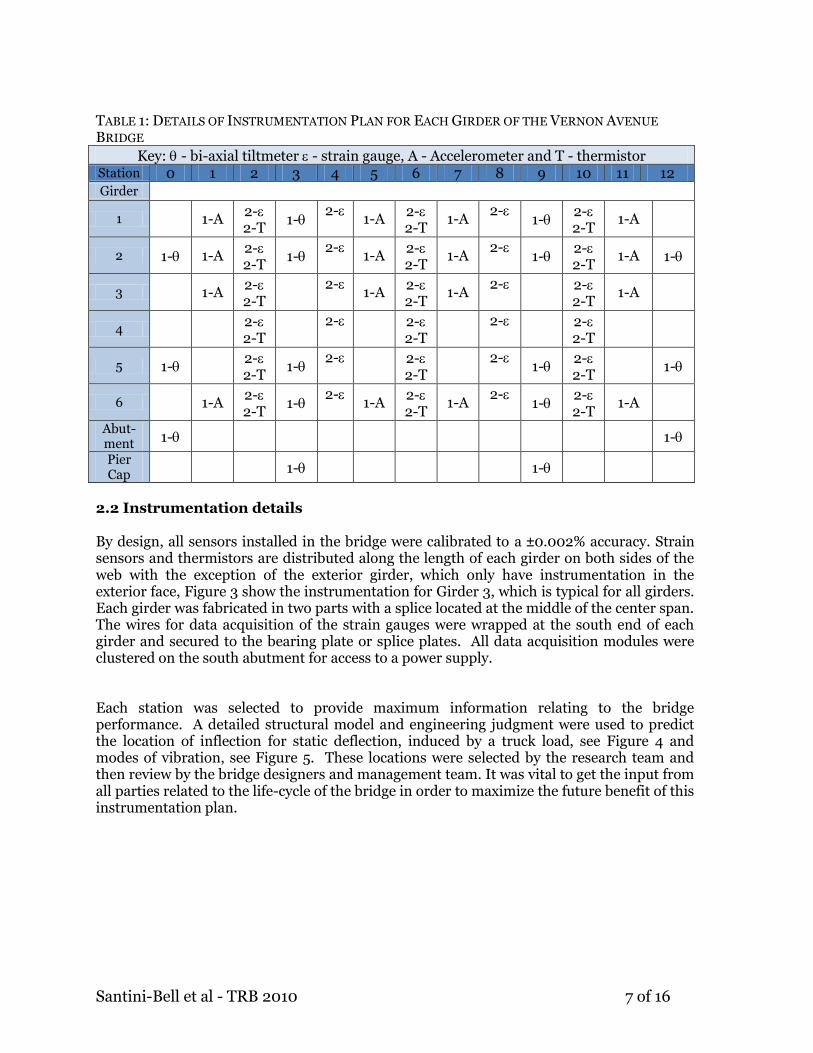
This “monitoring based modeling” mimics the structural response of the Vernon Ave Bridge. At the most basic level of SHM for condition assessment, data collected from the structural response of the bridge is compared with the same measurements taken from a computer based model, and adjustments are made to the computer model to match measured values. Basic design models are inadequate to perform this task since some elements are traditionally omitted such as, including steel diaphragms, deck reinforcement and bearing pads. Reinforcement in the deck must be included to accurately capture the proper bending and axial behavior exhibited as test loads are applied. All components influencing structural behavior must be modeled for accurate condition assessment. In design, elements can be included in the final design, maybe not even be included in the model, i.e. bridge expansion joints to account for temperature changes. With this being said, changing from a design model to a monitoring based model does not require a significant, unimaginable amount of work. 4.1 Predictive Monitoring Based Structural Modeling for the Vernon Avenue Bridge Currently, as part of the NSF research project, there are two types of computer based model being created in order to draw a comparison to determine the amount of detail needed in a computer model to accurately capture the structural response of the bridge. One model that is being created is a very detailed finite element model, consisting of solid elements representing the concrete deck, and shell elements representing the steel girders, see figure 8. The cross section of the bridge was initially drawn in SAP2000 and then extruded along the length of the bridge. Because the baseline model needs to capture the performance of the actual bridge structure, there can be no assumptions made during the creation process. All elements, including typical non structural elements, must be included. Based on previous research, environmental factors such as temperature can significantly affect strain readings taken under different weather conditions. The baseline model includes temperature gradients in order to capture the variation of stresses that develop in members due to changing temperatures. The creation of the baseline model was saved in stages in order to parallel the construction process. This allows the opportunity to calibrate the model throughout the construction process with the end goal being a highly accurate living model that can be used for bridge management. The detailed model is being created to include every detail of the bridge that could possibly be included and modeled using a finite element package, essentially the “perfect” bridge model.
FIGURE 8: DETAILED FINITE ELEMENT MODEL OF THE VERNON AVENUE BRIDGE

Santini-Bell et al - TRB 2010 13 of 16
The other type of model that is being created is using the BrIM in SAP2000® for the basic geometry of the bridge, and then the BrIM is turned off, and a few additions are made to change from the design based model into a monitoring based model. However, unlike the first model this model has frame elements, and most of the overall bridge modeling is done using a step-by-step bridge wizard. The common elements that will be involved in bridge modeling, such as Vernon Avenue Bridge, are beam elements t0 represent the girders and support piers, shell and/or brick elements to represent the deck, see Figure 9, and spring elements to represent the boundary conditions. From this comparison of the two models, researcher will be able to create a matrix that shows the time used to create both models and how the different models were able to predict the behavior of the actual bridge structure. This entire process differs from the element by element typical design process of a bridge, however design based modeling is becoming more popular. The researchers feel that this gives a better insight into bridge behavior because bridge analyzed by modeling the complete structural system accounts for the behavior of the deck and its interactions with bridge girders, as opposed to analyzing each girder as an individual beam (Brenner et al, 2005).
FIGURE 9: VERNON AVENUE BRIDGE AS MODELED IN SAP2000®
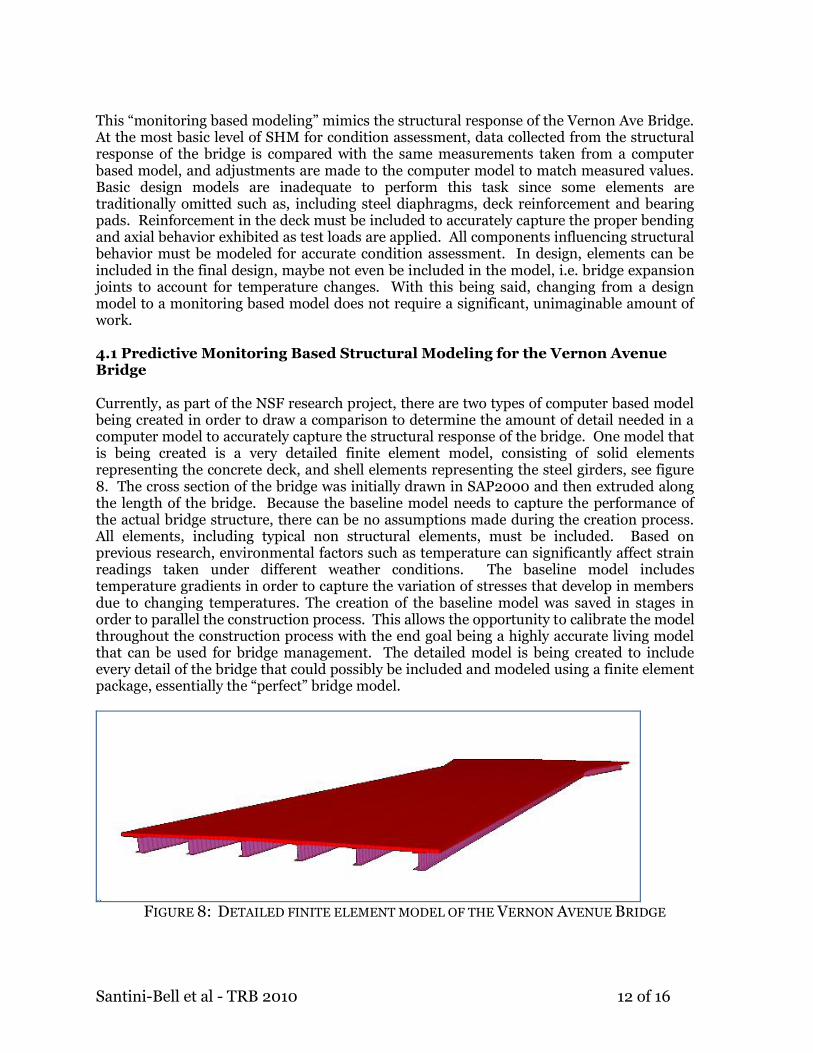
Strain data from the concrete deck pour is in the process of being processed, however as shown in Figure 10 the data looks very promising. These two graphs show strain in strain gauge 5 and 6, which are located at the midspan of the main span on girder one, top and bottom respectively. It can be seen that there is a large change in strain at approximately 8:45 AM, when the concrete pour approached the area where these strain gauges are located. These graphs only show the strain history for the first three hours of the concrete pour, data was collected during the entire pour and continued after to capture change in strain due to the deck curing.
Santini-Bell et al - TRB 2010 14 of 16
FIGURE 10: STRAIN GAUGE SG5 (A) AND SG6 (B) DURING CONCRETE DECK POUR ON 10 JULY
2009 Model updating relates measured data to the analytical model, giving validity to both the analytical model and the measured test data. The difference between the design parameters and the estimated parameters reveals the condition change in the structure. Using a discrete FEM, the structural parameter estimates reveal not only damage location but also damage severity. Parameter estimation helps determine the current load rating of an in-service bridge accounting for any loss in stiffness during its life. It can also be used to predict the remaining life of in-service structures given current loading conditions (Santini-Bell, 2008). 5.0 Conclusion and Future Work The Vernon Avenue Bridge is a three span, composite concrete deck and steel girder bridge. The structural models created for this project are a meaningful base for the evaluation of the collected data. Each phase of data was used to refine the structural sub-system prior to combing them for the overall system behavior. These models are more comprehensive than a structural design analytical model. Not only must the model capture the geometric and section properties, connection characteristics and boundary conditions (Santini et al, 1999) but also all of the loading influences on the bridge. Typical methods for bridge design lead to well designed structures, however fail to accurately capture actual global structural behavior. When measured structural response is required to match a predictive model, typical structural modeling methods fall short. Changing from a design model to a condition assessment model for use with a structural health monitoring programs would provide bridge managers an in-depth understanding of structural behavior through the in-service life of the bridge with relatively little effort. The SHM and condition assessment program being developed for the Vernon Avenue Bridge will be used by the research team as a benchmark example showing the process can provide useful information for asset allocation, and be fairly simple using an established framework. Another bridge in Gilford, New Hampshire will be instrumented during construction during summer 2010. The lessons learned during this instrumentation and testing process will be applied to the Gilford bridge. This bridge will be integrated into a state-wide New Hampshire GIS-based infrastructure management for condition assessment of the bridge inventory in New Hampshire.

Santini-Bell et al - TRB 2010 15 of 16
Acknowledgements This research was supported by the Partnership for Innovation program at the NSF (Grant #0650258), the CAREER program at the NSF (Grant #0644683), and with assistance from the Partnership for Innovation program also at the NSF. The authors would like to acknowledge the assistance of the Massachusetts Highway Administration, the Town of Barre, the general contractor, E, T&L Corporation, the steel fabricator, High Steel, INC, the steel erector, Atlantic Bridge and Engineering, INC. and Tattan Electric. References AASHTO (2008). “Bridge the Gap, Restoring and Rebuilding the Nation’s Bridges.” July 31,
2008. http://www.transportation1.org/BridgeReport/docs/BridgingtheGap.pdf.
Aktan A. E., Farhey, D.N., Helmicki, A. J., Brown D. L., Hunt, H. J., and Lee, K.L. (1997). “Structural Identification for Condition Assessment: Experimental Arts.” Journal of Structural Engineering, ASCE, 123(12), 1674-1684.
American Association of State Highway and Transportation Officials (AASHTO). (2004). “LRFD Bridge Design Specifications.” 3rd Ed., Washington D.C.
Bowman, M.M. (2002). “Load Testing of the Carbon FRP Grid Reinforced Concrete Bridge Deck on the Rollins Road Bridge, Rollinsford, New Hampshire”. M.S. Thesis, University of New Hampshire.
Brenner, B., Sanayei, M., Lattanzi, D., and Santini-Bell, E. (2005). “Evaluation of Highway Bridge Strength Considering Parapets.” Bridge Structures, 1(3), 273-280.
Chang, F.K. (2003). “Structural Health Monitoring 2003: From Diagnostics & Prognostics to Structural Health Management, Proc. 4th International Workshop on Structural Health Monitoring, DEStech, Stanford, CA.
Chase, S.B. (2006). “Condition Assessment of Highway Structures: Past, Present, and Future.” Proc. of 2006 Transportation Research Board, No. P06-1360.
Copeland, L. (2006). “U.S. Interstate System marks 50 years today.” USA Today (usatoday.com), June 29, 2006. (http://www.usatoday.com/news/nation/2006-06-28-interstate-system_x.htm)
Cuehlo, E., Stephens, J., Smolenski, P., and Johnson, J. (2006). “Evaluating Concrete Bridge Deck Performance Using Active Instrumentation.” Proc. 2006 Transportation Research Board, No. P06-2941.
Farrar, C. R., Sohn, H., Hemez, F. M., Anderson, M. C., Bement, M. T., Corwell, P. J., Doebling, S. W., Schultze, J. F., Lieven, N., and Robertson, A. N. (2003) "Damage Prognosis: Current Status and Future Needs" Los Alamos National Laboratory Report LA-14051-MS.
Franco, G; Betti, R; Lus, H. (2004). “Identification of structural systems using an evolutionary strategy,” Journal of Engineering Mechanics, ASCE 130 (10): 1125-1139.
Gifford, J. L. (2006). “What the Interstate Highway System Meant for the Nation.” Proc. 2006 Transportation Research Board, No. P06-0334.
Guo, S.J. (2002). “Improvement of a tail-plane structural model using vibration test data,” Journal of Sound and Vibration, 256 (4): 647-663.

Santini-Bell et al - TRB 2010 16 of 16
Hibbler, R. C. (2005). “4.6 Thermal Stress.” Mechanics of Materials – Sixth Edition, Prentice Hall, 154-158.
ISHMII (2004). “Structural Health Monitoring seen as essential for FHWA vision.” International Society for Structural Health Monitoring of Intelligent Infrastructure. http://www.ishmii.org/News/forFHWAvision.
Jang, J.H., Yeo, I., Shin, S., and Chang, S.P. (2002). “Experimental Investigation of System-Identification-Based Damage Assessment on Structures.” Journal Structural Engineering, ASCE, 128(5), 673-682.
Kangas, S., Wang, X., Padur, D., Li, Z., Lui, L., Helmicki, A., Swanson, J., and Hunt, V., (2003). "Field Test-Based Calibration of Bridge Finite Element Models for Condition Assessment," Proceedings: NDE/NDT for Highways and Bridges, ASNT, Pittsburgh, PA, Oct. 15-17, 2003
Lenett, M.S., Hunt, V., Helmicki, A., and Aktan, A. (2001). "Instrumentation, Testing, and Monitoring of a Newly Constructed Reinforced Concrete Deck-on-Steel Girder Bridge - Phase III," Report Submitted to the Ohio Department of Transportation, May 2001
Moorty, S. and Roeder, C. W. (1992). “Temperature-Dependent Bridge Movements.” Journal of Structural Engineering, ASCE, 118(4), 1090-1105.
Padur, D., Wang, X., Türer, A., Swanson, J., Helmicki, A. and Hunt,V., (2002). "Non Destructive Evaluation/Testing Methods - 3D Finite Element Modeling of Bridges," Proceedings: NDE/NDT for Highways and Bridges, ASNT, Cincinnati, OH, Sept 10-13, 2002
Riad, M. Y., Shourky, S.N. and William, G.W. (2006). “Remote Health Monitoring and Modeling of Star City Bridge, West Virginia.” Proc. of 2006 Transportation Research Board, No. P06-2843.
Santini-Bell, E. (2008), “A Bridge Condition Assessment Framework Integrating Structural
Health Monitoring and Intelligent Transportation Technology,” Proc. of 2008
Transportation Research Board, No. P08-2498.
Sohn, H., Dzwonczyk, M., Straser E. G., Kiremidjian, A. S., Law, K. H., and Meng, T. (1999). “An Experimental Study of Temperature Effect on Modal Parameters of the Alamosa Canyon Bridge,” Earthquake Engineering and Structural Dynamics, John Wiley & Sons, 28, 879-897.
Stanton, J. F., Roeder, C. W., Mackenzie-Helnwein, P., White, C., Kuester, C., & Craig, B. (2008). NCHRP Report 596 - Rotational Limits for Elastomeric Bearings. Washington, D.C.wS
Wipf, T. (1991). “Use of tilt sensing equipment for monitoring long-term bridge movement.” Canadian Journal of Civil Engineering, 18, 1033-1046.