Embed Size (px)
Citation preview

Feb
ruar
y 2,
201
2
I&C PROJECT MANAGER WATER DIVISION JULIE INMAN
INSTRUMENTATION & CONTROL FOR WTP OPTIMIZATION

AGENDA
Drivers I&C Definitions and Components Areas of Opportunity / Examples
2

DRIVERS
OPERATIONS & MAINTENANCE Improve Predictability
Reduce Leakage and Waste Optimize Plant Operation and
Control
CUSTOMERS W/WW Rates
Demand & Quality Goals Be a Leader in Environmental
Stewardship
REGULATORY 2012 Stage 2 DBP Carbon Emissions
Possible Future Limitations on Energy Use
FINANCIAL Economic Downturn
Energy Prices Predict, Reduce, & Control Operating Costs
Page - 3
February 2, 2012
3

I&C Systems are tools you can use to….
Optimize Operations Maximize Benefits of Existing Assets
THE NEW MANTRA….DO MORE WITH LESS
February 2, 2012
4

I&C DEFINITIONS AND COMPONENTS
5

• PCS – Process/Plant Control System
• DCS – Distributed Control System • SCADA – Supervisory Control and Data Acquisition
• PLC – Programmable Control System • RTU – Remote Terminal Unit
• DCU – Distributed Control Unit
• FCU – Field Control Unit • I/O – Inputs/Outputs • HMI – Human Machine Interface
ALPHABET SOUP
February 2, 2012
6

• Instrumentation / Final Control Elements
• Field Controller and I/O (PLC, RTU, FCU) • Communication Systems
• Networks • Host / Servers
• Client / Workstations
• Historical Data Collection • Reporting
INSTRUMENTATION & CONTROL SYSTEM COMPONENTS
February 2, 2012
7

TYPICAL CONTROL SYSTEM February 2, 2012
8
I-2
Pump
PLCP-4
Wireless Communications
RTU
PLC Network
Firewall
Historian Server 1 Server 2
SCADA Network
` `
In-Plant Wireless Comms
Intranet / Internet
`
Secure Remote Monitoring

AREAS OF OPPORTUNITY AND EXAMPLES
9
SEC
TIO
N H
EA
DIN
G–
OP
TIO
NA
L
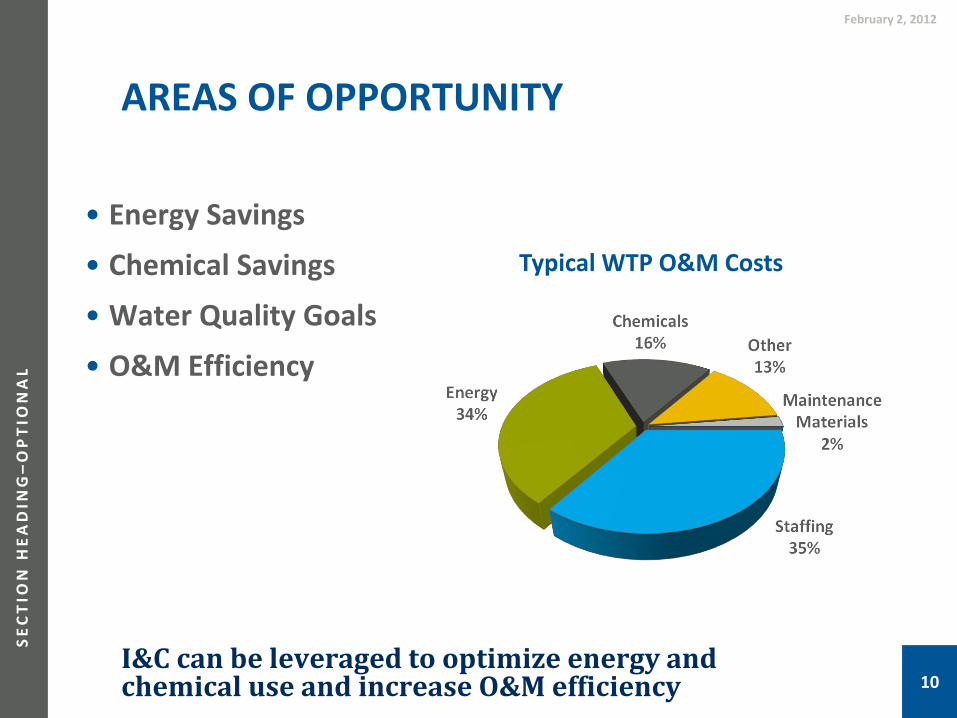
I&C can be leveraged to optimize energy and chemical use and increase O&M efficiency
• Energy Savings
• Chemical Savings • Water Quality Goals
• O&M Efficiency
AREAS OF OPPORTUNITY
February 2, 2012
10
Typical WTP O&M Costs

FILTER OPTIMIZATION WATER QUALITY CHEMICAL USAGE
PRESENTER NAME OPTIONAL TITLE COMPANY DIVISION
11

Information Should be Meaningful and Easy to Access
• Filter Run Time
• Filter Run Volume • Net Water Production
• Flow
• Head loss • Turbidity • Particle counts
FILTER OPTIMIZATION
February 2, 2012
12
OPERATOR DISPLAYS – TREND HISTORICAL DATA

Regulatory Reporting and Optimization
• Tungsten or LED light source • 0.1 to 100 NTU • Regulatory Reporting • Optimization up to 0.1 NTU
• Laser Diode light source • 0.005 to 5.0 NTU • Optimize > 0.1 NTU
• Raw Water, Settled Water, Individual Filter Effluent, Combined Filter Effluent
• Filter-to-Waste based on Turbidity
TURBIDITY MEASUREMENT
February 2, 2012
13

Historical Data Collection, Trending and Reporting
• Particle size and quantity
• Stand alone computer software • SCADA Integration
• Open communication protocols for integration with SCADA
• Multiple Analog Outputs
• Interpreting data important
• Raw Water, Settled Water, Individual Filter, Combined Filter, Clearwell
PARTICLE COUNTERS
February 2, 2012
14

• Detect particle breakthrough
• Filter Backwash Selection • Filter-to-Waste Control
• Coagulant Optimization • Detects GAC fines, coal dust
• Floc Particle Characterization
• Raw Water Variations • Clearwell Problems
PARTICLE COUNTER APPLICATIONS AND BENEFITS
February 2, 2012
15

• Ensure stable, consistent flow
• Regular maintenance required • Raw and settled water installations require more
maintenance • Sensors upstream of chemical addition
• Sample tap on side of pipe
• Calibration
PARTICLE COUNTER CONSIDERATIONS
February 2, 2012
16

PH
OT
O C
RE
DIT
/PR
OJE
CT
TIT
LE
Optional section heading
• Measures colloidal and coagulant surface charge
• Display and Trend
• Automated Coagulant Feed Control • Raw Water Flow • pH • Streaming Current
STREAMING CURRENT DETECTORS (SCD)
February 2, 2012
17

Reduce chemical use 12% under stable conditions and 23% under varying raw water quality (Dentel and Kingery 1988)
• Greater benefits for highly variable raw water
• Optimized coagulant feed • Reduced chemical costs
• Longer filter runs • More consistent water quality
• Early detection of equipment malfunction
BENEFITS OF STREAMING CURRENT DETECTORS
February 2, 2012
18

• Not suitable for some source waters
• Sample Point/Sample Time • Scheduled PM, varies depending on water quality
• Evaluation period • Periodic comparison to Jar tests
STREAMING CURRENT DETECTOR CONSIDERATIONS
4 February 2012
19

• Total Organic Carbon
• UV254
• pH
• Sludge Density • Power Monitoring
ADDITIONAL ON-LINE MONITORING
PowerPoint Sample 13 January 2012
20

ENERGY EFFICIENCY
21

~80% of energy use is for Pumping
TYPICAL ENERGY USE FOR WTP
February 2, 2012
22
0.0%
10.0%
20.0%
30.0%
40.0%
50.0%
60.0%
70.0%
Perc
ent o
f Tot
al P
lant
Ene
rgy

• Operate Pumps Close to Best Efficiency
• Load Shift Pumping • Minimize Demand Charges
STRATEGIES FOR PUMPING OPTIMIZATION
February 2, 2012
23

PU
MP
ING
OP
TIM
IZA
TIO
N
• Display of real-time energy use and efficiency information on Operator Screens
• Smart Meter connected to SCADA
• Wire-to-water Efficiency Calculator for Pumps
MONITOR FINISHED WATER PUMP STATION EFFICIENCY
February 2, 2012
24 Tampa Bay Water – 8% Reduction in Energy Use
PU
MP
ING
OP
TIM
IZA
TIO
N
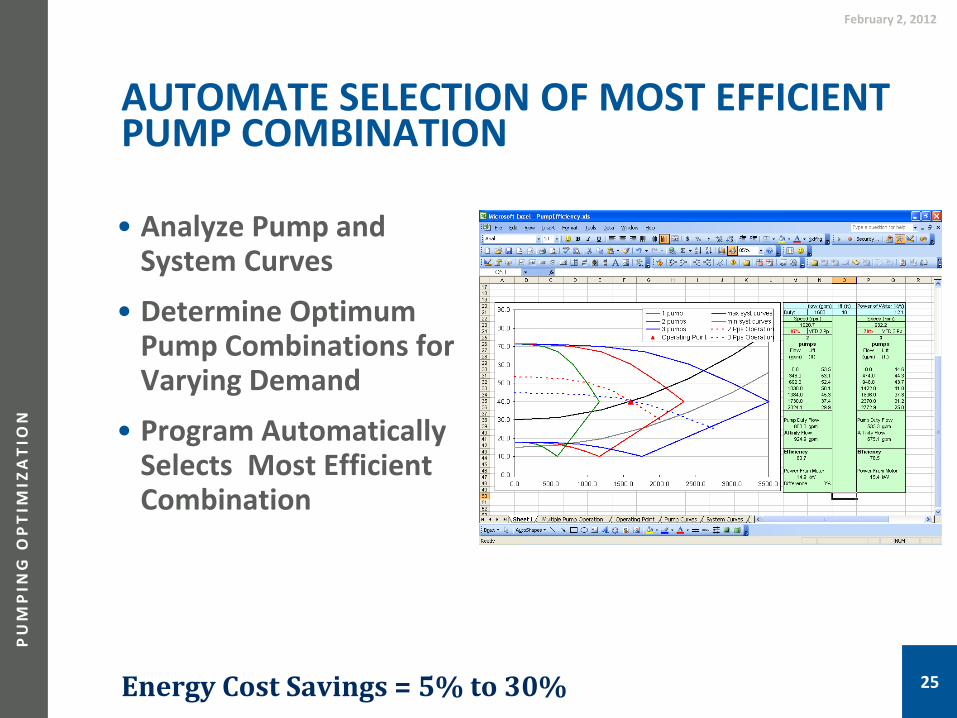
Energy Cost Savings = 5% to 30%
• Analyze Pump and System Curves
• Determine Optimum Pump Combinations for Varying Demand
• Program Automatically Selects Most Efficient Combination
AUTOMATE SELECTION OF MOST EFFICIENT PUMP COMBINATION
February 2, 2012
25
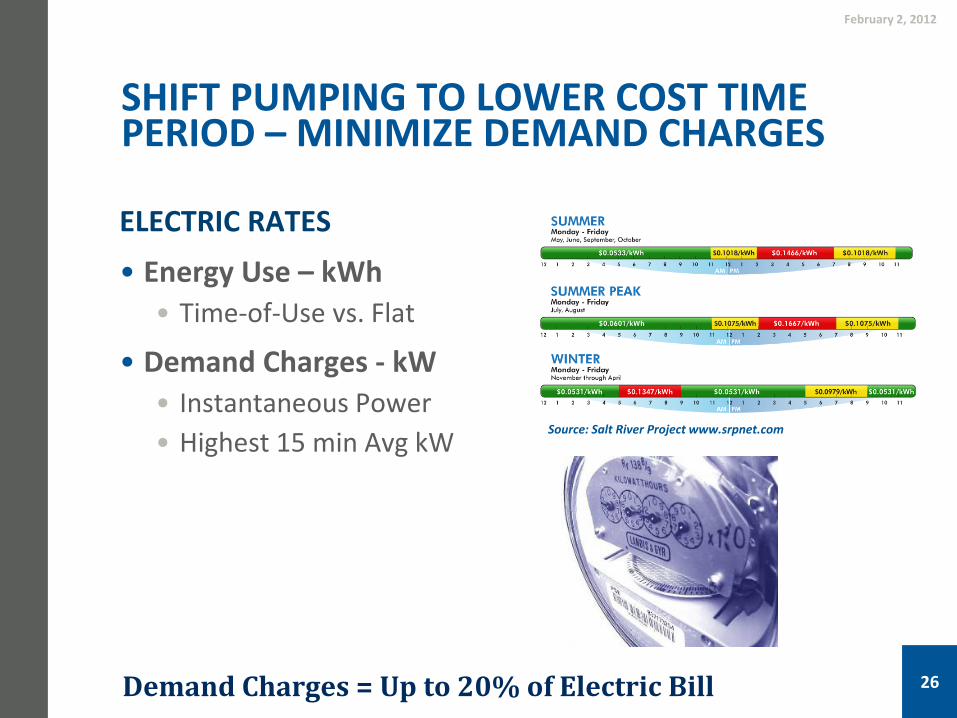
Demand Charges = Up to 20% of Electric Bill
ELECTRIC RATES
• Energy Use – kWh • Time-of-Use vs. Flat
• Demand Charges - kW • Instantaneous Power • Highest 15 min Avg kW
SHIFT PUMPING TO LOWER COST TIME PERIOD – MINIMIZE DEMAND CHARGES
February 2, 2012
26
Source: Salt River Project www.srpnet.com

EXAMPLE – CITY OF PEORIA OPTIMIZATION STUDY
February 2, 2012
27
Potential Annual Savings Sonoran Booster - $4,128 or 33.4% Jomax Boosters - $10,859 or 16.8%
• Low Cost Immediate Payback Measures
• PLC Programming for Time-of-use Pumping
• Analyzed Historical Data
• Modeled Optimized Pumping

• I&C Systems can be leveraged to…. • Optimize Operations • Maximize Benefit from Existing Assets
• Control System Displays, Trends and Reports • Meaningful • Easy to Access
• Monitor Multiple Parameters • Monitor Energy Use and Incorporate Energy
Efficiency Strategies
CONCLUSION
PowerPoint Sample 13 January 2012
28

THANK YOU Q&A