Embed Size (px)
Citation preview

Bulgarian Chemical Communications, Volume 48, Special Issue E (pp. 435 - 441) 2016
Instrumental texture characterization of bread
M. Momchilova, G. Zsivanovits*
Food Research and Development Institute, Plovdiv, Bulgaria Texture parameters of commercial bread samples were investigated by combined test method based on AACC 1998, modified
method 74-09 – texture profile analysis (TPA) – and AIB Standard Procedure for White Pan Bread firmness – firmness measurement of bread crumb by compression with a probe. Elasticity, firmness, plastic deformation and crispness values were collected for white and semi brown Bulgarian and Hungarian breads. Combined test methods were applied with texture analyser (Stablemicrosystems TAXT2) to receive fast and precise results for several parameters. Based on the evaluated data for the texture parameters, uncertainty, limit of detection (LOD) and limit of quantification (LOQ), repeatability, intermediate precision and reproducibility of the test method were calculated. Created database will be used as a basis for validation of a method that can be applied in everyday practice of quality control laboratories.
Keywords: texture profile analysis (TPA), uncertainty, limit of detection (LOD), limit of quantification (LOQ), repeatability, intermediate precision and reproducibility
INTRODUCTION
Bread is one of the most traditional and important food in the history of humankind. Today it should be already staple food with healthy claim. To reach this aim, new and traditional technologies are used in the bread industry. The mechanical and nutritional properties of breads may be related to the different performances during the chewing. The bread structure can be considered as solid foams, like cellular solids, with walls and voids [1], which has a low density (≤500 kg/m3) and high porosity (≥60%). The blended polymer (starch and proteins) matrix possesses viscoelastoplastic mechanical behaviour [2]. The most important factor of the texture is the water content. As far as the water acts as a plasticizer, it provides a plastic or rubbery soft texture to the bread crumb [3]. Other important parameters are the density and the porosity, which can explain the mechanical properties of cellular solid foams like bread crumbs. For example the modulus of elasticity can be expressed as a function of the density and known modulus for non-porous material [4]. However, the mechanical parameters, which can be extracted from a stress/strain relationship cannot be described with former equations, such as regular honeycombs formula [5], especially for the food products [3].
Most of the mechanical parameters (hardness, adhesiveness etc.) can be expressed based on the texture profile analysis (TPA) from stress - time or stress - strain diagrams [6, 7]. The parameters of TPA depends on the geometry of the used probe, on the deformation speed and on the clearance.
* To whom all correspondence should be sent: [email protected]
Although the TPA is extended for both solid and liquid (and semi-solid, semi-liquid) materials, it is not possible directly to compare the parameters observed for food samples with different textures [8]. The differences in the texture parameters which are evaluated from different measurement methods forced the identification and quantification of the potential errors – validation – for the different materials [9]. To consider the potential error parameters, all of the feasible factors should be analysed, which one should have more attention during the procedure. ISO/IEC 17025:2005 requires laboratories to evaluate and report their measurement uncertainty under specific circumstances [10, 19].
The steps of the uncertainty calculation (validation):
Step 1. Identifying the parameters of uncertainty estimation.
Step 2. Identifying all sources of uncertainty. Step 3. Classifying the uncertainty according to
type A (repeated observation) or B (other type observations).
Step 4. Estimating the standard uncertainty for each source of uncertainty
Step 5. Computing the combined uncertainty uc Step 6. Computing the expanded uncertainty U Step 7. Reporting of results [10, 11]. The aim of this study was to analyse and
simplify the TPA method to obtain informative results for most of the texture parameters of the bread. That simplified method with validation can be used later in a certified laboratory. To reach this aim, commercial Bulgarian and Hungarian breads were measured by the same instrumental methods at the FRDI, Plovdiv, Bulgaria and at the
© 2016 Bulgarian Academy of Sciences, Union of Chemists in Bulgaria
435

M. Momchilova, G. Zsivanovits: Instrumental texture characterization of bread
Department of Physics and Control at the Corvinus University of Budapest, Hungary.
EXPERIMENTAL DETAILS
Materials: The study was carried out on commercial breads in Bulgaria and in Hungary (semi brown and white). Loaves of sliced bread were purchased in a local market and stored at ambient temperature in the original package until investigation. The loaves were bought from the freshest batch. The experiments were done on the purchasing day. The first three slices of the both ends of the loaves were left out of experiments. For better statistical randomization, the used slices were chosen from three loaves.
Experimental methods: StableMicroSystem TAXT2 texture analysers were used in both institutions (Fig.1). The instrument is supplied by the manufacturer with calibration methods for the deformation, for the force measurement, for the tare of 0 g and for the sample weight. Set of data acquisition was 200 PPS (point/second = Hz). The used method is a combination between TPA and penetration test based on AIB standard. The goal of development such a combined method, is easier
application to the product and at the same time evaluation of more parameters.
Fig.1. StableMicroSystem TAXT2 texture analyser
Standard test methods applied in usual laboratory practices:
Fig.2. TPA method
a) AACC 1998, modified method 74-09 (TPA): Two loadings with a cylindrical probe (=36 mm), the deformation speed is 1.7 mm/s, the relative deformation is 40 %, slice thickness' e.g. 25 mm or 2*12.5 mm [12]. The TPA method gives the most parameters, like hardness, springiness, cohesiveness, gumminess, chewiness, but the second loading makes the deformation analysis difficult [2, 12]. The sample preparation of cylindrical breadcrumb from softer bread is also
tricky difficult. At practical application for research, the TPA method is maybe the best but for quality control, a fast and easy way is necessary (Fig.2.).
b) AIB Standard Procedure for White Pan (trapeze shape) Bread firmness: One loading section with a cylindrical probe ( = 1” = 25.1 mm), the deformation speed is 1.7 mm/s to 6.2 mm deformation on 2*0.5” (≈2*12.55 mm) thick slices of bread. The used firmness value is the maximum
436
M. Momchilova, G. Zsivanovits: Instrumental texture characterization of bread
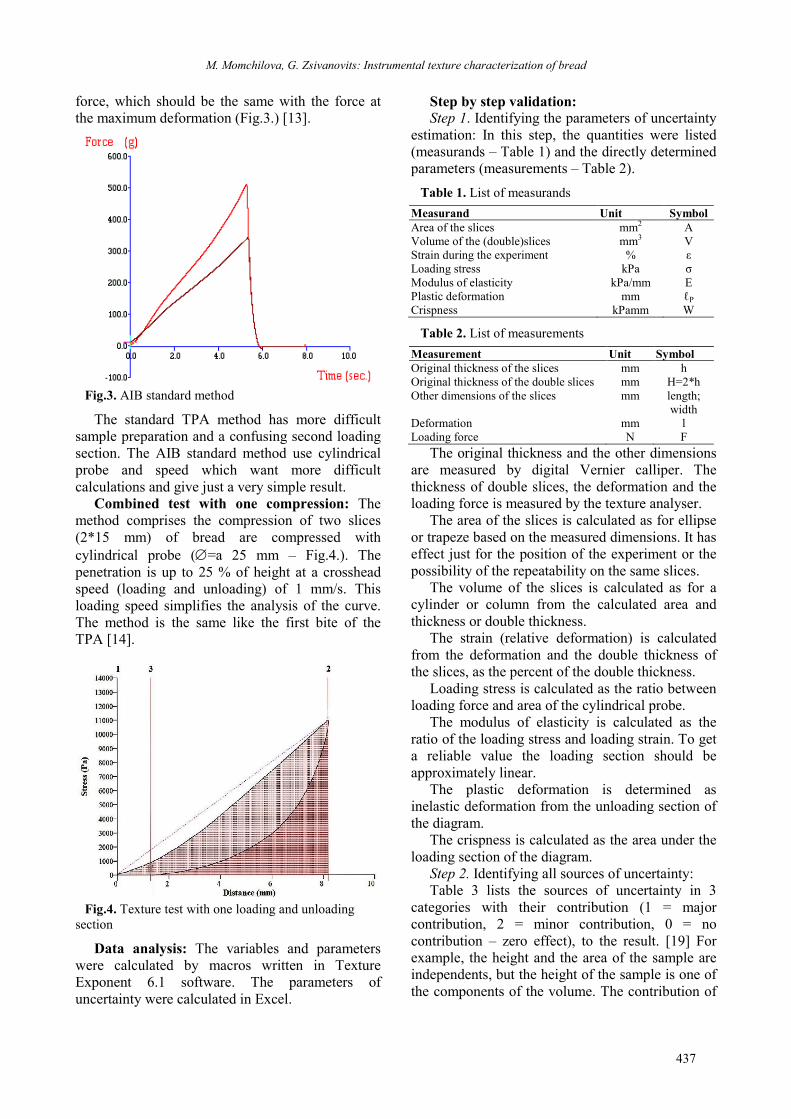
force, which should be the same with the force at the maximum deformation (Fig.3.) [13].
Fig.3. AIB standard method
The standard TPA method has more difficult sample preparation and a confusing second loading section. The AIB standard method use cylindrical probe and speed which want more difficult calculations and give just a very simple result.
Combined test with one compression: The method comprises the compression of two slices (2*15 mm) of bread are compressed with cylindrical probe (=a 25 mm – Fig.4.). The penetration is up to 25 % of height at a crosshead speed (loading and unloading) of 1 mm/s. Тhis loading speed simplifies the analysis of the curve. The method is the same like the first bite of the TPA [14].
Fig.4. Texture test with one loading and unloading
section
Data analysis: The variables and parameters were calculated by macros written in Texture Exponent 6.1 software. The parameters of uncertainty were calculated in Excel.
Step by step validation: Step 1. Identifying the parameters of uncertainty
estimation: In this step, the quantities were listed (measurands – Table 1) and the directly determined parameters (measurements – Table 2).
Table 1. List of measurands
Measurand Unit Symbol Area of the slices mm2 A Volume of the (double)slices mm3 V Strain during the experiment % ε Loading stress kPa σ Modulus of elasticity kPa/mm E Plastic deformation mm ℓP Crispness kPamm W
Table 2. List of measurements
Measurement Unit Symbol Original thickness of the slices mm h Original thickness of the double slices mm H=2*h Other dimensions of the slices mm length;
width Deformation mm l Loading force N F
The original thickness and the other dimensions are measured by digital Vernier calliper. The thickness of double slices, the deformation and the loading force is measured by the texture analyser.
The area of the slices is calculated as for ellipse or trapeze based on the measured dimensions. It has effect just for the position of the experiment or the possibility of the repeatability on the same slices.
The volume of the slices is calculated as for a cylinder or column from the calculated area and thickness or double thickness.
The strain (relative deformation) is calculated from the deformation and the double thickness of the slices, as the percent of the double thickness.
Loading stress is calculated as the ratio between loading force and area of the cylindrical probe.
The modulus of elasticity is calculated as the ratio of the loading stress and loading strain. To get a reliable value the loading section should be approximately linear.
The plastic deformation is determined as inelastic deformation from the unloading section of the diagram.
The crispness is calculated as the area under the loading section of the diagram.
Step 2. Identifying all sources of uncertainty: Table 3 lists the sources of uncertainty in 3
categories with their contribution (1 = major contribution, 2 = minor contribution, 0 = no contribution – zero effect), to the result. [19] For example, the height and the area of the sample are independents, but the height of the sample is one of the components of the volume. The contribution of
437

M. Momchilova, G. Zsivanovits: Instrumental texture characterization of bread
sample height to relative deformation maybe high, but from the viewpoint of measured loading strength, modulus of elasticity, plastic deformation or crispness it is already much smaller, because the variation interval is small for factory sliced bread. The contribution of length and width of the slides to the measured parameters is higher because these contain indirect factor to the position of investigation like the distance from the crust of the bread. The explanation of the contribution of other parameters is very similar. The parameters of the environment have high contribution to the measured strength value, but in our experiments, they had with constant value and in that case, they are not used in the calculation of combined uncertainty.
Table 3. Sources of uncertainty and their likely contribution to uncertainties
Source of uncertainty
A V ε σ E ℓP W
1. Test specimen h 0 2 2 2 2 2 2 H 0 2 2 2 2 2 2 length; width 2 2 1 1 1 1 1 l 0 0-2 2 2 2 2 2 F 0 1 2 2 2 2 2
2. Test settings Loading speed 0 0 2 2 2 2 2
0 0 2 2 2 2 2 Max. ε 0 0 2 2 2 2 2 Accuracy of the instrumentation
2 2 2 2 2 2 2
Calibration of T.A. 0 1 2 2 2 2 2 3. Environment
Ambient T 1 1 2 2 2 2 2 Humidity 1 1 2 2 2 2 2
Accuracy and calibration of the instrumentation: Accuracy of the digital Vernier calliper is given in the guide: measuring range: 0-150 mm; resolution: 0.01 mm; accuracy: 0.02 mm; repeatability: 0.01 mm. The measuring ranges for the texture analyser as follows: deformation 0.001 mm – 370 mm; force 0.01 N – 500 N; time 0.01 s – 1 000 000 s; and speed 0.01 mm/s – 40 mm/s. The resolutions are 0.001 mm; 0.001 N; 0.01s and 0.01 mm/s in respective. The trigger force of the instrument is 0.05 N, which means that the start point of the diagram is around 0.05 N [15]. In the way of the validation the limits of detection (LOD) and quantitation (LOQ) were computed [10]:
LOD = 3.3*accuracy (1) LOQ = 10*accuracy (2)
The Vernier calliper has LOD = 0.066 mm; LOQ = 0.200 mm. The values of LOD and LOQ for texture analyser are partly calculated based on the
measured data. LOD and LOQ of the thickness and the deformation were computed based on the measured thickness of the bread slices: LOD = 0.244 mm; LOQ = 0.739 mm. For the test of the force based on the test settings (trigger force = 0.05 N) LOD = 0.165 N; LOQ = 0.500 N. From technological viewpoint and based on our experiences the LOD and LOQ of the texture analyser are negligible in comparison with other error parameters.
Step 3. Classifying the uncertainty according to type A or B: All of the sources of uncertainty are type B, because they are not from repeated observation for the probes, but if the determination of texture parameters is repeated several times on the slices at different positions they become to type A. From reporting view, the experiment is repeated in more slices from the loaves and on slice of more loaves as well to have average values to characterize the type of the bread [10].
Step 4. Estimating the standard uncertainty for each source of uncertainty: Measurement uncertainty is a parameter associated with the results of a measurement that characterises the dispersion of the values that could reasonably be attributed to the measurand [16]. The association of uncertainty to the results help to obtain more reliable results [11]
The standard uncertainty for each source of it was calculated from relative standard deviation:
���=
��
√� (3)
where �� =�
�
n is the number of sample pieces [10]. Step 5. Computing the combined uncertainty uc The combined uncertainty is computable based
on the uncorrelated sources of the uncertainty:
��(�) = ��[���(��)]�
�
���
(4)
where ci is the sensitivity coefficient associated with xi. The combined uncertainty has an associated confidence level of 68.27% [18].
Step 6. Computing the expanded uncertainty U The expanded uncertainty was calculated from the standard uncertainty based on the next formula:
� = ���(��)�
�
���
(5)
438
M. Momchilova, G. Zsivanovits: Instrumental texture characterization of bread
where k is a constant for the confidence interval (for normal distribution k ≈ 2 at confidence probability P=95%) [10].
The normal distribution was controlled based on normal asymmetry:
�������� =�
(� − 1) ∙ (� − 2)��
�� − �̅
���
(6)
and standard excess (-2<value<2):
��������
= ��(� + 1)
(� − 1)(� − 2)(� − 3)��
�� − �̅
���
�
−3(� − 1)�
(� − 2)(� − 3)
(7)
In equation (6) and (7) s = sample standard deviation.
Step 7. Reporting of results [10]. The results should be reported at P=95%
confidence level in the following format for each measurand:
� = � ± � (8)
where V is the estimated value of the measurand, y is the test (or measurement) mean result, U is the expanded uncertainty associated with y.
Repeatability, intermediate precision, reproducibility of the result: They are smallest, middle and highest variations of the results [10].
Repeatability: The smallest variations are received if the experiments are repeated on identified materials, by the same person and with the same instrument.
r = √2 ∗ � ∗ �� (9)
With normal distribution and 10 repeating t = 1.83:
�� = ���� =∑���
� (10)
Intermediate precision (ISO 5725-3): Middle variations are received if the experiments are repeated in the same laboratory, by different persons and with the most different conditions.
R = √2 ∗ � ∗ �� (11)
�� = ���� + ��
� (12)
Reproducibility: The highest variation of the results is received in different laboratories by the same methods and on identified probes.
R = √2 ∗ � ∗ �� (13)
�� = ���� −���
�= �̂ ∗ ���� (14)
sr ≤ sI ≤ sR (15)
Like a compromise variation the formulas (10), (12) and (14) can be used in the same laboratory with the same instrument but for different probes (e. g. different breads – semi brown and white).
RESULTS AND DISCUSSIONS
From the viewpoint of the validation, there are no differences between the above described tests, but the values of uncertainty sources (Table 3) are strongly depend on the settings of the instrument. The loading speed and maximum deformation are maybe the most important parameters in this case. The used measure probe was selected based on our instrument set. To compare the results for the probes with different diameters it is better to evaluate the loading stress (� = � �;[�]⁄ =� �� = ��⁄ ) [17].
Based on Table 1 to Table 3 the most important measurements in uncertainty are double height (H). As reported calculated parameters the uncertainty is given for loading stress (), elastic modulus of E; plastic deformation (ℓP) and crispness (W) [18]. These values are reported in Tables 4-6. The received uncertainty values are collected to the database and used for the calculations of results for the next clients.
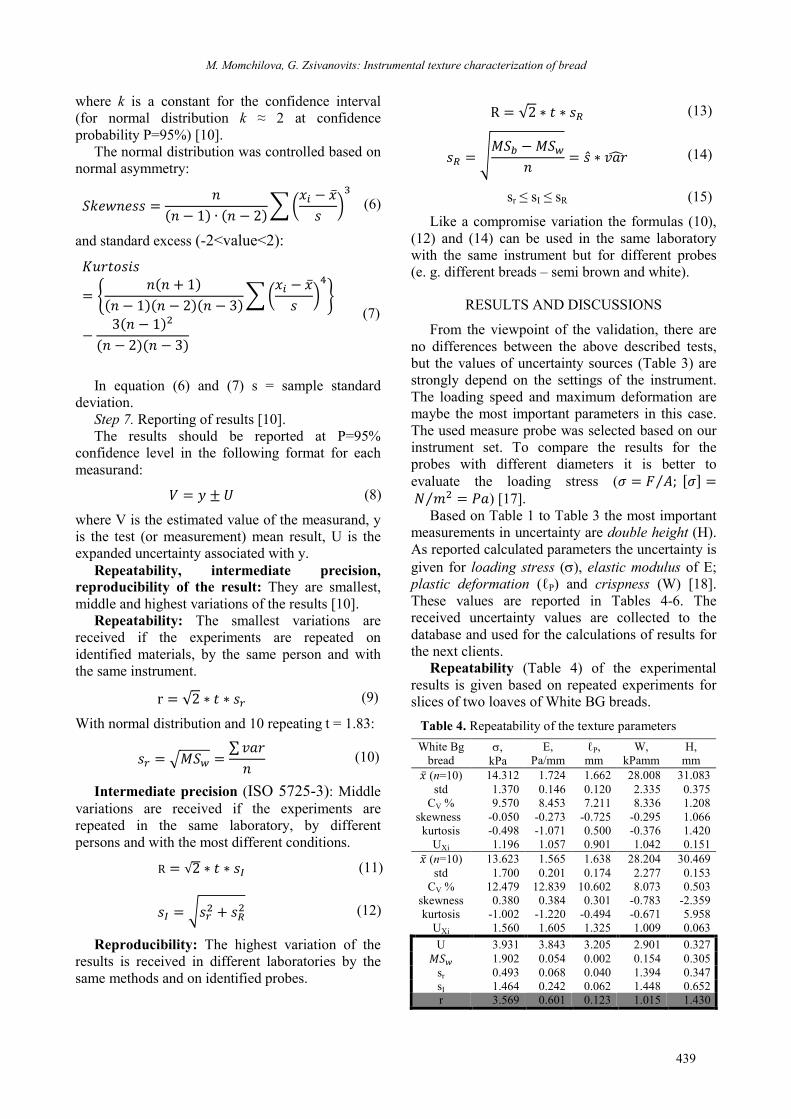
Repeatability (Table 4) of the experimental results is given based on repeated experiments for slices of two loaves of White BG breads.
Table 4. Repeatability of the texture parameters
White Bg bread
, kPa
E, Pa/mm
ℓP, mm
W, kPamm
H, mm
�̅ (n=10) 14.312 1.724 1.662 28.008 31.083 std 1.370 0.146 0.120 2.335 0.375
CV % 9.570 8.453 7.211 8.336 1.208 skewness -0.050 -0.273 -0.725 -0.295 1.066
kurtosis -0.498 -1.071 0.500 -0.376 1.420 UXi 1.196 1.057 0.901 1.042 0.151
�̅ (n=10) 13.623 1.565 1.638 28.204 30.469 std 1.700 0.201 0.174 2.277 0.153
CV % 12.479 12.839 10.602 8.073 0.503 skewness 0.380 0.384 0.301 -0.783 -2.359 kurtosis -1.002 -1.220 -0.494 -0.671 5.958
UXi 1.560 1.605 1.325 1.009 0.063
U 3.931 3.843 3.205 2.901 0.327 ��� 1.902 0.054 0.002 0.154 0.305
sr 0.493 0.068 0.040 1.394 0.347 sI 1.464 0.242 0.062 1.448 0.652 r 3.569 0.601 0.123 1.015 1.430
439

M. Momchilova, G. Zsivanovits: Instrumental texture characterization of bread
The database of repeatability is steadily growing with every client of the laboratory and the result is more and more comparable and reliable.
The intermediate precision (Table 5) of the results was calculated based on the experiments of white BG and semi brown BG breads in the FRDI.
Table 5. Intermediate precision of the texture parameters
,
kPa E,
Pa/mm ℓP, mm
W, kPamm
H, mm
white Bg bread �̅ (n=40) 13.445 8.367 1.592 49.022 27.385
std 2.485 0.218 0.285 9.080 5.329 CV % 18.479 2.601 17.927 18.523 19.460
skewness 0.358 0.143 0.421 0.176 0.093 kurtosis -0.671 -1.211 -0.618 -1.157 -0.865
UXi 0.462 0.065 0.448 0.463 0.486 Half brawn Bg Bread
�̅ (n=40) 10.350 1.487 2.046 20.351 27.759 std 1.957 0.297 0.357 4.017 1.084
CV % 18.908 19.967 17.453 19.738 3.905 skewness 0.681 1.930 1.136 0.445 0.394 kurtosis 0.228 6.325 1.587 -0.507 -0.438
UXi 0.473 0.499 0.436 0.493 0.098
U 1.360 0.882 1.333 0.979 0.973 MSb= 32.231 0.162 0.394 143.290 21.695 MSw= 4.166 0.077 0.078 20.525 0.673 SR= 1.675 0.092 0.178 3.504 1.450 SI= 2.641 0.292 0.331 5.727 1.666
R 5.283 0.718 0.722 11.725 2.123
The database of the intermediate precision is also growing with every client.
The reproducibility (Table 6) was computed based on the results of white HU bread and white BG bread. The growing of reproducibility database also helps to obtain more comparable and reliable results.
Table 6. Reproducibility of the texture parameters
,
kPa E,
Pa/mm ℓP, mm
W, kPamm
H, mm
White Bulgarian bread �̅ (n=40) 13.445 8.367 1.592 49.022 27.385
std 2.485 0.218 0.285 9.080 5.329 CV % 18.479 2.601 17.927 18.523 19.460
skewness 0.358 0.143 0.421 0.176 0.093 kurtosis -0.671 -1.211 -0.618 -1.157 -0.865
UXi 0.462 0.065 0.448 0.463 0.486 UXi
2 0.213 0.004 0.201 0.214 0.237 White Hungarian bread
�̅ (n=40) 7.723 1.022 3.875 19.619 0.483 std 1.485 0.197 0.335 3.857 0.045
CV % 19.228 19.311 8.643 19.661 9.238 skewness 1.746 1.741 0.168 0.887 -0.174 kurtosis 4.315 4.273 -0.197 0.337 -0.168
UXi 0.481 0.483 0.216 0.492 0.231
U 1.342 0.982 1.323 1.343 1.376MSb= 655.047 6.508 93.428 1206.342 15.975MSw= 4.189 0.060 0.079 21.639 0.338SR= 8.068 0.803 3.055 10.884 1.250SI= 8.323 0.840 3.068 11.837 1.379R 21.540 2.173 7.941 30.634 3.569
Based on the results reported in tables 4-6 the repeatability of bread hardness is 3.569, the intermediate precision of it is 5.283, and the reproducibility of it is 21.540. For elastic modulus the values are r=0.601, R=0.718 and R=2.173 respectively. Based on the values, the client of the laboratory is informed about the statistical intervals of their products in comparison with similar earlier examined products. The laboratory collects the data already without information about the client and use the extended database for the next client.
The standards for texture analysis of bread suggest TPA or simple compression tests. Most of the sensory analysis parameters are related to the TPA test. The creep-recovery test is the nearest to the older instrumentation of the bread test (Elastigraph [19]). The above-applied method is fast and simple, to get minimum 4-5 parameters (Table 7), which well describe the stalling of the different breads. The used relatively small deformation is inside the elastic roles but uniform in deformation and shows the plastic properties as well [20]. The showed results
Table 7. The texture parameters of the breads
E W ℓP
kPa kPa/mm kPa.mm mm
White BG 13.45±2.48 1.59±0.29 49.0±9.08 1.71±0.216
Semi brown BG 10.35±1.96 1.49±0.30 34.32±6.29 2.05±0.357
White HU 7.72±1.49 1.02±0.20 27.53±4.75 3.87±0.335
Semi brown HU 8.45±1.57 1.13±0.22 33.96±5.68 1.90±0.265
CONCLUSION AND FUTURE WORK
The above described validation scheme is the beginning of database collection with aim to get a full validated method, which may be possible to use in international and national accredited laboratories and to apply it for other food products as well. The association of uncertainty help to obtain reliable results even if the measurements are not perfect. The FRDI expects to build a database for more and more Bulgarian or European breads. The validated method will be useful for other laboratories in international relation.
ACKNOWLEDGEMENT
The authors thank the Bulgarian Agricultural Academy, project № HTAI 128, the Erasmus+ staff mobility support and the Department of Physics and Control at Faculty of Food Science, Corvinus University of Budapest Hungary to accept the Erasmus+ staff mobility for training.
440

M. Momchilova, G. Zsivanovits: Instrumental texture characterization of bread
REFERENCES
1 Gibson, L. J., & Ashby, M. F. (1997). Cellular solids, structure and properties. Cambridge Press University, p. 510.
2 Lambertné Meretei, A. (2012). Módszer kenyérbélzet állományjellemzőinek meghatározására (PhD dissertation), Corvinus University of Budapest, Hungary (in Hungarian).
3 Guessasma, S., Chaunier, L., Della Valle, G., & Lourdin, D. (2011). Trends in Food Science & Technology, 22(4), 142.
4 Warren, W. E., & Kraynik, A. M. (1997). Journal of Applied Mechanics-Transactions of the ASME, 64, 787e798.
5 Onck, P. R. (2003). MRS Bulletin, 279. 6 Friedman, H.H., Whitney, J.E. and Szczesniak, A.
(1963). J. Food Sci., 28, 390. 7 Bourne, M. (1978). Food Technology, 32, 62 & 72. 8 Nishinari, K., Kohyama, K., Kumagai, H., Funami,
T., & Bourne, M. C. (2013). Food Science and Technology Research, 19(3), 519.
9 Guideline, I. H. T. (2005). Validation of analytical procedures: text and methodology. Q2 (R1), 1.
10 B. Magnusson and U. Örnemark (eds.) Eurachem Guide: The Fitness for Purpose of Analytical Methods – A Laboratory Guide to Method Validation and Related Topics, (2nd ed. 2014). ISBN 978-91-87461-59-0. Available from www.eurachem.org.
11 da Silva, L. R. O. (2004). Evaluation of the uncertainty of measurement of mechanical properties on the tensile testing. Simposio de Metrología.
12 AACC Method 74e09.01. (1995). Measurement of bread firmness by universal testing machine. AACC International Approved Methods.
13 AIB (2001). AIB Standard Procedure White Pan Bread Firmness Measurement. AIB Standard Procedures for Texture Measurement of Baked Products; https://www.aibonline.org/researchand technical/services/prodqualityeval/AIBTextureAnalysis%20Procedures.pdf.
14 Bartkiene, E., Schleining, G., Juodeikiene, G., Vidmantiene, D., Krungleviciute, V., Rekstyte, T., ... & Maruska, A. (2014). LWT-Food Science and Technology, 56(2), 445.
15 AIB Standard Procedure (2016): White Pan Bread Firmness Measurement, Manhattan, Kansas, USA. https://www.aibonline.org/aibOnline/Documents/EN/DevelopYourProductSolutions/AIBTextureAnalysisProcedures.pdf. Accessed 15 August 2016.
16 International vocabulary of basic and general terms in metrology (VIM) - 2nd edition 1993 (ISO/BIPM/IEC/IFCC/IUPAC/IUPAP/OIML).
17 Sitkei, G. (1987). Mechanics of agricultural materials (Vol. 8). Elsevier.
18 Gabauer, W. (2000). The determination of uncertainties in tensile testing. Voest-Alpine Stahl Linz GmbH: Linz, Austria.
19 Szalai, L. (2003). Sütőiparosok, Pékek, L.3., 19. (in Hungarian).
20 Della Valle, G., Chiron, H., Cicerelli, L., Kansou, K., Katina, K., Ndiaye, A., ... & Poutanen, K. (2014). Trends in Food Science & Technology, 36(1), 5.
441


![Register your product and get support at … · 2 ENGLISH Program 4.[French] French bread Bread will have a crisper crust and lighter texture 750g 1000g 1. Water 270 ml 350 ml 2](https://img.dokumen.tips/doc/110x75/5b98b27c09d3f2dc628ce46d/register-your-product-and-get-support-at-2-english-program-4french-french.jpg)