Embed Size (px)
Citation preview

Principle and application of Thermal methods of Analysis. (TGA, DTA, DSC),
Basic concepts of spectroscopy, Lambert and Beers law, Absorption and Emission spectroscopy Different spectroscopic Techniques ( UV- Visible and IR spectroscopy )
Flame photometry.
Analytical chemistry deals with the qualitative and quantitative methods of analysis of compound or molecule in precise and accurate way.Some analytical methods are
PNMRESRElectron diffractionX-ray diffractionMass spectroscopyUV-Visible and IR spectroscopy,etc
An instrumental technique is regarded as a thermal analysis method ,if the physical parameters are taken as a function of temperature or time.
Some thermal methods are TGA DTADSC
Introduction-It is a technique where weight of the substance ,in an environment ,heated or cooled at a controlled rate is recorded as a function of time or temperature.
a)Isothermal or static –Sample weight is recorded as a function of time at constant temperature.
b)Dynamic TGA-Sample is heated in an environment ,whose temperature is changing in a predetermined manner, generally at linear rate.
It is a precision balance for linear rise of temperature and known as thermobalance.
Result of thermobalance-Result of thermobalance are represented by plot of weight change v/s temp.ortime,which is known as TG curve.
Weight should plotted on Y-axis,andtemp.or time on X-axis,increasingfrom left to right.
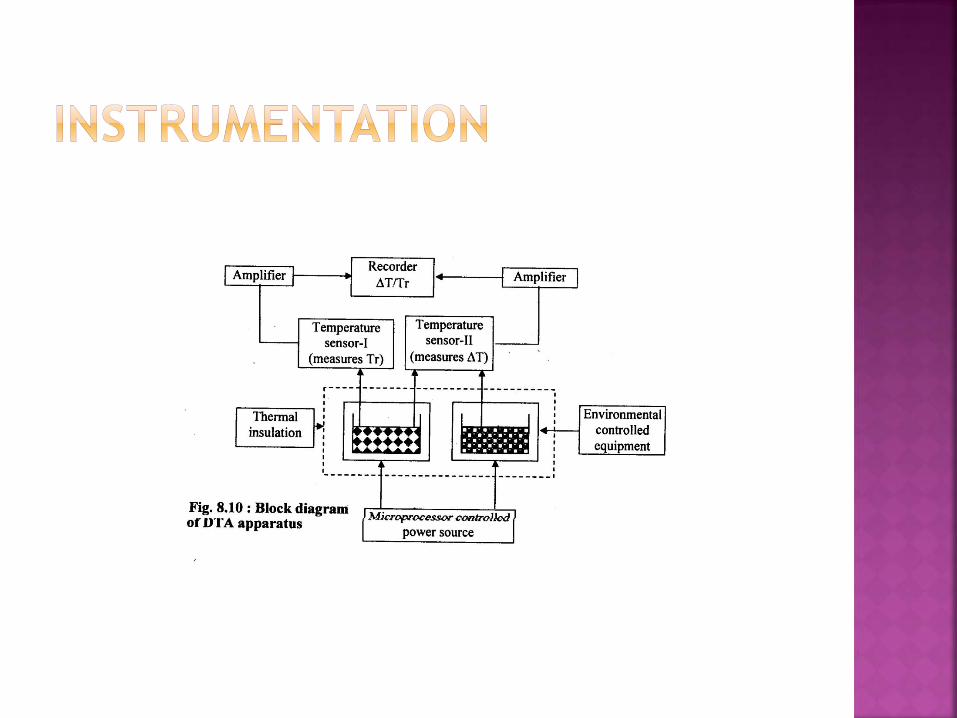
Principle: This technique involve the recording ofdifference in temperature between substance andreference material against time or temperature ,as thetwo specimens are subjected to identical temperaturechange in an enviroment heated or cooled at thecontrolled rate.Recording of result:DTA thermogram consist of record ofdifference in sample and reference temperature plottedas a function of Time,or sample temperature or referencetemperature or furnace temperature.
Information from DTA curve:1)There are exothermic and endothermic peaks and
shape and size of these peaks may furnish good information about the nature of test sample.
2)In most of the cases physical changes give endothermic while chemical changes gives exothermic peaks.
3)Generally sharp endothermic peaks gives good idea about crystallinity and fusion process,while broad endothermic peaks signify deh ydration reaction.
4) The DTA curve would be parallel to the temperature axis till the sample undergoes any physical or chemical change of state.
Applications in 1)Physical Chemistry
Generation of phase diagram and study of phase transitions
In determination of heat of reaction.
In specific heat determination.
In determination of thermal diffusitivity.
2)Analytical Chemistry
Identification of substance
Identification of products
Melting point and boiling determination and study of effect of pressure on it.
Quantitative analysis
Quality control
3)Inorganic Chemistry:To study thermal stability of inorganic compounds and complexes
4)Organic Chemistry
Qualitative analysis
For identification and purity determination for oils fats and pharmaceutical substances.
Principle:In this technique the heat energy is supplied at the varying rate to the sample or reference so as to keep their temperature equal and this heat energy is recorded as a function of temperature or time when both substance and reference material are heated or cooled at a predetermined rate.(approx.10degree celciusper minute)alternatively
It is a thermal method where energy necessary to establish zero temperature difference between substance and reference material is recorded as a function of time or temp., when both are heated or cooled at a predetermined rate.
1)The heat supplied to sample is given a “positive sign” while reference material is given a
“negetive sign”2)The DSC curve is a record of transition
temperature on x-axis and dH/dt on y-axis.3)The DSC thermogram is similar to DTA curve only
difference that dH/dt instead of ΔT(of DTA))The area under DSE peak is directly be related to
enthalpy change occuring.


1)Determination of enthalpy of transition.2)Determination of percentage crystallinity of
polymeric material.3)Determination of purity of drug samples of
drug phenacetin.