Embed Size (px)
Citation preview

Instrument Validation StudyREGARDING LEADERSHIP CIRCLE PROFILE™
By Industrial Psychology Department
Bowling Green State University

INSTRUMENT VALIDATION STUDY
©The Leadership Circle | All Rights Reserved2
EXECUTIVE SUMMARY AND RESPONSE TO THE RECOMMENDATIONSThe following validity study on The Leadership Circle Profile (The LCP) is an independent study. It was conducted by the Institute for Psychological Research and Application (IPRA), a consulting group within the Industrial Organizational Psychology Department at Bowling Green State University in Bowling Green, Ohio, USA. The results described in this study were derived completely independently and were not influenced or changed by The Leadership Circle.
The study made the following conclusion:
On the whole, Leadership Circle Profile is an internally consistent, valid measure for leadership development. The psychometric properties of Leadership Circle Profile are strong, suggesting that Leadership Circle Profile is appropriate and strong for developmental feedback. Since this measure is only meant for developmental purposes and not for selection, termination, promotion, or other high stakes decisions, the results of this independent investigation suggest that Leadership Circle Profile is quite acceptable for developmental purposes.
As with any thorough study (audit) of this type, the reviewers will find areas for improvement. They did so in this case. Suggestions were relatively minor and represent areas for continuous improvement to which The Leadership Circle is committed.
You will find a complete response to the recommended improvements in Appendix A.
We are very pleased with the outcome of this extensive validation study and thank the IPRA team for their fine work.

Technical Report For
THE LEADERSHIP CIRCLE PSYCHOMETRIC PROPERTIES AND VALIDATION
OF THE LEADERSHIP CIRCLE PROFILE
SEPTEMBER 2008
Team Members:
Dev Dalal, M.A. Bing Lin, B.A.
Erin N. Smith, B.S.
Faculty Sponsor:
Michael J. Zickar, Ph.D.
Institute for Psychological Research and Application
DEPARTMENT OF PSYCHOLOGY BOWLING GREEN STATE UNIVERSITY
1
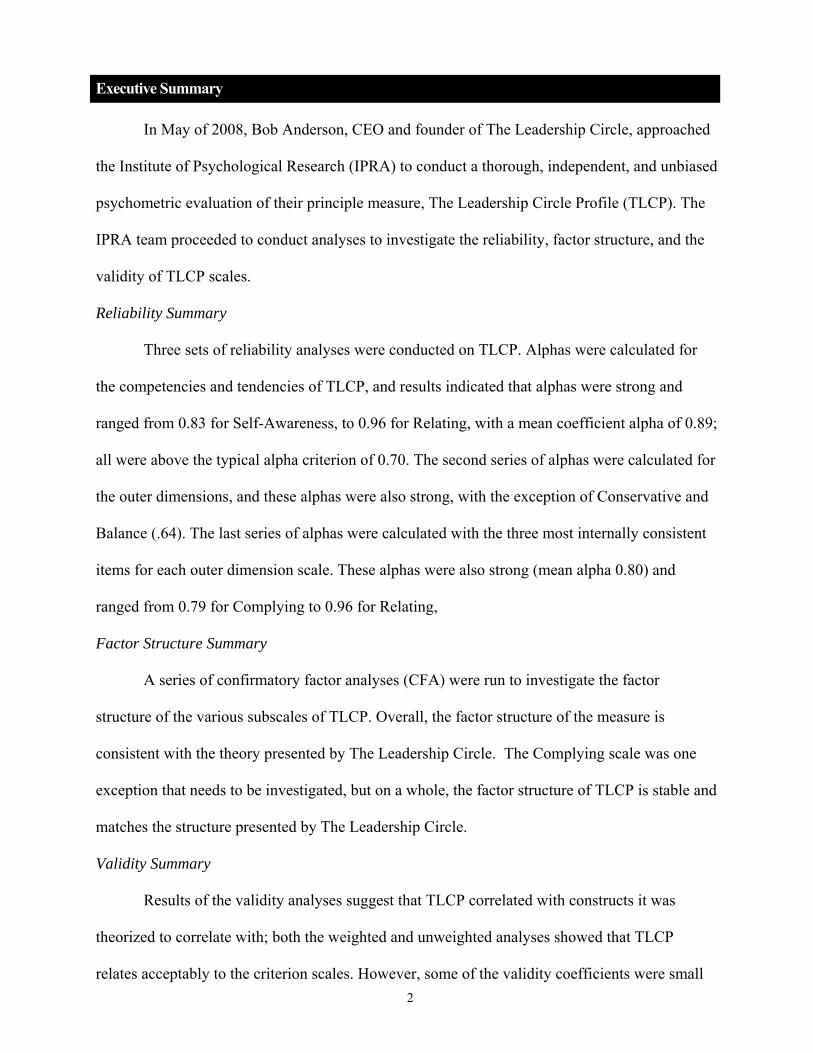
Executive Summary
In May of 2008, Bob Anderson, CEO and founder of The Leadership Circle, approached
the Institute of Psychological Research (IPRA) to conduct a thorough, independent, and unbiased
psychometric evaluation of their principle measure, The Leadership Circle Profile (TLCP). The
IPRA team proceeded to conduct analyses to investigate the reliability, factor structure, and the
validity of TLCP scales.
Reliability Summary
Three sets of reliability analyses were conducted on TLCP. Alphas were calculated for
the competencies and tendencies of TLCP, and results indicated that alphas were strong and
ranged from 0.83 for Self-Awareness, to 0.96 for Relating, with a mean coefficient alpha of 0.89;
all were above the typical alpha criterion of 0.70. The second series of alphas were calculated for
the outer dimensions, and these alphas were also strong, with the exception of Conservative and
Balance (.64). The last series of alphas were calculated with the three most internally consistent
items for each outer dimension scale. These alphas were also strong (mean alpha 0.80) and
ranged from 0.79 for Complying to 0.96 for Relating,
Factor Structure Summary
A series of confirmatory factor analyses (CFA) were run to investigate the factor
structure of the various subscales of TLCP. Overall, the factor structure of the measure is
consistent with the theory presented by The Leadership Circle. The Complying scale was one
exception that needs to be investigated, but on a whole, the factor structure of TLCP is stable and
matches the structure presented by The Leadership Circle.
Validity Summary
Results of the validity analyses suggest that TLCP correlated with constructs it was
theorized to correlate with; both the weighted and unweighted analyses showed that TLCP
relates acceptably to the criterion scales. However, some of the validity coefficients were small 2

even though they were statistically significant. The Creative half subscales all correlated
positively with the Leadership Effectiveness and Performance variables, whereas the Reactive
half subscales correlated negatively with these variables. These negative correlations were
expected based on the negative connotations of the subscales with respect to leadership ability.
Conclusions and Recommendations Summary
Results indicated that TLCP is highly internally consistent (coefficient alpha > 0.70),
with the exception of two outer dimension subscales. Based on these results, the IPRA team
recommends generating new items for the Balance and Conservative subscales. Furthermore, the
factor structure of TLCP matches the structure presented by The Leadership Circle. With the
exception of the Complying tendency, the structure of TLCP is supported. The IPRA team
recommends that The Leadership Circle examine the content of the outer dimension scale items
in the Complying tendency to confirm that the items are tapping the same constructs. Finally, the
validity analyses suggest that the measure is related to the criterion variables. Some of the
validity coefficients were quite small, suggesting that The Leadership Circle should make certain
that the item content on the competencies and tendencies (e.g. Complying and Controlling) are
tapping the desired leadership construct. Also, the criterion-related validity was established
based on measures for which the construct validity information was unavailable. The IPRA team
recommends that The Leadership Circle validate all measures before conclusively stating that
TLCP is valid. The psychometric properties of TLCP are strong, suggesting that TLCP is
appropriate and strong for developmental feedback. As this instrument is meant only for
developmental feedback purposes and not for selection, promotion, termination, or other high
stakes decisions, this instrument is quite strong and acceptable for providing developmental
feedback.
3
Background and Purpose of Study
The Leadership Circle is a growing leadership development company that offers various
leadership development tools to human resource and organizational development professionals
as well as consultants and leadership coaches across the world. In response to the growing
number of distributors requesting The Leadership Circle Profile (TLCP), Bob Anderson, CEO
and founder of The Leadership Circle, approached the Institute for Psychological Research and
Application (IPRA) to conduct an independent and unbiased analysis of the psychometric
properties and validity of TLCP to present to potential clients.
The objectives of this project were: (1) to conduct a thorough internal psychometric
evaluation of TLCP, examining the internal consistency of each subscale and the factor structure
using a Confirmatory Factor Analysis (CFA) approach; (2) to conduct a concurrent validation of
the measure; and (3) to create a technical report along with a one-page executive summary for
The Leadership Circle to present to clients.
In this report, we first provide an overview of the methods used to calculate internal
consistency statistics as well as the results of these calculations. Next, we describe the CFA
procedures used to test the hypothesized factor structure of TLCP as well as the results of this
analysis. This will be followed by the criterion-related validity of TLCP. Finally, we present
recommendations based on the whole body of results.
Overview of Internal Consistency Statistics
Internal consistency reliability is the degree to which different parts of a test or items in a
scale are correlated with each other; highly correlated items are therefore interpreted as
measuring the same construct. Split-half reliability is a type of internal consistency reliability
calculated by splitting the data and computing the correlation between scores on one half of the
data to the other. Cronbach’s alpha (also known as alpha or coefficient alpha) is the average of
4

the coefficients found by calculating the split-half reliability of all possible halves of the data,
and was used to determine the internal consistency reliability of each subscale.
Reliability coefficients range from 0.0, indicating no consistency among the items, to 1.0,
meaning the measures are completely consistent. An alpha of .70 or higher is typically
considered satisfactory because the squared correlation (r2) of a reliability coefficient less than
.70 would account for less than 50% of variance explained: .70 × .70 = .49 (Vogt, 2006).
In addition, statistical packages calculate all possible combinations of Cronbach’s alpha if
an item were deleted. Typically, alpha coefficients increase as the number of items in the scale
increases. However, if removing an item increases alpha, it is because responses to that item do
not correlate highly with the other items and may not be measuring the same construct of
interest. Therefore, we explained if there were any items that resulted in a diminished alpha.
Results of Internal Consistency Analysis
Overall, the reliabilities, as measured using coefficient alpha, for the competencies and
tendencies of TLCP were strong and ranged from 0.83 for Self-Awareness to 0.96 for Relating,
with a mean coefficient alpha of 0.89; all were above the typical alpha criterion of 0.70. Specific
alphas for each competency or tendency can be found in the second column in Table 1 in bold.
To further investigate the scales’ reliability we examined internal consistencies of each of the
outer dimensions scales of the competencies and tendencies. For example, coefficient alphas for
the outer dimension traits Integrity and Courageous Authenticity, which are scale components of
the competency Authenticity, were examined separately. Second, as requested by the client,
coefficient alphas for the “best three” items of each outer dimension trait were calculated based
strictly on internal consistency statistics, thereby standardizing the number of items in the each
scale, when possible.
Reliabilities of the outer dimension traits ranged from 0.64 (Conservative and Balance)
to 0.93 (Strategic Focus), with a mean coefficient alpha of 0.81. However, as mentioned 5
previously, alpha increases as the number of items increase. Upon examining the alphas for the
outer dimension traits Conservative and Balance, these scales were measured with only three and
two items respectively, compared to Strategic Focus, which was measured with nine items.
Therefore, the IPRA team recommends that more items be written for both the Conservative and
Balance outer dimension traits.
In addition, the IPRA team selected the “best” three items for each outer dimension trait
based on the statistic “alpha if item deleted.” That is, items with the highest “alpha if item
deleted” have the lowest correlation to other scale items, and were removed one at a time from
the scale until each outer dimension trait was measured with three items. Individual coefficient
alphas were calculated for these three-item outer dimension traits; because Balance only had two
items, no additional items were removed. Results indicate that overall competency and tendency
alphas composed of three-item outer dimension traits were still strong (mean alpha 0.80) and
ranged from 0.79 for Complying to 0.96 for Relating; all were above the typical alpha criterion
of 0.70.
Overview of Confirmatory Factor Analysis
Confirmatory Factor Analysis (CFA) is a procedure used to determine whether sets of
observed variables share common variance-covariance characteristics that define theoretical
constructs or latent variables (Schumacker & Lomax, 2004). In other words, CFA allows
researchers to test the extent to which a certain latent variable, or construct, influences a series of
observed variables. When using CFA to test theoretical models of latent constructs, typically the
construct being measured (i.e. the hypothetical construct, Personal Learner) assumes the role of
the latent variable while the corresponding items assume the role of the observed variables (i.e.
“I learn from mistakes,” “I investigate the deeper reality that lies behind events/circumstances,”
“I examine the assumptions that lay behind my actions,” “I personally search for meaning”).
Figure 1 is an example of the basic CFA model described above. CFA parameter estimates also 6

allow one to estimate the extent to which a latent factor influence changes in indicators
(indicated by the unidirectional arrows pointing from Personal Learner to the individual items in
Figure 1, and known as Factor Loadings).
Another useful feature of CFA is the ability to allow researchers to test hierarchical
models, or models that include not only indicator variables and latent variables, but also second-
order latent variables. In other words, it is possible to not only test the extent to which latent
variables influence a series of items, but it is also possible to test whether these latent variables
load onto a second higher-order factor. This is particularly useful in the present context because
TLCP assumes that individual items load onto a specific outer dimension traits (e.g., Distance,
Critical, Arrogance), and these specific traits are then combined to comprise higher-order
competencies and tendencies (e.g. Protecting). Figure 2 is an illustration of the described
hierarchical CFA model.
To analyze the factor structure of TLCP, two sets of hierarchical CFAs were performed.
The goal of the first set of CFAs was to analyze the extent to which competencies/tendencies,
such as Authenticity, influenced its respective outer dimension traits, such as Courageous
Authenticity and Integrity, and the extent to which these outer dimension traits influenced
responses to individual items. As requested by the client, the second set of hierarchical CFAs
examined the extent to which the outer dimension traits loaded onto their respective
competencies/tendencies and the extent to which the competencies/tendencies then loaded onto a
higher-order factor pertaining to their respective halves, Creative leadership and Reactive
tendencies.
For the second set of analyses, item scores were combined within their respective outer
dimension traits. These composite scores assumed the role of indicator variables in the CFA, thus
yielding a second-order hierarchical CFA model. Moreover, only self-report data was used to
conduct the CFAs due to the statistical requirement that observations be independent.
7

Results of Confirmatory Factor Analysis
Two sets of CFAs were run on the “self” data. Due to fluctuations in missing data,
sample sizes for these analyses ranged from 639 to 7543 people. Nevertheless, the sample sizes
never dropped below the suggested ratio of 10 respondents per 1 free parameter estimated or the
more stringent 20 to 1 ratio (e.g. Kline, 2005); these large sample sizes assure the stability of
parameter estimates.
To assess the fit of the model, four fit indices were used in addition to the goodness-of-fit
χ2. The goodness of fit index (GFI) and the root mean square error of approximation (RMSEA)
are absolute fit indices and represent how closely the hypothesized models’ estimate of the
variance-covariance structure matches the one produced by the data. The comparative fit index
(CFI) and the non-normed fit index (NNFI) are relative fit indices and represents how well the
hypothesized model fit the data over a model that assumes all relationships are due to sampling
error. RMSEA values that are less than .05 represent close/excellent fit while values between .05
and .08 represent good fitting models; values above .08 are considered poor fitting models. CFI,
NNFI, and GFI values greater than or equal to .95 are considered excellent fitting models while
values above .90 are considered good fitting models.
As was stated above, the first set of CFAs tested the extent to which
competencies/tendencies influenced their respective outer dimension traits which then influenced
responses to the scale items (see Figure 2). Eight of these models were run and 6 ran without any
errors. According to the fit indices used, these models represented good fit to the data (See table
2). Non-positive definite matrices errors caused problems in the Authenticity and Complying
scales. Non-positive definite matrices can result from many reasons, such as typographical errors
or multicollinearity. In this case, these errors resulted from negative error variance estimates.
This problem was remedied by constraining these parameters in the model; the models ran
without errors after these corrections. The Authenticity scale had negative error variance in the 8
Integrity factor; this was corrected by assuming that 30% of the variance in the integrity factor
was error. Since 1-rxx, where rxx is the reliability coefficient of a measure, is an estimate of the
proportion of observed variance due to random error but does not account for measurement error,
it is an underestimate of error in a latent factor. The reliability of the Integrity scale was
estimated to be .83; therefore, estimating 30% error variance is a conservative estimate to
account for measurement error. Even with this conservative estimate, the model fit the
Authenticity scale well. A similar problem arose in the Complying factor because the Belonging
subscale had negative error variance. Again, 30% of the variance in the Belonging subscale was
assumed to be error, which is also a conservative estimate, to account for measurement and
random error, given the reliability of the scale was .79. Unfortunately, the data did not fit this
model well suggesting that this scale may need to be revised. The large amount of error variance
in the items may be responsible for the poor fit as the subscales load, at a significant level, onto
the Complying factor; however, the amount of error in the items and the first order terms may be
responsible for the poor fit.
The second set of models investigated the factor structure of the two halves of the
Leadership Circle Profile. For these models, the Reactive or Creative factors influenced the
competencies/tendencies which influenced scale scores on the outer dimension traits. The first
run of these models were hampered by non-positive definite matrices due to negative error
variances. For the Creative half, the Authenticity factor had negative error variance; like the
other models, this was corrected by setting the parameter equal to 30% error variance. Since the
reliability of the scale is .81, this estimate accounted for both types of errors described above.
For the Reactive half, the Belonging factor and the Controlling factors had negative error
variance. Again, 30% of the variances in these scales was set as error; both of these estimates
account for both forms of error given reliabilities for these scales are .79 and .88, respectively.
Unfortunately, the data did not fit either of these models well (see table 2); however, this is to be
9

expected for various reasons. First, the Creative and Reactive halves are multidimensional and
forcing a single latent factor for the multidimensionality will result in poor fit. However, the
loadings of the competencies/tendencies onto the halves are what were of interest. Furthermore,
as Kline (2005) and Van Prooijen and Van Der Kloot (2001) observed, confirming results
derived from exploratory analyses via CFA usually results in attenuated fit. Finally, fit can
further suffer as the levels of the CFA become more global (i.e. moving from analyzing
individual items to analyzing scale scores). With these analyses, the level of abstraction has
increased to a point where fit results are nearly assured to be poor. As was stated earlier, the
loadings of what were of interest and the results did indicate that the subscales loaded on the
appropriate factors at a significant level, suggesting that the structure of the model derived from
exploratory analyses is appropriate.
Overall, the results of the CFA analyses suggest that TLCP factor structure is consistent
with items loading appropriately onto outer dimension traits and outer dimension traits loading
on to the appropriate competencies/tendencies. Finally, the competencies and tendencies all
loaded appropriately onto the halves of TLCP. Despite the poor fitting models and the exception
of the Complying tendency, the patterns of loadings suggest that the hypothesized factor
structure is reasonable. The results of the CFA analyses coupled with the reliability estimates
suggest that the measurement properties of TLCP scales are reasonably strong.
Overview/Results of Criterion-Related Validity
The criterion-related validity of TLCP was also assessed by the team. Whereas reliability
refers to the consistency of a measure, validity refers to the accuracy of a measure. That is,
validity measures assess to what degree a scale taps the intended construct (Vogt, 2006).
Criterion-related validity is a form of internal validity that assesses to what extent a measure is
related to measures of the same or similar construct. Two measures of leadership were used to
validate TLCP; the first is Leadership Effectiveness as measured by a scale created by The 10

Leadership Circle, and the second is a Performance measure computed by The Leadership
Circle. Measures on TLCP should correlate with each of these measures. However, as Bob
Anderson cautioned, self-report data has been shown to bias criterion-related validity coefficients
by inflating the statistical relationship between two variables. For this reason, correlations
between TLCP and criterion measures of leadership were only calculated with data from the
following respondents: Second Level Supervisor, First Level Supervisor, Direct Report, Peer,
and Other.
One preliminary note about the criterion-related validity results warrants discussion.
First, the large sample size, ranging from N = 15,145 to N = 86,298, will influence the statistical
significance of the correlations. That is, given the large sample size, a correlation that is
practically insignificant (e.g. r = .02) will be statistically significant (e.g. p < .001). Given this
fact, all the correlations for these analyses are significant at the p < .001 level. As a result, the
discussion of the validity coefficients will not focus on p-values, but on the percent of shared
variance. Percent of variance shared (r2 x 100 = percent variance shared) indexes how much two
variables are related. This measure is more informative then a p-value based on such a large
sample size.
Results indicated that Leadership Effectiveness is significantly and positively correlated
with the five Creative tendencies (e.g., Relating, Self-Awareness, Authenticity, Systems
Awareness, and Achieving), with validity coefficients ranging from r = .77 (60% variance
shared) to r = .89 (79% variance shared; see table 3). Correlations between leadership
effectiveness and Reactive tendencies (e.g., Controlling, Protecting, and Complying), were
statistically significant and negative as expected, ranging from r = -.14 (2% variance shared) to
r = -.59 (35% variance shared; see table 3). The criterion-related validity of leadership
effectiveness and TLCP is also significant when weighted measurements of the eight tendencies
11

are used, maintaining the same statistical significance and direction. Validity coefficients did
increase with the use of the weighted scores (See table 4).
The Performance criterion measure is also significantly related to all eight TLCP
competencies and tendencies, and in the same pattern as the leadership effectiveness measure:
positively related to the five Creative tendencies with a range of r = .44 (19% variance shared) to
r = .54 (29% variance shared; see table 3), and negatively related to the three Reactive tendencies
with a range of r = -.03 (0.1% variance shared) to r = -.28 (6% variance shared; see table 3).
Again, weighted measurements of TLCP tendencies share the same statistical strength and
direction of criterion-related validity coefficients with the performance measure and were larger
in magnitude like the Leadership Effectiveness Scale (Table 4).
Conclusions and Recommendations
Reliability
Results of the internal consistency analyses revealed that alphas for competencies and
tendencies of TLCP were high, in general, with a mean coefficient alpha of 0.89, indicating
strong internal consistency. Coefficient alphas of the outer dimension traits were also
consistently strong, with a mean coefficient alpha of 0.81, with the exception of Conservative
and Balance (0.64). Alphas of competencies and tendencies also remained high after shortening
each of the outer dimension traits to three items each (mean coefficient alpha of 0.80).
Based on these results, the IPRA team recommends that additional items be generated for
the two-item outer dimension trait Balance in order to improve the alpha statistic of the scale. In
addition, the IPRA team recommends that items for the Conservative scale be scrutinized, and
additional items be added to the scale.
Confirmatory Factor Analysis
The results of the CFA analyses suggest that, in general, the factor structure hypothesized
by The Leadership Circle was confirmed. Items on TLCP load onto the appropriate outer 12

dimension traits and the outer dimension traits load appropriately onto the competencies and
tendencies. The parameter estimates of the CFA analyses are stable given the large sample size.
The structure of the Complying scale did not fit the data well; while the reliability of the scale
may be adequate, the items of this tendency’s outer dimension scale may not be tapping the same
construct. The IPRA team suggests that The Leadership Circle review the content of the items on
this scale to verify that the items appear to be tapping the same construct.
Criterion-Related Validity
Overall, the validity analyses suggest that TLCP is a fairly valid instrument. The Creative
competencies/tendencies all relate positively to leadership effectiveness and performance.
Furthermore, the Reactive competencies/tendencies relate negatively to these variables. Since
these subscales are negative traits for leaders (e.g. Controlling) it is appropriate that these
measures relate negatively to the effectiveness and performance of leaders. When the weighted
measurements were use, validity coefficients mirrored the unweighted analyses while increasing
in magnitude.
Two issues do arise however. First, some of the validity coefficients, while statistically
significant, are not impressive in magnitude. It would be desirable, therefore, for larger validity
coefficients on the Reactive half scales. Like was suggested above, this could be done by
assuring the item content of these scales are related to the leadership construct and that these
items are all appropriately related. Finally, TLCP was validated against measures whose own
validity was unverified. A criterion measure should itself be valid when deciding whether a
similar measure is valid (Vogt, 2006). Even though the weighted measurement validity
coefficients were stronger, these results suffer from the limitation that the validity of the criterion
scales is still unknown. Therefore, the IPRA team suggests that The Leadership Circle revalidate
TLCP after assessing the validity of the Performance and Leadership Effectiveness measures.
13

14
On the whole, TLCP is an internally consistent, valid measure for leadership
development. The psychometric properties of TLCP are strong, suggesting that TLCP is
appropriate and strong for developmental feedback. Since this measure is only meant for
developmental purposes and not for selection, termination, promotion, or other high stakes
decisions, the results of this independent investigation suggest that TLCP is quite acceptable for
developmental purposes.

Table 1 – Reliabilities,
Coefficient Alpha
Items that Increase Alpha
if Deleted
SELF DATA
Coefficient Alpha
SELF DATA
Items that
Increase Alpha if Deleted
OTHER DATA
Coefficient Alpha
OTHER DATA
Items that
Increase Alpha if Deleted
Best Three Item Alphas
SELF DATA
Best Three Item Alphas
OTHER DATA
Best Three Item Alphas
Relating
.96
.90
.96
Scale
Alpha = .96
Scale
Alpha = .89
Scale
Alpha = .96
Caring connection (3) .86 .78 .87 .86 .78 .87 Fosters team play (3) .85 .72 .86 .85 .72 .86 Collaborator (3) .86 .74 .87 .86 .74 .87 Mentoring & developing (4) .88 .80 .88 .87 .78 .87 Interpersonal intelligence (5) .83 .70 .83 .81 .61 .82
Self-Awareness .83
.75
.86
Scale
Alpha = .88
Scale
Alpha = .76
Scale
Alpha = .89
Selfless leader (5) .73 .65 .75 .78 .65 .79 Balance (2) .64 .61 .64 .64 .61 .64 Composure (3) .83 .65 .84 .83 .65 .84 Personal Learner (4) .77 .60 .78 .75 .55 .77
Authenticity
.84
.77
.84
Scale
Alpha = .84
Scale
Alpha = .77
Scale
Alpha = .84
Integrity (3) .83 .78 .83 .83 .78 .83 Courageous Authenticity (3) .81 .78 .82 .81 .78 .82
Systems Awareness
.91
.83
.91
Scale
Alpha = .90
Scale
Alpha = .81
Scale
Alpha = .81
Community Concern (5) .83 .76 .83 .81 .70 .82 Sustainable Productivity (3) .78 .66 .79 .78 .66 .79 Systems Thinker (3) .76 .67 SYSys478
(.69) .77 .76 .67 .77
15

16
Coefficient Alpha
Items that Increase Alpha
if Deleted
SELF DATA
Coefficient Alpha
SELF DATA
Items that
Increase Alpha if Deleted
OTHER DATA
Coefficient Alpha
OTHER DATA
Items that
Increase Alpha if Deleted
Best Three Item Alphas
SELF DATA
Best Three Item Alphas
OTHER DATA
Best Three Item Alphas
Achieving
.95
.93
.97
Scale
Alpha = .94
Scale
Alpha = .90
Scale
Alpha = .89
Achieves Results (4) .85 .74 .85 .82 .71 .83 Decisiveness (3) .84 .75 .85 .84 .75 .85 Purposeful & Visionary (6) .92 .84 .92 .89 .81 .89 Strategic Focus (9) .93 .86 .93 .87 .76 .88
Controlling
.88
.89
.90
Scale
Alpha = .85
Scale
Alpha = .85
Scale
Alpha = .86
Ambition (4) .72 .69 .72 .71 .69 .71 Autocratic (5) .89 .79 .89 .85 .75 .86 Driven (4) .81 CTDri804
(.84) .83 CTDri804
(.84) .80 CTDri804
(.84) .84 .84 .84
Perfect (7) .80 .81 .80 .81 .81 .81
Protecting
.92
.86
.91
Scale Alpha = .91
Scale Alpha = .86
Scale Alpha = .92
Distance (4) .87 .81 .87 .85 .79 .86 Critical (4) .82 .73 .82 .81 .71 .81 Arrogance (3) .88 .81 .89 .88 .81 .89
Complying
.86
.86
.86
Scale Alpha = .79
Scale Alpha = .86
Scale Alpha = .86
Conservative (3) .64 .67 .63 .64 .67 .63 Pleasing (4) .82 .84 .81 .81 .83 .81 Belonging (6) .79 .76 .79 .71 .70 .71 Passive (4) .74 .71 .74 .73 .68 .73
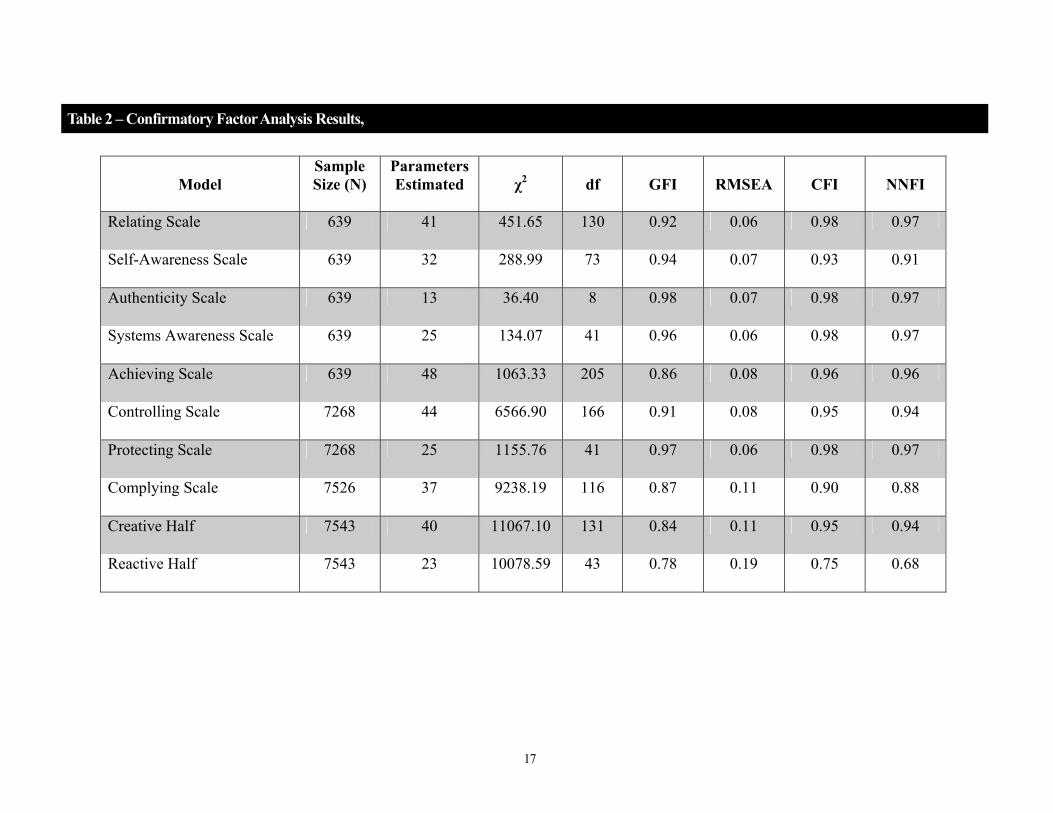
Table 2 – Confirmatory Factor Analysis Results,
Model
Sample Size (N)
Parameters Estimated
χ2
df
GFI
RMSEA
CFI
NNFI
Relating Scale 639 41 451.65 130 0.92 0.06 0.98 0.97
Self-Awareness Scale 639 32 288.99 73 0.94 0.07 0.93 0.91
Authenticity Scale 639 13 36.40 8 0.98 0.07 0.98 0.97
Systems Awareness Scale 639 25 134.07 41 0.96 0.06 0.98 0.97
Achieving Scale 639 48 1063.33 205 0.86 0.08 0.96 0.96
Controlling Scale 7268 44 6566.90 166 0.91 0.08 0.95 0.94
Protecting Scale 7268 25 1155.76 41 0.97 0.06 0.98 0.97
Complying Scale 7526 37 9238.19 116 0.87 0.11 0.90 0.88
Creative Half 7543 40 11067.10 131 0.84 0.11 0.95 0.94
Reactive Half 7543 23 10078.59 43 0.78 0.19 0.75 0.68
17

Table 3 – Unweighted Criterion-Related Validity Results,
Scale
Correlation with Performance Criteria
Percent (%) of Shared
Variance with Performance Criteria
Correlation with
Leadership Effectiveness Criteria
Percent (%) of Shared Variance with
Leadership Effectiveness Criteria
Relating 0.46 21.16 0.86 73.96
Self-Awareness 0.44 19.36 0.81 65.61
Authenticity 0.45 20.25 0.77 59.29
Systems Awareness 0.50 25.00 0.80 64.00
Achieving 0.54 29.16 0.89 79.21
Creative 0.52 27.04 0.91 82.81
Controlling -0.03 0.09 -0.14 1.96
Protecting -0.28 7.84 -0.59 34.81
Complying -0.27 7.29 -0.42 17.64
Reactive -0.24 5.76 -0.50 25.00
18

19
Table 4 – Weighted Criterion-Related Validity Results,
Scale
Correlation with Performance Criteria
Percent (%) of Shared
Variance with Performance Criteria
Correlation with
Leadership Effectiveness Criteria
Percent (%) of Shared Variance with
Leadership Effectiveness Criteria
Relating 0.47 22.09 0.87 75.69
Self-Awareness 0.44 19.36 0.84 70.56
Authenticity 0.44 19.36 0.77 59.29
Systems Awareness 0.50 25.00 0.81 65.61
Achieving 0.54 29.16 0.89 79.21
Creative 0.51 26.01 0.90 81.00
Controlling -0.20 4.00 -0.44 19.36
Protecting -0.30 9.00 -0.61 37.21
Complying -0.36 12.96 -0.59 34.81
Reactive -0.33 10.89 -0.63 39.69

Figure 1
Personal Learner
SEPer694 SEPer695 SEPer696 SEPer440
E440 E440 E440 E440
20

Figure 2
Critical
prcri719 prcri720 prcri721 prcri722
E719 E720 E721 E722
Distance
prdis717 prdis718 prdis819 prdis820
E717 E718 E819 E820
Arrogance
prarr715 prarr716 prarr823
E715 E716
Protecting
E823
21

References
Kline, R.B. (2004). Measurement Models and CFA. In R.B. Kline, Principles and Practice of
Structural Equation Modeling: Second Edition. New York: Guilford Press.
Schumacker, R.E., & Lomax, R.G. (2004). Confirmatory factor models. In R.E. Schumacker &
R.G. Lomax, A beginner’s guide to Structural Equation Modeling: Second Edition.
Mahwah, New Jersey: Lawrence Erlbaum.
Van Prooijen, J-W & Van Der Kloot, W. A. (2001). Confirmatory analysis of exploratively
obtained factor structures. Educational and Psychological Measurement, 61, 777-792.
Vogt, P.W. (2006). Quantitative Research Methods for Professionals in Education and Other
Fields. New York: Allyn & Bacon.
22

Principal Team Members
Michael J. Zickar, Ph.D. (Faculty Sponsor) Michael J. Zickar received his Ph.D. (1997) in industrial-organizational (I-O) psychology from the University of Illinois at Urbana-Champaign. He is an associate professor of psychology and chair of the department of Psychology at Bowling Green State University. His research interests include application of psychometric analysis to organizational issues and development of psychological tests. His research has been published in leading scientific journals such as Journal of Applied Psychology, Personnel Psychology, and Applied Psychological Measurement. Dev Dalal, M.A. Dev Dalal received his Masters’ degree in Applied Social Psychology from Loyola University, Chicago, and is in his second year of doctoral study in the I-O Psychology program at BGSU. His research interests include selection-related issues including personality assessment, and scientific selection. He is also interested in decision making and the application psychometrics to Organizational issues. His research has been accepted at conferences, such as Society for Judgment and Decision Making (2008) – Chicago. Bing Lin, B.A. Bing is currently in his third year of doctoral study in Industrial-Organizational Psychology at Bowling Green State University. His research interests include the application of psychometric techniques to organizations seeking globalization, and general occupational health psychology issues such as stress, recovery, and incivility. His research has been presented in conferences such as Industrial Organizational and Organizational Behavior – Indianapolis (2007), Academy of Management – Philadelphia (2007), and Society for Industrial-Organizational Psychologists – San Francisco (2008). Erin N. Smith, B.S. Erin N. Smith is in her third year of doctoral study in Industrial-Organizational Psychology at Bowling Green State University. Her research interests include occupational health and worker well-being, work-family conflict, and maximizing effectiveness in attaining work and personal goals. Her research has been presented in conferences such as Industrial Organizational and Organizational Behavior – Indianapolis (2007) and Academy of Management – Philadelphia (2007).
23

INSTRUMENT VALIDATION STUDY
©The Leadership Circle | All Rights Reserved3
ATTACHMENT AEXECUTIVE SUMMARY AND RESPONSE TO THE RECOMMENDATIONS
The preceding validity study on The Leadership Circle Profile (The LCP) is an independent study. It was conducted by the Institute for Psychological Research and Application (IPRA), a consulting group within the Industrial Organizational Psychology Department at Bowling Green State University in Bowling Green, Ohio, USA. The results described in this study were derived completely independently and were not influenced or changed by The Leadership Circle.
The study made the following conclusion:
On the whole, Leadership Circle Profile is an internally consistent, valid measure for leadership development. The psychometric properties of Leadership Circle Profile are strong, suggesting that Leadership Circle Profile is appropriate and strong for developmental feedback. Since this measure is only meant for developmental purposes and not for selection, termination, promotion, or other high stakes decisions, the results of this independent investigation suggest that Leadership Circle Profile is quite acceptable for developmental purposes.
As with any thorough study (audit) of this type, the reviewers will find areas for improvement. They did so in this case. The suggested improvements were threefold:
1. Reliability. Coefficient alphas of the outer dimension traits were also consistentlystrong, with a mean coefficient alpha of 0.81, with the exception of Conservativeand Balance (0.64).
Based on these results, the IPRA team recommends that additional items be generated for the two-item outer dimension trait Balance in order to improve the alpha statistic of the scale. In addition, the IPRA team recommends that items for the Conservative scale be scrutinized, and additional items be added to the scale.
2. Confirmatory Factor Analysis. The structure of the Complying scale did not fit the data well; while the reliability of the scale may be adequate, the items of thistendency’s outer dimension scale may not be tapping the same construct. The IPRA team suggests that The Leadership Circle review the content of the itemson this scale to verify that the items appear to be tapping the same construct.
3. Criterion Validity. Some of the validity coefficients were quite small, suggesting that The Leadership Circle should make certain that the item content on the competencies and tendencies (e.g. Complying and Controlling) are tapping the desired leadership construct. Also, the criterion-related validity was established based on measures for which the construct validity information was unavailable.

INSTRUMENT VALIDATION STUDY
©The Leadership Circle | All Rights Reserved4
The IPRA team recommends that The Leadership Circle validate all measures before conclusively stating that The Leadership Circle Profile is valid.
THE LEADERSHIP CIRCLE’S RESPONSE TO THE SUGGESTIONS FOR IMPROVEMENT:
1. Reliability. The Leadership Circle is taking measures to improve the alpha coefficients for both the Balance and the Conservative Scale this is being remedied by simply adding an item to the scales. Because The Leadership Circle is measuring so many dimensions, scales need to contain as few items as necessary. Balance only has two items and it is common for scales with so few items to get lower alpha coefficients. Conservative has only three items. While the addition of an item to each scale will improve the alpha coefficients to a more acceptable level we do not expect this to materially add to the already solid psychometric properties of The Leadership Circle Profile.
2. Confirmatory Factor Analysis. Extensive analysis has been completed on the confirmatory factor structure of Complying. It was found that one item was cross-loading between Conservative and Belonging. This is not seen as a significant issue as Conservative and Belonging share a common theoretical basis and, therefore, a component of variance that is theoretically expected. Other instruments do not distinguish between the tendency to be Conservative - overly procedural and “by the book” - and to Belonging, the need to be accepted. The Leadership Circle Profile has pulled these two elements apart and expects (theoretically) for there to be a cross component of variance. We expect that those who score high on Belonging will also have a marked tendency to play it safe and procedural (Conservative). And we expect that those who are overly Conservative may well do so out of a high Belonging need which expresses itself through cautious, “by the book” management. Because we expect these interactions between dimensions within Complying, and because we actually designed this into the assessment, we have no plans to modify the assessment to ameliorate this expected and minor recommendation.
3. Criterion Validity. This study’s concern with some low correlation coefficients between Reactive measures and the Leadership Effectiveness measure (-.14 for Controlling) is computed using un-weighted scales. The correlation coefficient for the weighted Controlling scale is -.44 which is in the expected direction and of acceptable strength. Controlling is made up of four subscales. The Leadership Circle does not theoretically expect all of these scales to be strongly inverse to Leadership Effectiveness (or other Instrument Validation Study Creative Competency dimensions in the top half of the circle, for that matter). Therefore, to arrive at the level of the overall Controlling tendency in a leader, The Leadership Circle uses a weighted average of the underlying subscales. The Leadership Circle norms its reports off weighted scores, therefore, the relevant
INSTRUMENT VALIDATION STUDY
©The Leadership Circle | All Rights Reserved5
correlation coefficients for criterion research are the weighted scores. These correlation coefficients are solid and in the expected direction.
The Reactive correlations to business performance criterion are expected to be lower than those to Leadership Effectiveness for two reasons. First, business performance is influenced by many variables of which leadership is but one. Therefore it is expected that more moderate coefficients would result. Second, the primary focus within The Leadership Circle model is on the relationship between the Creative Competencies and business performance. Reactivity is not held as problem, rather as a strength when used in the right situation. When overused, it mitigates Creative competencies, which in turn, works against business performance. Therefore, we expect solid and positive correlations between business performance and the Creative Competencies and lower correlations between Reactive dimensions and business performance. This is exactly what is upheld by the correlation analysis.
Finally, the study commented on the fact that the criterion variables used were, in themselves, un-validated. The Leadership Circle continues to conduct criterion validity research. In so doing, we are adding to the strength of the criterion validity. The Leadership Circle Profile was recently correlated to the MAP Assessment, a measure of stage of adult development developed by Susan Cook-Greuter and Bill Torbert. The Leadership Circle Profile was found to be very highly correlated to this measure. We accept the need to further validate the assessment against outcome criteria and until we do so, we accept the conclusion of the IPRA researchers that:
On the whole, The Leadership Circle Profile is an internally consistent, valid measure for leadership development. The psychometric properties of The Leadership Circle are strong, suggesting that The Leadership Circle Profile is appropriate and strong for developmental feedback. Since this measure is onlymeant for developmental purposes and not for selection, termination, promotion, or other high stakes decisions, the results of this independent investigation suggest that The Leadership Circle is quite acceptable for developmental purposes.
The Leadership Circle thanks IPRA for its fine work on this validity study and we are very pleased with the outcome.